Pew Research Center

FOR RELEASE FEBRUARY 12, 2025

5 Years Later: America Looks Back at the Impact of COVID-19

Most Americans say the pandemic drove the country apart

BY Alec Tyson, Michael Lipka and Claudia Deane

FOR MEDIA OR OTHER INQUIRIES:

Communications Department
202.419.4372
www.pewresearch.org

RECOMMENDED CITATION

Pew Research Center, February 2025, "5 Years Later: America Looks Back at the Impact of COVID-19"

About Pew Research Center

Pew Research Center is a nonpartisan, nonadvocacy fact tank that informs the public about the issues, attitudes and trends shaping the world. It does not take policy positions. The Center conducts public opinion polling, demographic research, computational social science research and other data-driven research. It studies politics and policy; news habits and media; the internet and technology; religion; race and ethnicity; international affairs; social, demographic and economic trends; science; research methodology and data science; and immigration and migration. Pew Research Center is a subsidiary of The Pew Charitable Trusts, its primary funder.

© Pew Research Center 2026

Table of contents

  • About Pew Research Center
  • 5 Years Later: America Looks Back at the Impact of COVID-19
  • 1. Americans’ views on COVID-19 risk and the country’s response to health emergencies
  • 2. How COVID-19 changed U.S. workplaces
  • 3. How the COVID-19 pandemic affected U.S. religious life
  • 4. How COVID-19 impacted Americans’ relationship with technology
  • Appendix
  • Acknowledgments
  • Methodology

5 Years Later: America Looks Back at the Impact of COVID-19

Most Americans say the pandemic drove the country apart

How we did this

Pew Research Center conducted this study to better understand how Americans were impacted by the COVID-19 pandemic. Most data on Americans’ current views and experiences is from a survey of 9,593 U.S. adults conducted Oct. 21-27, 2024. Data on experiences in the workplace is from a separate survey of 5,273 U.S. workers conducted Oct. 7-13, 2024.

Everyone who completed these surveys is a member of the Center’s American Trends Panel (ATP), a group of people recruited through national, random sampling of residential addresses who have agreed to take surveys regularly. This kind of recruitment gives nearly all U.S. adults a chance of selection. Surveys were conducted either online or by telephone with a live interviewer. The surveys are weighted to be representative of the U.S. adult population by gender, race, ethnicity, partisan affiliation, education and other factors. Read more about the ATP’s methodology.

Here are the questions from the late October survey used for this report, the topline and the survey methodology. Here are the topline and survey methodology for questions from the Oct 7-13 workers survey.

We supplemented our recent ATP survey data with previous Pew Research Center findings to explore how views and experiences changed during and after the pandemic. Links to these earlier surveys – including their toplines and methodologies – can be found throughout this report.

The most significant pandemic of our lifetime arrived as the United States was experiencing three major societal trends: a growing divide between partisans of the left and right, decreasing trust in many institutions, and a massive splintering of the information environment.
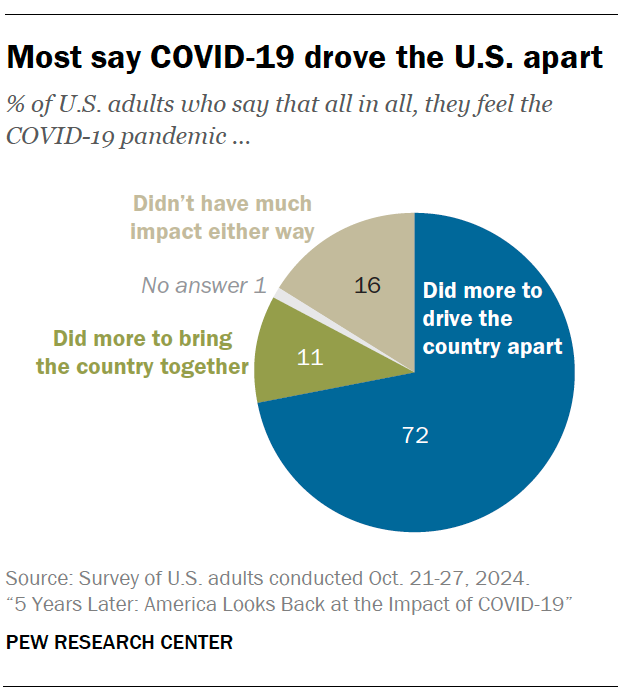
COVID-19 did not cause any of this, but these forces fueled the country’s divided response. Looking back, nearly three-quarters of U.S. adults (72%) say the pandemic did more to drive the country apart than to bring it together.

Fundamental differences arose between Americans over what we expect from our government, how much tolerance we have for health risks, and which groups and sectors to prioritize in a pandemic. Many of these divides continue to play out in the nation’s politics today.
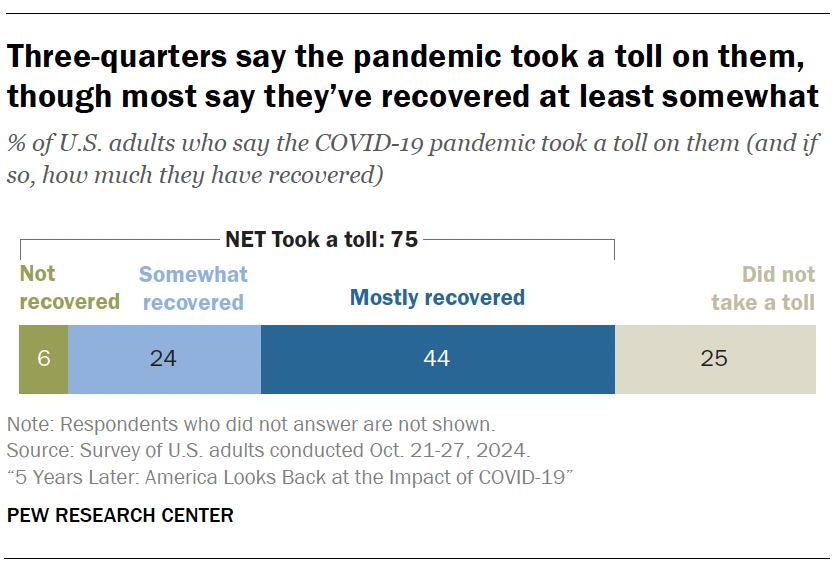
The pandemic left few aspects of daily life in America untouched. Looking back on it nearly five years later, three-quarters of Americans say the COVID-19 pandemic took some sort of toll on their own lives. This includes 27% who say it had a major toll on them and 47% who say it took a minor toll.

The virus itself also had a staggering impact. A large majority of U.S. adults have had COVID-19 at some point, and more than 1 million Americans died from it. Millions continue to struggle with long COVID. And most say they know someone who was hospitalized or died from the virus.

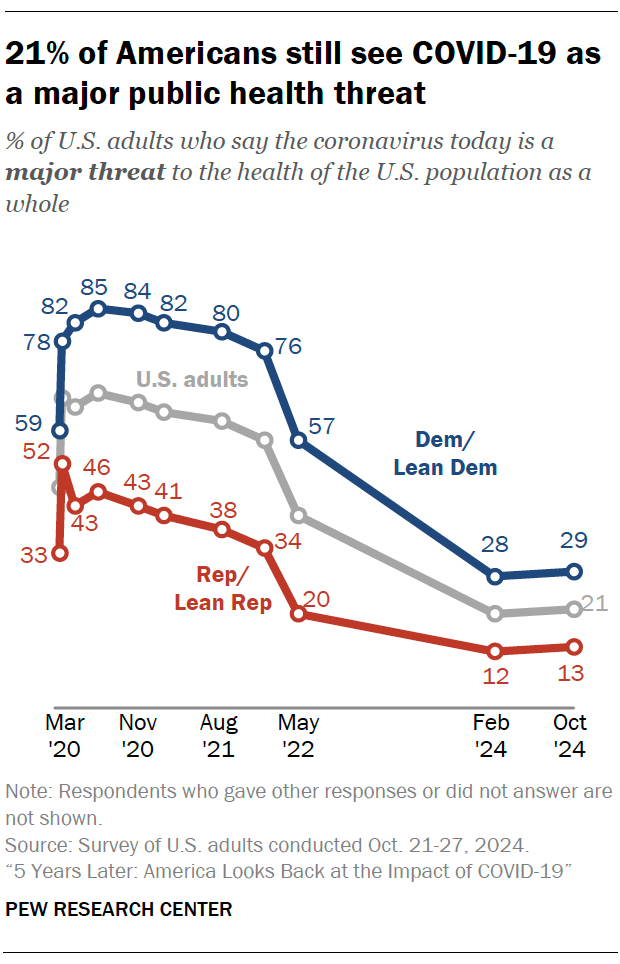
But most Americans have moved on. The vast majority of those who say their lives were impacted report having recovered at least somewhat. Among U.S. adults overall, about one-in-five (21%) now say the coronavirus is a major threat to the health of the U.S. population as a whole. And a majority (56%) think it’s no longer something we really need to worry about much.

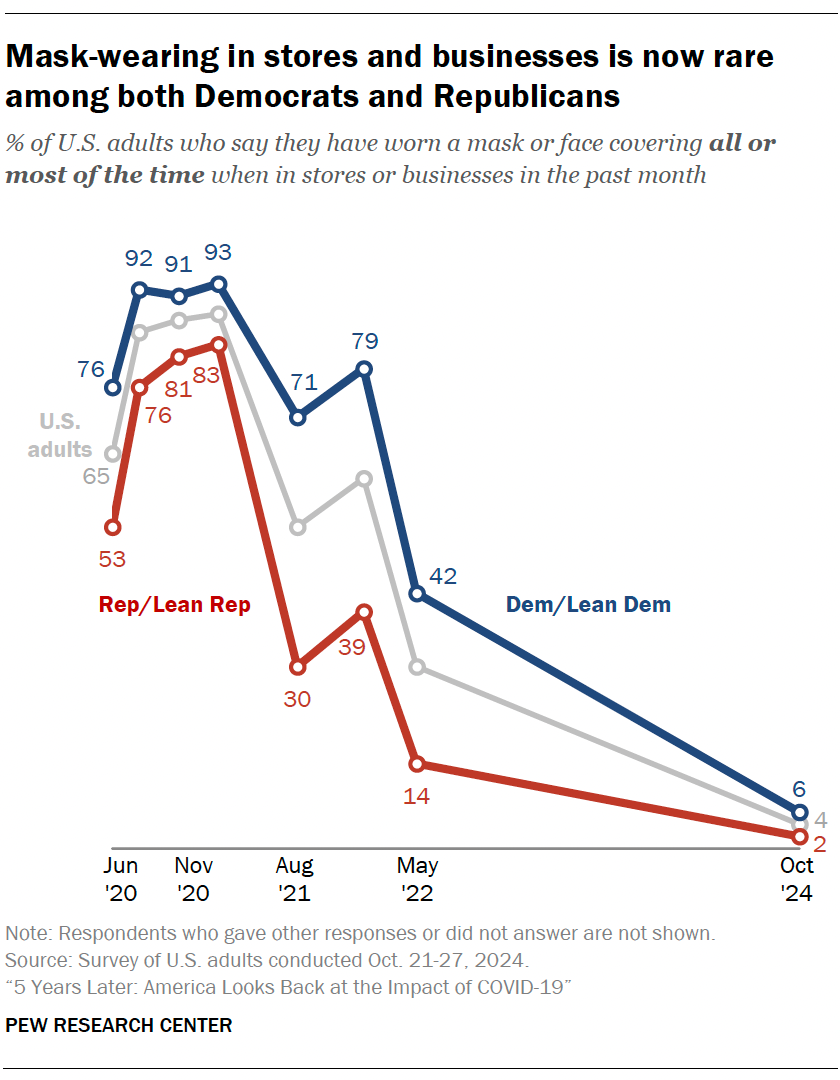
This is reflected in Americans’ behavior: Just 4% regularly wear a mask, while most never do. And fewer than half of U.S. adults said they planned to get an updated COVID-19 vaccine last fall, a stark contrast to the long lines and widespread demand that met the initial rollout of vaccines.

At the five-year anniversary of the coronavirus outbreak, a major Pew Research Center survey conducted in late October 2024 provides insight into how Americans assess the nation’s pandemic response. These findings are paired with an analysis of trends dating to early 2020. The report sections take a closer look at COVID-19’s impact in four specific areas of American life: health, work, religion and technology.

1. Personal health and policy
2. The workplace
3. Religious life
4. Technology use

Massive gaps remain between Republicans and Democrats in views toward COVID-19, including vaccines

Majorities of both Democrats and Republicans were personally impacted by the pandemic: Eight-in-ten Democrats (including independents who lean to the Democratic Party) say COVID-19 took at least a minor toll on them, while 69% of Republicans and GOP leaners say the same.

And virtually identical shares of Republicans and Democrats say they have tested positive for COVID-19 or been pretty sure they had it.

But the pandemic highlighted the different values and priorities of America’s two major political parties.

Two years after the pandemic started, Republicans were more likely than Democrats to say the country had given too little priority to individual choice and supporting businesses and economic activity in the response to the coronavirus outbreak. And a larger majority of Republicans than Democrats said the country hadn’t given enough priority to the needs of K-12 students. Democrats, meanwhile, were more likely to say the country came up short on limiting risks for vulnerable populations and protecting public health.

These differing outlooks are part of what shaped the sharply partisan responses to COVID-19 that persist today.

In the new survey:
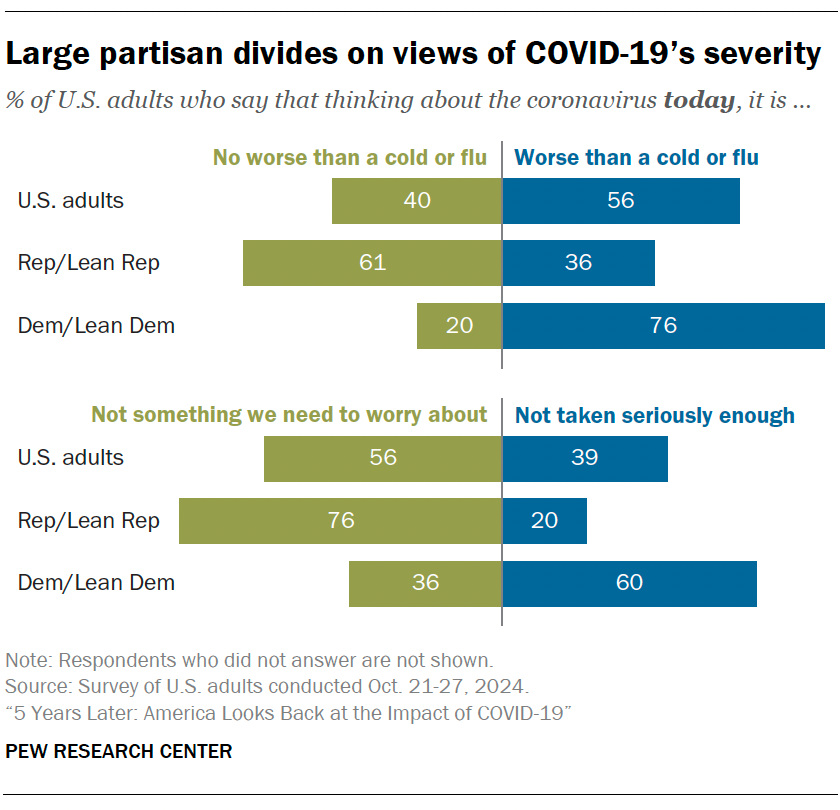
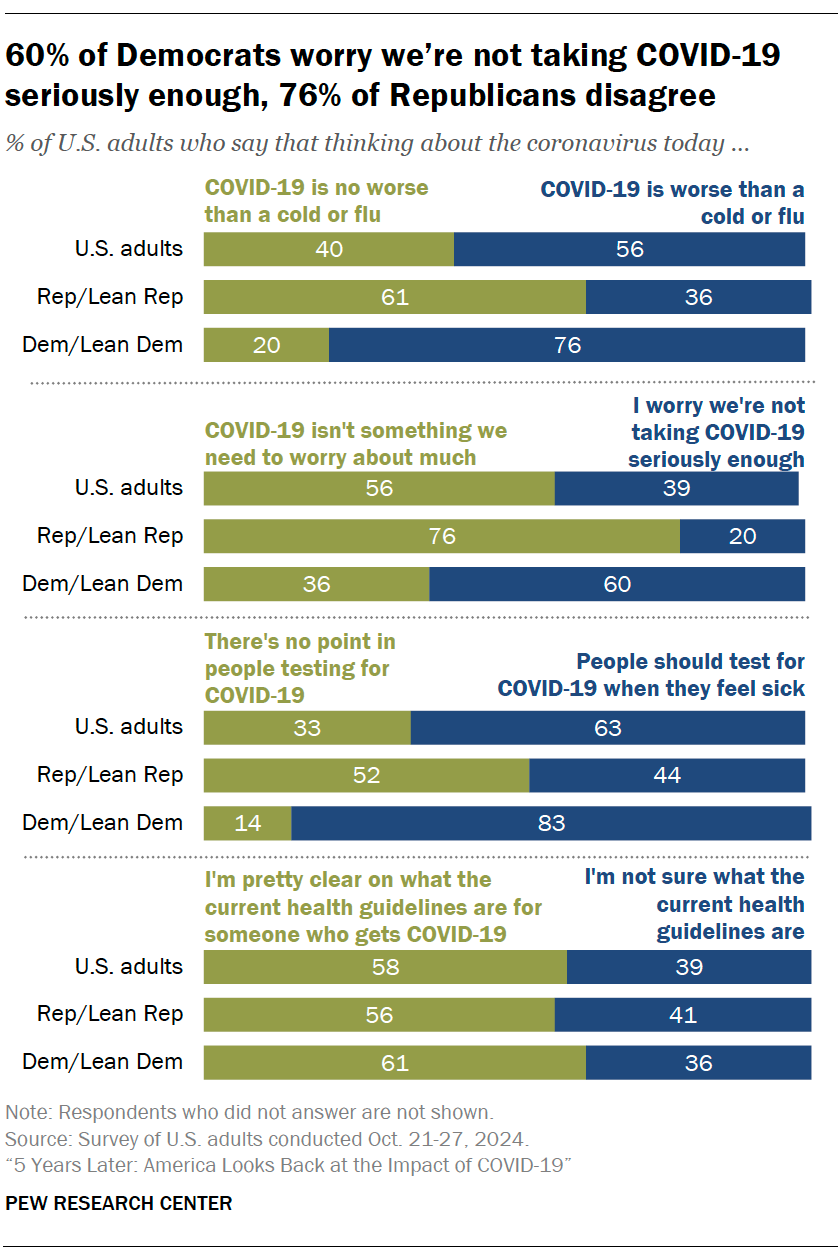
  • Republicans are much more likely to say COVID-19 is now no worse than a cold or flu. About six-in-ten Republicans say this. By contrast, 76% of Democrats take the opposite view and describe COVID-19 today as worse than a cold or flu.
  • Meanwhile, Democrats are much more inclined to worry that we’re not taking COVID-19 seriously enough today. Fully 60% of Democrats worry we’re not taking COVID-19 seriously enough now, compared with 20% of Republicans.
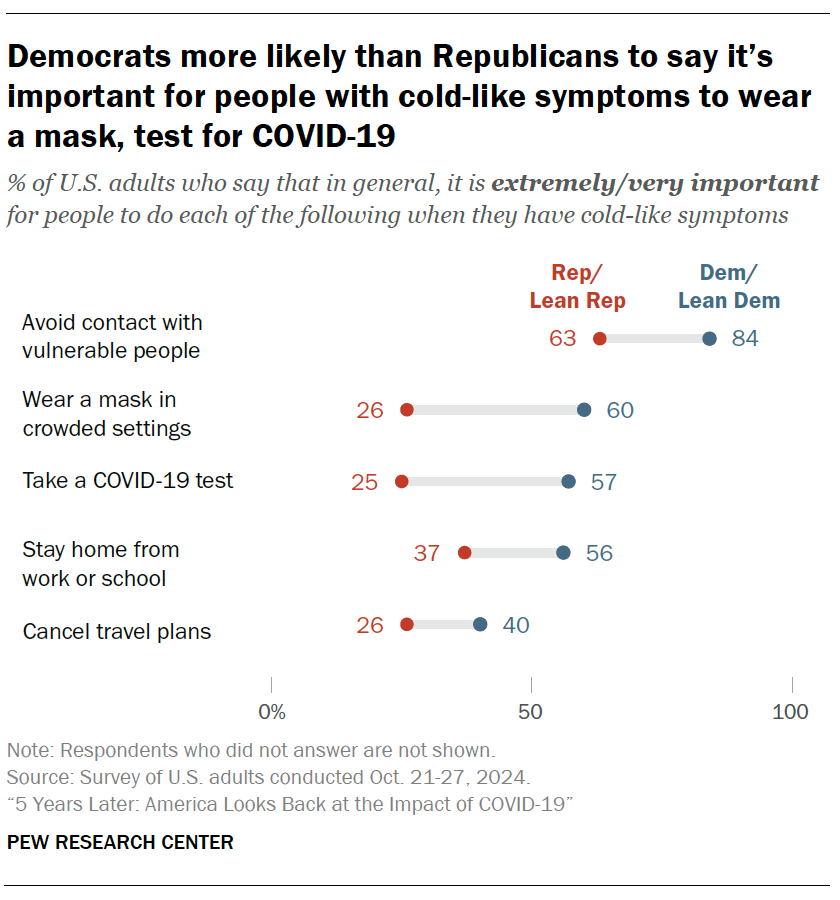
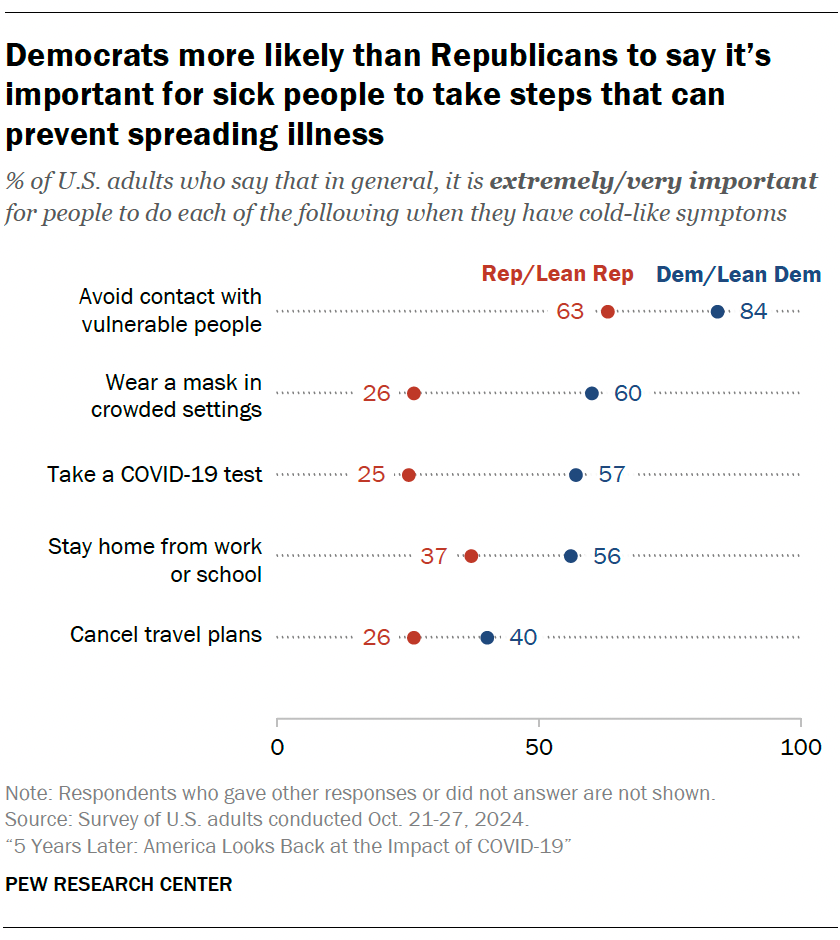
  • There also are differing views on the steps people should take when they are feeling sick. While majorities of both parties say it is extremely or very important for a person with cold-like symptoms to avoid contact with vulnerable people, Democrats are more likely than Republicans to express this view (84% vs. 63%). Democrats also are much more likely than Republicans to say it’s crucial for someone with these symptoms to stay home from work or school, wear a mask in crowded settings and test for COVID-19.

Views of vaccines in the COVID-19 era

The rapid development of COVID-19 vaccines was an unprecedented achievement for science and medicine that experts say saved millions of lives around the world. Large shares of U.S. adults lined up to get vaccinated in the pandemic’s first year.

  • By last fall – with risk of severe illness and death from COVID-19 far lower than at the height of the pandemic – most Americans said they probably would not get the most updated version of the COVID-19 vaccine. And the stark partisan differences in vaccine uptake seen throughout the pandemic remained wide. About eight-in-ten Republicans (81%) said they probably wouldn’t get an updated vaccine. By contrast, a majority of Democrats said they were planning to get it (39%) or had already received it (23%).
  • Among those ages 65 and older, 70% of Republicans said they were unlikely to get the newest vaccine, while more than eight-in-ten Democrats said that they had already gotten it (42%) or probably would (42%).

In a 2023 survey, Americans expressed lukewarm views of the preventative health benefits of COVID-19 vaccines, along with concerns about side effects.

Health officials worry that currents of skepticism toward COVID-19 vaccines could cross over into views of other vaccines, like the one given to children for measles, mumps and rubella (MMR). A March 2023 Center survey found large shares of U.S. adults continued to view the benefits of the MMR vaccine as outweighing the risks, but support for policies requiring vaccines for children to attend public schools had fallen 12 percentage points, a drop driven almost entirely by falling support among Republicans.

And data from the Centers for Disease Control and Prevention (CDC) shows that there has been a downtick in the share of kindergarteners with complete vaccination records for measles and other diseases, including polio and chickenpox.

Did the nation’s leaders and institutions meet the moment?

With the benefit of five years of perspective, Americans offer a mixed assessment of how their leaders and institutions responded to the COVID-19 pandemic. Those on the front lines – hospitals and medical centers – stand out for the positive ratings they receive for their performance.

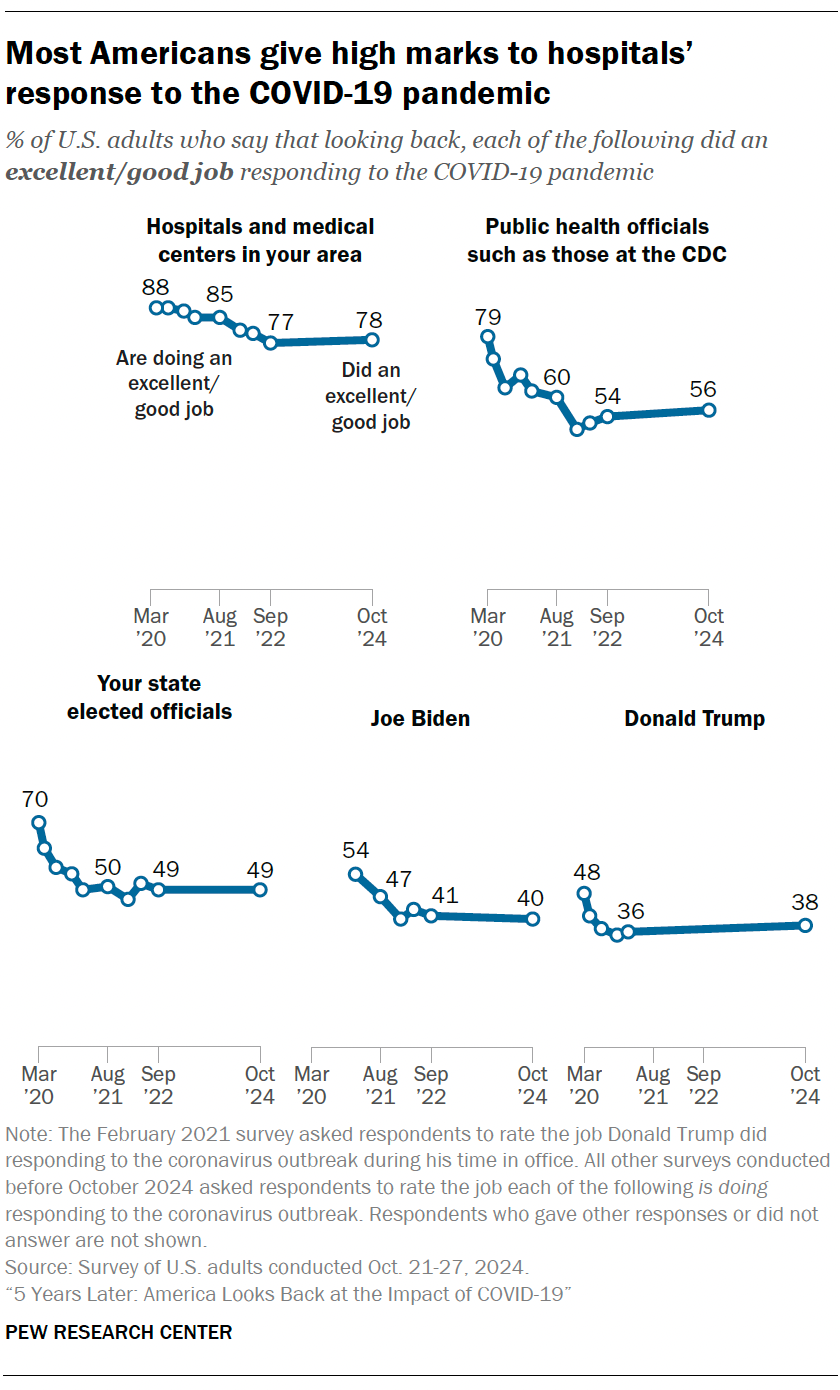
  • About half of U.S. adults or fewer now say their state elected officials (49%), Joe Biden (40%) and Donald Trump (38%) did an excellent or good job responding to the pandemic. A slim majority (56%) give positive ratings to public health officials, like those at the Centers for Disease Control and Prevention (CDC).
  • Only local hospitals get a full-throated approval from Americans: Looking back, 78% say medical centers in their area responded well to the pandemic.
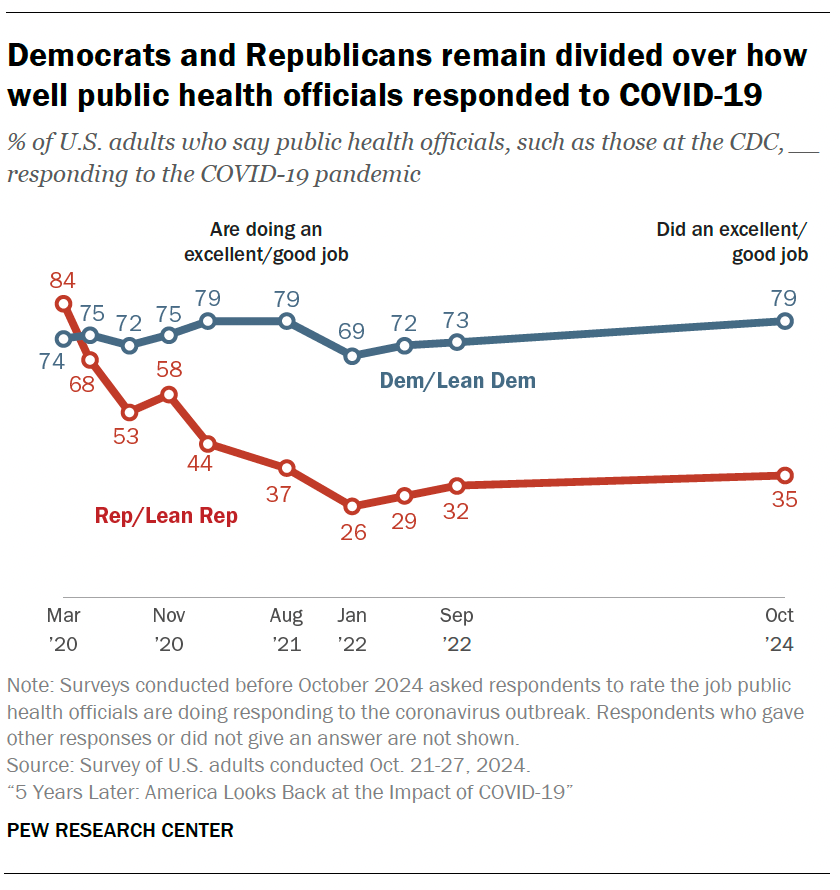
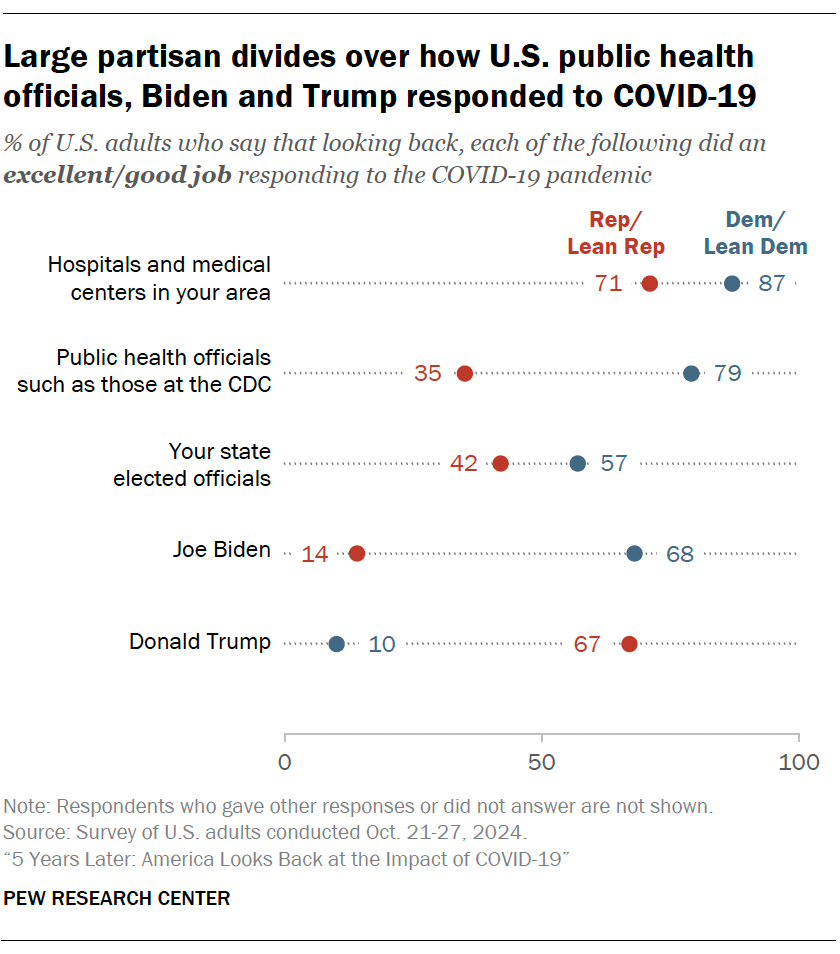
  • Again, there are huge partisan differences on several of these questions. For example, 79% of Democrats say public health officials’ response was excellent or good, while 35% of Republicans agree. Republicans’ positive ratings of public health officials fell 58 points between spring 2020 and the start 0f 2022.

Restrictions on public activity were a central component of officials’ response to the pandemic across levels of government.

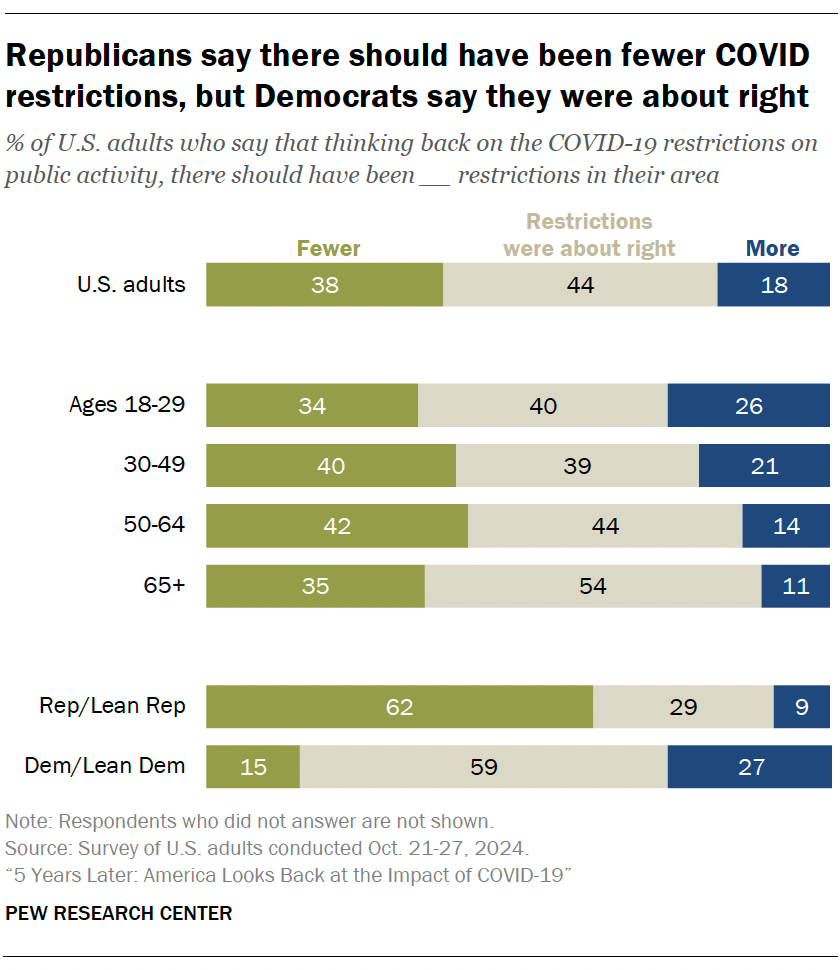
Asked about their assessment today, fewer than half of U.S. adults (44%) say the restrictions on public activity in their area during the pandemic were about right. Another 38% say there should have been fewer restrictions in their area, while 18% say there should have been more.

At the beginning of the pandemic, most Democrats and Republicans agreed with newly implemented restrictions on public gatherings and nonessential businesses. But these views changed quickly as the pandemic wore on, with continuing impacts on the economy, schools and other aspects of daily life. Republicans, in particular, became increasingly critical of activity restrictions.
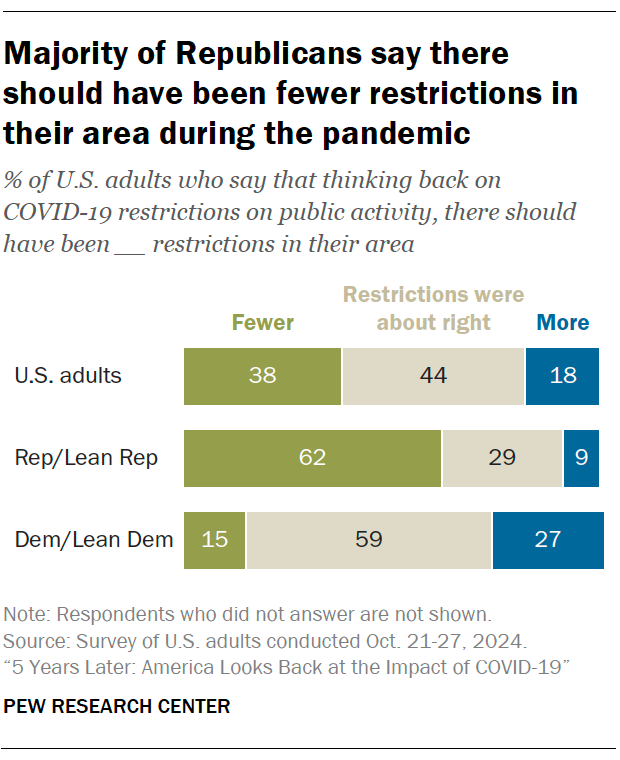
  • Now, looking back, 62% of Republicans say there should have been fewer restrictions on activity in their area, while just 15% of Democrats share this view. A majority of Democrats (59%) think their local officials got it about right, but about a quarter say there should even have been more restrictions than there were.
  • When it comes to K-12 public schools, 55% of Republicans say schools in their area stayed closed for too long, while just 17% of Democrats agree. About half of Democrats (49%) say schools in their area were closed for about the right amount of time.

More broadly, the outbreak cast a spotlight on the role of scientists and scientific information. During the pandemic, Americans’ confidence in scientists to act in the public’s best interests fell: 87% expressed at least a fair amount of confidence in April 2020, but that number dropped to 73% in October 2023. This overall decline was driven by a sharp drop in the share of Republicans who express confidence in scientists to act in the public interest (from 85% to 61%).

Jump to more details about Americans’ views on the virus’ health effects and the public health response.

The information environment: Many say the media exaggerated the risks of COVID-19

The COVID-19 pandemic forced Americans to try to parse through information about a new topic that scientists were scrambling to fully understand – and that almost no one had heard of just a few months before. About two years into the pandemic, 60% of U.S. adults said they felt confused as a result of changes to public health officials’ recommendations, and 57% said false and misleading information about the virus and vaccines contributed a lot to problems with the response.

Challenges in public understanding persist even today, with about four-in-ten Americans – including similar shares of Democrats (36%) and Republicans (41%) – saying they are not sure what the current health guidelines are for someone who gets COVID-19.

COVID-19 also arrived in a rapidly changing news environment. Many Americans had already lost trust in the information from national news organizations – a change driven by Republicans. And news about COVID-19 fit into that trend:
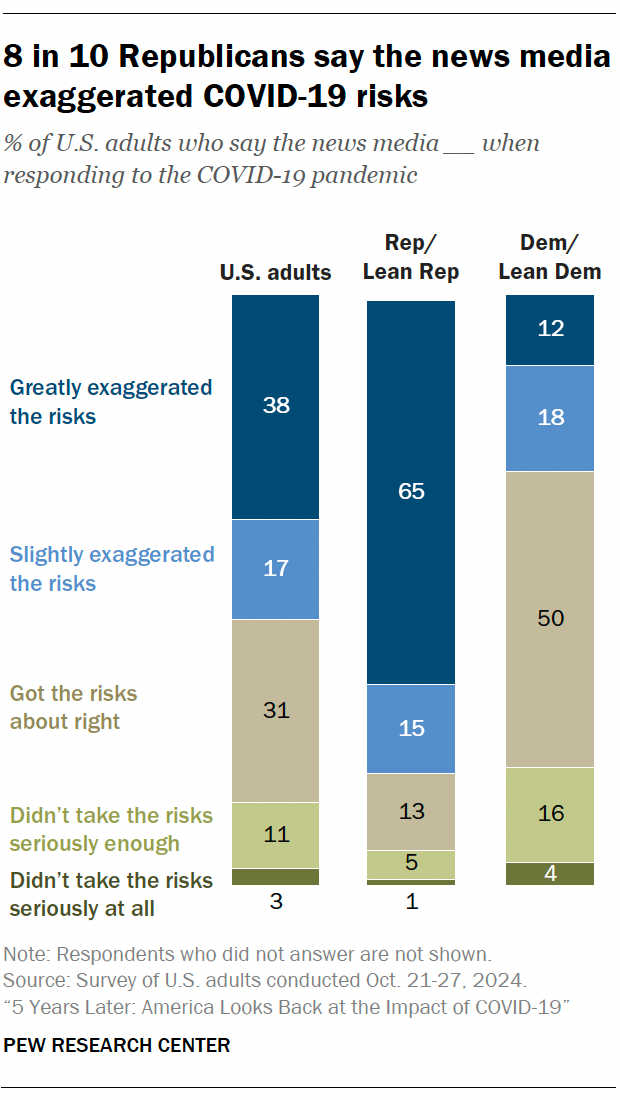
  • Overall, 54% of Americans say the news media exaggerated the risks of COVID-19 at least slightly. This includes eight-in-ten Republicans who say the media greatly (65%) or slightly (15%) exaggerated the risks, compared with three-in-ten Democrats who express similar views. An additional two-in-ten Democrats say the media didn’t take the risks seriously enough, while half say they got the risks about right.
  • There are similar patterns in views toward public health officials like those at the CDC, Joe Biden and his administration, and state elected officials. In each case, Republicans are much more likely than Democrats to say these sources exaggerated the risks of COVID-19 at least slightly.
  • Republicans have a different perspective on what they heard from the Trump administration: More than half of Republicans (59%) say Trump got the risks about right. By contrast, 81% of Democrats say Trump didn’t take the risks of COVID-19 seriously enough.
  • At the same time, Republicans are much less confident than Democrats that they would be able to find accurate information in the event of a new health emergency. While about three-quarters of Democrats (74%) say they are at least somewhat confident they could do this, just under half of Republicans (46%) agree. Overall, 60% of U.S. adults express this view.

COVID-19 affected different groups of Americans in different ways
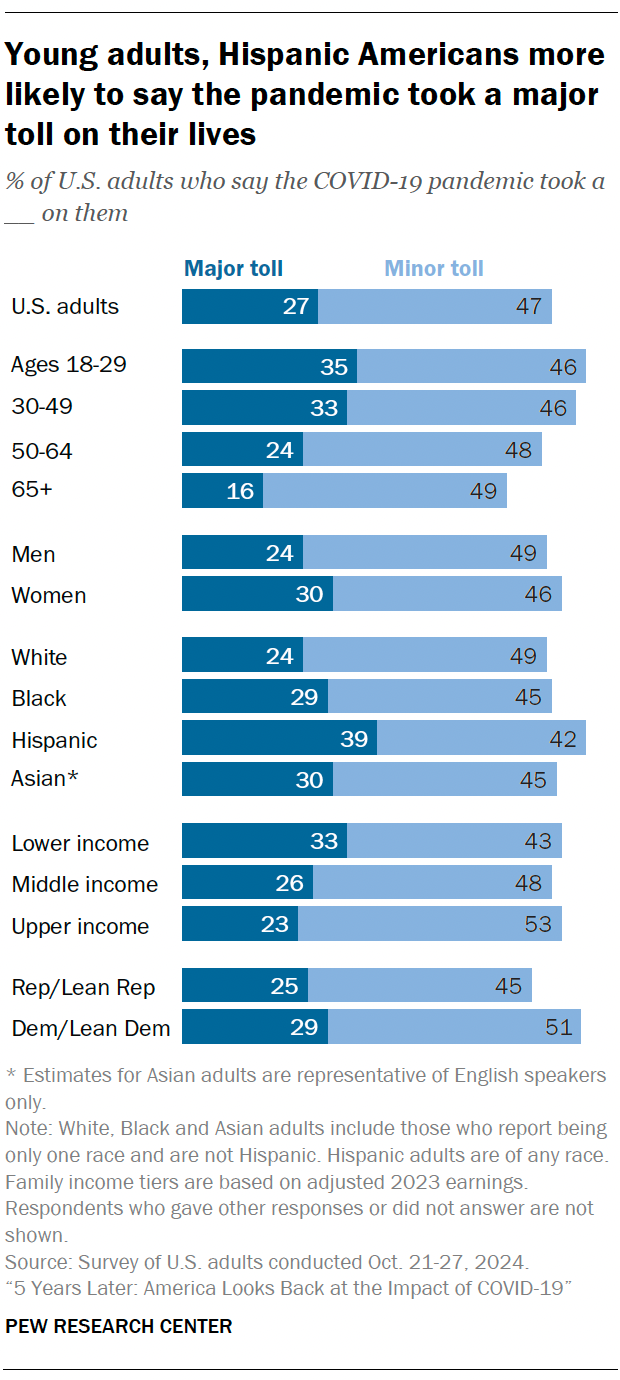
Adults under age 50 are more likely than their elders to say COVID-19 took a major toll on their lives – and to say they haven’t yet fully recovered from the pandemic. Many people in this younger group were finishing their schooling years or parenting young children when the pandemic hit. Still, the vast majority of people who died from COVID-19 in the United States were ages 50 and older, underscoring the range of health and social impacts COVID-19 had on Americans.

Women and Hispanics also are more likely than men and other racial and ethnic groups to say COVID-19 had a major impact on their lives. And Americans with lower incomes report suffering a major toll at a higher rate. Several data points from the pandemic highlight the differential impacts COVID-19 had on Americans:

  • In the early days of COVID-19, young adults were living with their parents at the highest levels since the Great Depression.
  • Among adults 25 and older who have no education beyond high school, more women left the labor force during the pandemic than men. And at multiple points during the pandemic, working mothers with children under 12 were more likely than working fathers in this category to say it was difficult to handle work and child care responsibilities.
  • About half of Hispanic adults (49%) said in March 2021 that they or someone in their household had lost a job or taken a pay cut because of the pandemic, higher than the share of U.S. adults overall who said the same. Younger adults also were more likely to experience job loss or pay reduction.

The pandemic also hit Black and Hispanic communities disproportionately hard in terms of mortality rates in the first year after the outbreak. And Black Americans remain much more likely than their White counterparts to say that COVID-19 remains a major threat to the health of the U.S. population today.

Work, technology and religion: What changed, and what didn’t, about American life amid COVID-19

The pandemic impacted many aspects of life in a variety of ways. Some people have gotten new flexibility when it comes to work and religious worship as technology has gained a new role in many Americans’ lives. But the pandemic also highlighted societal disparities in things like access to technology and the option to work remotely.

The way we work
The pandemic created a seismic shock in the labor market, with Hispanic people, young adults and low-wage workers hardest hit.

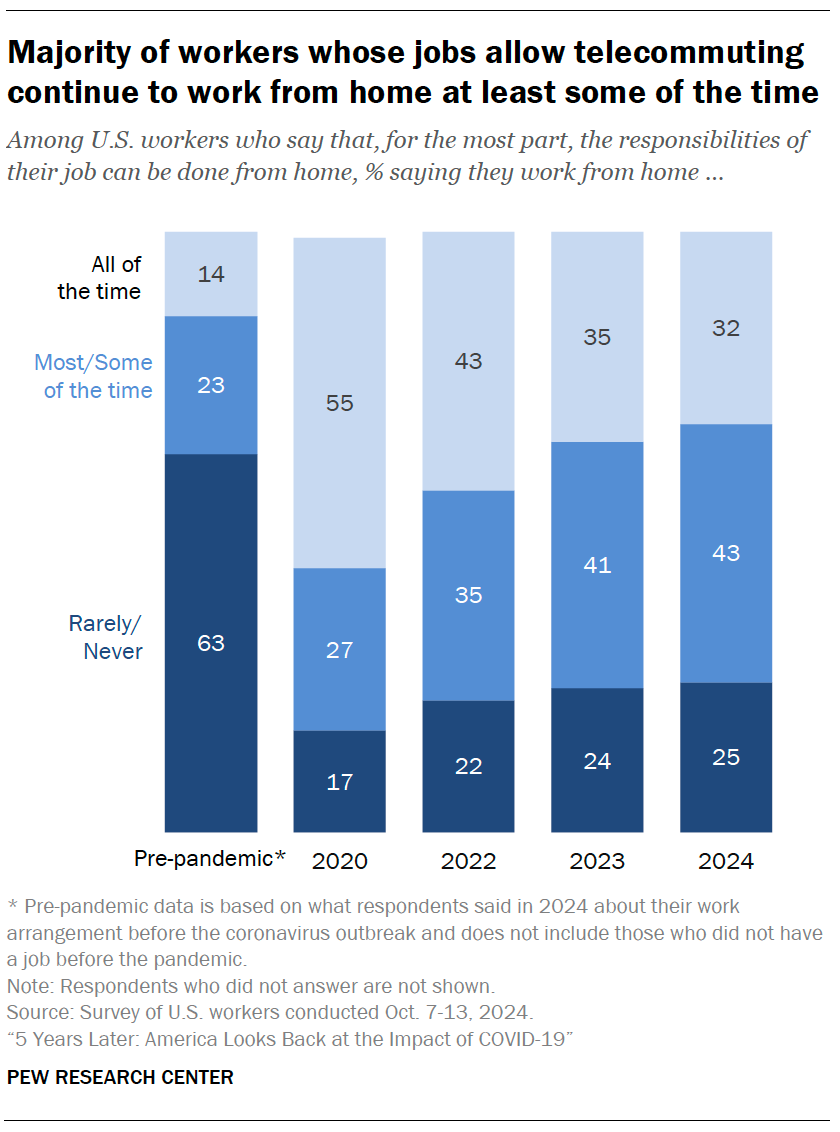
In the early days of the COVID-19 outbreak, a majority of American workers (62%) had jobs that couldn’t be done from home. But for those who could telecommute, the pandemic ushered in an era of increased remote work that continues to this day.

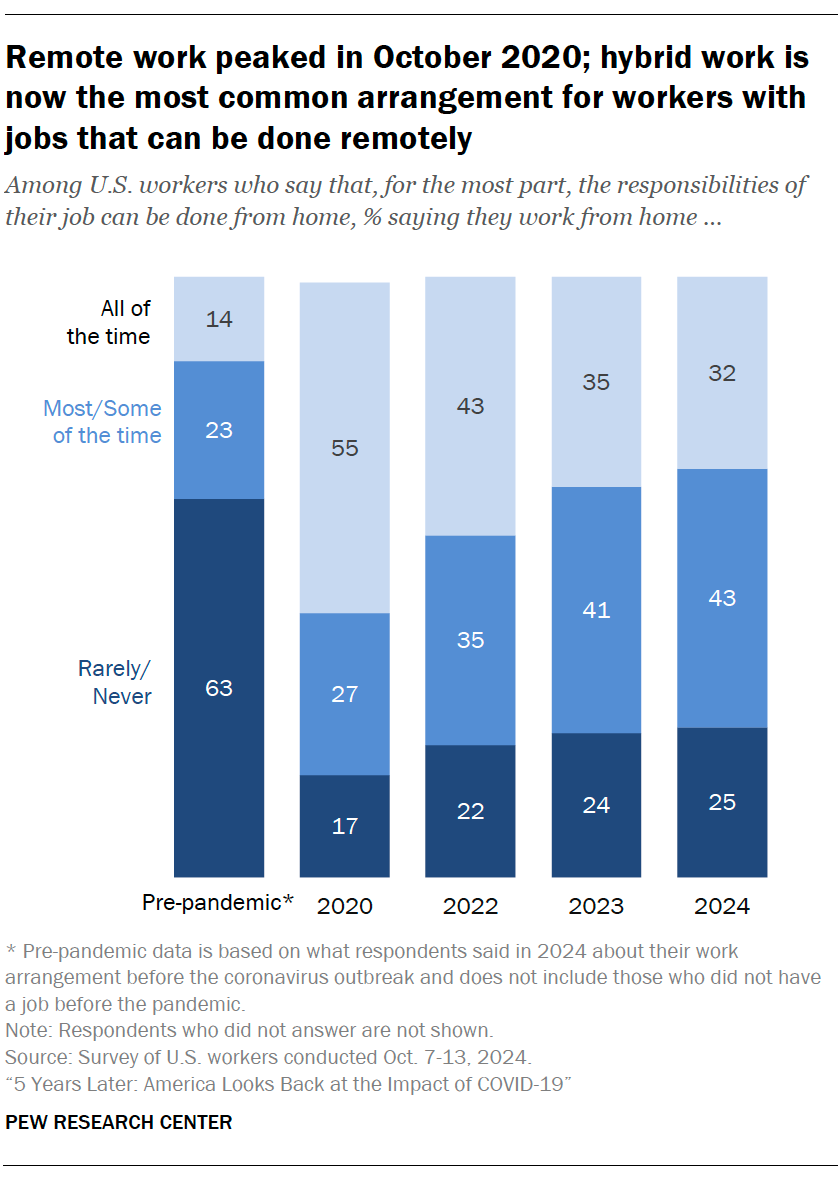
  • Among American workers whose jobs currently allow for remote work as a possibility, 14% say they were working remotely all of the time before the pandemic.
  • During the first year of the pandemic, that number peaked at 55% in October 2020.
  • Today, 32% of these workers still say they are working remotely all the time.
  • Among workers whose jobs currently allow for remote work, 23% say they were working from home most or some of the time before the pandemic, while 43% say this is the case today.  

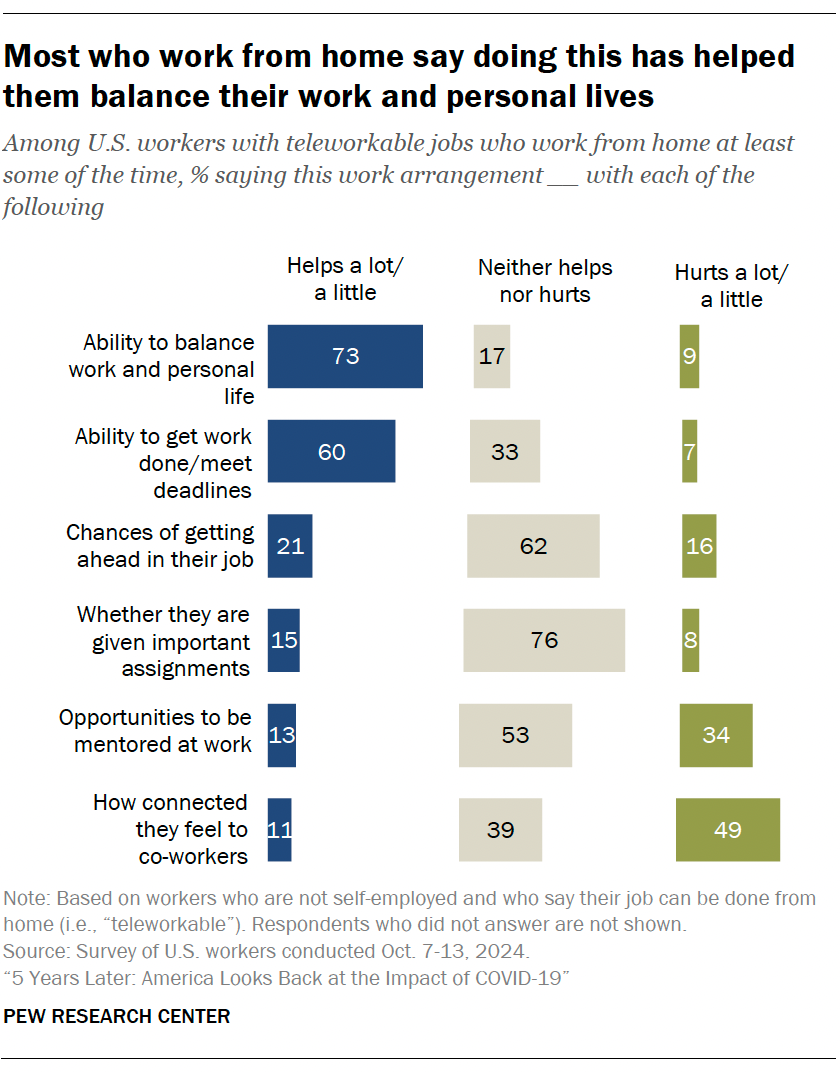
Many remote or hybrid workers say they prefer to work from home. And the shift to telework (and hybrid schedules) has had one clear upside for workers: Most of them say it has helped them balance their work and personal lives. But the biggest downside for these workers is that many say they feel less connected to colleagues.

Jump to more details on how COVID-19 changed work in America.

Religious worship
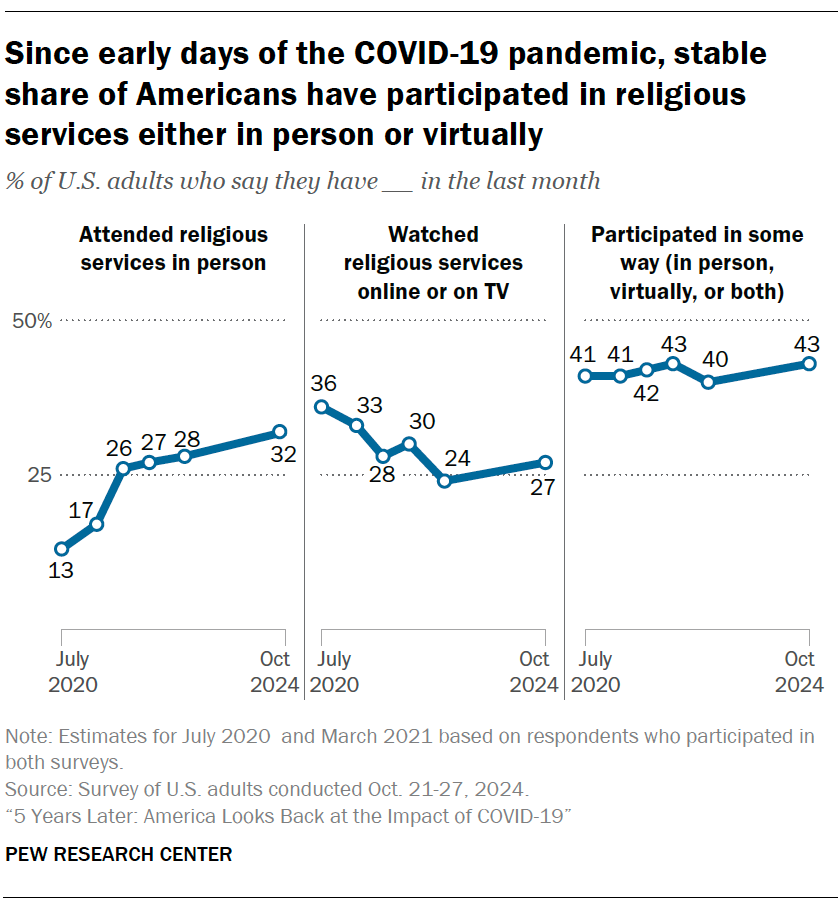
COVID-19 drastically changed how Americans participate in worship services. In July 2020, just 6% of Americans who attend services at least monthly said that their house of worship was open to the public and operating like normal. Like remote work, the share of Americans who report watching religious services online or on TV peaked early in the pandemic, with 36% saying they participated virtually in the last month as of July 2020. And many are still doing so today.

But the pandemic did not shake American religion: The share participating in services in some way has been steady, and the share who say COVID-19 had a big impact on their spiritual life is small.

Jump to more details on how COVID-19 affected religious worship in America.

General technology use

The internet was critical to Americans during the pandemic, with 90% saying it was important to their life at the time (as of April 2021) – including 58% who said it was essential.
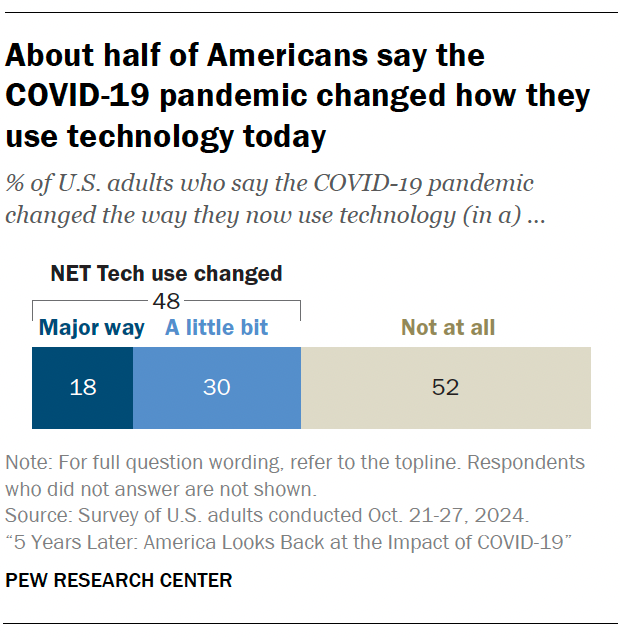
Looking back on the pandemic today, about half of U.S. adults say it changed the way they now use technology, with younger people especially inclined to say this.

The pandemic also intersected with long-standing digital divides, and in many ways brought them into the spotlight. For example, we’ve long seen differences by income in who has access to technology. And during the pandemic, lower-income teens were more likely to report tech-related challenges with schoolwork, such as needing to complete homework on a cellphone or over public Wi-Fi.

Among Americans who say COVID-19 changed the way they use technology, those with lower incomes are less likely to say these changes have made their lives easier (in October 2024). Still, the largest shares regardless of income say these changes have made their lives both easier and harder.

Jump to more details on how COVID-19 changed technology use in America.

Looking ahead: Are we ready for the next health emergency?
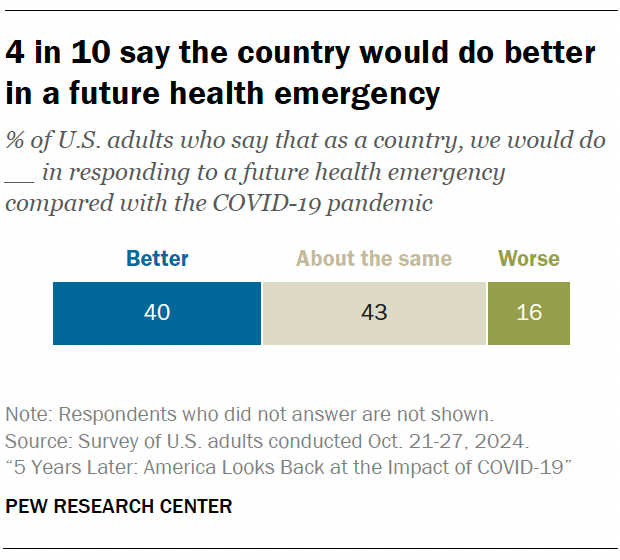
Americans’ expectations for the nation’s response to a future health emergency appear somewhat positive compared with the critiques and divisiveness they associate with the coronavirus response.

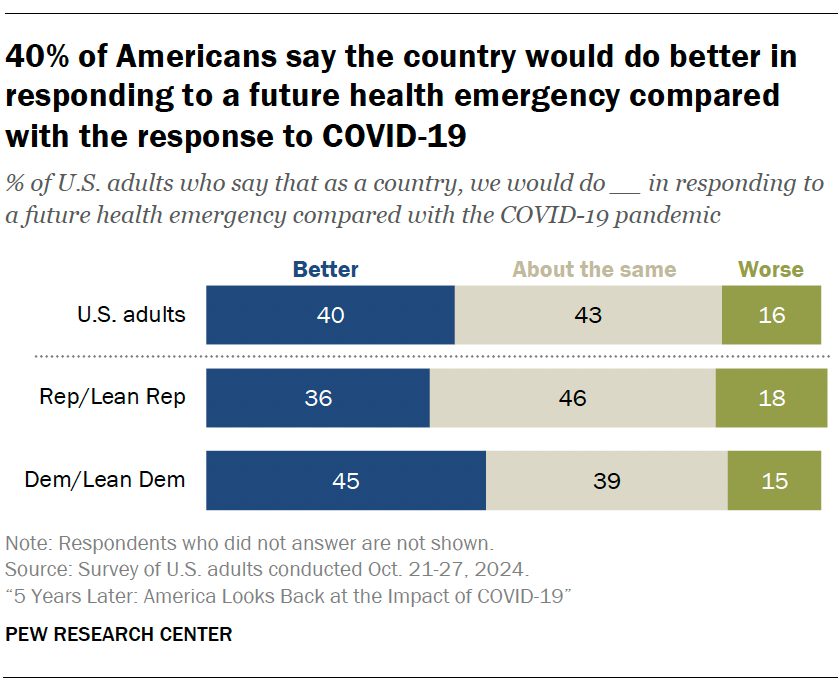
More than twice as many say the U.S. would do better with a future health emergency (40%) than say we would do worse (16%), though many Americans (43%) say we would do about the same as we did with how the country handled the COVID-19 pandemic.

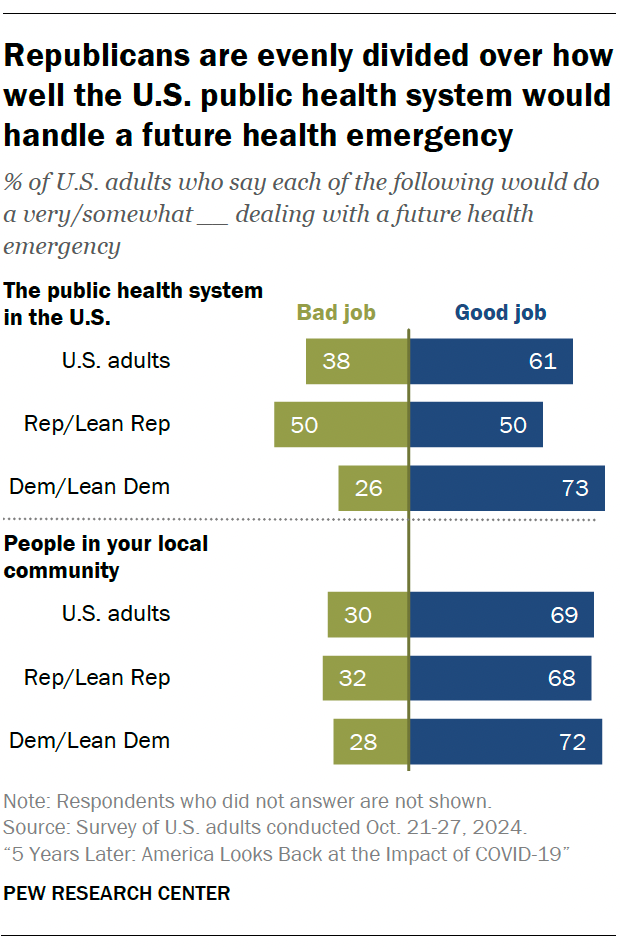
About six-in-ten (61%) think the public health system would do at least a somewhat good job dealing with a future health emergency; an even larger share (69%) think people in their own community would do a good job.

A larger share of Democrats (73%) than Republicans (50%) think the public health system in the U.S. would do a good job dealing with a future health emergency. But comparable majorities of both Democrats (72%) and Republicans (68%) express confidence in their own communities to respond well.
1. Americans’ views on COVID-19 risk and the country’s response to health emergencies

Eileen Yam and Giancarlo Pasquini contributed to this chapter.

Five years after the pandemic began, Americans largely see COVID-19 through the rear-view mirror. Overall, they don’t feel the virus is nearly as much of a danger as they did in 2020. Still, deep political divides persist about the disease. Democrats and Republicans aren’t on the same page about how seriously we should be taking COVID-19 today. And the two parties hold different views on how well public health authorities and elected officials handled the pandemic.

Jump to read about views of COVID-19 today, including: Do Americans still see COVID-19 as a major threat? | How dangerous is COVID-19, and how seriously should we take it?

Jump to read about views on protecting others, including: What steps should people take to protect others when they’re sick? | How often do Americans wear masks?

Jump to read about past and future responses to health emergencies. Looking back: How do Americans think the country responded to the COVID-19 pandemic? | Looking ahead: How do Americans feel we would respond to a future health emergency?

Do Americans still see COVID-19 as a major threat?

The COVID-19 pandemic was the deadliest in U.S. history. And many experienced the virus firsthand: In our survey, 63% of American adults say that since February 2020, they tested positive for the virus, were told by a health care provider they had it or are pretty sure they had it. With the public health emergency phase now behind us, we asked Americans if they feel the virus poses a threat today.

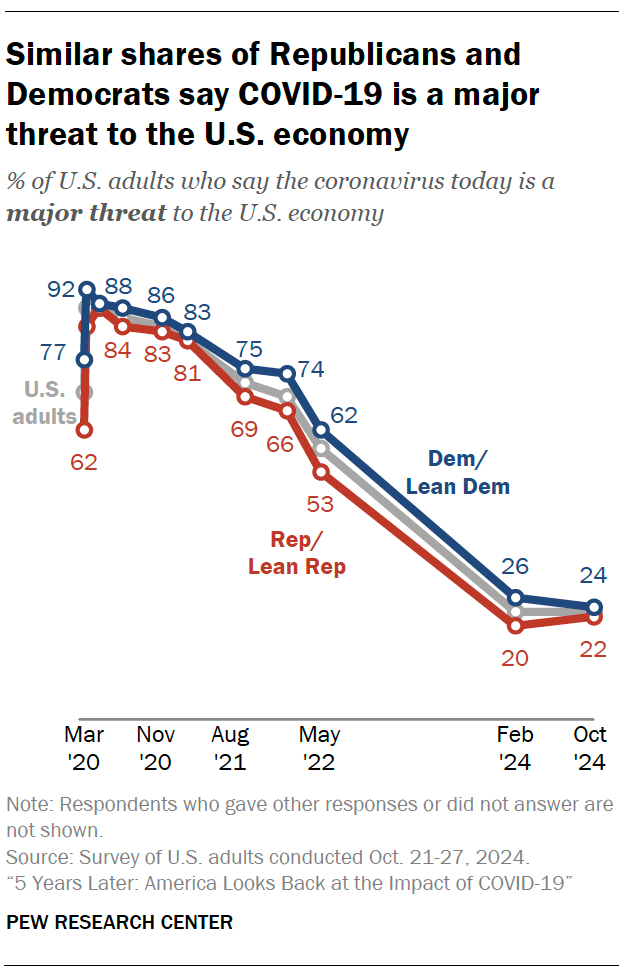
  • About one-in-five Americans say the coronavirus today is a major threat to the health of the U.S. population as a whole. This is down from a high of 67% in July 2020.
  • A larger share of Democrats and independents who lean Democratic (29%) than of Republicans and GOP leaners (13%) still see COVID-19 as a major public health threat. But now that the overall threat perception has dropped, the partisan gap is far less dramatic than it was in July 2020 (then 85% among Democrats, 46% among Republicans).

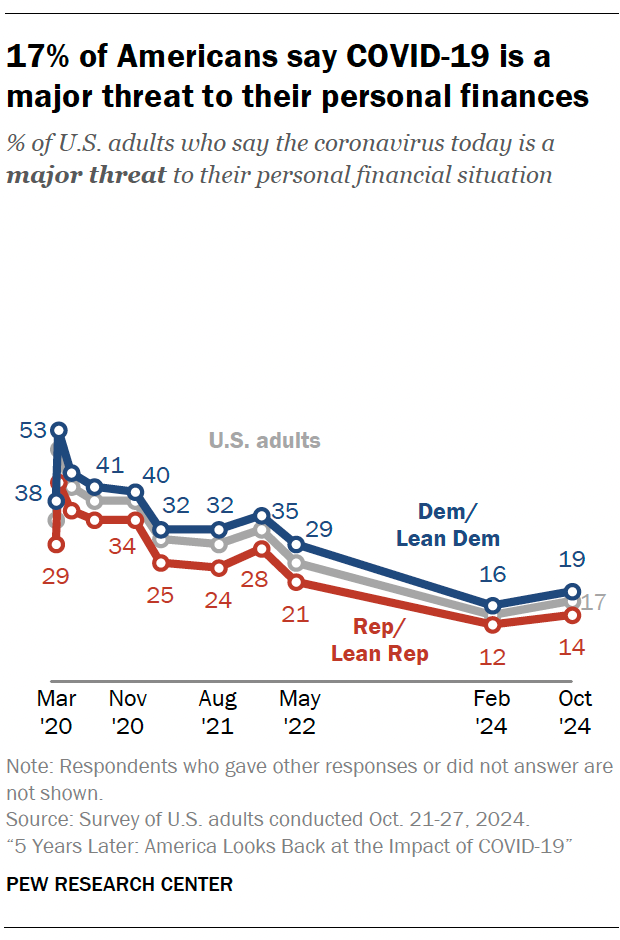
The share of Americans who say the coronavirus is a major threat to their personal health follows a similar pattern: There’s been an overall decline in the share of Americans who say this. And the partisan gap is less pronounced now that overall threat perception has dropped substantially. (Refer to the appendix for details.)

How dangerous is COVID-19, and how seriously should we take it?

During the pandemic, scientists sounded alarms about how COVID-19 could be more lethal than a cold or flu. But there was fierce debate and widespread confusion about how severe the virus was, and what people should do about it.

How do Americans feel today about COVID-19’s severity, and how people should respond to it?

  • Overall, 56% of Americans say COVID-19 is worse than a cold or flu, compared with 40% who say COVID-19 is no worse than these other illnesses.
  • A small majority (56%) says COVID-19 isn’t something we need to worry about much. Still, about four-in-ten (39%) say we’re not taking it seriously enough.
  • When it comes to testing for COVID-19, nearly two-thirds (63%) say people should take a test when they feel sick, compared with a third who say there is no point in doing this.

Differences by party

Republicans and Democrats differ dramatically in how they view COVID-19 today, with Democrats much more concerned about it. About three-quarters of Democrats (76%) say COVID-19 is worse than a cold or flu, compared with 36% of Republicans who say this. On the question of how worrisome the virus is, we see a similar partisan gap: About three-quarters of Republicans (76%) say COVID-19 isn’t something we need to worry about much, while 36% of Democrats say the same.

When it comes to whether people should test themselves for COVID-19 when they feel sick, a large majority of Democrats (83%) say people should test. But Republicans are much more split. About half (52%) say there’s no point in testing, while 44% say people should test.

Many Americans grappled with rapidly shifting health guidelines throughout the pandemic. Today, similar shares of both parties say they’re pretty clear on what the guidelines are for someone who gets COVID-19 (61% of Democrats, 56% of Republicans). But substantial minorities of both Democrats (36%) and Republicans (41%) say they are not sure what the current guidelines are.

Differences by race and ethnicity

Early in the pandemic, COVID-19’s health toll was especially heavy among Black and Hispanic adults. And in 2024, larger shares of Black (75%) and Hispanic Americans (64%) than White (51%) respondents say COVID-19 is worse than a cold or flu. This gap is driven by the much smaller shares of White Republicans who hold this view (33%). When we look just among Democrats, the racial and ethnic divide nearly vanishes: 80% of Black Democrats, 77% of Hispanic Democrats and 77% of White Democrats say COVID-19 is worse than a cold or flu.

What steps should people take to protect others when they’re sick?

The Centers for Disease Control and Prevention (CDC) guidelines spell out several steps people can take to slow the spread of COVID-19 and other illnesses. Some of these guidelines – such as wearing a mask – became politically charged during the pandemic. Five years later, how do Americans feel about taking measures to prevent the spread of illness?

We asked Americans how important it is for people to take five different actions when feeling sick.

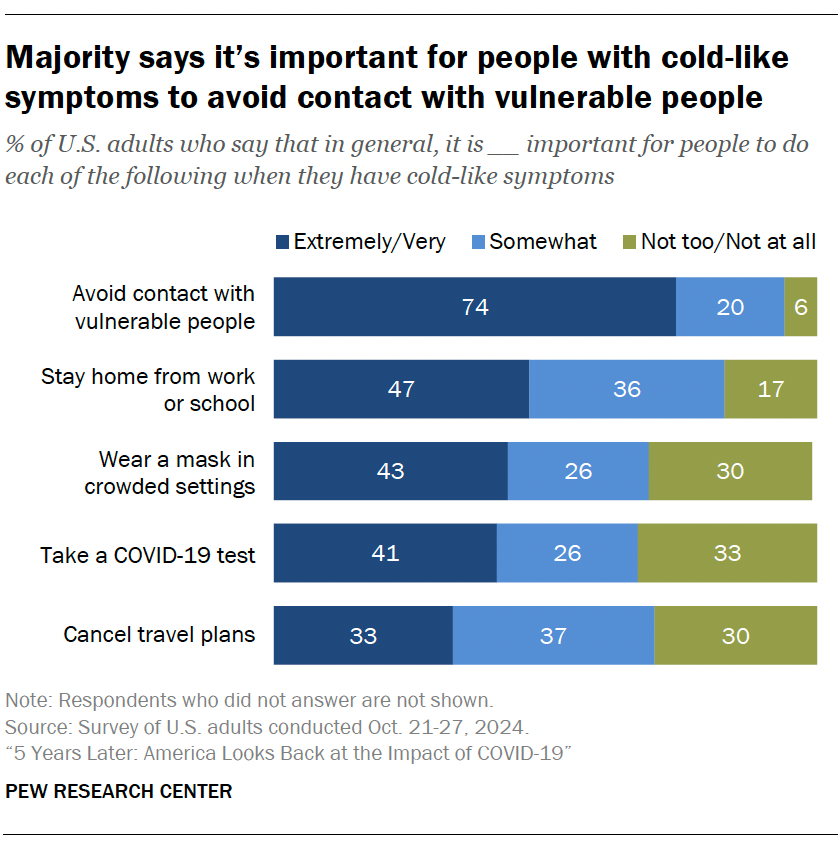
About three-quarters (74%) say it is extremely or very important for people with cold-like symptoms to avoid contact with vulnerable people, such as older people and pregnant women. Of the five actions we asked about, this is the one that respondents deem most important. Just 6% say this is not too or not at all important.

Americans feel much less strongly about other steps people can take to prevent spreading illness. Just under half (47%) of Americans say it is extremely or very important to stay home from work or school when feeling sick. About four-in-ten say the same about wearing a mask in crowded settings (43%) and taking a COVID-19 test (41%), while one-in-three say it is extremely or very important to cancel travel plans when feeling sick.

Still, a majority of Americans say each of these actions is at least somewhat important to do when people feel sick. No more than a third say that any of these five measures are not too or not at all important.

Differences by party

Larger shares of Democrats than Republicans feel these preventive actions are extremely or very important. The biggest partisan gaps emerge around mask-wearing and testing.

Six-in-ten Democrats say it’s extremely or very important to wear a mask in crowded settings when people have cold-like symptoms, compared with 26% of Republicans who say this. A similar share of Republicans (25%) say it’s extremely or very important to take a COVID-19 test, versus 57% of Democrats.

This partisan pattern holds for other behaviors that can prevent the spread of illnesses. For instance, majorities of both parties say it’s extremely or very important for people with cold-like symptoms to avoid vulnerable people. But this is a more widely held opinion among Democrats (84%) than Republicans (63%). Similarly, 56% of Democrats feel it’s extremely or very important for sick people to stay home from work or school, compared with 37% of Republicans.

How often do Americans wear masks?

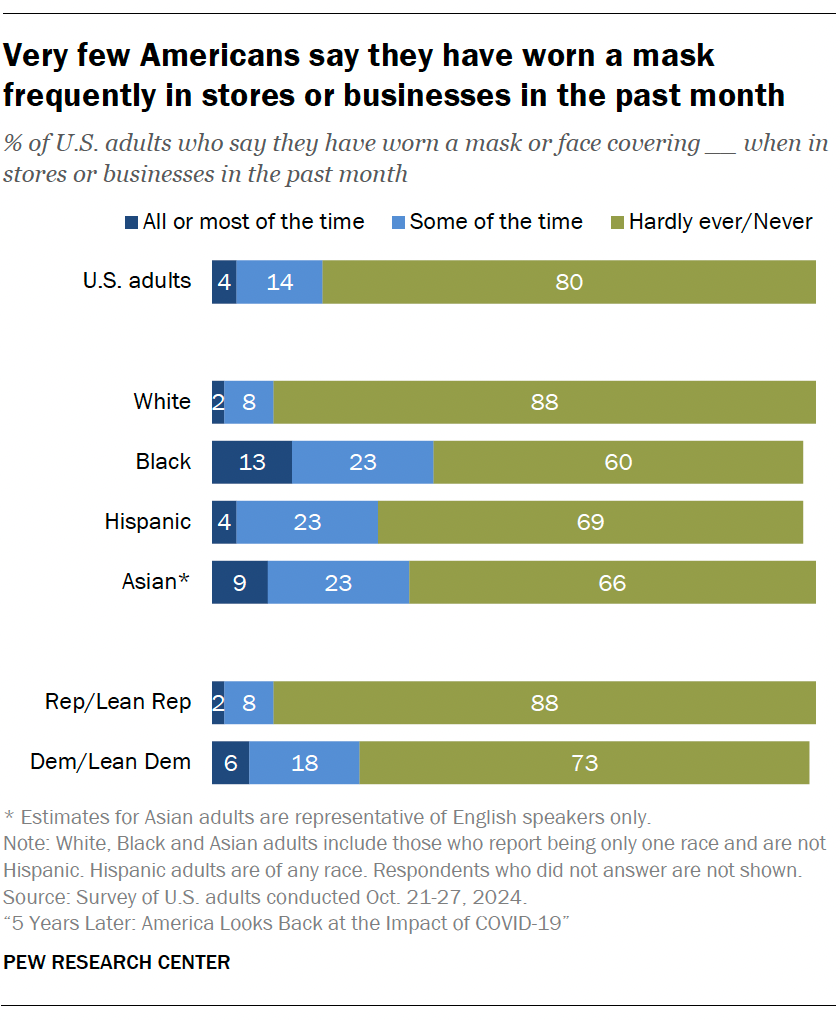
Face masks were a defining, intensely politicized symbol of the pandemic. Five years later, the vast majority of Americans (80%) say they rarely or never wear a mask in stores and businesses.

Overall, just 4% of Americans say they wore a mask or face covering in stores or other businesses all or most of the time in the past month. This is down from 88% about a year into the pandemic, and a majority (61%) were masking in stores as recently as January 2022.

In 2024, the small shares of Americans who wear a mask frequently are dwarfed by the 80% who say they hardly ever or never wear masks.

Differences by race and ethnicity

Larger shares of Black (36%), Hispanic (27%) and Asian Americans (32%) say they wore a mask at least some of the time in the past month than White Americans (10%). This pattern holds regardless of party: Among both Democrats and Republicans, White adults are less likely than Black, Hispanic or Asian adults to say they masked at least some of the time in the past month.

Partisan differences

The share of Americans who report frequently wearing a mask in stores or businesses has declined dramatically since early in 2021. Frequent mask wearers are now so few and far between that the once-stark partisan gap has nearly disappeared. 

Democrats and Republicans are now similarly unlikely to say they have frequently worn a mask in the past month (6% of Democrats and 2% Republicans say this).

When we last asked this question in 2022, there was a 28-point difference between the shares of Republicans (14%) and Democrats (42%) who said they wore masks all or most of the time.

Still, in the most recent survey, there are some differences between Republicans and Democrats when it comes to wearing a mask. For example, 76% of Republicans say they have never worn a mask in the past month, compared with 47% of Democrats who say this.

Looking back: How do Americans think the country responded to the COVID-19 pandemic?

With five years of hindsight, we asked Americans how they now feel about COVID-19 policies that restricted public activity. We also asked about their views on how hospitals and government officials responded.

Views on pandemic-era restrictions

During the pandemic, authorities introduced various restrictions to slow the virus’ spread. For many Americans, these policies upended travel plans, schools, work and other aspects of life.

  • Thinking back, 38% feel there should have been fewer restrictions on public activity in their area, compared with just 18% who say there should have been more restrictions. The largest share (44%) say the restrictions were about right.
  • The view that there should have been fewer restrictions is much more pronounced among Republicans (62%) than Democrats (15%). More than half of Democrats (59%) feel the restrictions were about right, compared with 29% of Republicans.
  • Adults ages 65 and older are more likely than younger adults to say restrictions were about right. In contrast, adults 18 to 29 are more likely than older adults to say there should have been more restrictions.

Views on how hospitals, public health officials and elected officials responded to the pandemic

Hospitals and medical centers were on the front lines treating COVID-19 patients, and 78% of Americans look back and say they did an excellent or good job responding to the pandemic.

Views on the response of public health officials and elected officials are less positive. In the current survey, 56% of Americans say public health officials, such as those at the CDC, did an excellent or good job – much lower than the share who said this early in the pandemic.

For example, in March 2020, 79% of Americans said public health officials were doing an excellent or good job responding to the pandemic. By September 2022, that share was down to 54%.

Around half of U.S. adults (49%) now give positive ratings to how their state elected officials responded to the pandemic. At a national level, 40% say Joe Biden did an excellent or good job responding to COVID-19, and 38% say the same of Donald Trump.

Partisan differences

Looking back at the pandemic response, majorities of both Republicans (71%) and Democrats (87%) say their local hospitals and medical centers responded well.
In contrast, there’s a bigger partisan divide about how good a job public health officials did: A much smaller share of Republicans (35%) than Democrats (79%) give them high marks.

When asked about how Biden and Trump responded to the pandemic, Democrats and Republicans give reviews aligned with their partisan leanings. Among Democrats, 68% say Biden did an excellent or good job, compared with 14% of Republicans. But when asked to rate Trump, 67% of Republicans say he did an excellent or good job, versus 10% of Democrats.

Looking ahead: How do Americans feel we would respond to a future health emergency?

We also asked survey respondents how they think we would respond to a future health emergency compared with the response to the COVID-19 pandemic. These are views they expressed prior to the 2024 presidential election.

How would we do as a country?

Four-in-ten Americans are fairly positive about the prospect of a future health emergency response, saying that the country would do a better job responding compared with the COVID-19 pandemic. Just 16% feel the U.S. would do worse. And 43% say the country would do about the same.

Compared with how divided they are on other COVID-19 matters, Democrats and Republicans aren’t so far apart on this. Some 45% of Democrats and 36% of Republicans say the country would do better. Smaller shares of Republicans (18%) and Democrats (15%) say the country would do worse.

How well would the U.S. public health system and local communities deal with a future health emergency?

Both the U.S. public health system and people in local communities play a vital role in addressing health emergencies.

About six-in-ten Americans (61%) say the public health system would do a very or somewhat good job dealing with a future health emergency.

Democrats and Republicans differ on the future response of the public health system in the U.S. Among Democrats, 73% say it would do a good job and 26% say it would do a bad job. Republicans have more mixed views, with half saying it would do a good job and half saying it would do a bad job.

But when asked to think about people in their local community, Democrats and Republicans both have a positive outlook. Majorities of Democrats (72%) and Republicans (68%) say they would do a very or somewhat good job.

2. How COVID-19 changed U.S. workplaces

Kim Parker contributed to this chapter.

The COVID-19 pandemic sent shockwaves through the U.S. labor market. Businesses shuttered, millions of Americans lost their jobs, and for many others their home became their workplace.

We tracked these changes starting from the early months of the coronavirus outbreak. Our trends outline the journey workers have been through. And new data helps show where things stand now and the lasting impact the pandemic has had on the American workplace.

Labor market impact

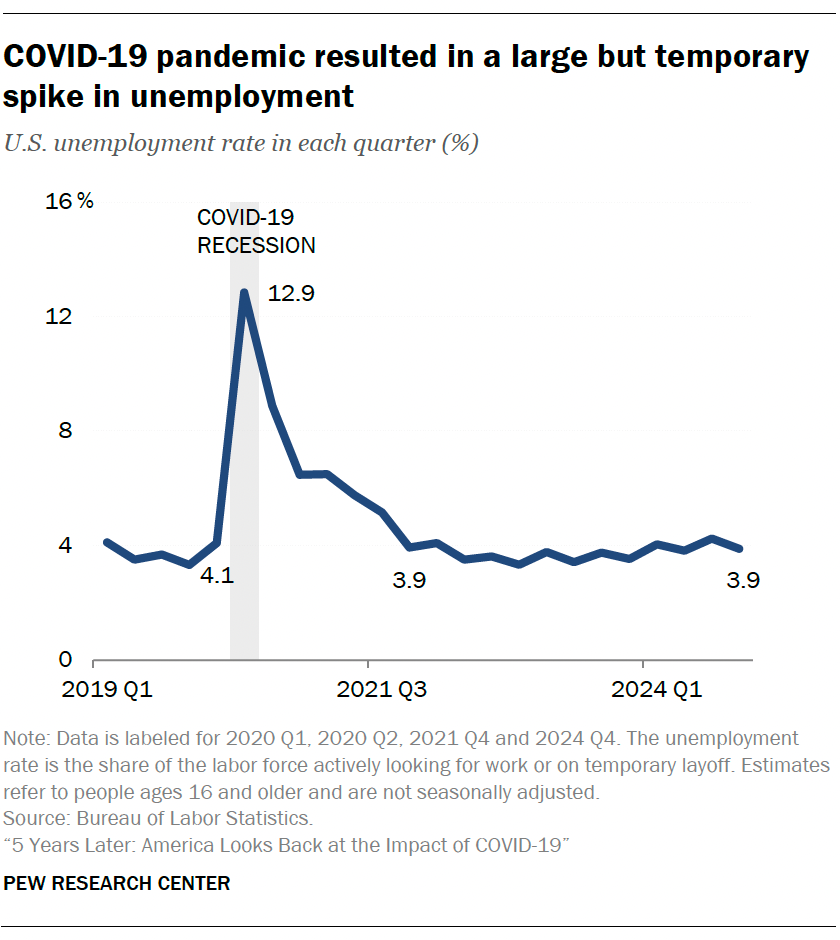
The coronavirus outbreak had an immediate impact on employment in the U.S. In February 2020, before widespread lockdowns and stay-at-home orders took hold, the national unemployment rate stood at 3.8%. By April 2020 it reached 14.4%.

The spike was intense but relatively short-lived. By the fourth quarter of 2021, the unemployment rate was back around 4%.

Some groups were hit harder than others by the early job losses:

  • Women
  • Immigrants
  • Young workers (ages 16 to 24)
  • Workers who hadn’t completed high school
  • Lower-income workers

In addition, millions of workers withdrew from the labor force altogether. More women than men dropped out of the labor force during the first year of the pandemic.

How workers experienced the pandemic from start to finish

Our surveys traced the arc of experiences for American workers from the outset of the pandemic to what work life looks like now. In the sections below, we walk through the key takeaways from our last five years of polling on this topic.1

Jump to read about: The pandemic’s initial impact on workers | What things look like today | Looking back: The challenges working parents faced | What happened when workplaces began to reopen

The pandemic’s initial impact on workers

Not all workers had the option of working from home

As the pandemic took hold, many workers were able to shift their duties from their office or workplace to home. But it’s important to keep in mind that a majority of workers (roughly 60%) do not have jobs that can be done from home. Many of these workers lost their jobs in the early months of the pandemic, as businesses and retail establishments temporarily shut down. Others had to continue to show up for work, even as they were at risk of contracting the coronavirus.

Some demographic groups were more likely than others to not have jobs that can be done from home, a 2020 survey found:

  • Men were more likely than women (64% vs. 58% said their job cannot be done from home).
  • Workers without a four-year college degree were much more likely than those with a bachelor’s degree or more education (77% vs. 37%).
  • Lower-income workers were more likely than middle- and upper-income workers (76% vs. 63% and 44%, respectively).

In the fall of 2020, we asked workers with jobs that could not be done from home how concerned they were about being exposed to the coronavirus from people they interacted with at work; 53% said they were very or somewhat concerned about this. About four-in-ten (39%) said they were very satisfied with the measures their employer had put in place to protect them from being exposed.

The swift transition to working from home

Looking back, only 14% of workers whose jobs currently can, for the most part, be done from home – “teleworkable” jobs – say they worked from home all the time before the coronavirus outbreak. By October 2020, 55% of those with teleworkable jobs were doing so, according to a survey at that time.

That share has since come down. As of October 2024, about a third (32%) say they are working from home all the time.

Notably, the share working from home most or some of the time increased since the start of the pandemic as offices gradually began to reopen. Now, 43% of workers say they have this type of hybrid schedule, up from about a third in 2022.

How did workers respond to the shift to telework?

Our October 2020 survey found that most employed adults who were working from home said the transition had been relatively easy.

  • Large majorities said it had been easy for them to have the technology they need, to meet deadlines and to have an adequate workspace.
  • However, about three-in-ten or more said it had been difficult to be able to get their work done without interruptions and to feel motivated to work.
  • Younger workers were especially likely to point to difficulty feeling motivated and being able to work without interruptions.

What things look like today

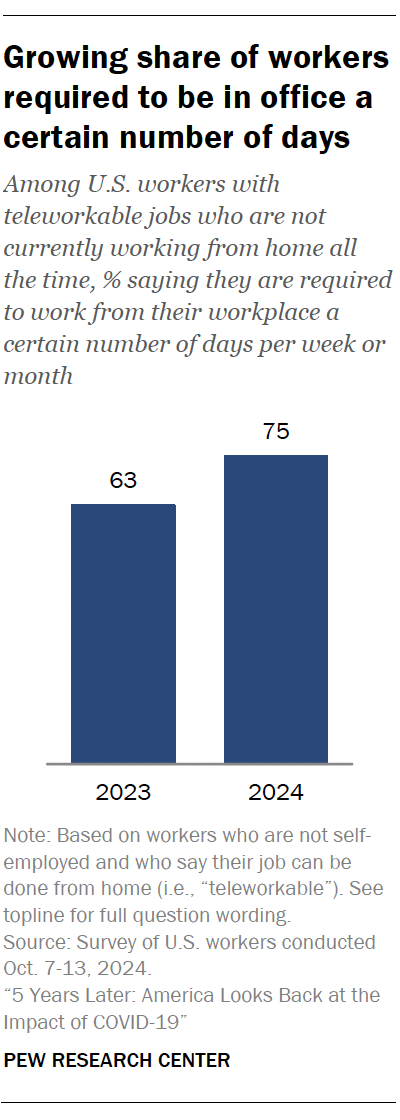
As we approach the five-year mark of the start of the pandemic, a growing share of hybrid workers are facing mandates from their employers to return to the office.

Among those with teleworkable jobs who say they’re not currently working from home all the time, 75% say their employer now requires them to work from their office, workplace or job site a certain number of days per week or month. That share is up significantly from 63% in 2023.

Advantages and disadvantages of working from home

In our polling throughout the past five years – including in our most recent survey – workers have identified a couple of clear upsides to working from home.2

  • Work-life balance: Among workers with a teleworkable job who say they work from home at least sometimes, 73% now say their current arrangement has helped them when it comes to balancing work and their personal life. Only 9% say it’s hurt, and 17% say it has neither helped nor hurt.
  • Productivity: 60% say their current work arrangement has helped their ability to get work done and meet deadlines. Only 7% say it’s hurt their ability to do this, and 33% say it’s neither helped nor hurt.

And there are couple of downsides.

  • Feeling disconnected from co-workers: 49% of those who are working from home at least sometimes say their current work arrangement has made it harder for them to feel connected with their co-workers; 11% say it’s helped them feel connected. A sizable share (39%) say it has neither helped nor hurt.
  • Fewer opportunities for mentorship: 34% say their current work arrangement has hurt their opportunities for mentorship at work. Only 13% say it’s helped. Some 53% say it’s neither helped nor hurt.

Most workers who are working from home at least sometimes say their current work arrangement has neither helped nor hurt these aspects of work:

  • Their chances of getting ahead in their job
  • Whether they’re given important assignments

What if your employer said you couldn’t work from home?

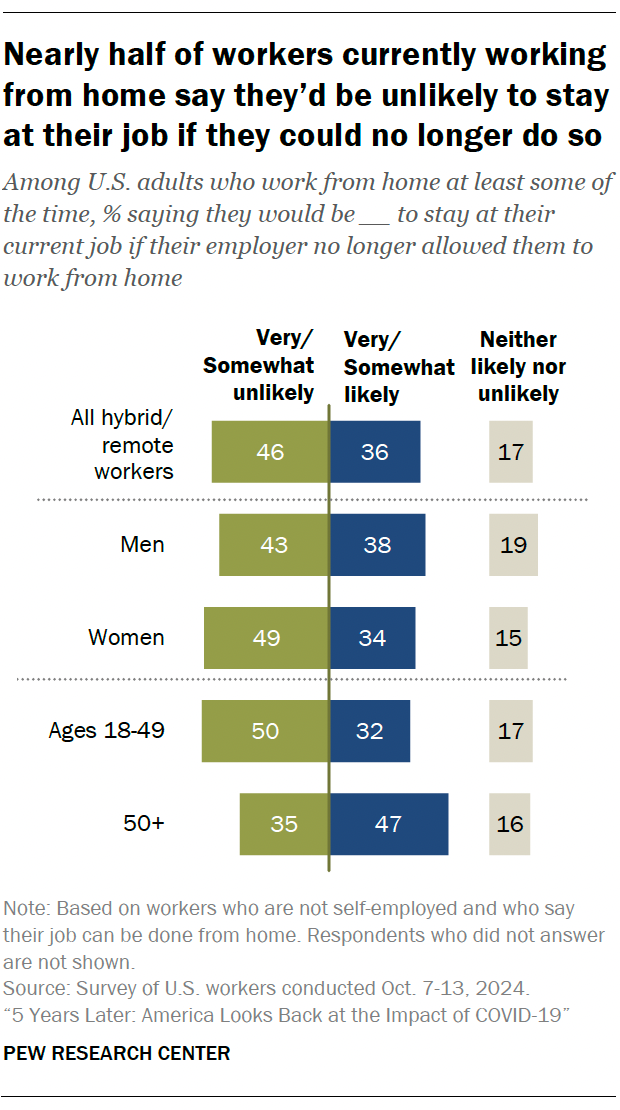
So how attached are workers to their new, hybrid work setup? We asked workers who currently work from home at least some of the time how they would feel if their employer no longer allowed them to do this.

Almost half (46%) say they would be unlikely to stay at their current job if this happened, including 26% who say they’d be very unlikely to stay. A smaller share (36%) say they’d be likely to stay at their job.

Women are somewhat more inclined than men to say they’d be unlikely to stay at their job if they could no longer work from home (49% vs. 43%). And younger workers (ages 18 to 49) are more likely than those 50 and older to say this (50% vs. 35%). 

Are video meetings a good substitute for in-person contact?

The pandemic ushered in a new era for video calling and online conferencing. In October 2024, we asked workers with teleworkable jobs how often they use services like Zoom or Webex as part of their work. More than half (54%) say they use these services often, and an additional 25% say they use them sometimes. About one-in-five (21%) say they hardly ever or never use these services. These shares are largely unchanged from 2022.

There are big differences by education and income. Among those with a teleworkable job, 86% who have a bachelor’s degree or more education say they use these services at least sometimes. This compares with 69% of those with some college or less education. Similarly, 92% of upper-income workers use these services regularly, compared with 76% of middle-income and 62% of lower-income workers.

Most workers who use these services at least sometimes (74%) say they’re a good substitute for in-person contact. A quarter say they are not a good substitute.

What if there was another pandemic?

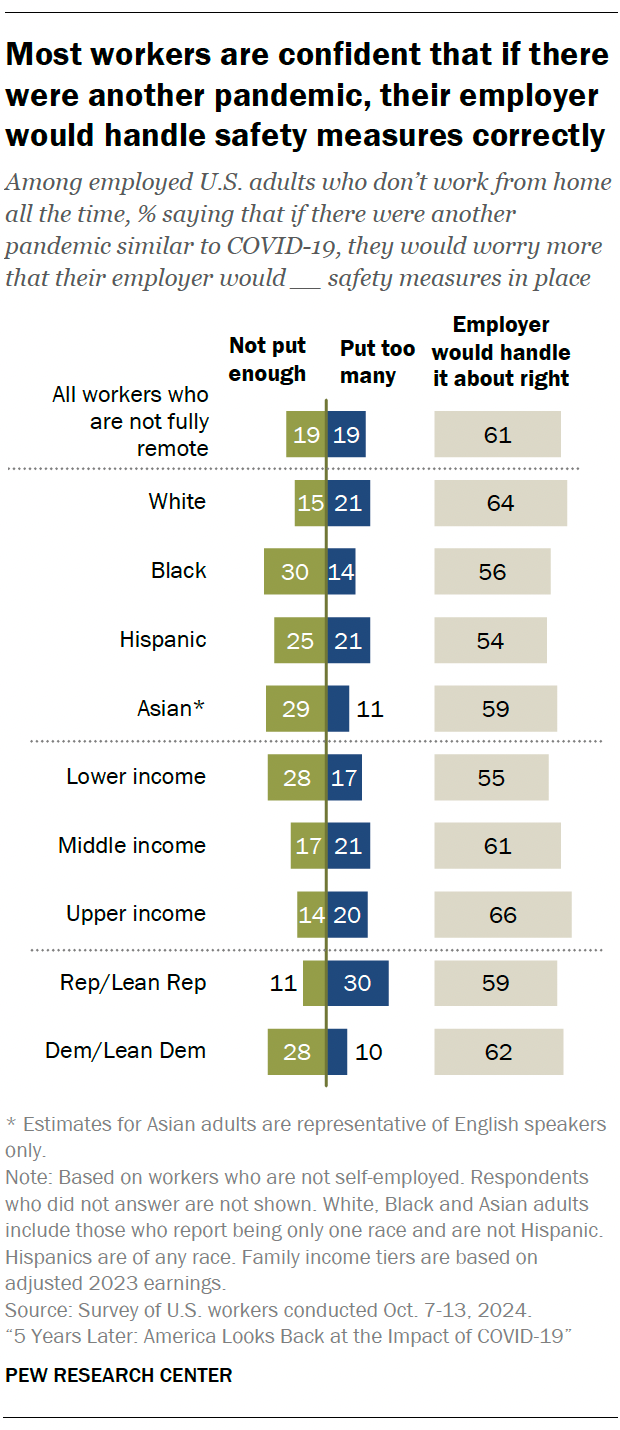
Our October 2024 survey also asked workers who are not self-employed how they would feel about the safety of their workplace if there were another pandemic similar to the COVID-19 pandemic.

Among those who don’t work from home all the time, 61% think their employer would handle safety measures at their workplace about right. Roughly one-in-five (19%) say they worry their employer would not put enough safety measures in place, and the same share say they’d be concerned that their employer would put too many measures in place. 

Some groups of workers are more likely than others to say they worry their employer wouldn’t put enough safety measures in place:

  • Black, Hispanic and Asian workers
  • Lower-income workers
  • Democrats and Democratic leaners

Looking back: The challenges working parents faced

The pandemic presented a special set of challenges for parents. Schools and day care centers shut down for extended periods of time, and many parents had to juggle child care and online schooling with their regular work schedules.

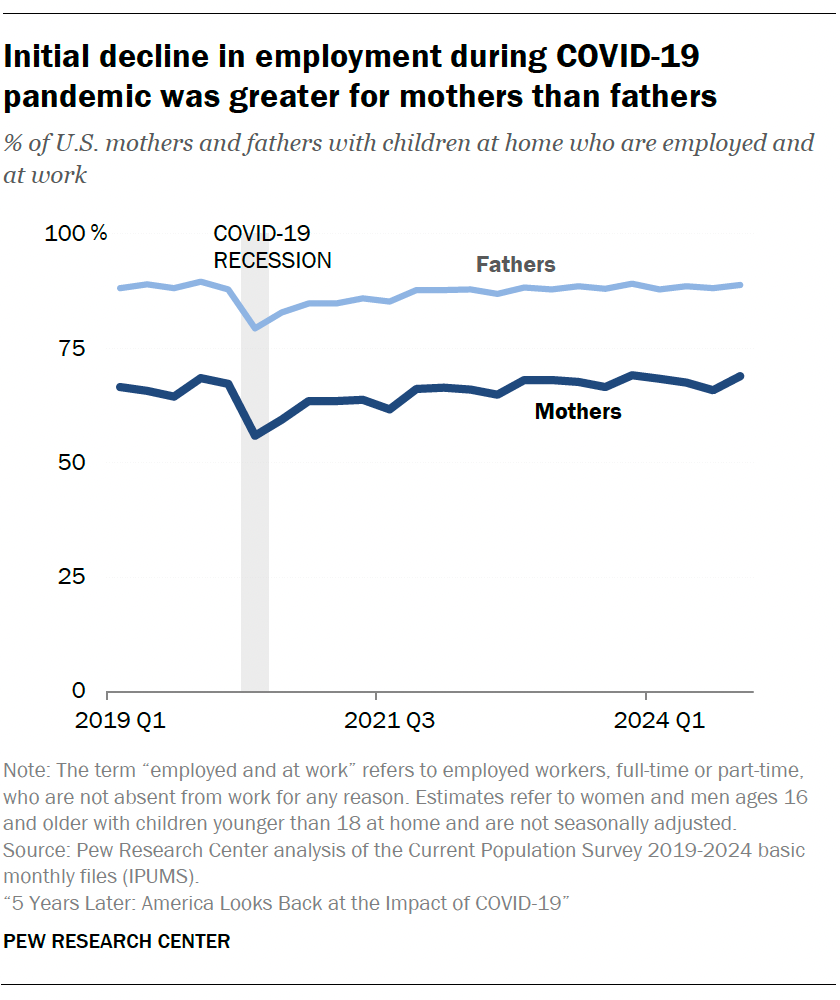
There was a sharp dip in the share of parents – especially mothers – in the labor force during the second quarter of 2020. Employment among moms didn’t fully rebound until the last quarter of 2022.

There was also a decline in the number of hours mothers and fathers were working during the early months of the pandemic. That rebounded more quickly. Here are a few notable findings on what working parents faced during the pandemic.

  • Full-time vs. part-time work: Our surveys found a drop in the share of mothers saying that at this point in their life, working full time would be best for them personally (from 51% in the summer of 2019 to 44% in October 2020). Fathers’ views on this didn’t change.
  • Handling child care: During the first year of the pandemic, a rising share of working parents with children younger than 12 told us child care had been difficult for them to handle. In March 2020, 38% said this, and by October 202o, the share had risen to 52%. We saw this trend among both working mothers and working fathers.
  • Caring for kids while working: In October 2020, we also asked parents how much child care they were doing while working. Among parents who were working from home all or most of the time, 36% of moms and 16% of dads said they had a lot of child care responsibilities when working from home. Not surprisingly, these were many of the same parents who said balancing work and family responsibilities had gotten harder during the pandemic.

What happened when workplaces began to reopen?

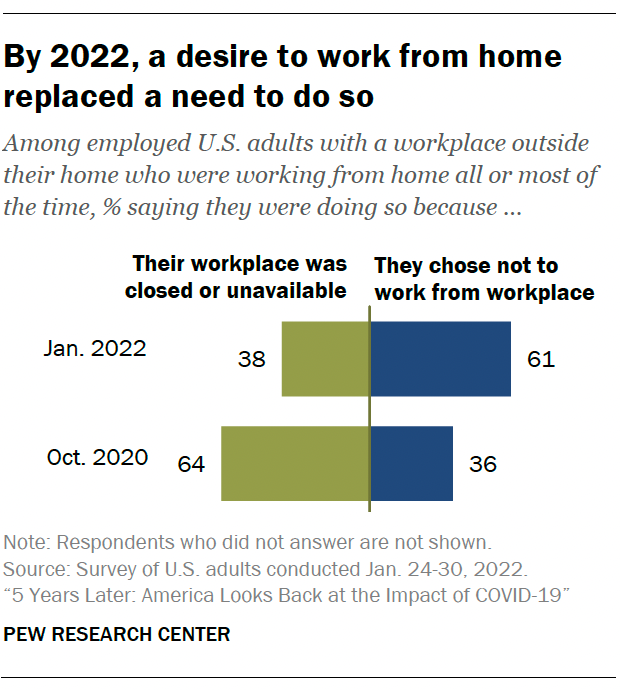
In 2022, we saw an important shift in the reasons people were working from home. As workplaces began to reopen, fewer workers told us they were working from home all or most of the time (compared with late 2020). But among those who were still working from home, a majority said they were doing this because they wanted to – not because their workplace was closed or unavailable.

We also asked workers who had the option of working from home but were choosing to go into the office instead why they didn’t want to work from home more often. Most said it was just their preference or that they felt more productive in the office. Relatively few said they felt pressure to be at their workplace or that they thought they’d have more opportunities for advancement if they showed up at the office.

Concerns over safety in the workplace

Even as life had started to get back to normal, many workers were still concerned about being exposed to the coronavirus at their workplace. In January 2022, about half of all workers who told us they interacted in person with others at work at least sometimes said they were either very (20%) or somewhat (32%) concerned about being exposed. This was virtually unchanged from October 2020.

Some groups were more concerned about this than others:

  • Black and Hispanic workers
  • Younger workers
  • Lower-income workers

Most workers who were not working exclusively from home remained at least somewhat satisfied with the measures their employer had put in place to protect them from being exposed. Black and Hispanic workers were among the least likely to say they were very satisfied.

What about vaccines?

Our 2022 survey found that among adults who weren’t working from home all the time, 22% said their employer had required them to get a COVID-19 vaccine. An additional 47% said their employer had encouraged this but not required it, and 30% said their employer had done neither.

Most workers weren’t in favor of vaccine requirements from their employers. Only 30% said their employer should require vaccines.

There was a big party divide here – 47% of Democrats and independents who lean Democratic thought their employer should require vaccines. This compared with only 10% of Republicans and Republican leaners.

3. How the COVID-19 pandemic affected U.S. religious life

Michael Rotolo contributed to this chapter.

The COVID-19 pandemic had an enormous impact on how religious communities gather for worship.

In a Pew Research Center survey in July 2020, a few months after the coronavirus struck the United States, just 6% of Americans who regularly attend religious services said their house of worship was open to the public and holding services in the same way as before the COVID-19 outbreak. The vast majority reported either that their house of worship was not open for in-person services (31%) or that it was open but with changes to limit the spread of disease (55%).

More than a year and a half later, in March 2022, fewer than half of regular worshippers (43%) reported that their church, synagogue, mosque or other house of worship had completely returned to normal, pre-pandemic operations.

Yet, despite COVID-19’s widespread effects on how houses of worship operate, most Americans say their religious and spiritual lives have not been changed by the pandemic, according to a Center survey conducted in October 2024.

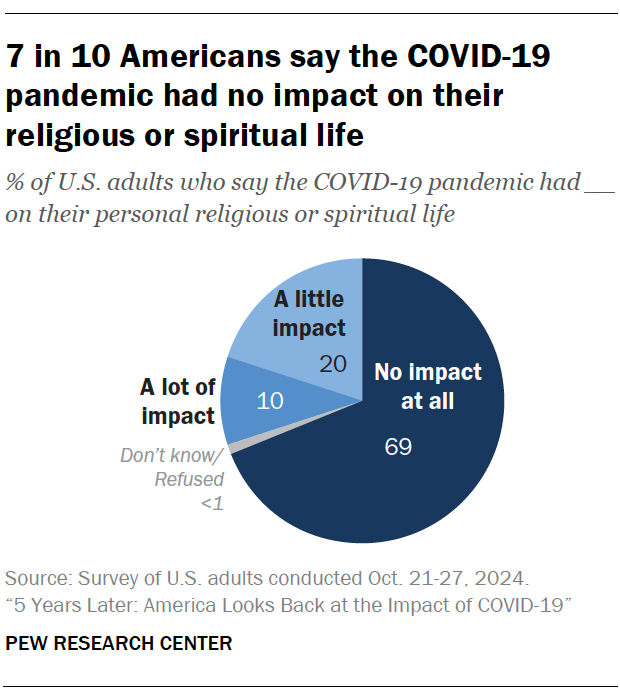
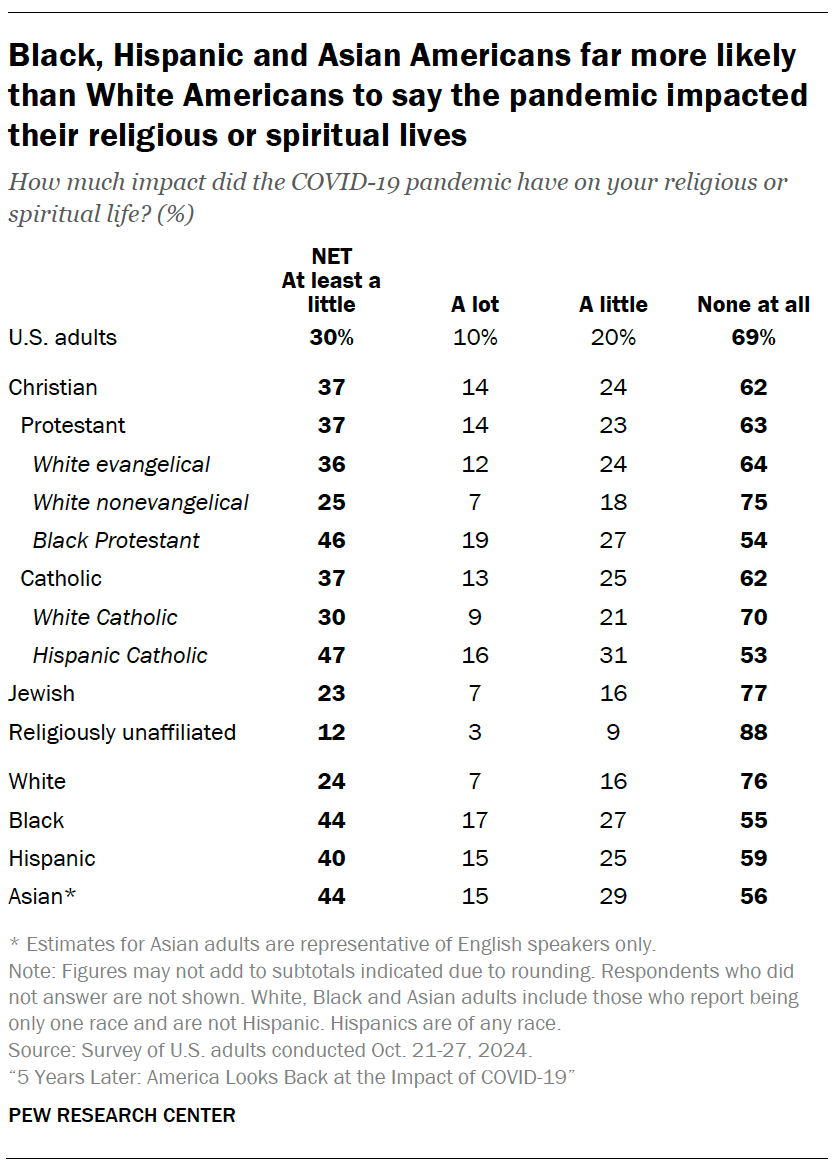
Just 10% of U.S. adults report that the COVID-19 pandemic had a lot of impact on their religious or spiritual lives, while 20% say the pandemic had a little impact. About seven-in-ten Americans (69%) say the pandemic had no impact at all on their religious or spiritual lives.

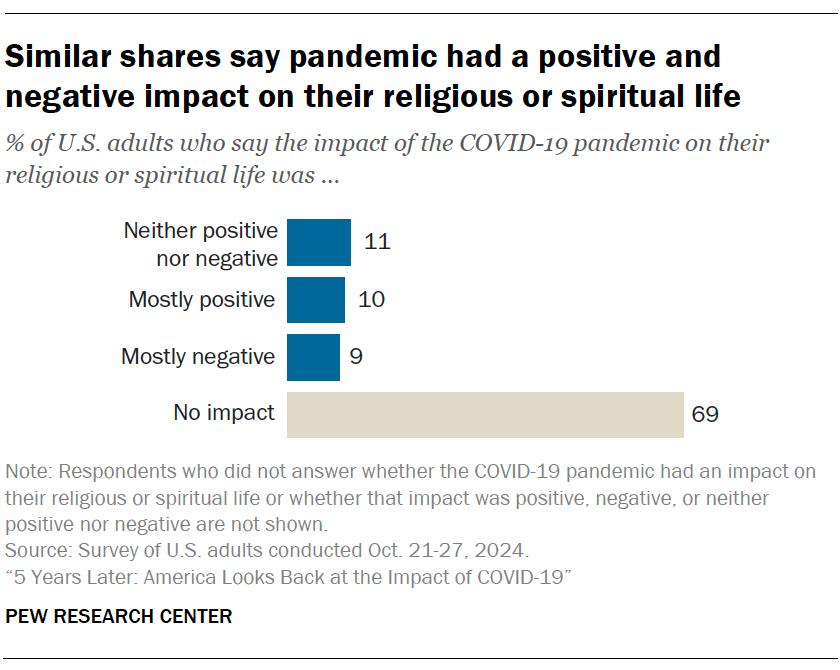
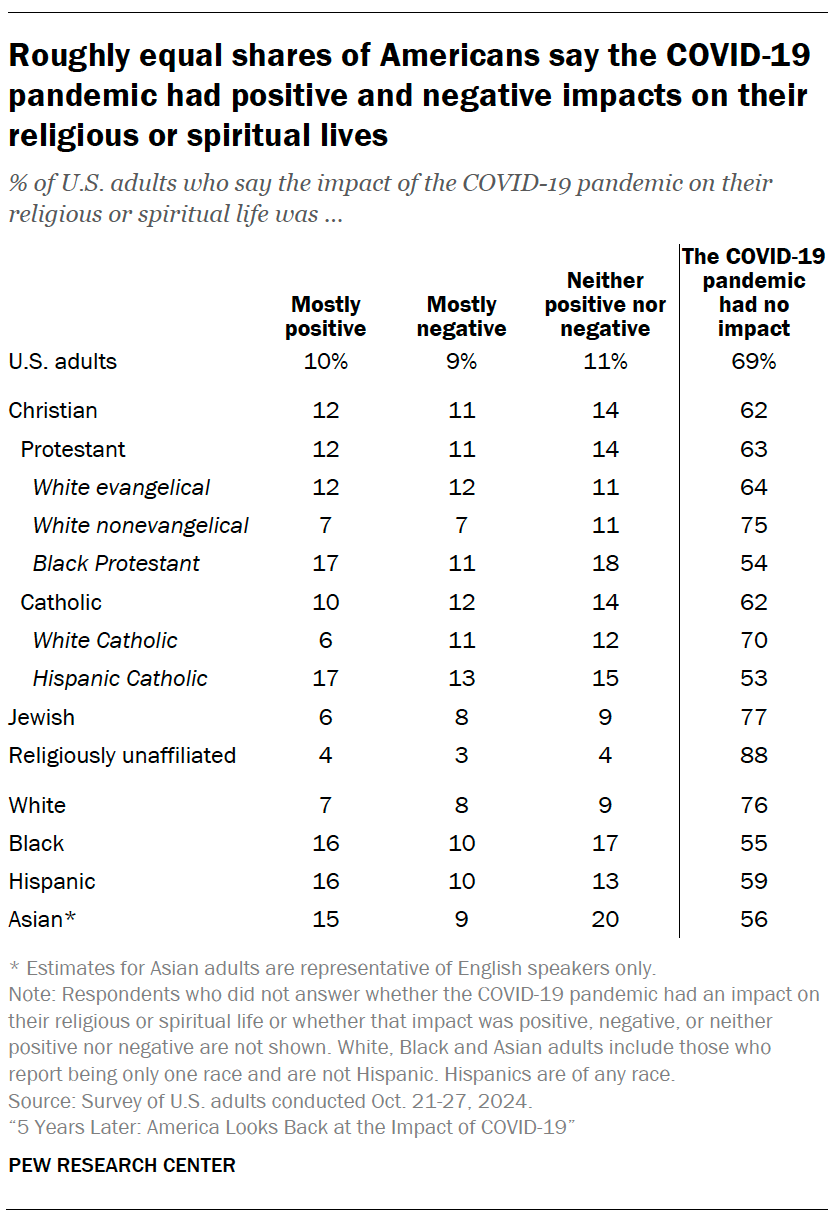
Among those who say their religious or spiritual lives were impacted, the pandemic’s effects appear to be a mixed bag: Roughly equal shares of U.S. adults say the pandemic’s effect on their religious or spiritual lives was mostly positive (10%), mostly negative (9%) and neither positive nor negative (11%).

Trends in religious service participation

Throughout the pandemic, we periodically asked U.S. adults whether they had attended religious services in person in the prior month and, separately, whether they had participated virtually (either by streaming religious services online or by watching them on TV).

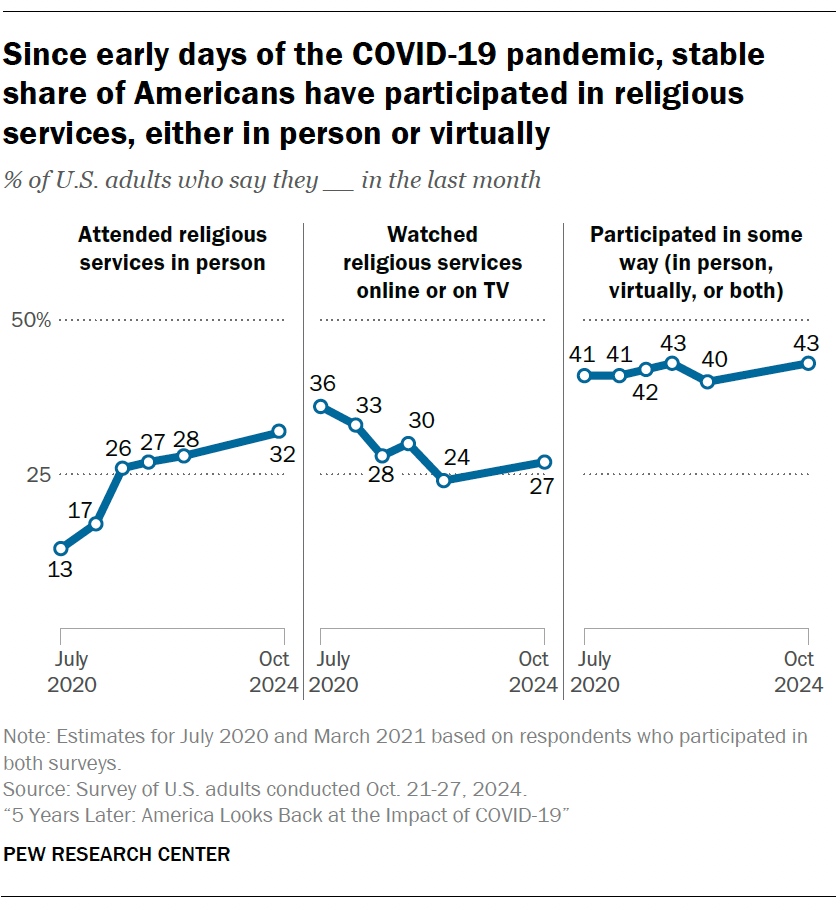
Since the early days of the coronavirus outbreak, the ways in which Americans participate in religious services have changed dramatically, with steadily rising numbers attending in person (and an overall drop in virtual participation) as the pandemic gradually receded.

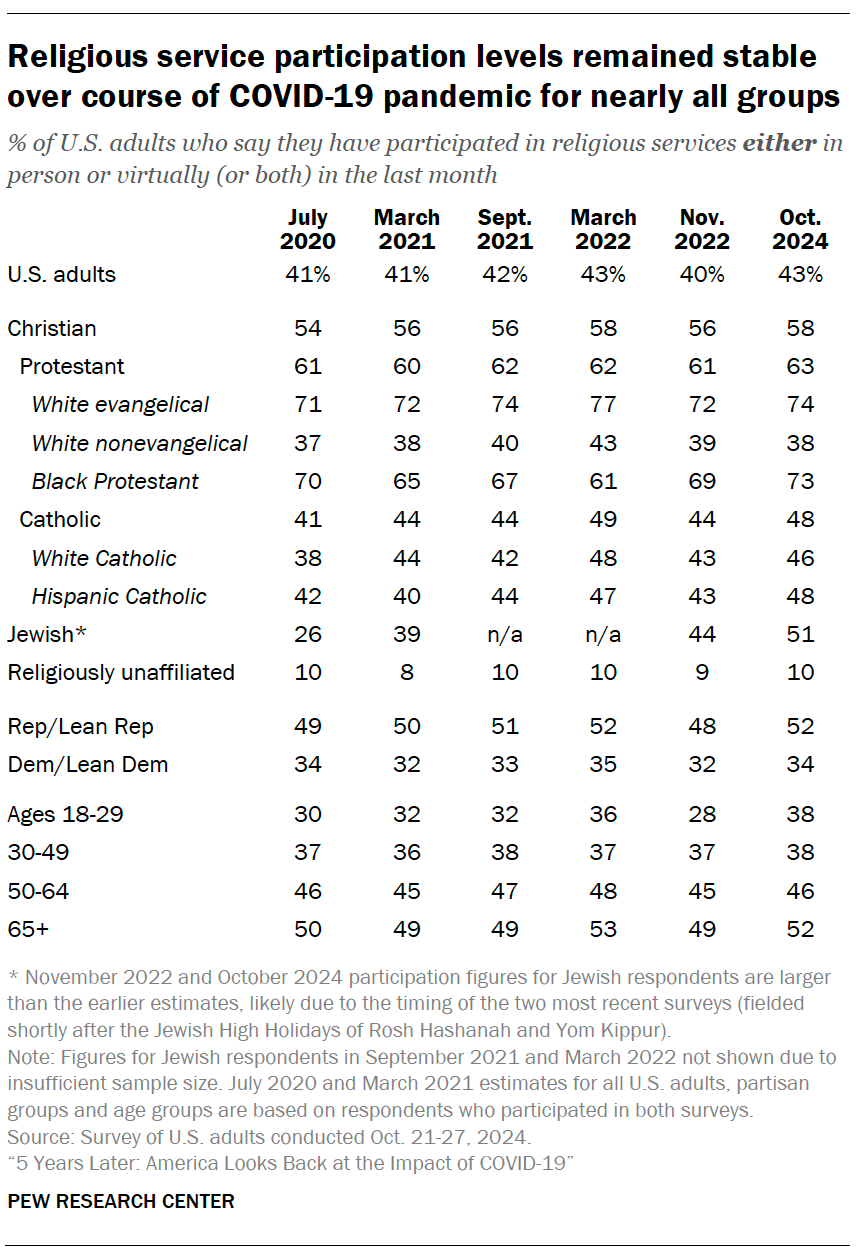
Yet the percentage of U.S. adults taking part in religious services in some way – in person, virtually or both – has remained quite steady. In each of six surveys between 2020 and 2024, about 40% (or slightly more) of respondents reported that they had participated, one way or another, in services during the past month.

In the October 2024 survey, 32% of Americans say they attended religious services in person in the month prior to the survey, and 27% say they watched services online or on TV during the same period – both up slightly from the last time we asked these questions in November 2022.

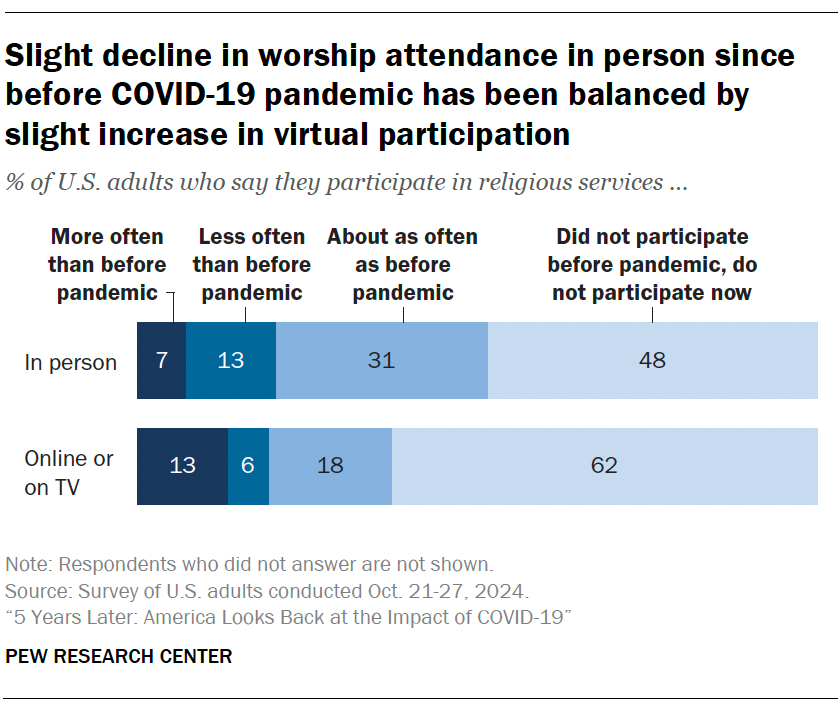
The new survey also asked respondents whether they currently attend religious services in person more often, less often or about as often as they did before the pandemic. A second question asked the same thing about how often they watch services virtually.

The vast majority of U.S. adults say their religious participation habits have not changed:

  • About eight-in-ten say either that they attend services in person about as often as they did before the pandemic (31%) or that they did not attend before the pandemic and still don’t (48%).
  • Roughly eight-in-ten say either that they watch services virtually about as often as they did before the pandemic (18%) or that they didn’t watch services before the pandemic and still don’t (62%).

There may be a small net decrease in in-person attendance: 13% of Americans say they attend in person less often than they did before the pandemic, while just 7% say they now attend more often. But that difference is almost exactly offset by an increase in virtual participation: 13% of Americans say they watch services online more often than they did before the pandemic, while 6% say they now watch less often.

Together, these survey findings paint a picture of remarkable stability in U.S. religious life during a time of widespread upheaval in how houses of worship operate and despite a decades-long decline in religious affiliation and participation.3

The spiritual impact of the pandemic among religious groups and by race/ethnicity

Black Protestants and Hispanic Catholics are more likely than some other large U.S. religious groups to say the pandemic affected their religious or spiritual lives. Nearly half of Black Protestants (46%) and Hispanic Catholics (47%) say the pandemic had at least a little impact on their religious or spiritual lives, compared with 30% of U.S. adults overall.

This appears to reflect a broader racial and ethnic pattern. Black Americans (44%), Hispanic Americans (40%) and Asian Americans (44%) are far more likely than White Americans (24%) to say the pandemic affected their religious or spiritual lives. These differences hold up even in statistical analyses that control for the effects of age, gender, education, political party, ideology, religious affiliation, income and region.

Among those who say their religious or spiritual lives were impacted by the pandemic:

  • Black Protestants are more likely to say the pandemic had a mostly positive impact on them than a mostly negative impact (17% vs. 11%).
  • White Catholics are more likely to say the pandemic had a mostly negative impact than a mostly positive impact on them (11% vs. 6%).

When looking at race and ethnicity more broadly, Black, Hispanic and Asian Americans are somewhat more likely to say the pandemic had a mostly positive than a mostly negative impact on their religious or spiritual lives.

Roughly equal shares of White Americans say the pandemic’s effect on their religious or spiritual lives was mostly positive (7%) and mostly negative (8%).

Trends in religious service participation among religious and demographic subgroups

Throughout the pandemic, overall participation in religious services remained quite stable among most religious subgroups, most age groups and supporters of both major U.S. political parties. There are two notable exceptions:

  • Religious service participation estimates for Jews are higher in the November 2022 and October 2024 surveys than they were in July 2020 and March 2021. This may reflect the timing of those surveys, which were fielded shortly after the Jewish High Holidays of Rosh Hashanah and Yom Kippur, a peak season for synagogue attendance.
  • Among adults under 30, participation in religious services is somewhat higher in the latest survey (38%) than it was in July 2020 (30%). There has been a fair amount of fluctuation in the self-reported rates of attendance of Americans in this age group, which have been as low as 28% and as high as 38% since the start of the pandemic. Throughout this period, however, young adults (ages 18 to 29) have tended to participate in religious services much less often than those 65 and older, which was also the case before the coronavirus outbreak.

4. How COVID-19 impacted Americans’ relationship with technology

Colleen McClain, Olivia Sidoti and Monica Anderson contributed to this chapter.

For many Americans, life in the early days of COVID-19 was lived on screens. Schools pivoted to virtual learning and businesses shuttered or moved online as in-person contact risked spreading the virus.

Not everyone could – or wanted to – avoid in-person interaction. And some did not have the resources or skills to navigate this technological shift. But for others, relying more on technology was the “new normal.”

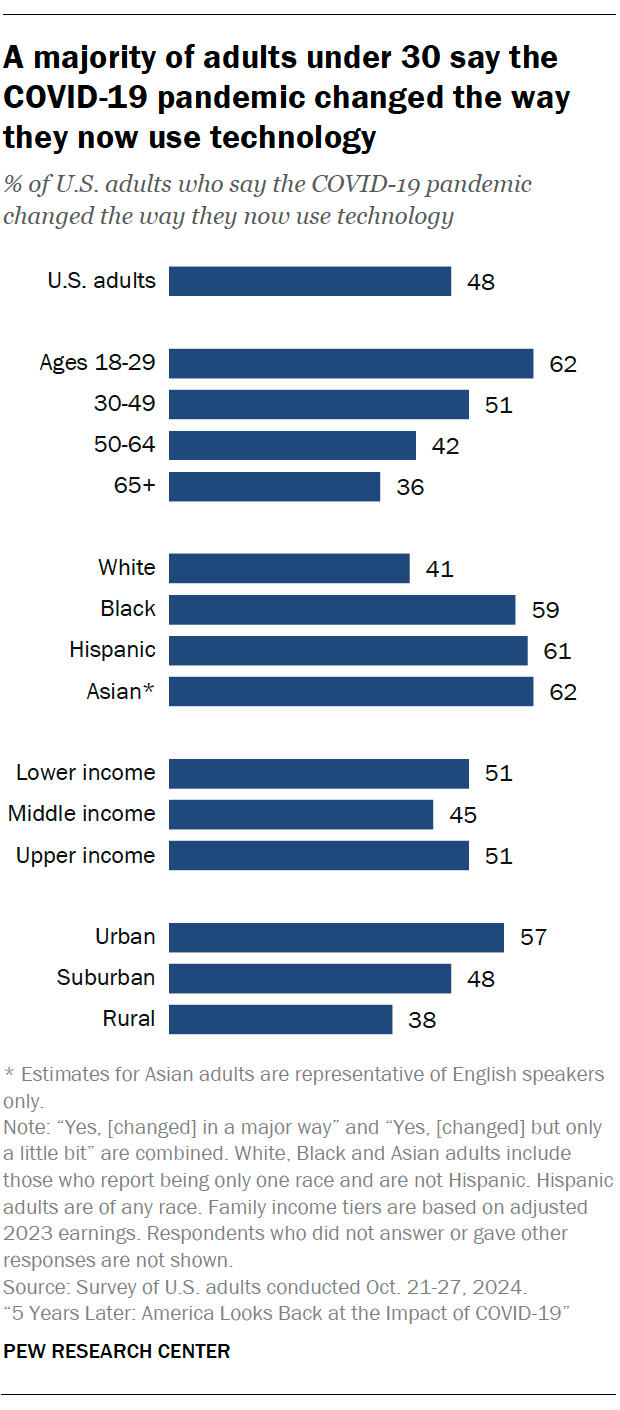
Some of these changes are still with us: 48% of Americans say the COVID-19 pandemic changed the way they now use technology, according to a Pew Research Center survey conducted in October 2024.

This includes 18% who say the pandemic changed their current technology use in a major way.

Like Americans’ pandemic experiences, these changes – and their impacts – are far from one-size-fits-all.

By age

Younger adults stand out – 62% of adults under 30 say the pandemic changed how they now use technology. Still, some older adults say this too:

  • 51% of those ages 30 to 49
  • 42% of those 50 to 64
  • 36% of those 65 and older
By race and ethnicity

About six-in-ten Black, Hispanic and Asian Americans say their technology use is different now due to the pandemic. This compares with about four-in-ten White adults.

By community type

Urban adults are most likely to say their technology use is now different, followed by their suburban counterparts. Rural Americans are least likely to say this.

By household income

There are only modest differences by income. About half of those in lower-income and upper-income households say the pandemic changed their technology use. A slightly smaller share of those in middle-income households say this.

How changing technology use impacted Americans’ lives

Asked how these changes have impacted their lives now, people report a mix of good and bad.

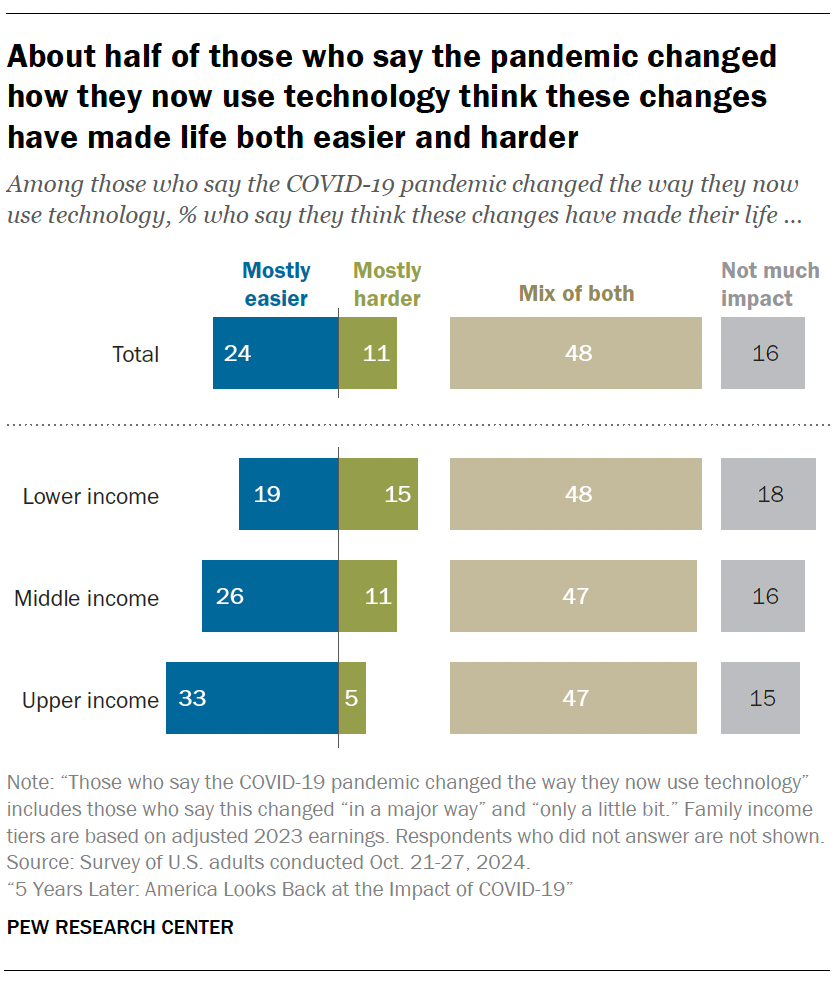
Among those who say COVID-19 changed the way they now use technology:

  • 48% say these changes made their life a mix of both easier and harder
  • 24% say they’ve made life mostly easier
  • 11% say they’ve made life mostly harder
  • 16% say they haven’t had much impact either way
By household income

Those living in upper-income households are most likely to say that these changes have made their life easier. People in lower-income households, by comparison, are most likely to report hardship – though relatively few in each income group say this.

The largest shares across income levels say these changes have had mixed effects – that is, they’ve made life both easier and harder.

By age

Among those who report change, adults ages 65 and older (29%) are more likely than those 50 to 64 (16%) or under 50 (13%) to say these changes didn’t have much impact on them.

Looking back over the pandemic

Our findings reflect the complex – and sometimes challenging – realities of how Americans used technology as the pandemic unfolded. In the sections below, we walk through some of what we’ve learned over the past five years.

Jump to read about the role of the internet in Americans’ lives during the pandemic: The importance of the internet during the COVID-19 pandemic

Jump to read about the digital divides the pandemic shone a spotlight on, including: Affordability | Digital literacy

Jump to read about key stories of tech and daily life during the pandemic: Virtual learning | The “homework gap” | Screen time | Virtual connections and “Zoom fatigue” | Tech and relationships

The importance of the internet during the COVID-19 pandemic

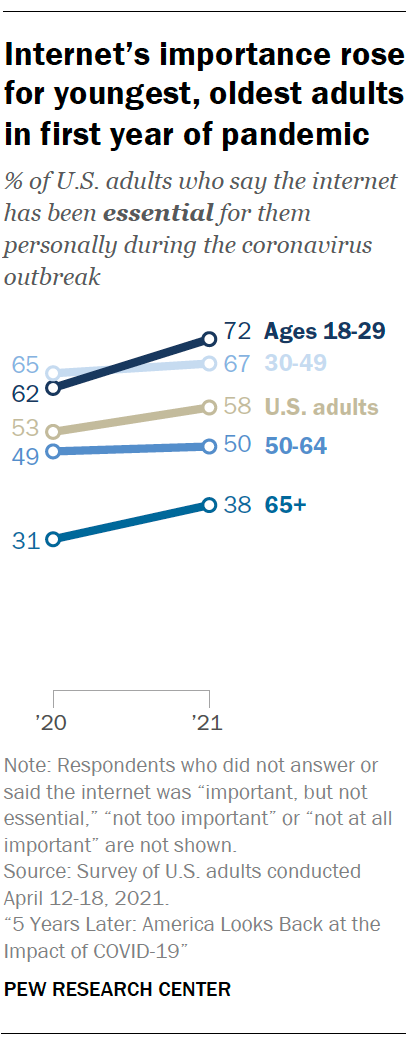
As many daily activities shifted online, Americans’ reliance on the internet ticked up over the first year of the pandemic. By April 2021, 58% of Americans said it had been essential to them during the outbreak, up slightly from 53% a year prior.

The share saying the internet was essential rose for younger and older adults alike. The share of adults under 30 saying it was essential rose from 62% to 72%. Among those 65 and older, it rose from 31% to 38%.

The shares of Americans ages 30 to 64 who said the internet had been essential remained stable over that same period.

All told, 90% of Americans acknowledged at least some importance of the internet in their lives at the pandemic’s one-year mark. (That includes 33% who said it was important, but not essential.)

Digital divides and the pandemic

Not everyone faced this shift with the same resources and skills. COVID-19 thrust long-standing digital divides into the spotlight, from gaps in internet access by age and income to struggles with reliable connections.

Americans saw clear disadvantages for those without internet access during the pandemic.

In 2021, majorities of Americans said those who didn’t have high-speed internet were at a major disadvantage for schoolwork and job searching. About half said the same about getting medical care.

Even for those with access, the pandemic thrust issues of affordability and digital literacy into the spotlight. Some groups were more likely to struggle in these areas than others.

Affordability

Broadband costs have long been an issue for some Americans and are among the main reasons people don’t subscribe.

As the pandemic hit Americans’ pocketbooks, subscribers struggled with costs too. About three-in-ten U.S. home broadband subscribers were at least somewhat worried about being able to pay their internet bills in our April 2020 survey. 

By household income

Lower-income households were hit especially hard: 52% of home broadband subscribers with lower incomes said in April 2020 they worried at least some about paying their internet bills over the next few months. And as the pandemic continued, the government stepped in to help people pay.

Today, affordability remains a concern as inflation looms large. Our fall 2024 survey shows 34% of broadband subscribers worry a lot or some about paying their internet bills. By income, this is:

  • 56% of subscribers in lower-income households
  • 31% in middle-income households
  • 12% in upper-income households

Digital literacy

One of the major narratives from the pandemic centered around whether Americans – especially older Americans – had the digital skills they needed to face a technology-focused reality. From registering for vaccine appointments to ordering food online, everyday tasks suddenly required tech “savviness.”

Our work found that a year into the pandemic in April 2021, 10% of adults said they had little to no confidence using computers, smartphones or other electronic devices to do what they needed to do online. And 26% said they usually needed help setting up new devices or learning how to use them.

By age

Older Americans were far more likely to struggle in these ways. In 2021, 24% of Americans 75 and older said they had little to no confidence in their digital skills, and 66% usually needed help with new devices.

Differences by age persist today. For example, 65% of those 75 and older say they usually need help with device setup, according to the October survey. This compares with smaller shares of adults ages 65 to 74 (48%), 50 to 64 (25%) and under 50 (9%).

Technology and daily life during COVID-19

Even as digital divides played out, the “new normal” some Americans were thrust into extended across areas like school, socializing and work. A year into the pandemic, four-in-ten Americans overall told us they had used technology in new ways (though a larger share hadn’t done this).

Below, we look back on some of the biggest stories about how Americans were using – and sometimes struggling with – technology during this time.

Virtual learning

As schools closed and assignments went virtual, concern that the pandemic would hurt test scores and widen achievement gaps drew widespread attention.

And two years into the pandemic, we found a majority of teens (ages 13 to 17) said they’d prefer in-person schooling post-pandemic, versus online or hybrid learning. Teens also had mixed feelings about how virtual learning was going. About three-in-ten teens (28%) said they were extremely or very satisfied with how their schools had handled it, but a similar share (30%) reported being only a little or not at all satisfied.

At the same time, we found 16% of teens were extremely or very worried they’d fallen behind in school due to pandemic-related disruptions.

A larger share of parents of teens (28%) were highly worried that their teen was falling behind in school due to these disruptions. But this varied by income: 44% of parents whose annual household income was less than $30,000 said they were extremely or very worried, compared with 24% of those living in households earning $75,000 or more a year.

Parents also had mixed feelings about how virtual learning was going overall, though their views were slightly more positive than teens’.

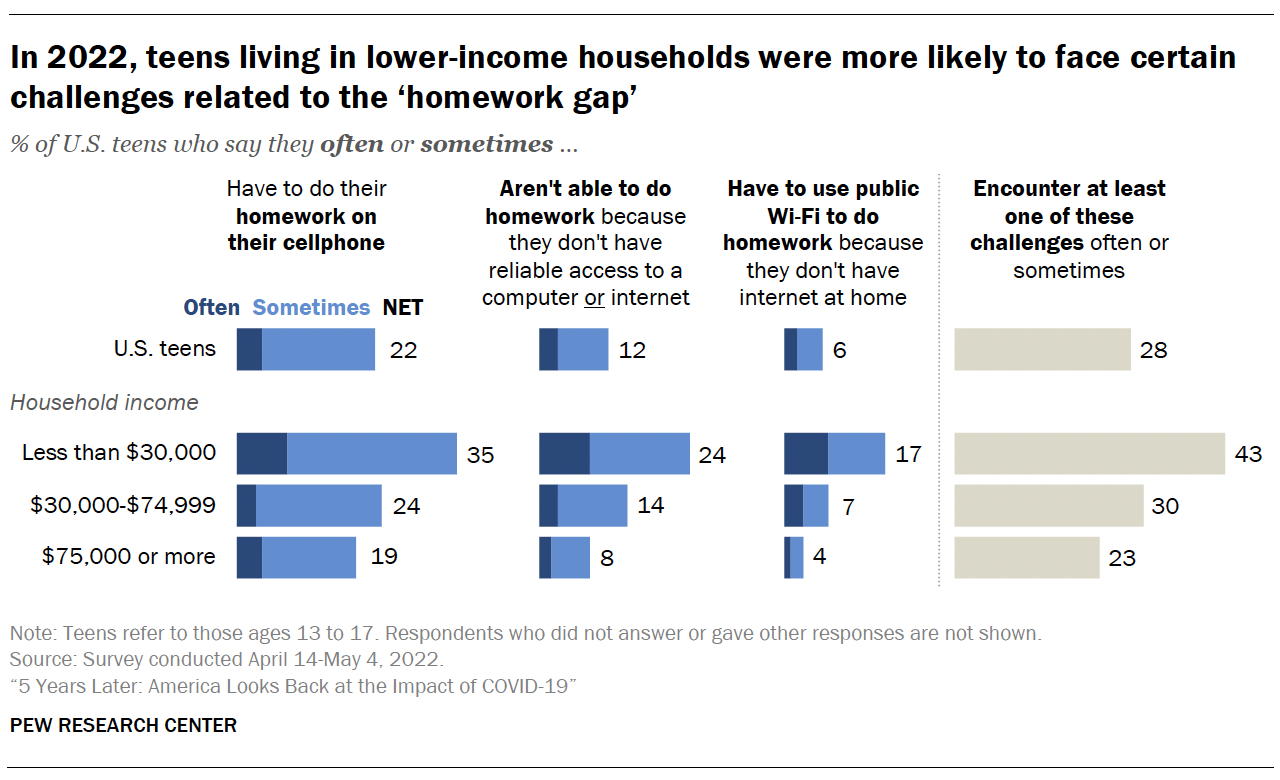
The ‘homework gap’

The same survey found that teens in lower-income households were especially likely to face technology-related barriers to getting schoolwork done – often called the “homework gap.”

One of these was having to do homework on a cellphone. About one-in-five teens said in 2022 they often or sometimes had to do so, and lower-income teens stood out:

  • 35% of teens in households making less than $30,000 annually said they at least sometimes had to use a cellphone for homework.
  • 24% of teens in households making $30,000 to $74,999 said this.
  • 19% of teens in households making $75,000 or more said the same.

About a quarter of teens in lower-income households said they at least sometimes couldn’t complete homework because they lacked reliable access to a computer or the internet. That’s higher than the shares of teens in higher-income households reporting the same. And there’s a similar pattern in using public Wi-Fi to do homework.

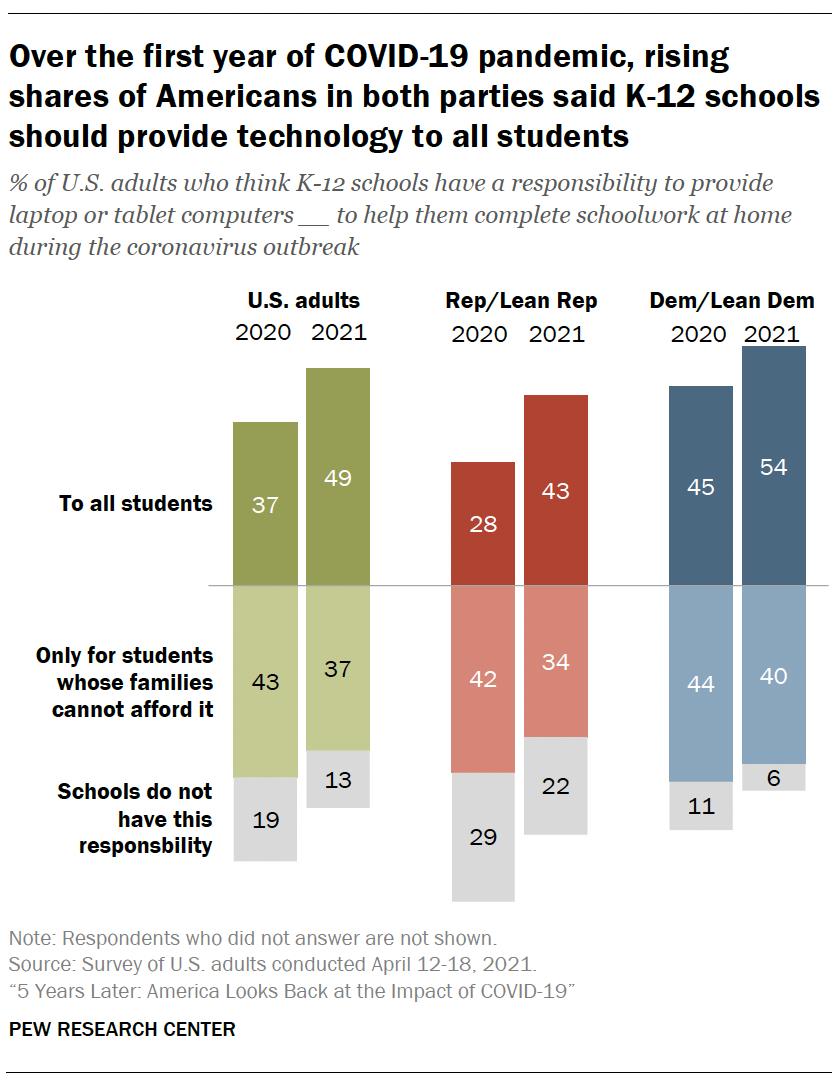
Amid struggles like these, schools scrambled to get technology in the hands of students. 

The share of Americans saying K-12 schools should provide technology to all students during the outbreak rose over the first year of the pandemic:

  • From 37% to 49% among all adults
  • From 28% to 43% among Republicans and GOP-leaning independents
  • From 45% to 54% among Democrats and leaners

At the same time, some called on the federal government to do more to address the digital divide.

And we saw the share of Americans saying the federal government had a responsibility to provide access to high-speed internet to all Americans rise from 28% in 2019 to 43% in 2021, according to a separate 2021 Center study. By comparison, the other views of government responsibility we measured changed little over the same period.

Screen time

In addition to understanding the virtual learning environment, we also tackled a modern conundrum for many parents: screen time.

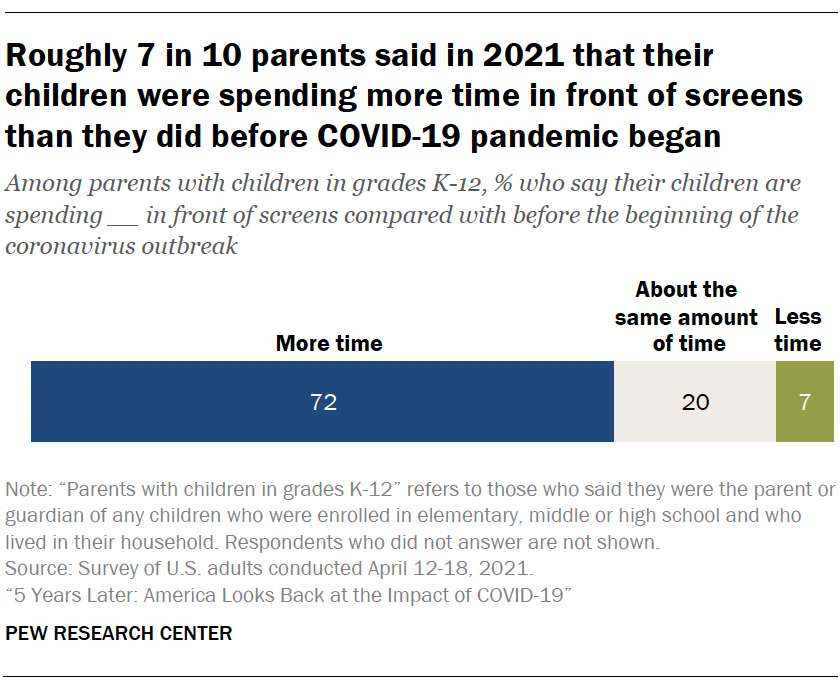
In April 2021, most parents reported their kids’ screen time was on the rise. Overall, 72% of K-12 parents said their child was spending more time in front of screens than before the outbreak. Smaller shares said their child’s screen time was about the same as before (20%) or was less than before the pandemic (7%).

Asked about screen time aside from schoolwork, parents were also more likely to say they softened their rules than to say they became stricter.

  • 39% of K-12 parents said they become less strict about their child’s screen time since the beginning of the pandemic.
  • 18% became more strict.
  • Another 43% said things had stayed about the same.

Today, screen time is still top-of-mind for many parents. And our 2023 and 2024 surveys show teens are as digitally connected as ever.

Virtual connections and ‘Zoom fatigue’

People were finding virtual ways to connect in the early days of the outbreak. Overall, 32% of adults said they had a virtual party or social gathering with friends or family due to the outbreak, according to an April 2020 survey. For adults under 30, that figure rose to roughly half.

From personal calls to remote work, video calls became a mainstay of some Americans’ lives. One year into the pandemic, 81% of U.S. adults said they had talked with others via video calls at some point since it began. This included one-in-five who said they did this daily.

But these calls did have a downside to some users, popularly coined “Zoom fatigue.” Four-in-ten of those who had used video calling in the first year of the pandemic felt worn out from such calls at least sometimes.

Tech and relationships

Behind the video calls and virtual parties was a lingering question: What was all this doing to our relationships?

Many Americans thought connecting via technology left something to be desired. Our March 2020 survey found that a majority thought meeting online or over the phone couldn’t fully substitute for meeting face-to-face.

That was still true when we surveyed Americans again about a year later. About two-thirds (68%) felt that virtual interactions had been useful, but not a replacement for in person contact. In contrast, 17% said that these interactions had been as good as in-person and another 15% said they were not of much use.

For some, the closeness of relationships changed over this first year. But how this played out depended on the relationship in question.

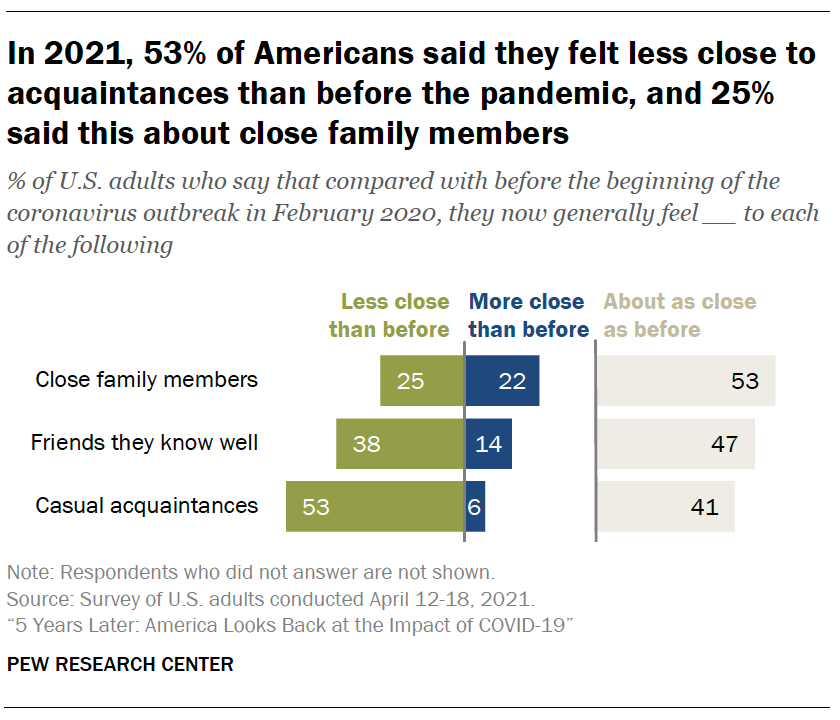
About half of U.S. adults said they felt less close with casual acquaintances. Roughly four-in-ten said the same about friends they know well. And a quarter said this about close family members.
Still, some said relationships grew closer. For example, 22% said they felt closer to family than before the pandemic.

But for close friends and family alike, the largest shares of Americans said these relationships had stayed about the same.

Appendix

Acknowledgments

This report is a collaborative effort based on the input and analysis of the following individuals. Find related reports online at pewresearch.org/topic/coronavirus-disease-covid-19/.

Research

Claudia Deane, Executive Vice President
Michael Lipka, Associate Director, News and Information Research
Alec Tyson, Associate Director, Science and Society Research
Colleen McClain, Senior Researcher
Elisa Shearer, Senior Researcher                        
Eileen Yam, Director, Science and Society Research          
Giancarlo Pasquini, Research Associate
Emma Kikuchi, Research Assistant 
Isabelle Pula, Research Assistant
Brian Kennedy, Senior Researcher
Kim Parker, Director, Social Trends Research
Richard Fry, Senior Researcher
Dana Braga, Research Analyst        
Luona Lin, Research Associate         
Michael Rotolo, Research Associate         
Gregory A. Smith, Senior Associate Director, Religion Research    
Alan Cooperman, Director, Religion Research        
Justin Nortey, Research Analyst               
Monica Anderson, Director, Internet and Technology Research   
Jeffrey Gottfried, Associate Director, Internet and Technology Research 
Olivia Sidoti, Research Assistant            
Michelle Faverio, Research Associate    
Eugenie Park, Research Assistant          
Jacob Liedke, Research Analyst

Editorial and Graphic Design

David Kent, Senior Copy Editor                               
Kaitlyn Radde, Associate Information Graphics Designer
Peter Bell, Associate Director, Digital Design and Production                                                      
Claire Dannenbaum, Assistant Audience Editor

Communications and Web Publishing

Haley Nolan, Communications Manager                             
Sara Atske, Digital Producer

In addition, the project benefited greatly from the guidance of the Pew Research Center methodology team: Courtney Kennedy, Andrew Mercer, Ashley Amaya, Dorene Asare-Marfo, Dana Popky, Anna Brown and Arnold Lau.

Methodology

The American Trends Panel survey methodology

Overview

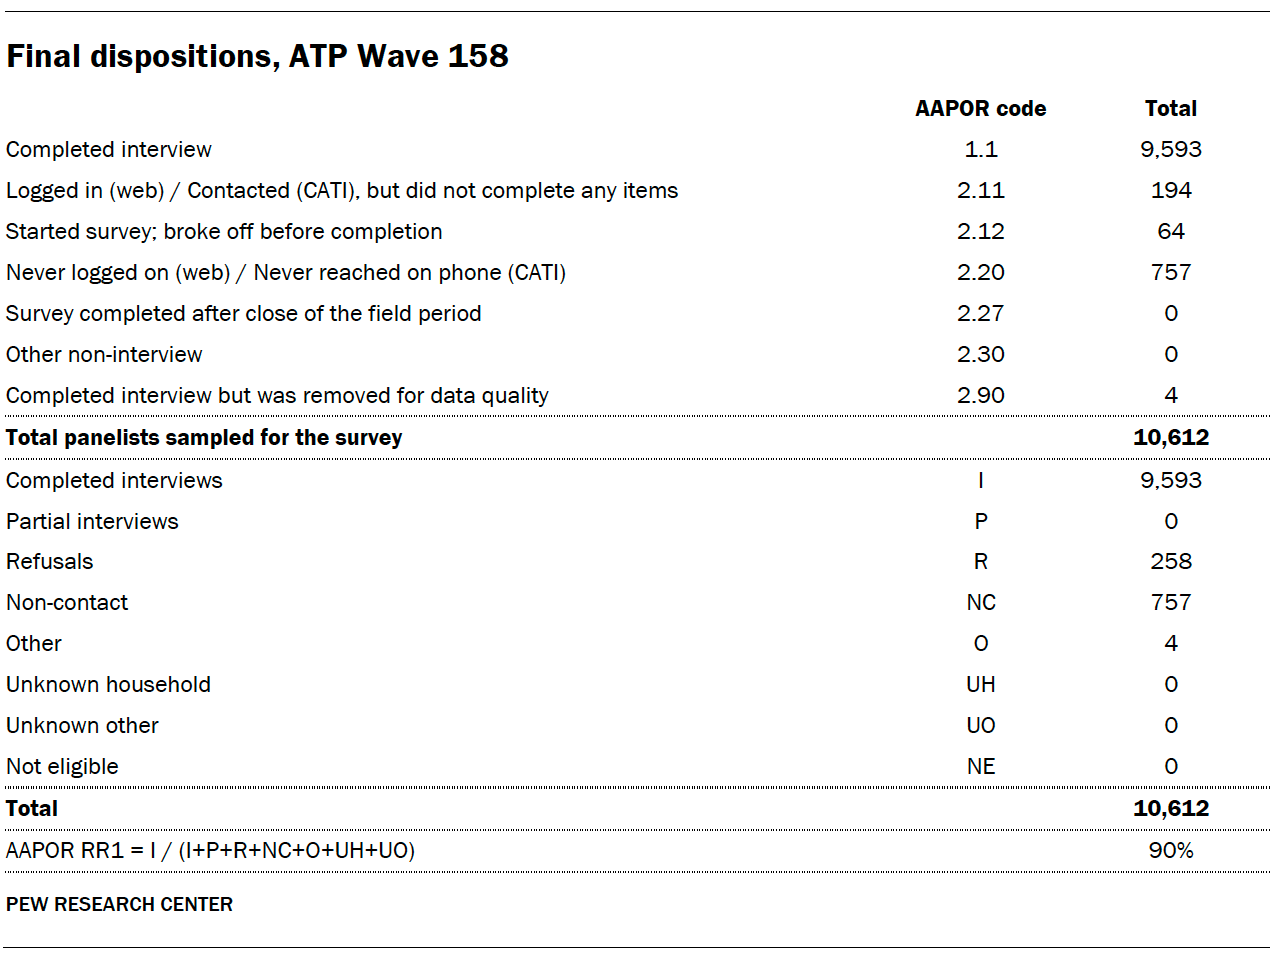
Data in this report comes from Wave 158 of the American Trends Panel (ATP), Pew Research Center’s nationally representative panel of randomly selected U.S. adults. The survey was conducted from Oct. 21 to Oct. 27, 2024. A total of 9,593 panelists responded out of 10,612 who were sampled, for a survey-level response rate of 90%.

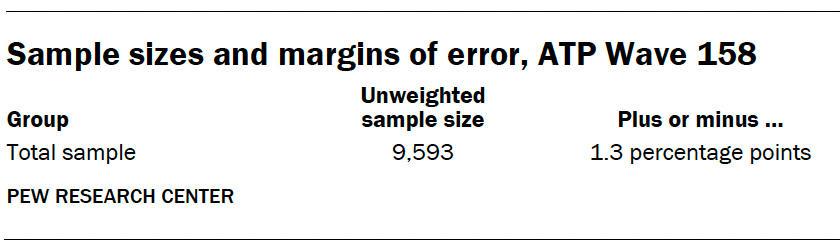
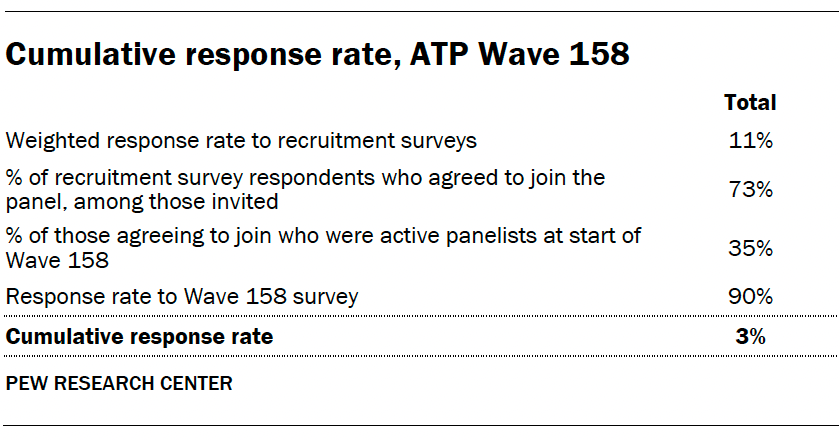
The cumulative response rate accounting for nonresponse to the recruitment surveys and attrition is 3%. The break-off rate among panelists who logged on to the survey and completed at least one item is 1%. The margin of sampling error for the full sample of 9,593 respondents is plus or minus 1.3 percentage points.

SSRS conducted the survey for Pew Research Center via online (n=9,320) and live telephone (n=273) interviewing. Interviews were conducted in both English and Spanish.

To learn more about the ATP, read “About the American Trends Panel.”

(Note: Data on workplace experiences comes from ATP Wave 157, a survey of 5,273 U.S. workers conducted Oct. 7-13, 2024. Read the full methodology of that survey here.)

Panel recruitment

Since 2018, the ATP has used address-based sampling (ABS) for recruitment. A study cover letter and a pre-incentive are mailed to a stratified, random sample of households selected from the U.S. Postal Service’s Computerized Delivery Sequence File. This Postal Service file has been estimated to cover 90% to 98% of the population.4 Within each sampled household, the adult with the next birthday is selected to participate. Other details of the ABS recruitment protocol have changed over time but are available upon request.5 Prior to 2018, the ATP was recruited using landline and cellphone random-digit-dial surveys administered in English and Spanish.

A national sample of U.S. adults has been recruited to the ATP approximately once per year since 2014. In some years, the recruitment has included additional efforts (known as an “oversample”) to improve the accuracy of data for underrepresented groups. For example, Hispanic adults, Black adults and Asian adults were oversampled in 2019, 2022 and 2023, respectively.

Sample design

The overall target population for this survey was noninstitutionalized persons ages 18 and older living in the United States. All active panel members were invited to participate in this wave.

Questionnaire development and testing

The questionnaire was developed by Pew Research Center in consultation with SSRS. The web program used for online respondents was rigorously tested on both PC and mobile devices by the SSRS project team and Pew Research Center researchers. The SSRS project team also populated test data that was analyzed in SPSS to ensure the logic and randomizations were working as intended before launching the survey.

Incentives

All respondents were offered a post-paid incentive for their participation. Respondents could choose to receive the post-paid incentive in the form of a check or gift code to Amazon.com, Target.com or Walmart.com. Incentive amounts ranged from $5 to $20 depending on whether the respondent belongs to a part of the population that is harder or easier to reach. Differential incentive amounts were designed to increase panel survey participation among groups that traditionally have low survey response propensities.

Data collection protocol

The data collection field period for this survey was Oct. 21 to Oct. 27, 2024. Surveys were conducted via self-administered web survey or by live telephone interviewing. 

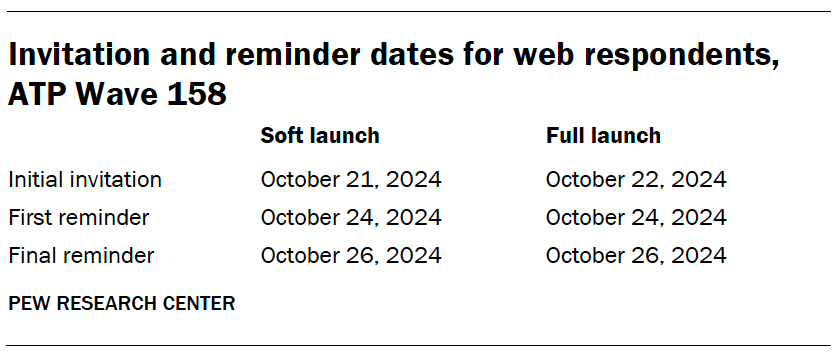
For panelists who take surveys online:6 Postcard notifications were mailed to a subset on Oct. 21.7 Survey invitations were sent out in two separate launches: soft launch and full launch. Sixty panelists were included in the soft launch, which began with an initial invitation sent on Oct. 21. All remaining English- and Spanish-speaking sampled online panelists were included in the full launch and were sent an invitation on Oct. 22.

Panelists participating online were sent an email invitation and up to two email reminders if they did not respond to the survey. ATP panelists who consented to SMS messages were sent an SMS invitation with a link to the survey and up to two SMS reminders.

For panelists who take surveys over the phone with a live interviewer: Prenotification postcards were mailed on Oct. 18. Soft launch took place on Oct. 21 and involved dialing until a total of seven interviews had been completed. All remaining English- and Spanish-speaking sampled phone panelists’ numbers were dialed throughout the remaining field period. Panelists who take surveys via phone can receive up to six calls from trained SSRS interviewers.

Data quality checks

To ensure high-quality data, Center researchers performed data quality checks to identify any respondents showing patterns of satisficing. This includes checking for whether respondents left questions blank at very high rates or always selected the first or last answer presented. As a result of this checking, four ATP respondents were removed from the survey dataset prior to weighting and analysis.

Weighting

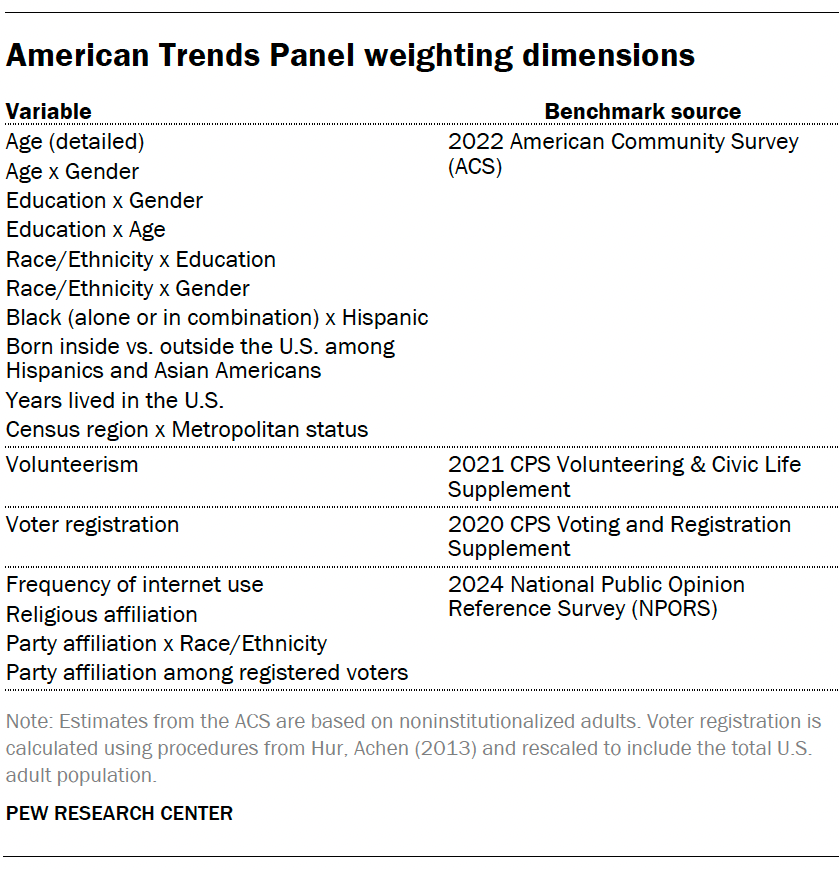
The ATP data is weighted in a process that accounts for multiple stages of sampling and nonresponse that occur at different points in the panel survey process. First, each panelist begins with a base weight that reflects their probability of recruitment into the panel. These weights are then calibrated to align with the population benchmarks in the accompanying table to correct for nonresponse to recruitment surveys and panel attrition. If only a subsample of panelists was invited to participate in the wave, this weight is adjusted to account for any differential probabilities of selection.
Among the panelists who completed the survey, this weight is then calibrated again to align with the population benchmarks identified in the accompanying table and trimmed at the 1st and 99th percentiles to reduce the loss in precision stemming from variance in the weights. Sampling errors and tests of statistical significance take into account the effect of weighting.

The following table shows the unweighted sample size and the error attributable to sampling that would be expected at the 95% level of confidence for different groups in the survey.

Sample sizes and sampling errors for other subgroups are available upon request. In addition to sampling error, one should bear in mind that question wording and practical difficulties in conducting surveys can introduce error or bias into the findings of opinion polls.

Dispositions and response rates

A note about the Asian adult sample

This survey includes a total sample size of 548 Asian adults. The sample primarily includes English-speaking Asian adults and, therefore, may not be representative of the overall Asian adult population. Despite this limitation, it is important to report the views of Asian adults on the topics in this study. As always, Asian adults’ responses are incorporated into the general population figures throughout this report.

How family income tiers are calculated

Family income data reported in this study is adjusted for household size and cost-of-living differences by geography. Panelists then are assigned to income tiers that are based on the median adjusted family income of all American Trends Panel members. The process uses the following steps:

  1. First, panelists are assigned to the midpoint of the income range they selected in a family income question that was measured on either the most recent annual profile survey or, for newly recruited panelists, their recruitment survey. This provides an approximate income value that can be used in calculations for the adjustment.
  2. Next, these income values are adjusted for the cost of living in the geographic area where the panelist lives. This is calculated using price indexes published by the U.S. Bureau of Economic Analysis. These indexes, known as Regional Price Parities (RPP), compare the prices of goods and services across all U.S. metropolitan statistical areas as well as non-metro areas with the national average prices for the same goods and services. The most recent available data at the time of the annual profile survey is from 2022. Those who fall outside of metropolitan statistical areas are assigned the overall RPP for their state’s non-metropolitan area.
  3. Family incomes are further adjusted for the number of people in a household using the methodology from Pew Research Center’s previous work on the American middle class. This is done because a four-person household with an income of say, $50,000, faces a tighter budget constraint than a two-person household with the same income.
  4. Panelists are then assigned an income tier. “Middle-income” adults are in families with adjusted family incomes that are between two-thirds and double the median adjusted family income for the full ATP at the time of the most recent annual profile survey. The median adjusted family income for the panel is roughly $74,100. Using this median income, the middle-income range is about $49,400 to $148,200. Lower-income families have adjusted incomes less than $49,400 and upper-income families have adjusted incomes greater than $148,200 (all figures expressed in 2023 dollars and scaled to a household size of three). If a panelist did not provide their income and/or their household size, they are assigned “no answer” in the income tier variable.

Two examples of how a given area’s cost-of-living adjustment was calculated are as follows: the Pine Bluff metropolitan area in Arkansas is a relatively inexpensive area, with a price level that is 19.1% less than the national average. The San Francisco-Oakland-Berkeley metropolitan area in California is one of the most expensive areas, with a price level that is 17.9% higher than the national average. Income in the sample is adjusted to make up for this difference. As a result, a family with an income of $40,400 in the Pine Bluff area is as well off financially as a family of the same size with an income of $58,900 in San Francisco.