U.S. Workers Are More Worried Than Hopeful About Future AI Use in the Workplace
About a third of workers say AI use will lead to fewer job opportunities for them in the long run; chatbots seen as more helpful for speeding up work than improving its quality
BYLuona Lin and Kim Parker
About Pew Research Center
Pew Research Center is a nonpartisan, nonadvocacy fact tank that informs the public about the issues, attitudes and trends shaping the world. It does not take policy positions. The Center conducts public opinion polling, demographic research, computational social science research and other data-driven research. It studies politics and policy; news habits and media; the internet and technology; religion; race and ethnicity; international affairs; social, demographic and economic trends; science; research methodology and data science; and immigration and migration. Pew Research Center is a subsidiary of The Pew Charitable Trusts, its primary funder.
U.S. Workers Are More Worried Than Hopeful About Future AI Use in the Workplace
About a third of workers say AI use will lead to fewer job opportunities for them in the long run; chatbots seen as more helpful for speeding up work than improving its quality
How we did this
Pew Research Center conducted this analysis to understand how American workers see the use of AI in the workplace and their own experiences with AI in their jobs.
For this analysis, we surveyed 5,273 U.S. adults who are employed part time or full time and who have only one job or have more than one but consider one of them to be their primary job. The survey was conducted Oct. 7-13, 2024.
Everyone who took part is a member of the Center’s American Trends Panel (ATP), a group of people recruited through national, random sampling of residential addresses who have agreed to take surveys regularly. The survey was conducted either online or by telephone with a live interviewer. The survey is weighted to be representative of the U.S. adult population by gender, race, ethnicity, partisan affiliation, education and other factors. Read more about the ATP’s methodology.
References to workers include those who are employed part time or full time and who have only one job or have more than one but consider one of them to be their primary job.
References to college graduates or people with a college degree comprise those with a bachelor’s degree or more education. “Some college” includes those with an associate degree and those who attended college but did not obtain a degree. “High school” refers to those who have a high school diploma or its equivalent, such as a General Educational Development (GED) certificate.
“Middle income” is defined here as two-thirds to double the median annual family income for panelists on the American Trends Panel. “Lower income” falls below that range; “upper income” falls above it. Read the methodology for more details.
Artificial intelligence is not new to the workplace, but the debut of ChatGPT just over two years ago ushered in an era of rapid expansion. American workers have mixed feelings about how this technology will affect jobs in the future.
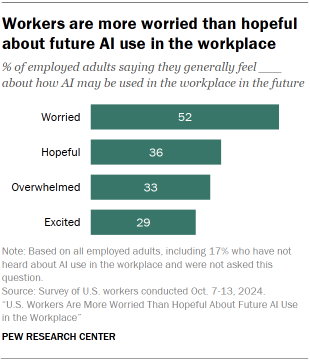
About half of workers (52%) say they’re worried about the future impact of AI use in the workplace, and 32% think it will lead to fewer job opportunities for them in the long run, according to a new Pew Research Center survey.
And while 36% of workers also say they feel hopeful about how AI may be used in the workplace in the future, a similar share (33%) say they feel overwhelmed.
About one-in-six workers (16%) say at least some of their work is currently done with AI. And an additional 25% say, while they’re not using it much now, at least some of their work can be done with AI. These shares are significantly higher among young workers and workers with at least a bachelor’s degree.
The survey, conducted Oct. 7-13 among 5,273 employed U.S. adults, explores how workers see the use of AI in the workplace overall, as well as their own experience with AI in their jobs.1
Key findings
Few workers think AI use in the workplace will improve their job prospects in the long run.
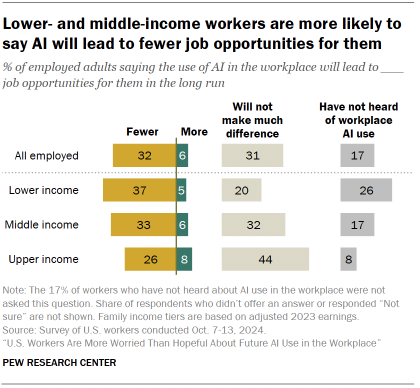
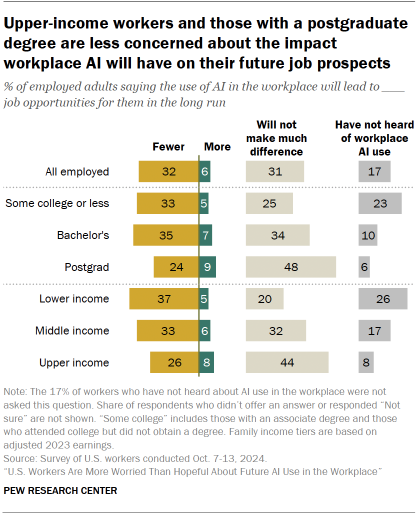
Only 6% of workers say workplace AI use will lead to more job opportunities for them in the long run. About a third (32%) say it will lead to fewer opportunities for them, and 31% say it will not make much difference. Some 17% of workers have not heard about the use of AI in the workplace.
Workers with lower and middle incomes are more likely than those with upper incomes to say workplace AI use will lead to fewer job opportunities for them. In turn, upper-income workers are more likely to say workplace AI use won’t make much difference in their job opportunities.
Across industries, workers in information and technology and those working in banking, finance, accounting, real estate or insurance are among the most likely to say that the use of AI will lead to more job opportunities for them in the long run.
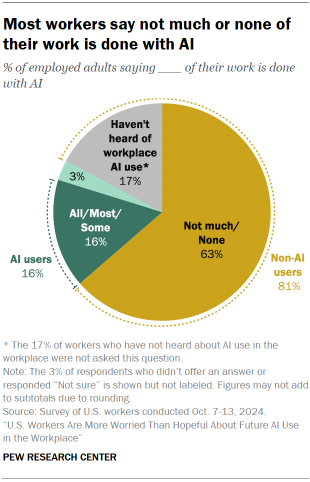
Most American workers (63%) say they don’t use AI much or at all in their job.
About one-in-six workers (16%) are AI users, meaning at least some of their work is done with AI.
Another 81% of workers could be considered non-AI users. This includes 63% who say they don’t use AI much or at all in their job and 17% who have not heard of AI use in the workplace.2
AI users are generally younger: 73% are under 50, compared with 65% among non-AI users. And about half of AI users (51%) have at least a bachelor’s degree, compared with 39% of non-AI users.
Among non-AI users, 31% say at least some of their work can be done with AI. The share saying this is larger among workers younger than 50 and among those with at least a bachelor’s degree.
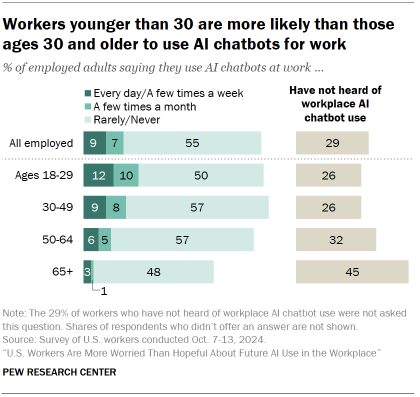
About one-in-ten workers say they use AI chatbots – such as ChatGPT, Gemini or Copilot – at work every day or a few times a week; 7% use them a few times a month.
A majority of workers (55%) say they rarely or never use them.
Across age groups, workers ages 18 to 29 are the most likely to use AI chatbots at work at least a few times a month (23% vs. 17% or less among older age groups).
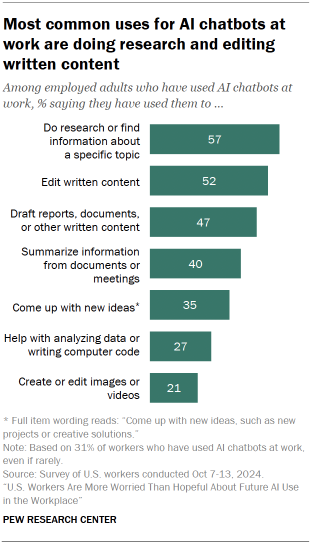
Among those who’ve used AI chatbots for work, the most common uses are research (57% have used them for this), editing written content (52%) and drafting written content (47%).
Workers who have used AI chatbots are more likely to find them helpful in speeding up their work than in improving its quality.
Four-in-ten workers who have used AI chatbots for work say these tools have been extremely or very helpful in allowing them to do things more quickly. A smaller share (29%) say they have been equally helpful in improving the quality of their work.
Workers ages 18 to 49 are more likely than those ages 50 and older to find AI chatbots highly helpful in allowing them to do things more quickly (44% vs. 29%) and in improving the quality of their work (31% vs. 23%).
Overall, most American workers (63%) say they don’t use AI much or at all in their job. About one-in-six workers (16%) say at least some of their work is done with AI, including just 2% who say all or most of their work is done with AI. Some 17% of workers have not heard about AI use in the workplace.
Majorities of workers across age groups and education levels say that not much or none of their work is done with AI.
Workers younger than 50 are somewhat more likely to use AI in their job (17% vs. 13% of those ages 50 and older), as are workers with a bachelor’s degree when compared with those who have less education (20% vs. 13%).
Among non-AI users – those who say they don’t use AI at work much or at all, or have not heard about this – about a third (31%) say at least some of their work can be done with AI. This includes 4% who say all or most of their work can be done with AI.
Still, a sizable share of non-AI users (45%) say that not much or none of their job can be done with AI. And another 21% of non-AI users have not heard of AI use in the workplace.
Perceptions about how much work can be done with AI vary by age and education. Non-AI users ages 18 to 49 are more likely than those ages 50 and older to say that at least some of their work can be done with AI (34% vs. 25%).
Non-AI users with at least a bachelor’s degree are twice as likely as those with some college or less education to say the same (44% vs. 22%).
How are AI users and non-AI users different?
A profile of AI users compared with non-AI users reveals key demographic differences between these groups.
Compared with non-AI users, AI users are:
Younger: 73% are under 50, compared with 65% of non-AI users.
More educated: 51% have at least a bachelor’s degree, including 22% who have a postgraduate degree. By comparison, 39% of non-AI users have at least a bachelor’s degree, while the majority (61%) have some college or less education.
More likely to reside in urban areas (29% vs. 24% among non-AI users) and less likely to live in rural areas (16% vs. 22%).
More likely to work in jobs that involves data processing (63% vs. 42%).
More likely to be working in the banking, finance, accounting, real estate or insurance industry (10% vs. 6%) and in the information and technology industry (12% vs. 5%).
Have workers received job training related to AI?
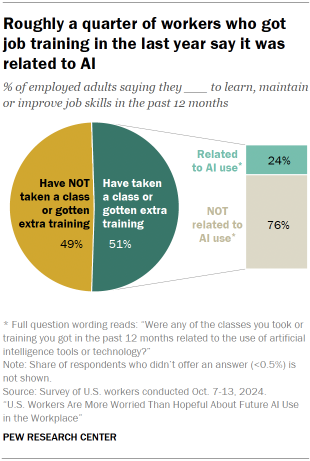
At the time of our October 2024 survey, about half of workers (51%) said they had taken a class or gotten extra training for work in the prior 12 months. Within this group, about a quarter (24%) say a training they took was related to AI use.
To the extent that there are differences by age or education, these are very modest. Most workers across age and education groups say the training they took was not related to AI use.
Understanding and knowing how to use AI tools does not rank high among workers when they’re asked about which skills are most important to be successful in today’s economy. About a third of all employed adults (35%) say AI skills are extremely or very important for workers today. AI users are more likely than non-AI users to say this (50% vs 33%).
By comparison, interpersonal skills, written and spoken communication, critical thinking, and basic computer skills are considered extremely or very important by about 70% of workers or more, regardless of their AI use.
2. Workers’ views of AI use in the workplace
To explore workers’ views of AI use in the workplace, we asked about their broad attitudes on how AI may be used in the future and how it will affect their job opportunities in the long run.
How workers feel about AI use in the workplace
About half of workers (52%) say they feel worried about how AI may be used in the workplace in the future.
Just over a third (36%) say they feel hopeful about this, 33% feel overwhelmed and 29% feel excited.
Workers’ views vary by age, education and income levels. Even so, feelings of worry tend to cut across these groups.
Differences by age
Workers ages 18 to 49 are more likely than those ages 50 and older to say they feel excited about future AI use (32% vs. 24%).
About half of workers or more across age groups say they feel worried about the use of AI in the workplace, but the youngest workers are most likely to say they feel overwhelmed: 40% of workers ages 18 to 29 say this, compared with about three-in-ten among older age groups.
Differences by education
Workers with at least a bachelor’s degree are more likely than those with less education to say they’ve heard of workplace AI use (91% vs. 76%). They are also more likely to say they feel each of the following about its future use:
Worried (57% vs. 48%)
Hopeful (44% vs. 30%)
Overwhelmed (36% vs. 30%)
Excited (38% vs. 23%)
Differences by income
Across income levels, workers in the upper income tier are the most likely to say they feel:
Hopeful (45% vs. 35% among middle-income workers and 30% among lower-income workers)
Excited (39% vs. 28% and 24%)
Differences across income groups on feelings of worry and overwhelm are either small or not statistically significant.
Workers’ views on how AI will affect their job opportunities
Relatively few workers think that workplace AI use will improve their job prospects in the future – only 6% say it will lead to more opportunities for them in the long run.
About a third (32%) say it will lead to fewer opportunities for them, and a similar share (31%) say it will not make much difference. Some 13% say they are not sure, and 17% have not heard of workplace AI use.
A couple of key demographic groups stand out as being less concerned about the impact AI will have on their future job prospects.
Workers with a postgraduate degree: 24% say AI use will lead to fewer job opportunities for them in the future. This compares with 35% of workers who have a bachelor’s degree and 33% of those with some college or less education. About half of workers with a postgraduate degree (48%) say this won’t make much difference for them.
Upper-income workers: 26% say AI use will lead to fewer job opportunities for them in the future. Larger shares of middle-income (33%) and lower-income (37%) workers say the same. A substantial share of upper-income workers (44%) say this won’t make much of a difference for them.
Differences by AI use
AI users are more likely than non-AI users to say workplace AI use will impact their job prospects – leading to either fewer (42% vs. 30%) or more (15% vs. 5%) job opportunities for them in the long run.
In turn, non-AI users are more likely than AI users to say AI will not make much difference in their job opportunities (33% vs. 28%). Among non-AI users, 21% have not heard about AI use in the workplace.
Differences by industry
Not surprisingly, workers’ views on how AI will affect their own job opportunities in the long run differ across industries. Workers in the following industries are among the most likely to say AI use will lead to more job opportunities for them:
Information and technology (16% say this)
Banking, finance, accounting, real estate or insurance (11%)
3. Workers’ experience with AI chatbots in their jobs
In addition to asking workers how they feel about and use AI in the workplace generally, we asked a series of questions specifically about workplace use of AI chatbots – such as ChatGPT, Gemini or Copilot.
A majority of workers (55%) rarely or never use AI chatbots at work. An additional 29% haven’t heard of this at all.
Relatively small shares of workers say they have used AI chatbots for work: 9% say they use them every day or a few times a week, and 7% say they use them a few times a month.
The groups who are more likely to have heard of AI chatbots are also more likely to use these tools:
Workers ages 18 to 29 (23% say they use them at least a few times a month)
Workers with a postgraduate degree (26%)
How workers are using AI chatbots in their jobs
The most common uses for AI chatbots among workers who’ve used them at work include:
Doing research or finding information about a specific topic (57% of workers who have used AI chatbots at work say they’ve done this)
Editing written content (52%)
Drafting reports, documents, or other written content (47%)
Four-in-ten or fewer say they’ve used AI chatbots at work to:
Summarize information from documents or meetings (40%)
Come up with new ideas, such as new projects or creative solutions (35%)
Help with analyzing data or writing computer code (27%)
Create or edit images or videos (21%)
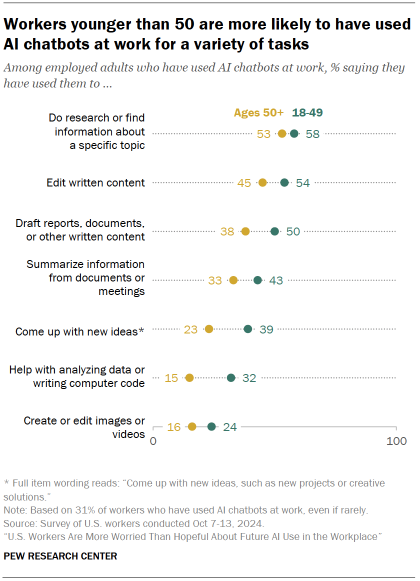
Workers ages 18 to 49 are more likely than those ages 50 and older to say they have used AI chatbots for almost all the work tasks we asked about.
For example, among workers who have used AI chatbots at work, half of those ages 18 to 49 say they have used them to draft reports, documents or other written content, while only 38% of those ages 50 and older say they have done this.
Similarly, 39% of workers 18 to 49 who have used AI chatbots say they have used them to come up with new ideas. This compares with 23% of those ages 50 and older.
The only exception is on doing research or finding information about a specific topic. The shares of younger and older workers who say they have used AI chatbots to do this are not statistically different (58% and 53%).
Among workers who have used AI chatbots for work, those with at least a bachelor’s degree are more likely than those with some college or less education to say they have used AI chatbots for some of the work tasks we asked about. There are significant differences by education when it comes to doing research or finding information about a specific topic; editing written content; drafting reports, documents or other written content; and coming up with new ideas.
Do workers find AI chatbots helpful for their work?
Among workers who have used AI chatbots for work, 40% say these tools have been extremely or very helpful in allowing them to do things more quickly. A smaller share (29%) say they have been highly helpful in improving the quality of their work.
Views on this differ by age, education and how frequently workers use AI chatbots.
Workers ages 18 to 49 are more likely than those ages 50 and older to find AI chatbots highly helpful in allowing them to do things more quickly (44% vs. 29%) and in improving the quality of their work (31% vs. 23%).
Workers with at least a bachelor’s degree are also more likely than those with some college or less education to find AI chatbots highly helpful in allowing them to do things more quickly (44% vs. 34%).
However, in terms of improving work quality, about the same shares of workers across education levels say AI chatbots have been highly helpful: 28% among those with some college or less education and 29% among those with at least a bachelor’s degree.
Workers who use AI chatbots at least a few times a month are much more likely than workers who rarely use them to find these tools helpful. Among workers who use AI chatbots regularly, 54% say they’ve been highly helpful in speeding up their work and 41% say they’ve been highly helpful in improving their work quality. Smaller shares among workers who rarely use AI chatbots say the same (25% and 16%, respectively).
Why some workers have not used AI chatbots for work
Most workers (69%) do not use AI chatbots at work. This includes 40% who have never used them for work and 29% who have not heard about AI chatbot use in the workplace.
Among workers who are not AI chatbot users, 36% say a major reason they have never used AI chatbots for work is that there isn’t any use for them in their job.
About one-in-five (22%) say a major reason they haven’t used AI chatbots is because they’re not interested in using them. Smaller shares say they do not know how to use AI chatbots (10%) or their employer does not allow the use of AI chatbots (9%).3
Within this group of non-users, workers ages 50 and older are more likely than those ages 18 to 49 to say they haven’t used AI chatbots for work because they don’t know how to use them (13% vs. 8%). There aren’t significant differences by age for the rest of the items.
Do employers encourage use of AI chatbots for work?
Among all workers who are not self-employed, half say their employer neither encourages nor discourages the use of AI chatbots at work. Some 12% say their employer encourages it, and 8% say their employer discourages it.
The shares of workers who say their employer encourages the use of AI chatbots for work are small across most industries, but the following stand out for sizable shares of workers saying their employer encourages it:
Information and technology (36% say this)
Banking, finance, accounting, real estate or insurance (24%)
Professional, scientific and technical services (19%)
Acknowledgments
This report is a collaborative effort based on the input and analysis of the following individuals. Find related reports online at pewresearch.org/topic/economy-work.
Kim Parker, Director of Social Trends Research Juliana Horowitz, Senior Associate Director, Research Luona Lin, Research Associate Rachel Minkin, Research Associate Kiley Hurst, Research Analyst Dana Braga, Research Analyst Reem Nadeem, Digital Producer Peter Bell, Design Director John Carlo Mandapat, Information Graphics Designer Anna Jackson, Editorial Assistant Julia O’Hanlon, Communications Manager Maya Pottiger, Communications Associate
In addition, the project benefited greatly from the guidance of the Pew Research Center methodology team: Courtney Kennedy, Andrew Mercer, Ashley Amaya, Dorene Asare-Marfo, Dana Popky, Anna Brown and Arnold Lau.
The project also benefited greatly from the input from the following Pew Research Center staff: Monica Anderson, Jefferey Gottfried, Colleen McClain, Eileen Yam, Alec Tyson, Sono Shah and Samuel Bestvater.
Methodology
The American Trends Panel survey methodology
Overview
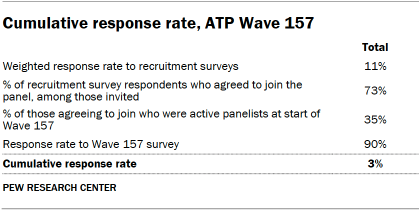
Data in this report comes from Wave 157 of the American Trends Panel (ATP), Pew Research Center’s nationally representative panel of randomly selected U.S. adults. The survey was conducted Oct. 7-13, 2024, among a sample of ATP members who indicated that they currently work either full or part time for pay. A total of 5,395 panelists responded out of 6,490 who were sampled, for a survey-level response rate of 90% (AAPOR RR3).
The cumulative response rate accounting for nonresponse to the recruitment surveys and attrition is 3%. The break-off rate among panelists who logged on to the survey and completed at least one item is 1%. The margin of sampling error for the full sample of 6,490 respondents is plus or minus 1.7 percentage points.
SSRS conducted the survey for Pew Research Center via online (n=5,334) and live telephone (n=61) interviewing. Interviews were conducted in both English and Spanish.
Since 2018, the ATP has used address-based sampling (ABS) for recruitment. A study cover letter and a pre-incentive are mailed to a stratified, random sample of households selected from the U.S. Postal Service’s Computerized Delivery Sequence File. This Postal Service file has been estimated to cover 90% to 98% of the population.4 Within each sampled household, the adult with the next birthday is selected to participate. Other details of the ABS recruitment protocol have changed over time but are available upon request.5 Prior to 2018, the ATP was recruited using landline and cellphone random-digit-dial surveys administered in English and Spanish.
A national sample of U.S. adults has been recruited to the ATP approximately once per year since 2014. In some years, the recruitment has included additional efforts (known as an “oversample”) to improve the accuracy of data for underrepresented groups. For example, Hispanic adults, Black adults and Asian adults were oversampled in 2019, 2022 and 2023, respectively.
Sample design
The overall target population for this survey was noninstitutionalized people ages 18 and older living in the United States, who work for pay either full time or part time. All active panel members who reported working either full or part-time for pay in ATP Wave 150 (fielded in July 2024), were invited to participate in this wave. Respondents were again asked about their current employment situation at the beginning of this survey, and those who indicated that they were not currently working for pay were screened out.
Questionnaire development and testing
The questionnaire was developed by Pew Research Center in consultation with SSRS. The web program used for online respondents was rigorously tested on both PC and mobile devices by the SSRS project team and Pew Research Center researchers. The SSRS project team also populated test data that was analyzed in SPSS to ensure the logic and randomizations were working as intended before launching the survey.
Incentives
All respondents were offered a post-paid incentive for their participation. Respondents could choose to receive the post-paid incentive in the form of a check or gift code to Amazon.com, Target.com or Walmart.com. Incentive amounts ranged from $5 to $20 depending on whether the respondent belongs to a part of the population that is harder or easier to reach. Differential incentive amounts were designed to increase panel survey participation among groups that traditionally have low survey response propensities.
Data collection protocol
The data collection field period for this survey was Oct. 7-13, 2024. Surveys were conducted via self-administered web survey or by live telephone interviewing.
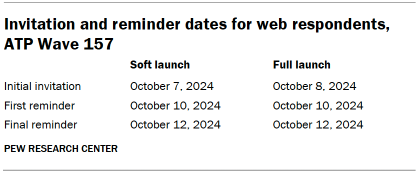
For panelists who take surveys online:6 Postcard notifications were mailed to a subset on Oct. 7.7 Survey invitations were sent out in two separate launches: soft launch and full launch. Sixty panelists were included in the soft launch, which began with an initial invitation sent on Oct. 7. All remaining English- and Spanish-speaking sampled online panelists were included in the full launch and were sent an invitation on Oct. 8.
Panelists participating online were sent an email invitation and up to two email reminders if they did not respond to the survey. ATP panelists who consented to SMS messages were sent an SMS invitation with a link to the survey and up to two SMS reminders.
For panelists who take surveys over the phone with a live interviewer: Prenotification postcards were mailed on Oct. 4. Soft launch took place on Oct. 7 and involved dialing until a total of three interviews had been completed. All remaining English- and Spanish-speaking sampled phone panelists’ numbers were dialed throughout the remaining field period. Panelists who take surveys via phone can receive up to six calls from trained SSRS interviewers.
Data quality checks
To ensure high-quality data, Center researchers performed data quality checks to identify any respondents showing patterns of satisficing. This includes checking for whether respondents left questions blank at very high rates or always selected the first or last answer presented. As a result of this checking, two ATP respondents were removed from the survey dataset prior to weighting and analysis.
Weighting
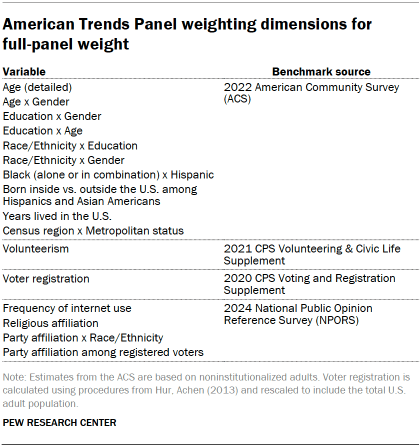
The ATP data is weighted in a process that accounts for multiple stages of sampling and nonresponse that occur at different points in the panel survey process. First, each panelist begins with a base weight that reflects their probability of recruitment into the panel. Weighting parameters were based on the full set of ATP members who were potentially eligible for inclusion in the sample prior to any screening. First, the base weights for all ATP members who responded to the 2024 Annual Profile Survey (Wave 150) were calibrated to align with the population benchmarks in the accompanying table to create a full-panel weight.
The full-panel weight for panelists who completed the survey was calibrated to align with the distribution for the entire sample (including those who did not respond to Wave 157) on the following dimensions: age, gender, education, race/ethnicity, years lived in the U.S., volunteerism, voter registration, frequency of internet use, religion, party affiliation, census region and metropolitan status. Additionally, respondents’ employment status (whether they work full or part time for pay) as reported in Wave 157 was weighted to match the distribution from Wave 150. These weights were then trimmed at the 1st and 99th percentiles to reduce the loss in precision stemming from variance in the weights. Sampling errors and tests of statistical significance take into account the effect of weighting.
The following table shows the unweighted sample sizes and the error attributable to sampling that would be expected at the 95% level of confidence for different groups in the survey.
Sample sizes and sampling errors for other subgroups are available upon request. In addition to sampling error, one should bear in mind that question wording and practical difficulties in conducting surveys can introduce error or bias into the findings of opinion polls.
Dispositions and response rates
How family income tiers are calculated
Family income data reported in this study is adjusted for household size and cost-of-living differences by geography. Panelists then are assigned to income tiers that are based on the median adjusted family income of all American Trends Panel members. The process uses the following steps:
First, panelists are assigned to the midpoint of the income range they selected in a family income question that was measured on either the most recent annual profile survey or, for newly recruited panelists, their recruitment survey. This provides an approximate income value that can be used in calculations for the adjustment.
Next, these income values are adjusted for the cost of living in the geographic area where the panelist lives. This is calculated using price indexes published by the U.S. Bureau of Economic Analysis. These indexes, known as Regional Price Parities (RPP), compare the prices of goods and services across all U.S. metropolitan statistical areas as well as nonmetro areas with the national average prices for the same goods and services. The most recent available data at the time of the annual profile survey is from 2022. Those who fall outside of metropolitan statistical areas are assigned the overall RPP for their state’s nonmetropolitan area.
Family incomes are further adjusted for the number of people in a household using the methodology from Pew Research Center’s previous work on the American middle class. This is done because a four-person household with an income of say, $50,000, faces a tighter budget constraint than a two-person household with the same income.
Panelists are then assigned an income tier. “Middle-income” adults are in families with adjusted family incomes that are between two-thirds and double the median adjusted family income for the full ATP at the time of the most recent annual profile survey. The median adjusted family income for the panel is roughly $74,100. Using this median income, the middle-income range is about $49,400 to $148,200. Lower-income families have adjusted incomes less than $49,400 and upper-income families have adjusted incomes greater than $148,200 (all figures expressed in 2023 dollars and scaled to a household size of three). If a panelist did not provide their income and/or their household size, they are assigned “No answer” in the income tier variable.
Two examples of how a given area’s cost-of-living adjustment was calculated are as follows: the Pine Bluff metropolitan area in Arkansas is a relatively inexpensive area, with a price level that is 19.1% less than the national average. The San Francisco-Oakland-Berkeley metropolitan area in California is one of the most expensive areas, with a price level that is 17.9% higher than the national average. Income in the sample is adjusted to make up for this difference. As a result, a family with an income of $40,400 in the Pine Bluff area is as well off financially as a family of the same size with an income of $58,900 in San Francisco.