Pew Research Center

FOR RELEASE DECEMBER 10, 2024

Most Americans Feel Good About Their Job Security but Not Their Pay

Younger and lower-income workers are among the least satisfied with their jobs; majorities say it would be hard to find the kind of job they’d want if they were looking today

BY Luona Lin, Juliana Menasce Horowitz and Richard Fry

FOR MEDIA OR OTHER INQUIRIES:

Communications Department
202.419.4372
www.pewresearch.org

RECOMMENDED CITATION

Pew Research Center, December 2024, "Most Americans Feel Good About Their Job Security but Not Their Pay"

About Pew Research Center

Pew Research Center is a nonpartisan, nonadvocacy fact tank that informs the public about the issues, attitudes and trends shaping the world. It does not take policy positions. The Center conducts public opinion polling, demographic research, computational social science research and other data-driven research. It studies politics and policy; news habits and media; the internet and technology; religion; race and ethnicity; international affairs; social, demographic and economic trends; science; research methodology and data science; and immigration and migration. Pew Research Center is a subsidiary of The Pew Charitable Trusts, its primary funder.

© Pew Research Center 2026

Table of contents

  • About Pew Research Center
  • Most Americans Feel Good About Their Job Security but Not Their Pay
  • 1. Job satisfaction
  • 2. How Americans view their jobs
  • 3. Job security
  • 4. Job skills and training
  • 5. Key labor force trends
  • Acknowledgments
  • Methodology

Most Americans Feel Good About Their Job Security but Not Their Pay

Younger and lower-income workers are among the least satisfied with their jobs; majorities say it would be hard to find the kind of job they’d want if they were looking today

How we did this

Pew Research Center conducted this study to better understand the experiences of American workers.

For most of the analysis in this report, we surveyed 5,273 U.S. adults who are employed part time or full time and who have only one job or have more than one but consider one of them to be their primary job. The survey was conducted Oct. 7-13, 2024.

Everyone who took part is a member of the Center’s American Trends Panel (ATP), a group of people recruited through national, random sampling of residential addresses who have agreed to take surveys regularly. The survey was conducted either online or by telephone with a live interviewer. The survey is weighted to be representative of the U.S. adult population by gender, race, ethnicity, partisan affiliation, education and other factors. Read more about the ATP’s methodology.

This report also includes an analysis of job availability, job characteristics and workforce demographics based of federal government data. Visit the methodology section for more information on these data sources.

Here are the questions used for this report, the topline and the survey methodology.

Terminology

References to workers include those who are employed part time or full time and who have only one job or have more than one but consider one of them to be their primary job.

References to White, Black and Asian adults include those who are not Hispanic and identify as only one race. Hispanics are of any race.

References to college graduates or people with a college degree comprise those with a bachelor’s degree or more education. “Some college” includes those with an associate degree and those who attended college but did not obtain a degree. “High school” refers to those who have a high school diploma or its equivalent, such as a General Educational Development (GED) certificate.

“Middle income” is defined here as two-thirds to double the median annual family income for panelists on the American Trends Panel. “Lower income” falls below that range; “upper income” falls above it. Read the methodology for more details.

Amid low unemployment nationwide, U.S. workers are feeling good about their level of job security, and relatively few expect to look for a new job in the coming months, according to a new Pew Research Center survey.

At the same time, only half of workers say they are extremely or very satisfied with their job overall. And a much smaller share are highly satisfied with their pay – 30%, down from 34% last year. 

The survey, conducted Oct. 7-13 among 5,273 employed U.S. adults, explores how workers see various aspects of their jobs, including how they assess the importance of certain skills and their own opportunities for further training.1

Key findings

White and older workers are among the most satisfied with their job overall.
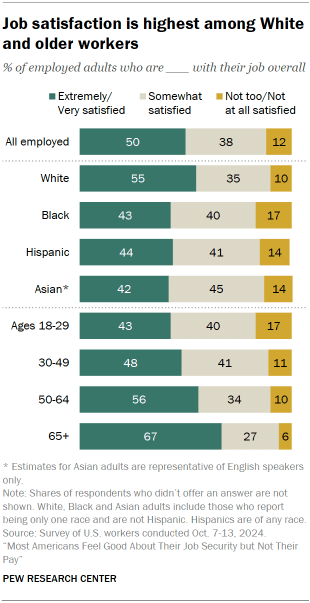
Chart shows Job satisfaction is highest among White and older workers
  • 55% of White workers say they are extremely or very satisfied, compared with 44% of Hispanic workers, 43% of Black workers and 42% of Asian workers.
  • Among workers ages 65 and older, two-thirds say they are highly satisfied with their job. Just 43% of workers ages 18 to 29 say the same. 
  • Workers with middle and upper family incomes are more likely than those with lower incomes to express high levels of job satisfaction (53% and 54% vs. 42%).

Among the 29% of workers who are not too or not at all satisfied with their pay, the top reason given is that their wages haven’t kept up with increases in cost of living.
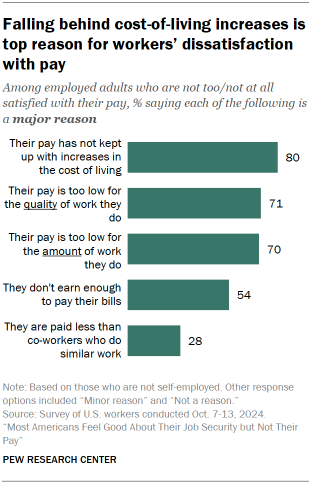
Chart shows Falling behind cost-of-living increases is top reason for workers’ dissatisfaction with pay
  • Large shares also say their pay is too low for the quality (71%) or amount (70%) of work they do.
  • 54% say a major reason they are dissatisfied is that they don’t earn enough to pay their bills.
  • Lower-income workers who are dissatisfied with their pay are far more likely than those with middle and upper incomes to cite the fact that they don’t earn enough to pay their bills (69% vs. 51% and 30%).
  • Large majorities of workers across all family income levels say their pay hasn’t kept up with cost-of-living increases.

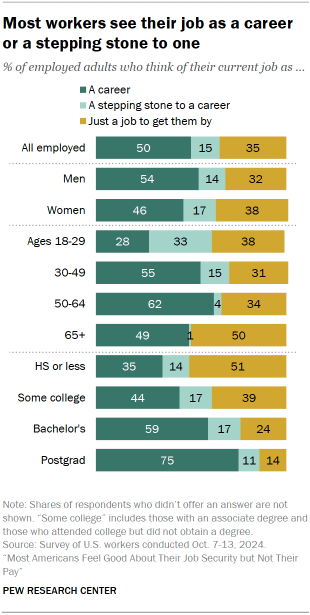
Half of workers think of their current job as a career, while 15% say it’s a stepping stone to one. About a third (35%) say it’s just a job to get them by.

  • 58% of workers with lower incomes say their job is just something to get them by, compared with 31% of those with middle incomes and 17% of those with higher incomes.
  • Workers ages 18 to 29 are less likely than those in older age groups to say they see their job as a career. Still, a majority of young workers say their job is either a career or a stepping stone.
  • Half of workers ages 65 and older say their job is just something to get them by, larger than the shares of workers ages 50 to 64 (34%), 30 to 49 (31%) and 18 to 29 (38%) who say the same.

Most workers (69%) feel that they have a great deal or a fair amount of job security.

Another 17% say they have some job security, and 13% say they have little or none.

  • 75% of White workers say they have at least a fair amount of job security, compared with smaller majorities of Asian (62%), Black (58%) and Hispanic (57%) workers. 
  • While about seven-in-ten or more among upper- and middle-income workers say they have a great deal or a fair amount of job security (78% and 71%), a smaller share of lower-income workers (54%) say the same.

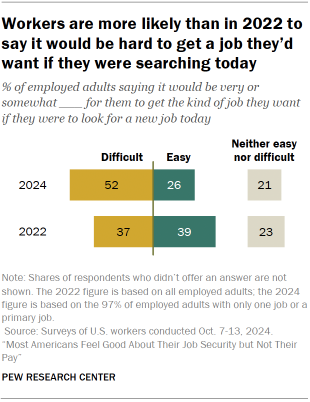
Workers are now much more likely than in 2022 to say it would be difficult for them to get the kind of job they’d want if they were to look for a new one.
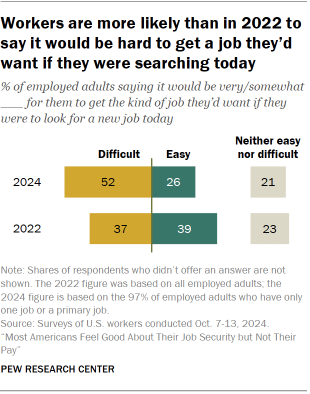
Chart shows Workers are more likely than in 2022 to say it would be hard to get a job they’d want if they were searching today
  • 52% of workers say this would be difficult, compared with 37% in 2022.
  • Workers ages 18 to 29 (58%) and those with lower incomes (62%) are especially likely to say this would be difficult for them.
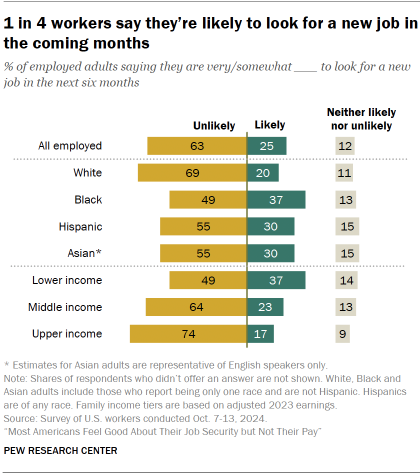
  • As was the case in 2022, most workers (63%) say they’re unlikely to look for a new job in the next six months.

Most workers (70%) say they currently have the education and training they need to get ahead in their job or career, while 30% say they need more education and training.

  • Regardless of whether they say they need it, 51% say they have received training in the past 12 months, while a similar share (49%) say they have not.
  • Among workers who say they need more education and training, 28% say learning on the job would be the best way for them to get it. About a quarter say completing a certificate program (24%) or getting more formal education (24%) would be the best way.

Among workers who need training but didn’t get any in the last year, many point to time and resource constraints as major reasons for not doing so.
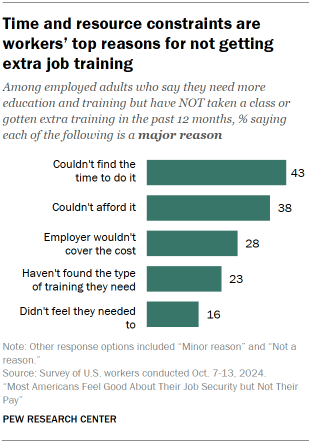
Chart shows Time and resource constraints are workers’ top reasons for not getting extra job training
  • 43% say they couldn’t find the time, 38% say they couldn’t afford it and 28% say their employer wouldn’t cover the cost.
  • 41% of workers with lower incomes and 43% of those with middle incomes who say they need but did not get training say they couldn’t afford it. Only 11% of upper-income workers say the same.

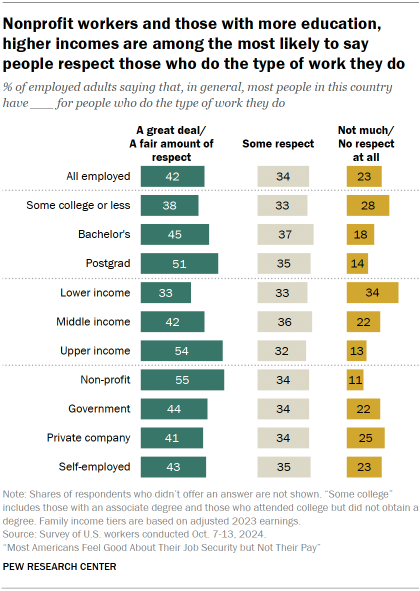
About four-in-ten workers (42%) say most Americans have a great deal or a fair amount of respect for people who do the type of work they do.

Chart shows Workers with more education and higher incomes are among the most likely to say people respect those who do the type of work they do
  • Workers with less education and lower incomes – and those whose jobs involve manual or physical labor – are among the least likely to say most Americans have a lot of respect for people who do their type of job.
  • At the same time, majorities of workers across education and income levels and regardless of the type of work they do say their supervisors, co-workers and clients or customers treat them with respect all or most of the time.

Jump to read more about:

  • Job satisfaction
  • How Americans view their jobs
  • Job security
  • Job skills and training
  • Key labor force trends

What work looks like today

In addition to the survey findings, the report uses government data to examine labor market changes in recent decades.

Among the key trends:

  • In 2023, the unemployment rate was 3.6%, one of the lowest in the past 70 years.
  • Job tenure data shows that workers are not job-hopping more than in the past.
  • Wages are up compared with 2000 after adjusting for inflation.
  • The shares of workers who are Asian, Hispanic, immigrants or have at least a bachelor’s degree have grown significantly since 2000. This reflects broader changes in the U.S. population overall.
1. Job satisfaction

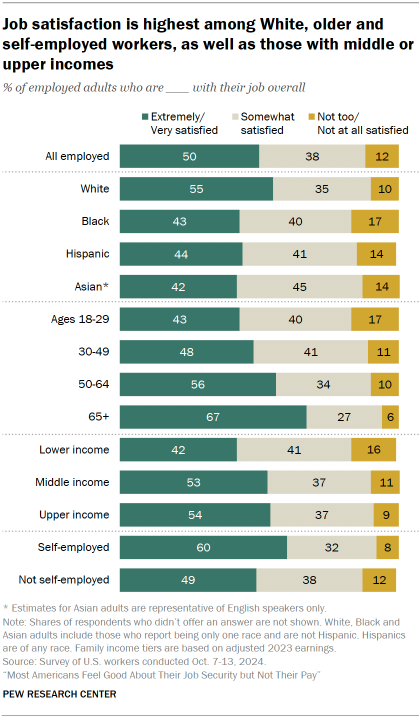
Half of U.S. workers say they are extremely or very satisfied with their job overall. Another 38% say they are somewhat satisfied, and 12% are not too or not at all satisfied with their job.
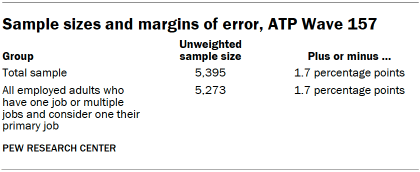
Chart shows Job satisfaction is highest among White, older and self-employed workers, as well as those with middle or upper incomes

As was the case in 2023, self-employed workers (60%) are more likely than those who are not self-employed (49%) to be highly satisfied with their job.

There are also differences in the shares who say they are extremely or very satisfied by:

  • Race and ethnicity: 55% of White workers versus 44% of Hispanic workers, 43% of Black workers and 42% of Asian workers.
  • Age: 67% of workers ages 65 and older versus 56% of those 50 to 64, 48% of those 30 to 49 and 43% of those under 30.
  • Income: 54% of workers with higher family incomes and 53% of those with middle incomes versus 41% of those with lower incomes.

How workers feel about specific aspects of their job

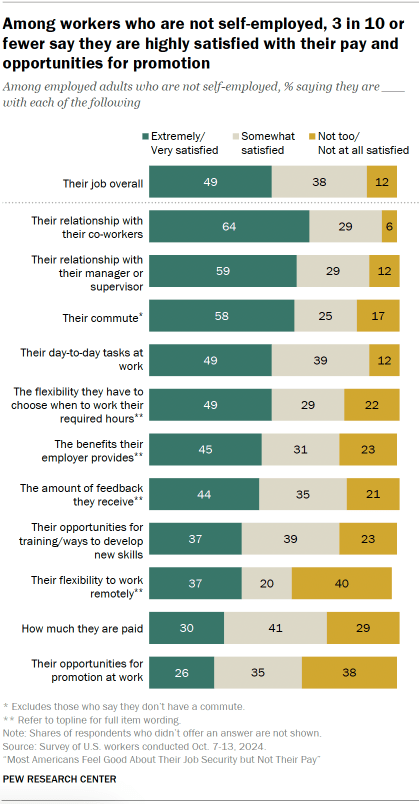
Chart shows Among workers who are not self-employed, 3 in 10 or fewer say they are highly satisfied with their pay and opportunities for promotion

Majorities of workers say they are highly satisfied with:

  • Their relationship with their co-workers (64%)
  • Their relationship with their manager or supervisor (59%)
  • Their commute (58% among those who have a commute)

When it comes to the amount of flexibility workers have, more say they are extremely or very satisfied with their flexibility to choose when they work their required hours (49%) than with their flexibility to work remotely (37%). In fact, 40% of workers express dissatisfaction with the amount of flexibility they have to work remotely.

Pay and opportunities for promotion are the two areas where workers express the lowest levels of satisfaction.

Only 30% say they are extremely or very satisfied with how much they’re paid. And about a quarter (26%) are highly satisfied with their opportunities for promotion at work.

Differences by race and ethnicity, age, and income

Just as overall job satisfaction varies across demographic groups, so do ratings of some specific aspects of work.

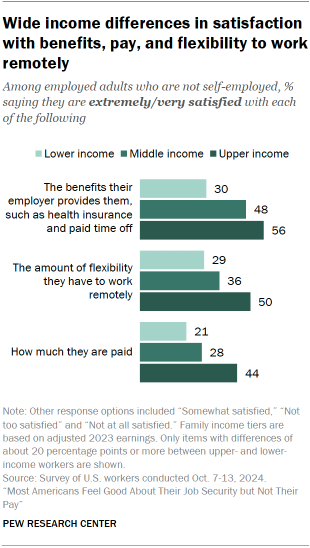
Chart shows Wide income differences in satisfaction with benefits, pay, and flexibility to work remotely

Among those who are not self-employed, White workers are more likely than Black, Hispanic and Asian workers to say they are extremely or very satisfied with their relationship with their co-workers, their relationship with their manager or supervisor, their opportunities for training and ways to develop new skills, and how much they are paid.

Workers ages 65 and older are the most likely to express high levels of satisfaction with their flexibility to choose when to work their required hours and with the amount of feedback they receive from their manager or supervisor.

And a larger share of higher-income workers than with those with middle or lower incomes say they are extremely or very satisfied with eight of the 11 items we asked about. The gaps between those with upper and lower incomes are particularly wide when it comes to benefits, flexibility to work remotely and pay.

Changes in satisfaction since 2023

On seven of the nine items that were also asked last year, the shares of workers who express high levels of satisfaction have dropped by margins of 3 to 7 percentage points.

For example, 37% of workers now say they are extremely or very satisfied with their opportunities for training or ways to develop new skills, down from 44% in February 2023. And about a quarter (26%) say they are highly satisfied with their opportunities for promotion, compared with the already small share of 33% measured last year.

There have also been drops in the shares saying they are extremely or very satisfied with the amount of feedback they get (-5 points), the benefits their employer provides (-4), how much they are paid (-4), their relationship with their coworkers (-3), and their relationship with their manager or supervisor (-3).

Reasons for pay dissatisfaction

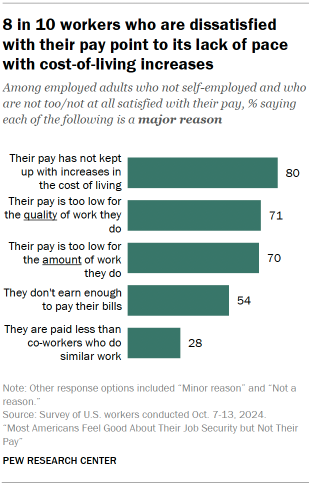
Chart shows 8 in 10 workers who are dissatisfied with their pay point to its lack of pace with cost-of-living increases

One of the aspects of work that employed adults express the least satisfaction with is how much they are paid. Large majorities of workers who are not self-employed and who are not too or not at all satisfied with their pay cite each of the following as major reasons:

  • Their pay hasn’t kept up with increases in cost of living (80%)
  • Their pay is too low for the quality of work they do (71%)
  • Their pay is too low for the amount of work they do (70%)

Just over half (54%) say a major reason for their dissatisfaction with their pay is that they don’t earn enough to pay their bills. A smaller share (28%) say they are paid less than co-workers who do similar work.

Differences by gender

Majorities of men and women who are not too or not at all satisfied with how much they are paid cite their wages being too low for the quality and amount of work they do as major reasons for their dissatisfaction. But women are more likely than men to say these are major reasons.

Additionally, women are more likely than men to point to not earning enough to pay their bills as a major reason for their dissatisfaction (61% vs. 47%).

And while relatively small shares of both men and women say a major reason they’re dissatisfied is because they are paid less than co-workers who do similar work, women are more likely than men to cite this (32% vs. 24%).

Differences by income

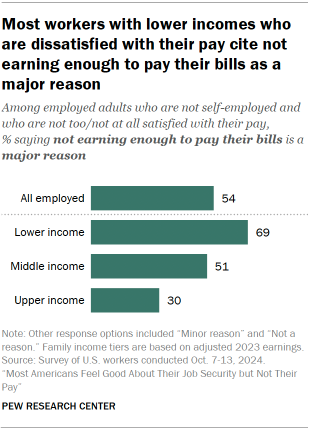
Chart shows Most workers with lower incomes who are dissatisfied with their pay cite not earning enough to pay their bills as a major reason

For the most part, workers across levels of family income who are dissatisfied with their pay give similar reasons for feeling this way. For example, about eight-in-ten workers with lower, middle and upper incomes say a major reason is that their pay hasn’t kept up with cost-of-living increases.

There are significant differences, however, in the shares that cite not earning enough to pay their bills. About seven-in-ten workers with lower incomes (69%) say this is a major reason they are dissatisfied with how much they are paid. Roughly half (51%) of those with middle incomes – and 30% of upper-income workers – say the same.

Do workers feel respected?

By their supervisor, co-workers, customers or clients

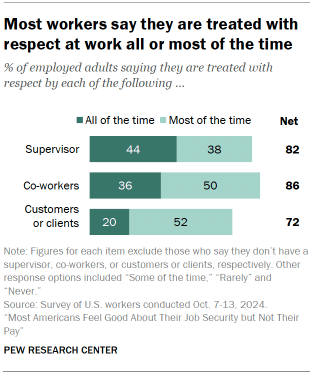
Chart shows Most workers say they are treated with respect at work all or most of the time

In addition to being highly satisfied with their workplace relationships, large shares of workers also say their co-workers (86%) and supervisors (82%) treat them with respect all or most of the time. About seven-in-ten (72%) say the same about their customers or clients.

(These figures exclude those who say they don’t have co-workers, supervisors, or clients or customers.)

While large majorities of workers across demographic groups say they are treated with respect all or most of the time, there are some differences in the shares saying this happens all of the time by:

  • Race and ethnicity: White, Black and Hispanic workers are all more likely than Asian workers to say their supervisor and co-workers always treat them with respect. Hispanic workers are the most likely to say they’re always treated with respect by their clients or customers, but relatively small shares in each racial and ethnic group (26% or fewer) say this is the case.
  • Age: 29% of workers ages 65 and older say their clients or customers always treat them with respect, compared with 23% or fewer among those in younger age groups.
  • Income: Half of upper-income workers say their supervisor treats them with respect all of the time, compared with 43% of those with middle incomes and 38% of those with lower incomes. And while 40% of upper-income workers say their co-workers always treat them with respect, about a third of those with middle (35%) and lower (34%) incomes say the same.
  • Education: 50% of workers with at least a bachelor’s degree say their supervisor always treats them with respect, and 40% say the same about their co-workers. Among those without a four-year college degree, these shares are 39% and 33%, respectively.

By most people in the U.S.

When asked how much respect they think most Americans have for people who do the type of work they do, 42% say most have a great deal or a fair amount of respect. Another 34% say most people have some respect, while 23% say most people have not much or no respect for people who do the type of work they do.

Chart shows Nonprofit workers and those with more education, higher incomes are among the most likely to say people respect those who do the type of work they do

About half of workers with a postgraduate degree (51%) say most people have at least a fair amount of respect for people in their field, compared with 45% of those with a bachelor’s degree and 38% of those with some college or less education.

Upper-income workers are also more likely than those with middle or lower incomes to say most people have a great deal or a fair amount of respect for people in their field (54% vs. 42% and 33%).

Looking specifically at certain types of employers or industries:

  • 55% of those who work for a nonprofit organization say most people have a great deal or a fair amount of respect, compared with 44% of those who work for the government, 43% of those who are self-employed and 41% of those who work for a private company.
  • Workers in health care and social assistance fields are among the most likely to say that most people have at least a fair amount of respect (56%).
  • Workers in the hospitality, service, arts, entertainment and recreation industries, along with those who work in retail or trade, are among the least likely to say most people have a great deal or a fair amount of respect for people in their field. About four-in-ten workers in these industries say people don’t have much respect or have no respect at all.
  • Workers who say their job involves manual or physical labor are less likely than those who say it does not to say most people have at least a fair amount of respect for people who do the type of work they do (38% vs. 46%).

2. How Americans view their jobs

When we asked workers how they see their job, half say they consider their current job as a career, while 15% say it is a stepping stone to a career. About a third (35%) say it’s just a job to get them by.

Chart shows Most workers see their job as a career or a stepping stone to one

Young workers are less likely than older workers to see their jobs as a career. Some 28% of workers ages 18 to 29 say this, while about half or more of those in older age groups say the same. Still, a majority of young workers say their job is either a career or a stepping stone.

Workers’ attitudes about their job also differ by education. Most of those with a postgraduate degree (75%) view their job as a career, compared with 59% of those with a bachelor’s degree only, 44% of those with some college education, and 35% of those with a high school diploma or less education. About half of workers with a high school diploma or less (51%) say their job is just something to get them by.

There is a moderate gender difference on this question. More than half of men (54%) consider their job a career, compared with 46% of women.

How older workers see their jobs

Workers ages 65 and older are the most likely age group to say their job is just something to get them by. Half say this is the case, compared with about four-in-ten or fewer in younger age groups.

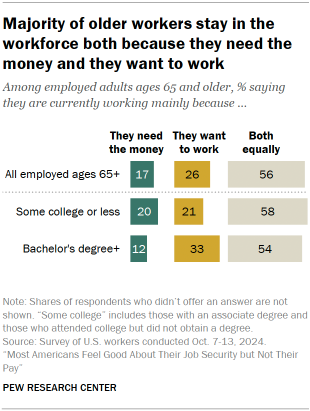
Chart shows Majority of older workers stay in the workforce both because they need the money and they want to work

To further explore older workers’ views, we asked those ages 65 and older why they are currently working.

The majority (56%) say they work both because they need the money and because they want to work.

Another 26% say they work mainly because they want to, while 17% say it’s mainly because they need the money.

Older workers’ reasons for working vary by education. Those with at least a bachelor’s degree are more likely than those with some college or less education to say they work mainly because they want to (33% vs. 21%). In turn, older workers with some college or less education are more likely than those with at least a bachelor’s degree to say they work mainly because they need the money (20% vs. 12%).

Meeting expectations at work

Chart shows Most workers say they do more than what’s expected of them at work

Most workers (76%) say they do more than what’s expected of them at their job. Some 23% say they do only what’s expected, while 2% say they do less than what’s expected of them.

Older workers are more likely than younger workers to say they do more than what’s expected of them. The vast majority of workers ages 50 and older (84%) say this, compared with 75% of workers ages 30 to 49, and 64% of workers 18 to 29.

In turn, workers ages 18 to 29 are the most likely to say they do only what’s expected of them (33%) when compared with all older groups.

For the most part, there are no significant differences by gender or education.

Are workers being monitored – and how do they feel about it?

More than half (54%) of workers who are not self-employed say their employer monitors the time they start and finish working. About a third or more also say their employer monitors:

Chart shows Sizable shares of workers say their employer monitors aspects of work life
  • Messages they send through employer-provided email accounts or messaging platforms (44%)
  • How quickly they complete their tasks (43%)
  • Their location while they are working (37%)
  • How they use their work computer, such as the time they spend using apps or the websites they visit (35%)

A much smaller share (12%) says their employer monitors their activity on social media.2

The shares of workers who say they are monitored by their employer vary widely by workers’ educational attainment. For example, workers with some college or less education are more likely than those with at least a bachelor’s degree to say that their employer monitors the time they start and finish working (64% vs. 40%), how quickly they complete tasks (48% vs. 34%), and their location while working (41% vs. 32%).

For the most part, workers feel the amount of monitoring from their employer is appropriate: 69% say they think their employer monitors what they are doing about the right amount.

Some 12% think their employer monitors them too closely, while 6% say their employer doesn’t monitor them closely enough; 13% aren’t sure.

Perhaps unsurprisingly, workers who say their employer monitors each of the activities listed above are more likely than those who say their employer is not tracking them to think their employer monitors them too closely. Those who say their employer monitors their social media use are especially likely to say they are tracked too closely (28% hold this view, compared with 20% or fewer among those who say their employer monitors other aspects of their work).

Still, even among those who say their employer monitors them, majorities describe it as the right amount.

3. Job security

Most workers (69%) feel that they currently have at least a fair amount of job security, with 33% saying they have a great deal of security. Another 17% say they have some job security, and 13% say they have little to none.

Chart shows White and upper-income workers are most likely to say they have job security

White workers and those with upper incomes are among the most likely to say they have a great deal of job security. About four-in-ten White workers (39%) say this, compared with 25% of Black workers and 22% each among Hispanic and Asian workers.

And among upper-income workers, 43% say they have a great deal of security in their job. About a third of those with middle incomes (34%) and a smaller share of those with lower incomes (22%) say the same.

Perceptions of job security also vary by the type of employer workers have. Government workers are the most likely to say they have a great deal of job security (47%), followed by those who work at nonprofits (39%). The survey was conducted before the announcement of possible cuts to the federal workforce in the next presidential administration.

About three-in-ten of those who work at a private company (29%) or who are self-employed (28%) feel they have a great deal of security in their job.

These patterns also hold when looking at those who say they have at least a fair amount of job security.

Workers’ sense of job security is virtually unchanged from 2022, when we last asked this question.3 In that survey, 69% said they had at least a fair amount of job security, with 35% saying they felt a great deal of security. Some 16% felt they had some job security, while 15% said they had little or none.

Looking for a new job

Chart shows 1 in 4 workers say they’re likely to look for a new job in the coming months

For the most part, workers have no near-term plans to look for a new job: At the time of the October survey, 63% said they were unlikely to do so in the next six months. A quarter said they were at least somewhat likely to look for a new job, while 12% said they were neither likely nor unlikely to do so. These figures are similar to what they were in 2022.

The shares who said they’re very or somewhat likely to look for a new job in the coming months are higher among some groups:

  • 37% of Black workers and 30% each among Hispanic and Asian workers versus 20% of White workers
  • 37% of workers ages 18 to 30 versus 26% of those ages 30 to 49, 16% of those 50 to 64 and 10% of workers 65 and older
  • 37% of workers with lower incomes versus 23% of those with middle incomes and 17% of those with upper incomes

It’s perhaps not surprising that workers who are not too or not at all satisfied with their job are far more likely than those who are extremely or very satisfied to say they’re likely to look for a new job (64% vs. 11%). About a third of those who are somewhat satisfied with their job (31%) say the same.

The share saying they’re likely to look for a new job decreases as perceptions of job security grow more optimistic. About six-in-ten of those who say they have no job security at all (58%) say they’re likely to look for a new job, compared with:

  • 50% of those with a little job security
  • 33% of those with some job security
  • 21% of those with a fair amount of job security
  • 14% of those with a great deal of job security

How easy or difficult would it be to find a new job?

While the shares of workers who feel their job is secure and who say they’re likely to look for a new job in the near future are unchanged from two years ago, workers are now much more likely than in 2022 to say it would be very or somewhat difficult for them to get the kind of job they would want if they were to look for a new one today.

Chart shows Workers are more likely than in 2022 to say it would be hard to get a job they’d want if they were searching today

About half of workers (52%) now say it would be difficult for them to find the kind of job they want, while 26% say this would be easy and 21% say it would be neither easy nor difficult. In 2022, similar shares of workers said it would be difficult (37%) as said it would be easy (39%) for them to find the kind of job they want if they were to look for a new one.

The shares of workers saying it would be difficult for them to find a new job are up by double digits among men and women and across racial and ethnic groups, income tiers, and levels of educational attainment. This is also the case among workers in most age groups. (The increase has been more modest, at 8 points, among workers ages 65 and older.)

Still, some groups are more likely than others to say it would be difficult for them to find a new job if they were to look for one. A majority of workers ages 18 to 29 (58%) say this would be difficult, compared with about half of those in older age groups. And while 62% of those with lower incomes say it would be difficult for them to find a new job, 51% of those with middle incomes and 45% of those with upper incomes say the same.

4. Job skills and training

Most workers (70%) say they currently have the education and training they need to get ahead in their job or career. Still, a sizable share (30%) say they need more education and training.

Chart shows Most workers say they have the education and training they need to get ahead in their job or career

Not surprisingly, older workers are more likely to say they have the training needed. The vast majority of workers ages 65 and older (86%) say this, larger than the shares among younger groups.

Views also differ by educational attainment. While 80% of workers with postgraduate degree say they have the education and training needed, smaller shares of those with a bachelor’s degree only (70%) or with some college education (64%) say the same. Workers with a high school diploma or less education are more likely than those with some college education to say they have the education and training they need (70% vs. 64%).

The best way to get training and education

Of the workers who say they need more education and training to get ahead, views are mixed on what would be the best way to get it.

Chart shows What do workers see as the best way for them to get the education or training they need to get ahead in their job?
  • 28% point to learning on the job as the best way.
  • 24% point to a certificate program.
  • 24% point to more formal education, such as a two-year, four-year or postgraduate degree.
  • 13% point to classes or online tutorials.

Another 10% of workers say they are not sure what would be the best way for them to get training.

Preferences about the best approach for further skills development differ by age. Among workers who say they need more training, those ages 18 to 29 (31%) are more likely than those ages 30 to 49 (22%) or 50 and older (21%) to say the best way would be for them to get more formal education.

In turn, workers ages 30 to 49 (15%) and those 50 and older (18%) are more likely than the younger group (7%) to say taking classes or watching online tutorials would be the best way to get the training they need.

Workers with a high school diploma or less education stand out in their views about the best way to get further education and training. They are less likely than workers with some college or a bachelor’s degree only to see formal education as the best way to get the training they need (19% vs. 26% and 30%). Workers with a high school diploma or less education are also more likely than other groups to say they are not sure what would be the best way for them to get the training the need (15% vs. 7% to 9% among other groups).

Who’s most likely to get training?

Chart shows About half of workers say they have taken a class or gotten job training in the past year

Regardless of whether they say they need additional training, about half of workers (51%) say they have taken a class or gotten extra training in the past 12 months to learn, maintain or improve their job skills. Roughly the same share (49%) say they have not done this.

Among workers who say they need more education and training:

  • 53% say they have taken a class or gotten training in the past 12 months, while 47% say they have not.
  • Most with a postgraduate degree (73%) say they got training in the past year, compared with 53% of those with a bachelor’s degree only and 50% of those with some college or less education.

Reasons for getting training

Chart shows Workers cite industry requirements and improving job performance as top reasons for getting job training

Among all workers who have taken a class or gotten extra training in the last 12 months, a majority say a major reason they did so was to keep up with field or industry requirements (62%). Many also point to employer requirements as a reason (45%).

About half (52%) say a major reason they took a class or received training is to improve their job performance.

And about three-in-ten or fewer point to wage or job opportunities – such as earning more money (31%), helping them get a new job (20%) or advancing them toward a promotion (19%) – as major reasons.

Chart shows Younger workers are more likely to point to wages, new job opportunities as reasons they get training

Younger workers are more likely than older workers to point to wages and job opportunities as major reasons they got training.

Among workers who have gotten training in the past year, those ages 18 to 29 are the most likely age group to say each of the following is a major reason they did so:

  • Earning more money: 44% versus 34% of those ages 30 to 49, 16% of those 50 to 64, and 10% of those 65 and older.
  • Helping them get a new job: 34% versus 21%, 9% and 3%.
  • Getting a promotion: 30% versus 21%, 8% and 2%.

Reasons for not getting training

We also asked workers who have not taken a class or gotten training the past 12 months why they haven’t done this. About a third (35%) say they didn’t feel they needed to.

Chart shows Among workers who need job training but didn’t get any in the last year, many say lack of time, resources are reasons

Among workers who say they need more training but haven’t taken a class or gotten extra training in the last 12 months, many point to time and resource constraints as major reasons.

  • 43% say they couldn’t find the time to do it.
  • 38% say they couldn’t afford it.
  • 28% say their employer wouldn’t cover the cost.

Some 23% say a major reason is that they haven’t found the type of training they need, and a smaller share (16%) say they didn’t feel they needed it.

Workers with lower and middle incomes are more likely than those with upper incomes to face economic barriers to training. Sizable shares of lower- and middle-income workers (41% and 43%) who report they need but didn’t get training say they couldn’t afford it. Just 11% of those with upper incomes say the same.

What are the most important skills in today’s economy?

We asked workers to rate the importance of nine skills a worker might need to be successful in today’s economy.

Chart shows Interpersonal skills, communication and critical thinking rated as most important for workers today

Workers rate the following skills as the most important:

  • Interpersonal skills (85% say this is extremely or very important)
  • Written and spoken communication skills (85%)
  • Critical thinking skills (84%)

Smaller majorities place great importance on basic computer skills (72%) and management and leadership skills (58%).

Fewer than half of workers say the following skills are extremely or very important:

  • The ability to do physical or manual labor (44%)
  • Skills to operate, build, or repair machinery or equipment (41%)
  • High-level math, analytical or computer skills (39%)
  • Skills to understand and use artificial intelligence tools or technology (35%)

Workers’ views on the importance of skills vary by education and the nature of their jobs. For example, 82% of workers with at least a bachelor’s degree place great importance on basic computer skills, compared with 66% of those with some college or less education.

And by double-digit differences, those who do manual or physical labor at their job are more likely than those who do not to say the following skills are extremely or very important for a worker to be successful in today’s economy:

  • The ability to do physical or manual work or use hand tools (58% vs. 31%)
  • Skills to operate, build, or repair machinery or equipment (48% vs. 34%)

5. Key labor force trends

Given how central work is to the lives of many Americans, the federal government carefully and consistently collects information on job availability, job characteristics and the demographics of the workforce. This chapter presents some of the key indicators collected by federal agencies and, when available, how they have changed over the past couple of decades. These topics include:

  • The share of U.S. workers who are looking for work, and how long employees have worked for their current employer
  • How much workers earn, how they are paid, and how much control they have over their work goals and processes
  • How the age diversity, racial and ethnic diversity, and education of the U.S. workforce has changed in recent decades

How easy is it to find and keep a job?

National unemployment rate

Chart shows Unemployment is near a 20-year low

The standard measure of the availability of jobs is the national unemployment rate, or the share of the labor force who is looking for work. A low unemployment rate implies that it is relatively easy for job seekers to secure employment.

In 2023, unemployment was 3.6%. Over the past seven decades, there have been very few years with an unemployment rate lower than that.

Though unemployment has ticked up during 2024, it remains relatively low – 4.1% in October 2024.

Chart shows Job tenure among adults hasn’t changed much over the decades

By comparison, unemployment peaked at 9.7% in 2010 after millions of workers lost their jobs in the Great Recession that began in December 2007.4

Job tenure

Job tenure data collected by the government also indicates that jobs have become more secure over the last few decades and that workers are not job-hopping more than in the past.

Every other January, the U.S. Census Bureau asks workers how long they have been with their current employer. In January 2022, about a third of workers ages 18 and older (34%) reported that they had been with their current employer less than three years, while about one quarter (27%) had been with their employer 10 years or more. The average tenure of today’s workers is not much different than what was reported by workers 20 years ago.

The tenure data captures workers who choose to leave their job (if they quit or job-hop) as well as those who leave involuntarily (if they get fired).

Job tenure appears to have increased during the Great Recession. For example, in January 2008, 35% of workers had been with their employer less than three years. But by 2010, 31% of workers reported that short of tenure. During economic downturns, workers may stick with their current employer due to the lack of good alternative job opportunities. Furthermore, employees with short tenures are the ones who are most likely to be terminated during a recession and thus no longer included in the tenure calculation.

Job tenure among adult workers partly reflects the characteristics of the workforce. Over many decades, the workforce has aged; that tends to boost the average job tenure, as older workers generally stay in their jobs longer than younger workers.

Still, the job tenure of 18- to 34-year-old workers has not changed much over time. This suggests that today’s young workers do not job-hop to a greater extent than young workers of the past.

Job characteristics

How has pay changed over time?

The past decade or so has been beneficial for workers in general. Unemployment has been trending down and employers have had difficulty finding workers to fill both lower-skilled and higher-skilled jobs. As a result employers have had to pay higher wages to find the workers they need.

Today the typical adult working full-time, year-round earns about $60,000 a year.5 That’s a 12% pay boost above what they earned in 2000 ($53,480 after adjusting for inflation).6

Chart shows Inflation-adjusted earnings have modestly increased the past 20 years

Earnings outcomes are less rosy, however, over the short term. Since 2020, inflation has heated up and workers’ pay overall has not kept up. In 2021, the median adult full-time, year-round worker earned $64,321 after adjusting for inflation, above the $60,000 earned today.

The 2021 figure refers to the earnings of workers during calendar year 2020. In 2020 there were 14 million fewer full-time, full-year workers than in 2019, the largest year-to-year decline on record. The Census Bureau asserts that the employment decline and earnings increase from 2019 to 2020 together suggest that many of the jobs lost due to the pandemic were lower-paying jobs, bumping up the estimated 2021 median earnings.

How are workers paid?

By far, wages and salaries are the most common type of pay arrangement. In 2023, 97% of workers ages 18 and older reported receiving this type of pay.

Other types of pay included:

  • Bonuses (10% of workers received this type of pay)
  • Commissions (5%)
  • Overtime pay (5%)
  • Tips (2%)

Pay arrangements vary by occupation, and workers can report multiple types of earnings.

Decision-making on the job

Another important aspect of work is the degree to which workers make their own decisions, or their autonomy on the job. The Federal Reserve has recently begun collecting information on job autonomy.

Chart shows The degree of autonomy on the job varies across dimensions

In 2023, workers said they had more autonomy to choose how to complete their tasks than to choose which tasks to complete.

Among workers ages 25 and older:

  •  58% said they often or always chose how to complete tasks.
  • 36% said they often or always chose which tasks to work on.

Workers with more formal education reported greater autonomy on the job than their counterparts with less education. For example, 40% of workers with at least a bachelor’s degree said they often or always choose which tasks to work on versus 27% of workers who have not completed high school.

Having multiple jobs

In 2023, just 5% of workers ages 25 and older had multiple jobs. This share has not changed much over time: In 2000, 6% of workers ages 25 and older held multiple jobs.7

Surprisingly, workers in this age group who have completed at least a bachelor’s degree are more likely to work multiple jobs (6% in 2023) than those who have not completed high school (3%).

Industry of employment

Chart shows U.S. employment trends in major industries

Employment growth over the last two decades has been much greater in some industries than others.

For example, 20% of workers are employed in the health care and social assistance industries as of 2023, up from 16% in 2000. This partly reflects the country’s aging population.

In turn, a smaller share of workers are now employed in manufacturing, mining, construction and agriculture (20%, down from 25% in 2000).

Certificates and licenses

Many workers demonstrate mastery of the skills or knowledge needed for a job by holding a professional certificate or license. Today, 26% of workers ages 25 and older have a professional certificate or license, and the share has not changed much since 2015 (when the Census Bureau began asking about certificates).

Often a worker needs a formal degree to qualify for a certificate, so workers with a formal degree are more likely to have a professional certificate than those without one. About a third of workers ages 25 and older with at least a bachelor’s degree (35%) have a professional certificate or license, compared with 8% of those who have not finished high school.

How the adult workforce has changed since 2000

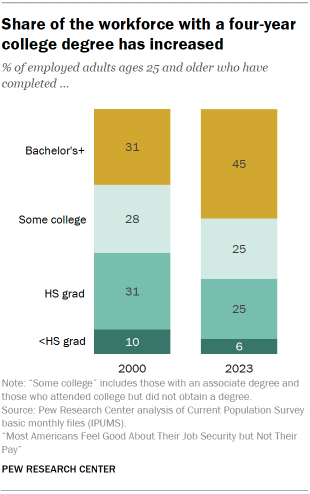
Chart shows Share of the workforce with a four-year college degree has increased

The country’s population is slowly changing, and the adult workforce has also changed in some similar ways over the past two decades:

Chart shows Nearly 1 in 5 adult workers in the U.S. were born in another country
  • Education: 45% of today’s workers ages 25 and older have at least a bachelor’s degree, compared with 31% in 2000. The share of workers who have some college education, a high school diploma or did not finish high school have each declined since 2000.
  • Age: The median age of an adult worker is 42, up from 39 in 2000. Today, more than a third of the adult workforce (34%) is age 50 or older, compared with 24% in 2000.
  • Race and ethnicity: Hispanic and Asian workers account for growing shares of the adult workforce. For example, 19% of adult workers today are Hispanic, up from 12% in 2000; 7% are Asian, up from 4%. White workers now make up 60% of the adult workforce, down from 71% in 2000, while the share of workers who are Black has not changed much (12% today vs. 11% in 2000).
  • Nativity: 19% of adult workers are immigrants, versus 13% in 2000.
  • Gender: 47% of the adult workforce are women, similar to 46% in 2000.

Acknowledgments

This report is a collaborative effort based on the input and analysis of the following individuals. Find related reports online at pewresearch.org/topic/economy-work.

Kim Parker, Director of Social Trends Research
Juliana Horowitz, Senior Associate Director, Research      
Richard Fry, Senior Economist                                             
Luona Lin, Research Associate
Isabel Goddard, Research Associate          
Kiley Hurst, Research Analyst             
Dana Braga, Research Analyst
Reem Nadeem, Digital Producer        
Peter Bell, Design Director
John Carlo Mandapat, Information Graphics Designer     
Anna Jackson, Editorial Assistant                                              
Julia O’Hanlon, Communications Manager
Maya Pottiger, Communications Associate

In addition, the project benefited greatly from the guidance of the Pew Research Center methodology team: Courtney Kennedy, Andrew Mercer, Ashley Amaya, Dorene Asare-Marfo, Dana Popky, Anna Brown and Arnold Lau.

Methodology

The American Trends Panel survey methodology

Overview

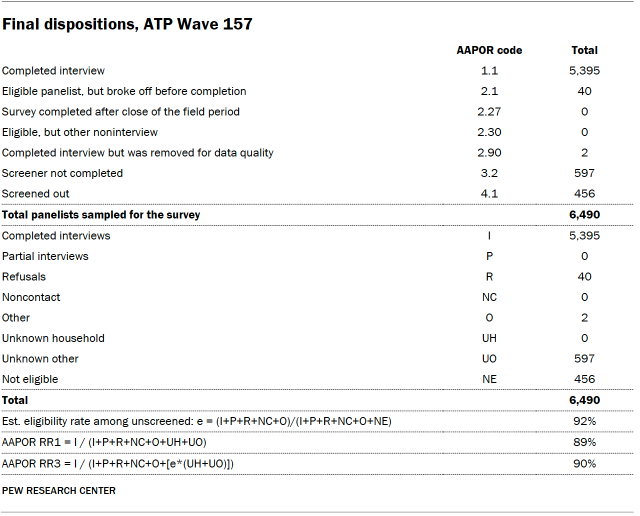
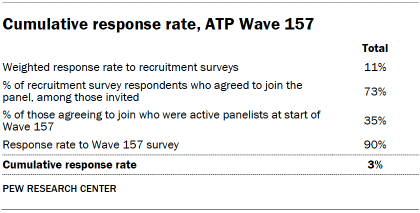
Data in this report comes from Wave 157 of the American Trends Panel (ATP), Pew Research Center’s nationally representative panel of randomly selected U.S. adults. The survey was conducted from Oct. 7 to Oct. 13, 2024, among a sample of ATP members who indicated that they currently work either full or part time for pay. A total of 5,395 panelists responded out of 6,490 who were sampled, for a survey-level response rate of 90% (AAPOR RR3).

The cumulative response rate accounting for nonresponse to the recruitment surveys and attrition is 3%. The break-off rate among panelists who logged on to the survey and completed at least one item is 1%. The margin of sampling error for the full sample of 6,490 respondents is plus or minus 1.7 percentage points.

SSRS conducted the survey for Pew Research Center via online (n=5,334) and live telephone (n=61) interviewing. Interviews were conducted in both English and Spanish.

To learn more about the ATP, read “About the American Trends Panel.”

Panel recruitment

Since 2018, the ATP has used address-based sampling (ABS) for recruitment. A study cover letter and a pre-incentive are mailed to a stratified, random sample of households selected from the U.S. Postal Service’s Computerized Delivery Sequence File. This Postal Service file has been estimated to cover 90% to 98% of the population.8 Within each sampled household, the adult with the next birthday is selected to participate. Other details of the ABS recruitment protocol have changed over time but are available upon request.9 Prior to 2018, the ATP was recruited using landline and cellphone random-digit-dial surveys administered in English and Spanish.

A national sample of U.S. adults has been recruited to the ATP approximately once per year since 2014. In some years, the recruitment has included additional efforts (known as an “oversample”) to improve the accuracy of data for underrepresented groups. For example, Hispanic adults, Black adults and Asian adults were oversampled in 2019, 2022 and 2023, respectively.

Sample design

The overall target population for this survey was noninstitutionalized people ages 18 and older living in the United States, who work for pay either full time or part time. All active panel members who reported working either full or part-time for pay in ATP Wave 150 (fielded in July 2024), were invited to participate in this wave. Respondents were again asked about their current employment situation at the beginning of this survey, and those who indicated that they were not currently working for pay were screened out.

Questionnaire development and testing

The questionnaire was developed by Pew Research Center in consultation with SSRS. The web program used for online respondents was rigorously tested on both PC and mobile devices by the SSRS project team and Pew Research Center researchers. The SSRS project team also populated test data that was analyzed in SPSS to ensure the logic and randomizations were working as intended before launching the survey.

Incentives

All respondents were offered a post-paid incentive for their participation. Respondents could choose to receive the post-paid incentive in the form of a check or gift code to Amazon.com, Target.com or Walmart.com.  Incentive amounts ranged from $5 to $20 depending on whether the respondent belongs to a part of the population that is harder or easier to reach. Differential incentive amounts were designed to increase panel survey participation among groups that traditionally have low survey response propensities.

Data collection protocol

The data collection field period for this survey was Oct. 7 to Oct. 13, 2024. Surveys were conducted via self-administered web survey or by live telephone interviewing. 

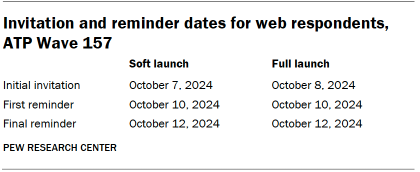
For panelists who take surveys online:10 Postcard notifications were mailed to a subset on Oct. 7.11 Survey invitations were sent out in two separate launches: soft launch and full launch. Sixty panelists were included in the soft launch, which began with an initial invitation sent on Oct. 7. All remaining English- and Spanish-speaking sampled online panelists were included in the full launch and were sent an invitation on Oct. 8.

Table shows Invitation and reminder dates for web respondents, ATP Wave 157

Panelists participating online were sent an email invitation and up to two email reminders if they did not respond to the survey. ATP panelists who consented to SMS messages were sent an SMS invitation with a link to the survey and up to two SMS reminders.

For panelists who take surveys over the phone with a live interviewer: Prenotification postcards were mailed on Oct. 4. Soft launch took place on Oct. 7 and involved dialing until a total of three interviews had been completed. All remaining English- and Spanish-speaking sampled phone panelists’ numbers were dialed throughout the remaining field period. Panelists who take surveys via phone can receive up to six calls from trained SSRS interviewers.

Data quality checks

To ensure high-quality data, Center researchers performed data quality checks to identify any respondents showing patterns of satisficing. This includes checking for whether respondents left questions blank at very high rates or always selected the first or last answer presented. As a result of this checking, two ATP respondents were removed from the survey dataset prior to weighting and analysis.

Weighting

The ATP data is weighted in a process that accounts for multiple stages of sampling and nonresponse that occur at different points in the panel survey process. First, each panelist begins with a base weight that reflects their probability of recruitment into the panel. Weighting parameters were based on the full set of ATP members who were potentially eligible for inclusion in the sample prior to any screening. First, the base weights for all ATP members who responded to the 2024 Annual Profile Survey (Wave 150) were calibrated to align with the population benchmarks in the accompanying table to create a full-panel weight.

The full-panel weight for panelists who completed the survey was calibrated to align with the distribution for the entire sample (including those who did not respond to Wave 157) on the following dimensions: age, gender, education, race/ethnicity, years lived in the U.S., volunteerism, voter registration, frequency of internet use, religion, party affiliation, census region, and metropolitan status. Additionally, respondents’ employment status(whether they work full or part time for pay) as reported in Wave 157 was weighted to match the distribution from Wave 150. These weights were then trimmed at the 1st and 99th percentiles to reduce the loss in precision stemming from variance in the weights. Sampling errors and tests of statistical significance take into account the effect of weighting.

Table shows American Trends Panel weighting dimensions for full-panel weight

The following table shows the unweighted sample sizes and the error attributable to sampling that would be expected at the 95% level of confidence for different groups in the survey.

Table shows Sample sizes and margins of error, ATP Wave 157

Sample sizes and sampling errors for other subgroups are available upon request. In addition to sampling error, one should bear in mind that question wording and practical difficulties in conducting surveys can introduce error or bias into the findings of opinion polls.

Dispositions and response rates

Table shows Final dispositions, ATP Wave 157
Table shows Cumulative response rate, ATP Wave 157

A note about the Asian adult sample

This survey includes a total sample size of 389 employed Asian adults. The sample primarily includes English-speaking Asian adults and, therefore, may not be representative of the overall Asian adult population. Despite this limitation, it is important to report the views of Asian adults on the topics in this study. As always, Asian adults’ responses are incorporated into the general population figures throughout this report.

How family income tiers are calculated

Family income data reported in this study is adjusted for household size and cost-of-living differences by geography. Panelists then are assigned to income tiers that are based on the median adjusted family income of all American Trends Panel members. The process uses the following steps:

  1. First, panelists are assigned to the midpoint of the income range they selected in a family income question that was measured on either the most recent annual profile survey or, for newly recruited panelists, their recruitment survey. This provides an approximate income value that can be used in calculations for the adjustment.
  2. Next, these income values are adjusted for the cost of living in the geographic area where the panelist lives. This is calculated using price indexes published by the U.S. Bureau of Economic Analysis. These indexes, known as Regional Price Parities (RPP), compare the prices of goods and services across all U.S. metropolitan statistical areas as well as non-metro areas with the national average prices for the same goods and services. The most recent available data at the time of the annual profile survey is from 2022. Those who fall outside of metropolitan statistical areas are assigned the overall RPP for their state’s non-metropolitan area.
  3. Family incomes are further adjusted for the number of people in a household using the methodology from Pew Research Center’s previous work on the American middle class. This is done because a four-person household with an income of say, $50,000, faces a tighter budget constraint than a two-person household with the same income.
  4. Panelists are then assigned an income tier. “Middle-income” adults are in families with adjusted family incomes that are between two-thirds and double the median adjusted family income for the full ATP at the time of the most recent annual profile survey. The median adjusted family income for the panel is roughly $74,100. Using this median income, the middle-income range is about $49,400 to $148,200. Lower-income families have adjusted incomes less than $49,400 and upper-income families have adjusted incomes greater than $148,200 (all figures expressed in 2023 dollars and scaled to a household size of three). If a panelist did not provide their income and/or their household size, they are assigned “no answer” in the income tier variable.

Two examples of how a given area’s cost-of-living adjustment was calculated are as follows: the Pine Bluff metropolitan area in Arkansas is a relatively inexpensive area, with a price level that is 19.1% less than the national average. The San Francisco-Oakland-Berkeley metropolitan area in California is one of the most expensive areas, with a price level that is 17.9% higher than the national average. Income in the sample is adjusted to make up for this difference. As a result, a family with an income of $40,400 in the Pine Bluff area is as well off financially as a family of the same size with an income of $58,900 in San Francisco. 

Current Population Survey methodology

Most of the analysis used is based on the Current Population Survey (CPS) monthly files. Administered jointly by the U.S. Census Bureau and the Bureau of Labor Statistics, the CPS is a monthly survey of approximately 60,000 occupied households that typically interviews about 50,000 households. It is the source of the nation’s official statistics on unemployment and is explicitly designed to survey the labor force. It is representative of the civilian noninstitutionalized population.

The CPS microdata used in this report is the Integrated Public Use Microdata Series (IPUMS), provided by the University of Minnesota. The IPUMS assigns uniform codes, to the extent possible, to data collected in the CPS over the years. Read more information about IPUMS, including variable definition and sampling error.

Employee tenure data is collected every two years as part of a supplement to the CPS.

Earnings of full-time, full-year workers are based on the CPS Annual Social and Economic Supplement (ASEC), collected every March. Following U.S. Census Bureau practice, earnings are adjusted for inflation using the Chained Consumer Price Index for all Urban Consumers (C-CPI-U). The Census Bureau generated entropy balance weights for the 2020 and 2021 ASEC to account for nonrandom nonresponse. Our analysis used these weights.

The analyses of multiple job-holding, industrial change, professional certificates and the changing demography of the workforce are based on information collected in the basic monthly CPS files.

Survey of Income and Program Participation methodology

The analysis of how workers are paid uses information collected in the Census Bureau’s 2023 Survey of Income and Program Participation (SIPP). It is a nationally representative annual survey that focuses on the income of U.S. households and their participation in government programs. It also asks respondents about their employment during the preceding calendar year, including earnings from commissions, tips and bonus pay.

Survey of Household Economics and Decisionmaking methodology

Finally, workers’ assessment of how much autonomy they have on their jobs is derived from the 2023 Survey of Household Economics and Decisionmaking (SHED). The Federal Reserve has fielded the SHED annually in the fourth quarter of each year since 2013. It is perhaps best known for its assessment of adults overall financial well-being but includes batteries of questions on a number of other topics, including employment. The SHED sample is representative of the civilian, noninstitutionalized adult population. The 2023 SHED had 11,400 respondents.

© Pew Research Center 2024