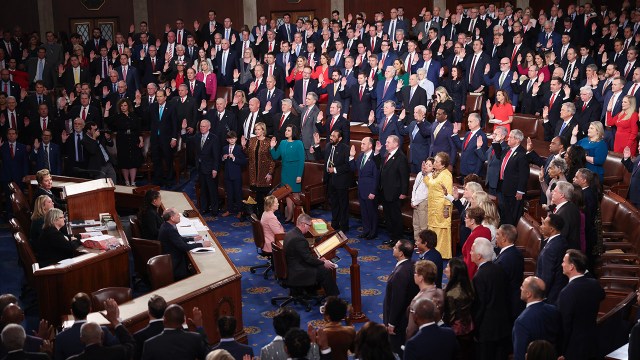
The 119th Congress achieved several demographic milestones when it convened for the first time on Jan. 3. The current Congress is the most racially and ethnically diverse in history, and it includes the nation’s first openly transgender legislator at the federal level. Congress has also gotten slightly younger, and Generation X members outnumber Baby Boomers in the House of Representatives for the first time.
Here are seven charts that show how the makeup of Congress has changed over time, using data from CQ Roll Call, the Congressional Research Service and other sources. Unless otherwise noted, findings for the 119th Congress reflect the 533 voting members who were seated on Jan. 3.
The 119th Congress is the most racially and ethnically diverse on record, making it the eighth consecutive Congress to break the mark set by the one before it. Overall, 139 voting members of the Senate and House of Representatives identify as Black, Hispanic, Asian American or Native American. This number is up from 133 non-White legislators in the 118th Congress. The number of Black lawmakers has increased the most: 60 were sworn in on the first day of the last Congress, compared with 66 in the new one.
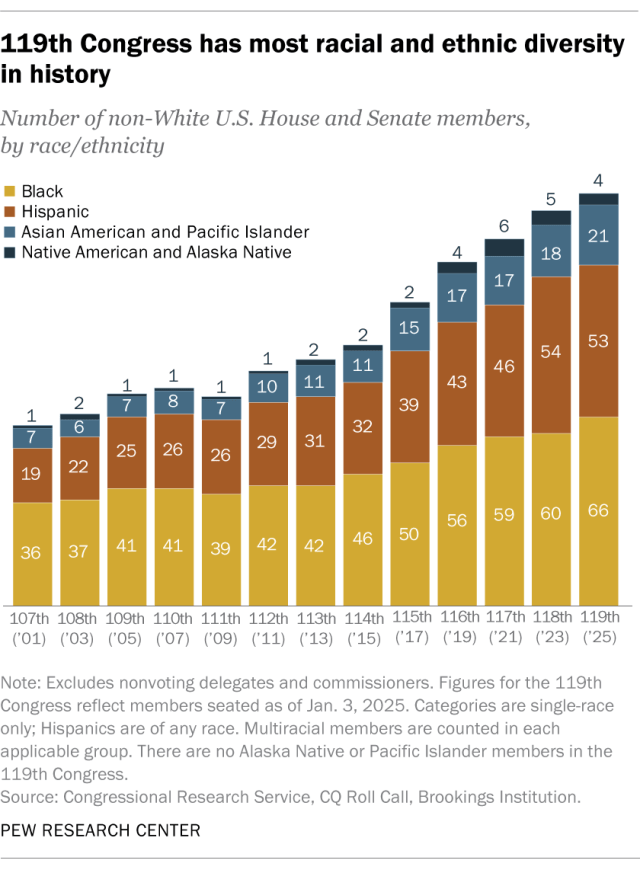
Together, non-White members represent 26% of the 119th Congress. This is up from 15% in the 109th Congress (seated in 2005) and less than 1% in the 79th Congress (seated in 1945).
Congress continues to be much less diverse than the country overall, as racial and ethnic minorities make up 42% of the U.S. population. Hispanic lawmakers are especially underrepresented (11% of Congress vs. 20% of the U.S. population). However, the share of Black lawmakers is now on par with Black Americans’ share of the overall population (14%).
The share of women in Congress has increased considerably over the long term but hasn’t changed since the last Congress. Women made up 28% of voting members in Congress as of Jan. 3, including 29% in the House and 25% in the Senate.
The number of women lawmakers has barely changed from the previous Congress’ first day (rising from 149 to 150), but it has increased dramatically over the past decade. When the 114th Congress was seated in 2015, 104 voting members (19%) were women.
Women continue to make up a much smaller share of the federal legislature than of the U.S. population, which is 51% women.

The 119th Congress includes the first openly transgender member in history. Rep. Sarah McBride, a Democrat from Delaware, is one of 13 members who are openly lesbian, gay, bisexual, transgender or queer (LGBTQ) – the same number as in the previous Congress.
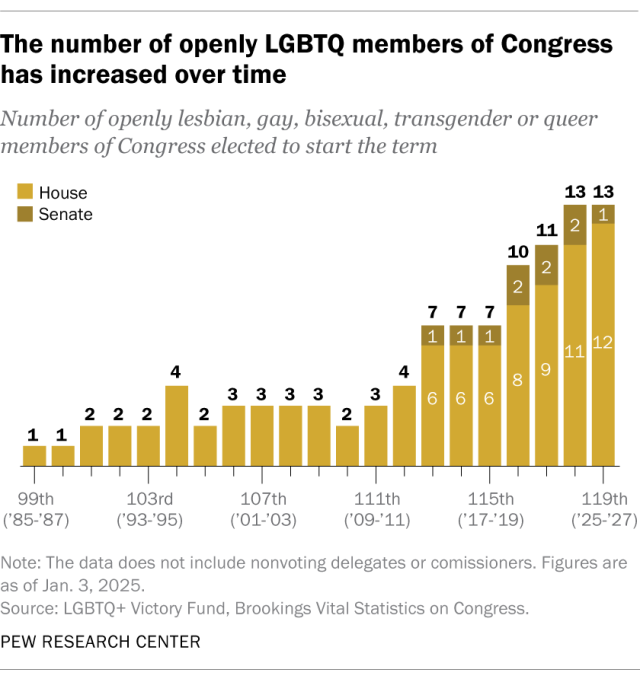
Six members of the current Congress are gay men. Seven are lesbian, gay, transgender or queer women, according to data from the LGBTQ+ Victory Fund.
The number of LGBTQ members matches the record high in the 118th Congress. It has increased significantly from the 111th Congress in 2009, which had three openly LGBTQ members. The share of LGBTQ members of Congress (2.4%) continues to lag behind the overall share of Americans who identify as LGBTQ (9.3% in 2024, according to Gallup surveys).
The 119th Congress is slightly younger than the last Congress, with more Millennials and Gen Xers. The median age of voting members of the House of Representatives is 57.5 years, down from 57.9 at the start of the 118th Congress and 58.9 at the start of the 117th Congress. The median age of the new Senate is 64.7 years, down from 65.3 at the start of the prior Congress. The median age of the Senate had previously risen for three Congresses in a row.
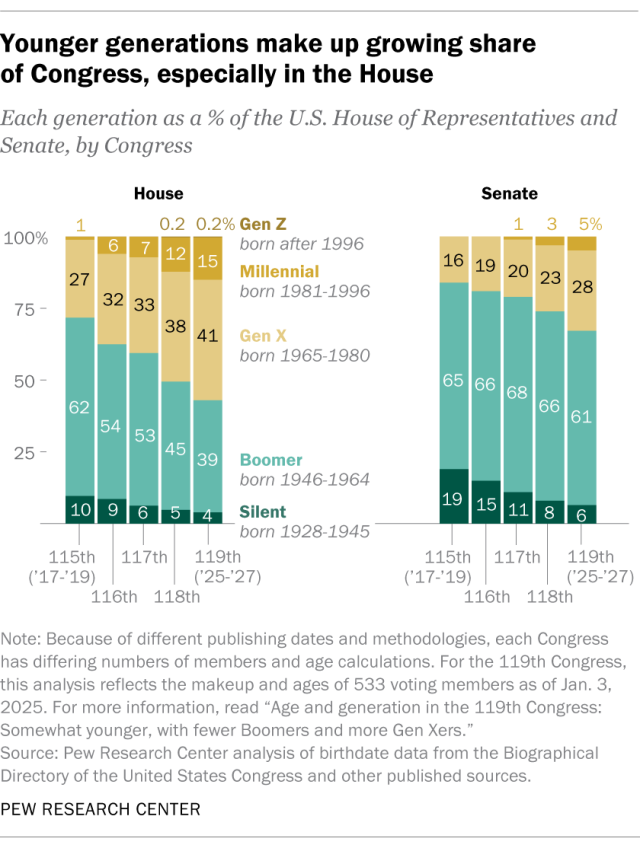
Just two Congresses ago, Baby Boomers were a majority in each chamber, but now they’re not even the largest generation in the House of Representatives. Instead, 41% of House members are in Generation X, 39% are Baby Boomers, 15% are Millennials, 4% are part of the Silent Generation and 0.2% are in Generation Z.
In the Senate, Baby Boomers still have a majority at 61%, but it’s narrower than in previous years.
Veterans have a far smaller presence in Congress than in past decades, but their numbers have increased slightly in the 119th Congress. There were 100 veterans in Congress as of Jan. 3, up from 97 in the 118th Congress, according to Military Times. They comprise 19% of the current Congress, including 18% of the House and 20% of the Senate.

There are almost three times as many Republican veterans as Democratic ones in Congress (73 vs. 27). Nine are women veterans – the most to ever serve in a single Congress.
Even with this uptick in members of Congress with military experience, their share has decreased dramatically over the past 50 years. Between 1965 and 1975, at least 70% of lawmakers in each chamber had military experience. Their shares peaked at 75% in 1967 for the House and 81% in 1975 for the Senate. They dropped below 50% in the 1990s and have largely continued to decline.
Though few members of the 119th Congress have military experience, there is still a much higher share of veterans in Congress than in the U.S. population overall. In 2023, 6% of U.S. adults were veterans, according to the U.S. Census Bureau. That was a decrease from 18% in 1980, not long after the military draft era ended.
The share of immigrants in Congress has ticked up but remains below historical highs. There are at least 19 foreign-born lawmakers in the 119th Congress, including two in the Senate and 17 in the House. Their 4% share of Congress is up from 3% in the last Congress, but below the shares seen in much earlier Congresses. When the 50th Congress was seated in 1887, for example, 8% of members were immigrants.
Immigrants also account for a far smaller share of the current Congress (4%) than of the broader U.S. population (15% as of 2024).
While the number of foreign-born lawmakers in the current Congress is small, more members have at least one parent who was born in another country. Together, immigrants and children of immigrants account for at least 15% of the new Congress, unchanged from the last Congress.

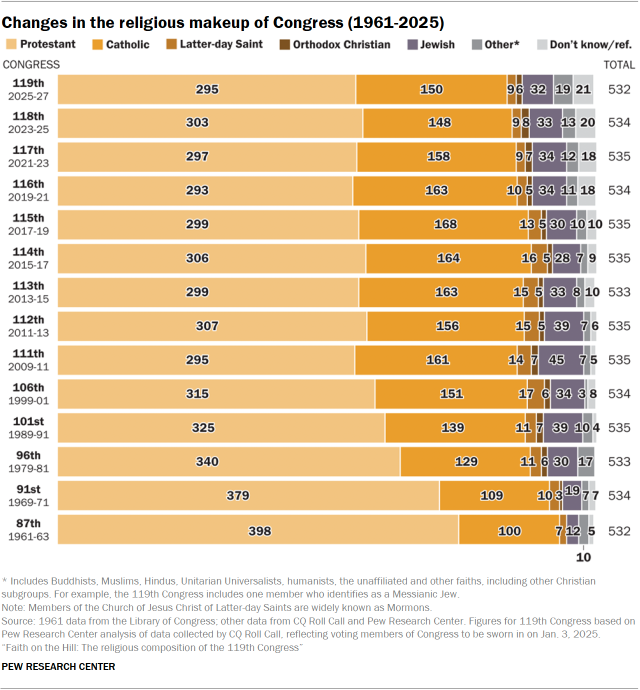
While most members of Congress are Christian, their numbers have declined. Across the House and Senate, 87% of the voting members seated on Congress’ opening day – 461 out of 532 – are Christian. (The findings on religion are based on a slightly different group of voting members than the other findings. Read the “How we did this” box for more information.)
The share of Christians in Congress has decreased slightly in recent years, but it is still much higher than the 62% of all U.S. adults who describe themselves as Christian.
The new Congress also includes 32 members who identify as Jewish, four Muslims, four Hindus, three Buddhists, three Unitarian Universalists and one humanist. Three members are religiously unaffiliated – representing a much lower share than the 29% of Americans who identify this way.
Another 21 lawmakers’ religious affiliations are categorized as unknown. Most of those 21 declined to state a religious affiliation when they were asked by CQ Roll Call, which served as the primary data source for the Center’s analysis.