Pew Research Center

FOR RELEASE JUNE 10, 2025

The Political Gap in Americans’ News Sources

Exploring use of and trust in 30 sources across U.S. political lines

BY Elisa Shearer, Kirsten Eddy, Michael Lipka and Katerina Eva Matsa

FOR MEDIA OR OTHER INQUIRIES:

Communications Department
202.419.4372
www.pewresearch.org

RECOMMENDED CITATION

Pew Research Center, June 2025, "The Political Gap in Americans’ News Sources"

About Pew Research Center

Pew Research Center is a nonpartisan, nonadvocacy fact tank that informs the public about the issues, attitudes and trends shaping the world. It does not take policy positions. The Center conducts public opinion polling, demographic research, computational social science research and other data-driven research. It studies politics and policy; news habits and media; the internet and technology; religion; race and ethnicity; international affairs; social, demographic and economic trends; science; research methodology and data science; and immigration and migration. Pew Research Center is a subsidiary of The Pew Charitable Trusts, its primary funder.

© Pew Research Center 2026

Table of contents

  • About Pew Research Center
  • The Political Gap in Americans’ News Sources
  • Acknowledgments
  • Methodology
  • Appendix A

The Political Gap in Americans’ News Sources

Exploring use of and trust in 30 sources across U.S. political lines

How we did this

Pew Research Center conducted this study to continue tracking news consumption and trust across a wide range of specific news sources. We last published similar reports in 2020 (based on a 2019 survey) and 2014.

We regularly ask people about their news habits on various platforms (e.g., television, print, radio and digital) and their levels of trust in information from social media and national/local news organizations in general. But this study is designed to be more specific, looking at Americans’ familiarity with, usage of and views toward 30 individual news sources. To learn more about how we chose the 30 news sources, please visit the methodology.

Respondents first received a list of all 30 news sources and were asked to select all the sources that they had heard of. Next, for all the sources a respondent had heard of, they were asked which ones they generally trust as sources of news. Then, for all sources that they had heard of but did not say they trust, they were asked if they generally distrust those sources as sources of news.

Finally, the survey asked respondents which sources they regularly get news from (again, only among the sources they already indicated they had heard of before).

This survey design is similar to one used in a 2019 survey but not directly comparable. The 2025 survey asked Americans which sources they regularly get news from; in 2019, we asked people which sources they got political and election news from within the past week. We also changed several of the 30 sources to reflect the current news media landscape.

We surveyed 9,482 U.S. adults from March 10 to 16, 2025. Everyone who took part in this survey is a member of the Center’s American Trends Panel (ATP), a group of people recruited through national, random sampling of residential addresses who have agreed to take surveys regularly. This kind of recruitment gives nearly all U.S. adults a chance of selection. Interviews were conducted either online or by telephone with a live interviewer. The survey is weighted to be representative of the U.S. adult population by gender, race, ethnicity, partisan affiliation, education and other factors. Read more about the ATP’s methodology.

Here are the questions used for this report, along with responses, and its methodology.

For years now, Democrats have been much more likely than Republicans to say they trust the information that comes from national news organizations.
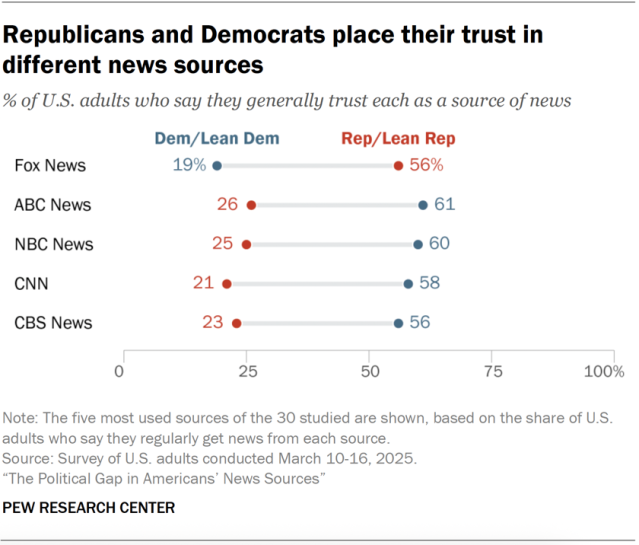
A dot plot showing that Republicans and Democrats place their trust in different news sources.

A new Pew Research Center survey gets much more specific: How do Americans feel about 30 of the country’s major news sources?

Democrats and independents who lean toward the Democratic Party are much more likely than Republicans and GOP-leaning independents to both use and trust a number of major news sources. These include the major TV networks (ABC, CBS and NBC), the cable news networks CNN and MSNBC, major public broadcasters PBS and NPR, and the legacy newspaper with the largest number of digital subscribers, The New York Times.

Republicans, meanwhile, are much more likely to distrust than trust all of these sources. A smaller number of the sources we asked about are more heavily used and trusted by Republicans than Democrats, including Fox News, The Joe Rogan Experience, Newsmax, The Daily Wire, the Tucker Carlson Network and Breitbart.

Related: Explore data on how Americans use, trust and distrust 30 major news sources with our interactive News Media Tracker tool.

These findings are broadly similar to the last time we asked Americans about many specific news sources, in 2019. The two surveys are not directly comparable due to changes in the way we asked the questions.

How we chose these 30 news sources

We selected 30 news sources based on a variety of measures, including audience size and previous survey results. We also wanted to prioritize a range of news sources across different platforms, as well as both legacy news outlets and nontraditional news sources, all while keeping the list from becoming too long for survey respondents. This selection process is not perfect; we acknowledge that no list of 30 sources could represent the entirety of today’s diverse and changing media environment. We believe this group of 30 provides an appropriate snapshot of media brands to help us study Americans’ changing news habits. To learn more, read the FAQ and methodology.

Americans’ use of news sources by party

In many cases, supporters of the two main U.S. political parties are relying largely on different sources of news and information.

Republicans and independents who lean Republican get news from a fairly concentrated group of sources, and one rises to the top: Fox News. A majority of Republicans (57%) say they regularly get news from the cable network, at least double the share who say they turn to any other news source we asked about.

Behind Fox, Republicans are most likely to say they regularly get news from the three major broadcast networks – ABC News (27%), NBC News (24%) and CBS News (22%) – and The Joe Rogan Experience podcast (22%).

While not among Republicans’ most-consumed news sources, several sources are more likely to be regular sources of news for Republicans than Democrats, including Newsmax (15% vs. 1%), The Daily Wire (12% vs. 2%) and Tucker Carlson Network (9% vs. 1%).
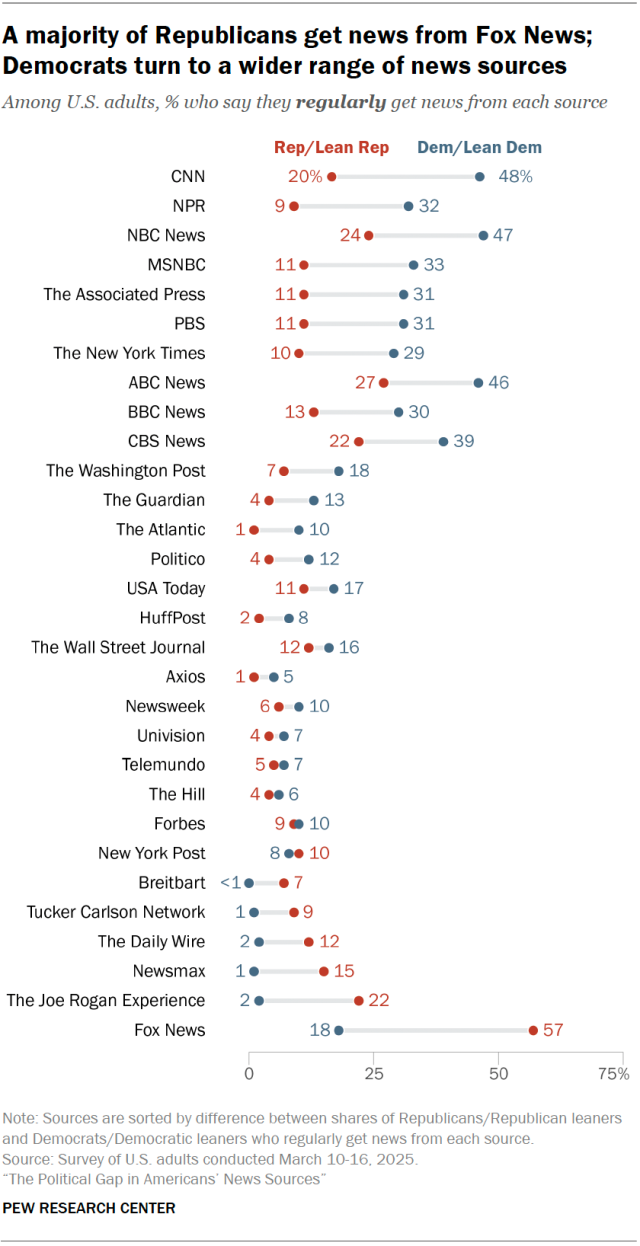
A dot plot showing that a majority of Republicans get news from Fox News; Democrats turn to a wider range of news sources.

Democrats and Democratic leaners, on the other hand, turn to a wider range of the sources we asked about. Nearly half of Democrats say they regularly get news from CNN (48%), NBC (47%) and ABC (46%). About four-in-ten Democrats say they get news from CBS (39%), while roughly three-in-ten say the same about MSNBC (33%), NPR (32%), The Associated Press (31%), PBS (31%), BBC News (30%) and The New York Times (29%).

All of these sources are far more likely to be consumed by Democrats than Republicans. To a lesser extent, Democrats also are more likely than Republicans to say they get news from The Washington Post (18% vs. 7%), Politico (12% vs. 4%) and The Atlantic (10% vs. 1%).

Even as news sources differ by party, there is still some overlap. For instance, 20% of Republicans and GOP leaners regularly consume news from CNN, similar to the share of Democrats who get news from Fox News (18%). And comparable portions of both groups get news from several less-used sources, such as The Wall Street Journal (16% among Democrats vs. 12% among Republicans), Forbes (10% vs. 9%) and the New York Post (8% vs. 10%).

The political makeup of each news source’s regular news consumers

Some of the sources we asked about have audiences that are much more right-leaning than the average U.S. adult, while many sources’ audiences lean left.

This study only looks at each news source’s audience and does not categorize the content of each news source by its political lean.
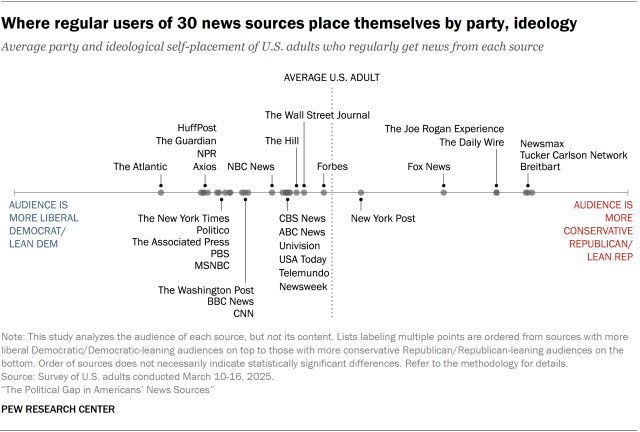
A dot plot showing where regular users of 30 news sources place themselves by party, ideology.

Each source’s placement on this chart is based on the average measure of U.S. adults who say they regularly get news from that source – taking into consideration both the party identification (Republican or Democrat, including leaners) and ideology (conservative, moderate or liberal) of respondents. Refer to the methodology for details.

For instance, the average audience member of Forbes sits closest to the party and ideology of the average U.S. adult. The average person who regularly gets news from The Wall Street Journal sits just to the left of the average American, while the typical adult who gets news from the New York Post is just right of the typical U.S. adult.

The fact that Democrats regularly get news from a wider range of the sources we asked about than Republicans is echoed in those sources’ average audience placements: Audiences for a majority of the outlets we asked about fall at least slightly to the left of the average U.S. adult. People who regularly get news from The Atlantic, HuffPost, NPR, The Guardian and Axios, among others, are particularly liberal and Democratic.

On the right, the average audience members of Breitbart, Newsmax and Tucker Carlson Network tend to be the most conservative and Republican of all the sources we asked about, followed by people who regularly get news from The Daily Wire and The Joe Rogan Experience. Fox News is also on the right side of the spectrum in terms of audience orientation, but not as far to the right as these other sources – indicating that more Democrats and moderate or liberal Republicans get news from Fox News.

Trust and distrust in news sources among Republicans and Democrats

How we asked about trust

We first asked respondents whether they have heard of 30 different news sources. For all sources that a given respondent said they had heard of, they were asked if they trust it as a source of news. If they had heard of a source but did not say they trust it, they were then asked if they distrust it as a source of news. Respondents also could decline to say that they trust it or distrust it.

Some sources, such as The Hill, are not widely familiar to Americans (37% of U.S. adults said they had heard of The Hill, including roughly equal shares of Democrats and Republicans). So, while 11% of Democrats say they trust The Hill as a source of news, just 5% say they distrust it; most Democrats didn’t offer an opinion or haven’t heard of The Hill. For percentages who have heard of each source, refer to the News Media Tracker data tool.

Republicans and Democrats sharply differ from each other in which news sources they trust or distrust.

Only a few sources among the 30 we asked about are trusted by more than a quarter of Republicans and Republican leaners. A majority (56%) trust Fox News as a source of news, while 31% say they trust The Joe Rogan Experience. And while roughly a quarter trust each of the major TV networks (ABC, CBS and NBC), larger shares of Republicans say they distrust the networks.

On the other hand, Democrats and Democratic leaners trust a much longer list of sources. CNN, the three broadcast TV networks, PBS, the BBC, The Associated Press, NPR, The New York Times and MSNBC are all trusted by more than four-in-ten Democrats. And Democrats are much less likely than Republicans to say they actively distrust most of the outlets asked about.
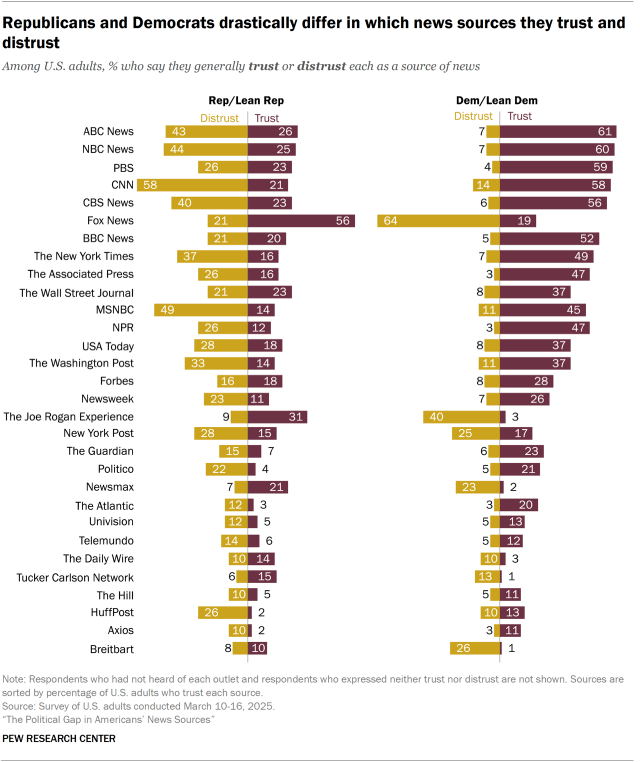
A diverging bar chart showing that Republicans and Democrats drastically differ in which news sources they trust and distrust.

In some cases, Democrats and Republicans almost mirror each other in how they view certain news organizations. For example, 58% of Democrats trust CNN and 14% say they distrust it. On the other side, 58% of Republicans distrust CNN, while 21% say they trust it. A similar pattern occurs in reverse for Fox News: 56% of Republicans trust Fox News as a source of news, while 64% of Democrats say they distrust it.

But because some outlets are smaller or less well-known, the percentage of people in each party who trust each outlet can be hard to compare. For example, fewer Republicans say they trust Tucker Carlson Network (14%) than CNN (21%), but Republicans also are much less likely to distrust Tucker Carlson Network (6%) than CNN (58%).

In other words, among Republicans, Tucker Carlson Network is more trusted than distrusted, while CNN is more distrusted than trusted – even though a larger share of Republicans trust CNN than Tucker Carlson Network. This is because there are fewer Republicans overall who have heard of Tucker Carlson Network or who offered an opinion about it.

The chart below shows a ratio of trust to distrust, which takes into account the balance of viewpoints offered for those outlets that are less well-known. Circles to the right of the line represent outlets that are more trusted than distrusted among members of each party, and circles to the left of the line represent outlets that are more distrusted than trusted. Smaller circles represent those outlets that are less well-known overall.
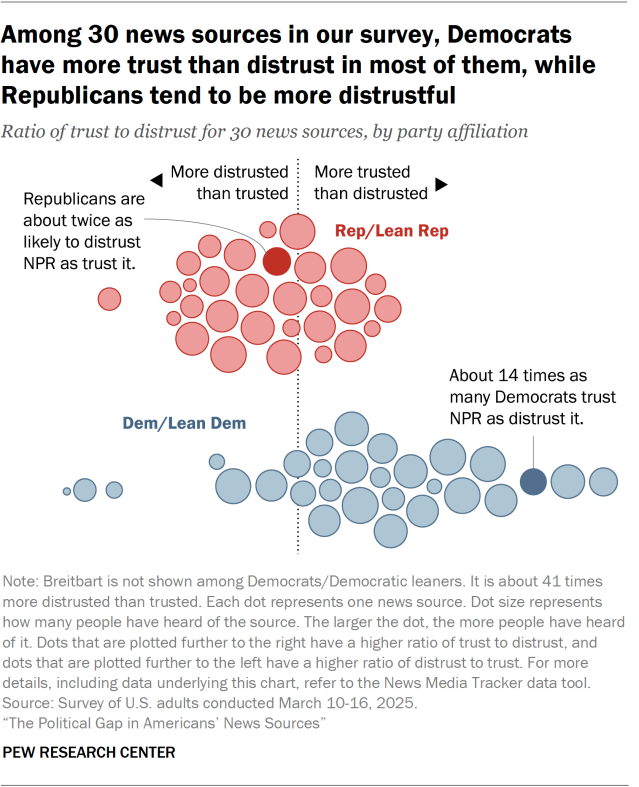
A chart showing that, among 30 news sources in our survey, Democrats have more trust than distrust in most of them, while Republicans tend to be more distrustful.

Even taking into consideration the fact that some outlets are less well-known than others, Republicans distrust more than trust most of the outlets in this study. Meanwhile, Democrats are more likely to trust than distrust most of the outlets we asked about.

There are, however, a few outlets with right-leaning audiences that Democrats largely distrust. The outlet with the highest distrust-to-trust ratio is Breitbart: Just 1% of Democrats trust Breitbart, while 26% distrust it. (Breitbart is not shown in the chart because its ratio puts it far outside the chart’s scale.)

For more details, including the specific outlets shown in this chart, refer to the News Media Tracker data tool.
Acknowledgments

Pew Research Center is a subsidiary of The Pew Charitable Trusts, its primary funder. This is the latest report in Pew Research Center’s ongoing investigation of the state of news, information and journalism in the digital age, a research program funded by The Pew Charitable Trusts. This report is a collaborative effort based on the input and analysis of the Center’s news and information research team, politics research team, methods, communications, design, digital and editorial teams. Find related reports online at pewresearch.org/topic/news-habits-media/.

Research

Elisa Shearer, Senior Researcher
Kirsten Eddy, Senior Researcher
Katerina Eva Matsa, Director, News and Information Research   
Michael Lipka, Associate Director, News and Information Research
Jacob Liedke, Research Analyst
Emily Tomasik, Research Assistant                     
Naomi Forman-Katz, Research Analyst
Sarah Naseer, Former Research Analyst    

Editorial and Graphic Design

David Kent, Senior Copy Editor                               
Kaitlyn Radde, Associate Information Graphics Designer
Peter Bell, Associate Director, Design and Production                                                       
Andrea Caumont, Associate Director, Digital Outreach

Communications and Web Publishing

Sogand Afkari, Communications Manager                         
Talia Price, Communications Associate       
Justine Coleman, Associate Digital Producer
Beshay Sakla, Associate Digital Producer
Nick Zanetti, Associate Engineer
Kelly Browning, User Experience Manager
Chris Baronavski, Lead Engineer, Editorial Content
Shannon Greenwood, Digital Production Manager
Seth Rubenstein, Platform Lead, Engineering Team

In addition, the project benefited greatly from the guidance of the Pew Research Center methodology team: Courtney Kennedy, Andrew Mercer, Ashley Amaya, Dorene Asare-Marfo, Dana Popky, Anna Brown and Arnold Lau.

Methodology

The American Trends Panel survey methodology

Overview

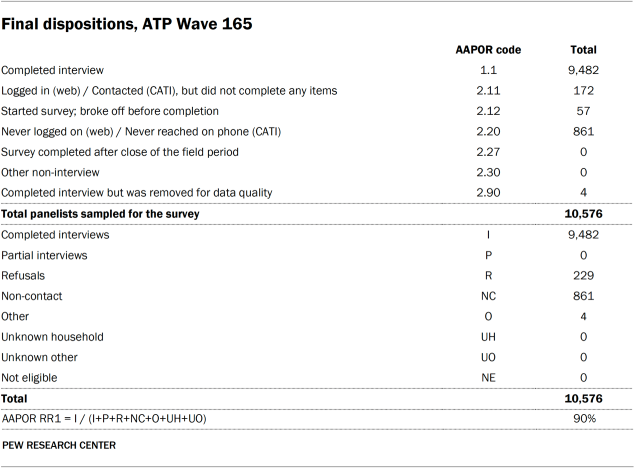
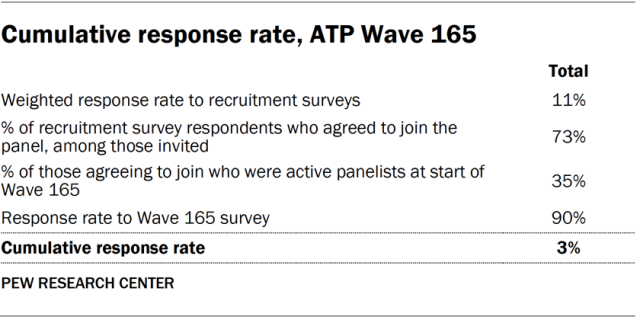
Survey data in this report comes from Wave 165 of the American Trends Panel (ATP), Pew Research Center’s nationally representative panel of randomly selected U.S. adults. The survey was conducted from March 10 to March 16, 2025. A total of 9,482 panelists responded out of 10,576 who were sampled, for a survey-level response rate of 90%.

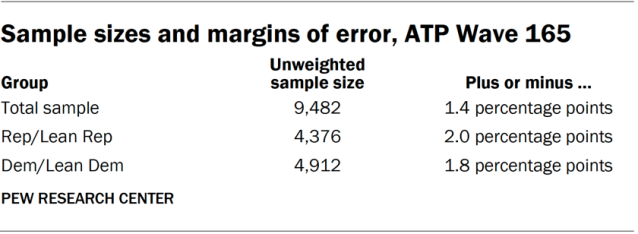
The cumulative response rate accounting for nonresponse to the recruitment surveys and attrition is 3%. The break-off rate among panelists who logged on to the survey and completed at least one item is 1%. The margin of sampling error for the full sample of 9,482 respondents is plus or minus 1.4 percentage points.

SSRS conducted the survey for Pew Research Center via online (n=9,231) and live telephone (n=251) interviewing. Interviews were conducted in both English and Spanish.

To learn more about the ATP, read “About the American Trends Panel.”

Panel recruitment

Since 2018, the ATP has used address-based sampling (ABS) for recruitment. A study cover letter and a pre-incentive are mailed to a stratified, random sample of households selected from the U.S. Postal Service’s Computerized Delivery Sequence File. This Postal Service file has been estimated to cover 90% to 98% of the population.1 Within each sampled household, the adult with the next birthday is selected to participate. Other details of the ABS recruitment protocol have changed over time but are available upon request.2 Prior to 2018, the ATP was recruited using landline and cellphone random-digit-dial surveys administered in English and Spanish.

A national sample of U.S. adults has been recruited to the ATP approximately once per year since 2014. In some years, the recruitment has included additional efforts (known as an “oversample”) to improve the accuracy of data for underrepresented groups. For example, Hispanic adults, Black adults and Asian adults were oversampled in 2019, 2022 and 2023, respectively.

Sample design

The overall target population for this survey was noninstitutionalized persons ages 18 and older living in the United States. All active panel members were invited to participate in this wave.

Questionnaire development and testing

The questionnaire was developed by Pew Research Center in consultation with SSRS. The web program used for online respondents was rigorously tested on both PC and mobile devices by the SSRS project team and Pew Research Center researchers. The SSRS project team also populated test data that was analyzed in SPSS to ensure the logic and randomizations were working as intended before launching the survey.

Incentives

All respondents were offered a post-paid incentive for their participation. Respondents could choose to receive the post-paid incentive in the form of a check or gift code to Amazon.com, Target.com or Walmart.com. Incentive amounts ranged from $5 to $20 depending on whether the respondent belongs to a part of the population that is harder or easier to reach. Differential incentive amounts were designed to increase panel survey participation among groups that traditionally have low survey response propensities.

Data collection protocol

The data collection field period for this survey was March 10 to March 16, 2025. Surveys were conducted via self-administered web survey or by live telephone interviewing. 

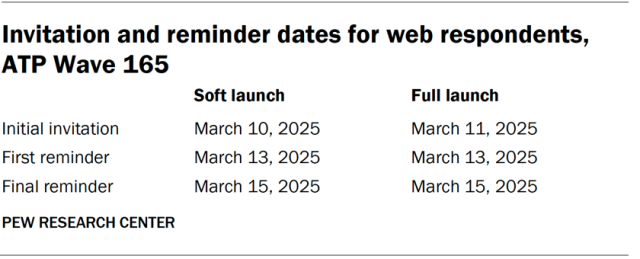
For panelists who take surveys online:3 Postcard notifications were mailed to a subset on March 10.4 Survey invitations were sent out in two separate launches: soft launch and full launch. Sixty panelists were included in the soft launch, which began with an initial invitation sent on March 10. All remaining English- and Spanish-speaking sampled online panelists were included in the full launch and were sent an invitation on March 11.

A table showing the invitation and reminder dates for web respondents, ATP Wave 165.

Panelists participating online were sent an email invitation and up to two email reminders if they did not respond to the survey. ATP panelists who consented to SMS messages were sent an SMS invitation with a link to the survey and up to two SMS reminders.

For panelists who take surveys over the phone with a live interviewer: Prenotification postcards were mailed on March 7. Soft launch took place on March 11 and involved dialing until a total of four interviews had been completed. All remaining English- and Spanish-speaking sampled phone panelists’ numbers were dialed throughout the remaining field period. Panelists who take surveys via phone can receive up to six calls from trained SSRS interviewers.

Data quality checks

To ensure high-quality data, Center researchers performed data quality checks to identify any respondents showing patterns of satisficing. This includes checking for whether respondents left questions blank at very high rates or always selected the first or last answer presented. As a result of this checking, four ATP respondents were removed from the survey dataset prior to weighting and analysis.

Weighting

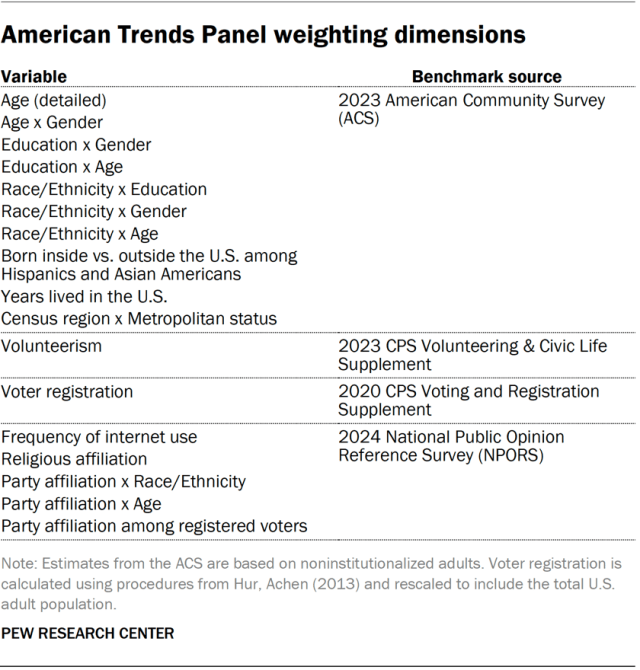
The ATP data is weighted in a process that accounts for multiple stages of sampling and nonresponse that occur at different points in the panel survey process. First, each panelist begins with a base weight that reflects their probability of recruitment into the panel. These weights are then calibrated to align with the population benchmarks in the accompanying table to correct for nonresponse to recruitment surveys and panel attrition. If only a subsample of panelists was invited to participate in the wave, this weight is adjusted to account for any differential probabilities of selection.

Among the panelists who completed the survey, this weight is then calibrated again to align with the population benchmarks identified in the accompanying table and trimmed at the 1st and 99th percentiles to reduce the loss in precision stemming from variance in the weights. Sampling errors and tests of statistical significance take into account the effect of weighting.

A table showing the American Trends Panel weighting dimensions.

The following table shows the unweighted sample sizes and the error attributable to sampling that would be expected at the 95% level of confidence for different groups in the survey.

A table showing the sample sizes and margins of error, ATP Wave 165.

Sample sizes and sampling errors for other subgroups are available upon request. In addition to sampling error, one should bear in mind that question wording and practical difficulties in conducting surveys can introduce error or bias into the findings of opinion polls.

Dispositions and response rates

A table showing the final dispositions, ATP Wave 165.
A table showing the cumulative response rate, ATP Wave 165.

Selection of news sources

We limited ourselves to 30 news sources in this survey to avoid putting an undue burden on survey respondents, who may have trouble processing an even longer list. We used a variety of criteria, such as web traffic, TV ratings and the results of previous surveys that indicated people’s main sources for news, to make decisions about which sources to include among the 30.
 
We also set out to ask about a range of sources across different platforms (e.g., internet, television, print, radio, and new media like podcasts and social media). Relatedly, we wanted to capture different elements of the information environment, such as both legacy news outlets and newer, nontraditional news sources.

The sources include:

  • News divisions of the three major broadcast commercial television networks (ABC News, CBS News, NBC News)
  • Three major cable TV news networks (CNN, Fox News Channel and MSNBC)
  • Two major Spanish-language TV networks (Univision, Telemundo)
  • Two major public broadcast radio or TV networks (NPR and PBS)
  • Four of the largest newspapers by U.S. national circulation, according to a Pew Research Center analysis of Alliance for Audited Media data for the third quarter of 2024 (The New York Times, The Washington Post, The Wall Street Journal and the New York Post)
  • Four outlets named by at least 0.5% of respondents in a 2024 open-ended question asking about respondents’ main source for election news (Newsmax, BBC News, The Daily Wire, The Associated Press)
  • One outlet named in the 2024 election main source open end that also was recently given office space at the Pentagon (Breitbart)
  • The most-named podcast in a 2022 open end asking about the primary podcast Americans listen to the most (The Joe Rogan Experience)
  • One source named in a 2024 survey asking what news influencer first comes to mind for Americans who regularly get news from news influencers, who also has comparatively high social media follower counts (Tucker Carlson Network)
  • Seven news websites, regardless of their original platform, that primarily cover general or political news and had comparatively high numbers of U.S. unique visitors during the second and third quarters of 2024, according to Comscore Media Metrix® Multi-Platform data (USA Today, HuffPost, Newsweek, Politico, The Hill, The Atlantic and Axios)
  • One international news website with the highest number of U.S. unique visitors during the second and third quarters of 2024, according to Comscore (The Guardian)
  • One business news website with the highest number of U.S. unique visitors during the second and third quarters of 2024, according to Comscore (Forbes)

Questions asked about news sources

First, respondents were shown a list of 30 sources, including their logos, and asked to select the sources that they had heard of. They were then shown a list of the sources they indicated they had heard of and asked to select those they generally trusted as a source of news. They were then shown a list of sources that they had heard of, but did not say they trusted, and asked to select those they generally distrusted as a source of news. Finally, they were shown the list of all of the sources they had heard of and asked to select those that they regularly get news from. Refer to the questionnaire for exact question wording.

Calculating each news source’s trust ratio

Some graphics in the report and the data tool visualizing trust and distrust in each news source use a trust ratio. If the share of respondents who said they trusted the news source was greater than the share who said they distrusted the source, the ratio was calculated as trust divided by distrust. If the share who said they distrusted the source was greater than the share who trusted the source, the ratio was calculated as a negative distrust value divided by the trust value, so that a source may be “__ times more trusted than distrusted” or “__ times more distrusted than trusted.”

Average placement of news sources by audience party and ideology

The average audience placement of each of the 30 news sources in a number line is based on an index of respondents’ self-reported party identification (or those who lean toward either party) and political ideology. Each respondent was assigned a value on an eight-point index based on their responses to questions about their party identification and political ideology. The placement of each source’s audience is based on the average index value of U.S. adults who report regularly getting news from each source. The number values in the index (from left to right) are:

  • 1 = Very liberal Democrat/lean Democrat
  • 2 = Liberal Democrat/lean Democrat
  • 3 = Moderate Democrat/lean Democrat
  • 4 = Very conservative or conservative Democrat/lean Democrat
  • 5 = Very liberal or liberal Republican/lean Republican
  • 6 = Moderate Republican/lean Republican
  • 7 = Conservative Republican/lean Republican
  • 8 = Very conservative Republican/lean Republican

Appendix A