
As women’s representation in U.S. politics has grown, 53% of Americans say there are still too few women in high political office in the United States, and many see significant obstacles for women candidates. Our 2023 report on women leaders in politics explores Americans’ views about gender and political leadership, as well as views about the barriers women face.
Related: Attitudes toward women in business leadership
Below, we’ve charted the most up-to-date data on the share of women in top U.S. political, business and higher education positions over time.

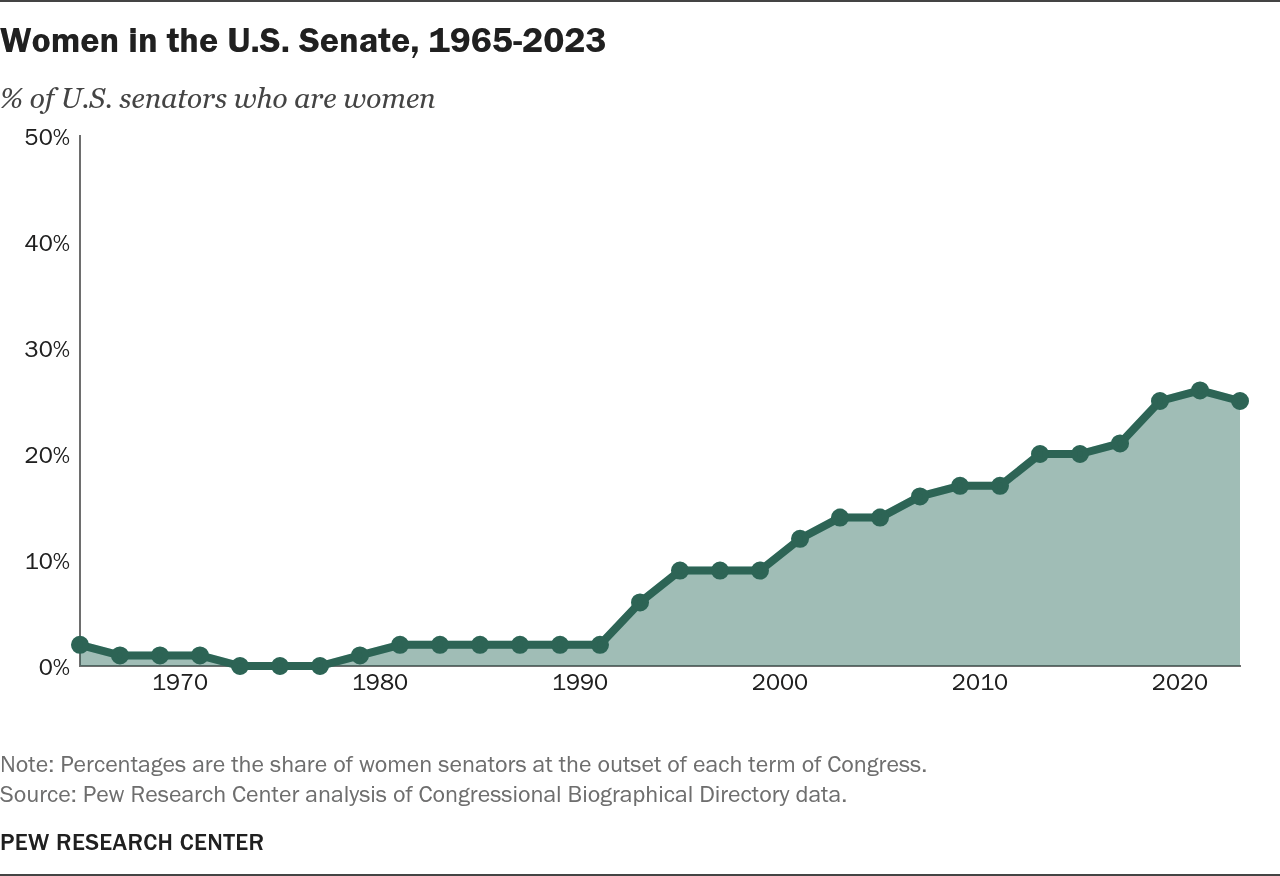
U.S. Senate
| Starting date of congressional term | Share of U.S. senators who are women |
|---|---|
| 1965 | 2% |
| 1967 | 1% |
| 1969 | 1% |
| 1971 | 1% |
| 1973 | 0% |
| 1975 | 0% |
| 1977 | 0% |
| 1979 | 1% |
| 1981 | 2% |
| 1983 | 2% |
| 1985 | 2% |
| 1987 | 2% |
| 1989 | 2% |
| 1991 | 2% |
| 1993 | 6% |
| 1995 | 9% |
| 1997 | 9% |
| 1999 | 9% |
| 2001 | 12% |
| 2003 | 14% |
| 2005 | 14% |
| 2007 | 16% |
| 2009 | 17% |
| 2011 | 17% |
| 2013 | 20% |
| 2015 | 20% |
| 2017 | 21% |
| 2019 | 25% |
| 2021 | 26% |
| 2023 | 25% |
At the start of the 118th Congress in 2023, there were 25 women serving in the U.S. Senate, just shy of the record 26 women senators sworn in on the first day of the previous Congress. (The count for the previous Congress includes Vice President Kamala Harris and former Georgia Sen. Kelly Loeffler. Both were sworn in on the first day and left the Senate shortly after.)
Of the 25 women senators:
- 16 are Democrats and nine are Republicans.
- 22 are White, two are Asian American and one is Hispanic. No Black women currently serve in the Senate, nor do any American Indian or Alaska Native women.
The first-ever woman in the Senate was Rebecca Latimer Felton, D-Ga., who was appointed to the seat as a political maneuver in 1922 and served just one day. Nancy Kassebaum, R-Kan., who served in the Senate from 1978 to 1997, was the first woman senator who was elected for a full term without having a spousal connection to Congress.

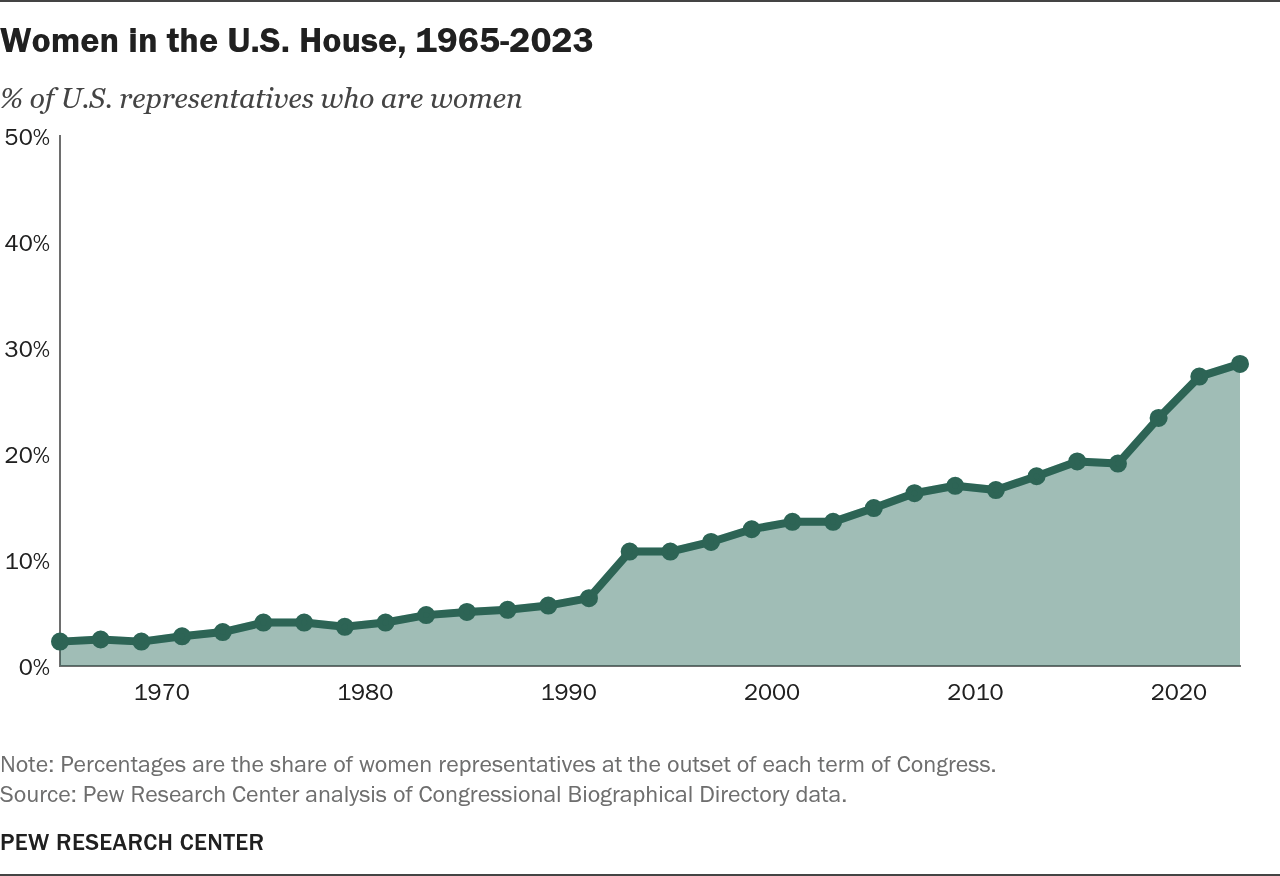
U.S. House
| Starting date of congressional term | Share of U.S. representatives who are women |
|---|---|
| 1965 | 2.3% |
| 1967 | 2.5% |
| 1969 | 2.3% |
| 1971 | 2.8% |
| 1973 | 3.2% |
| 1975 | 4.1% |
| 1977 | 4.1% |
| 1979 | 3.7% |
| 1981 | 4.1% |
| 1983 | 4.8% |
| 1985 | 5.1% |
| 1987 | 5.3% |
| 1989 | 5.7% |
| 1991 | 6.4% |
| 1993 | 10.8% |
| 1995 | 10.8% |
| 1997 | 11.7% |
| 1999 | 12.9% |
| 2001 | 13.6% |
| 2003 | 13.6% |
| 2005 | 14.9% |
| 2007 | 16.3% |
| 2009 | 17.0% |
| 2011 | 16.6% |
| 2013 | 17.9% |
| 2015 | 19.3% |
| 2017 | 19.1% |
| 2019 | 23.4% |
| 2021 | 27.3% |
| 2023 | 28.5% |
On the first day of the 118th Congress, 124 women were voting members in the House of Representatives, making up 28.5% of the chamber’s voting membership. In addition, four women serve as nonvoting delegates to Congress, representing American Samoa, the District of Columbia, Puerto Rico and the U.S. Virgin Islands.
Of the women voting representatives sworn in on the first day of the session:
- 91 are Democrats and 33 are Republicans.
- 26 are Black, 18 are Hispanic, seven are Asian American, two are Native American and one is multiracial.
Jeannette Rankin, R-Mont., was the first woman to be elected to Congress, taking office in 1917. Nancy Pelosi, D-Calif., is the only woman to have served as speaker of the House. She was speaker from 2007 to 2011, served as the minority leader in the Republican-controlled House from 2011 to 2019 and was elected speaker again from 2019 to 2023.

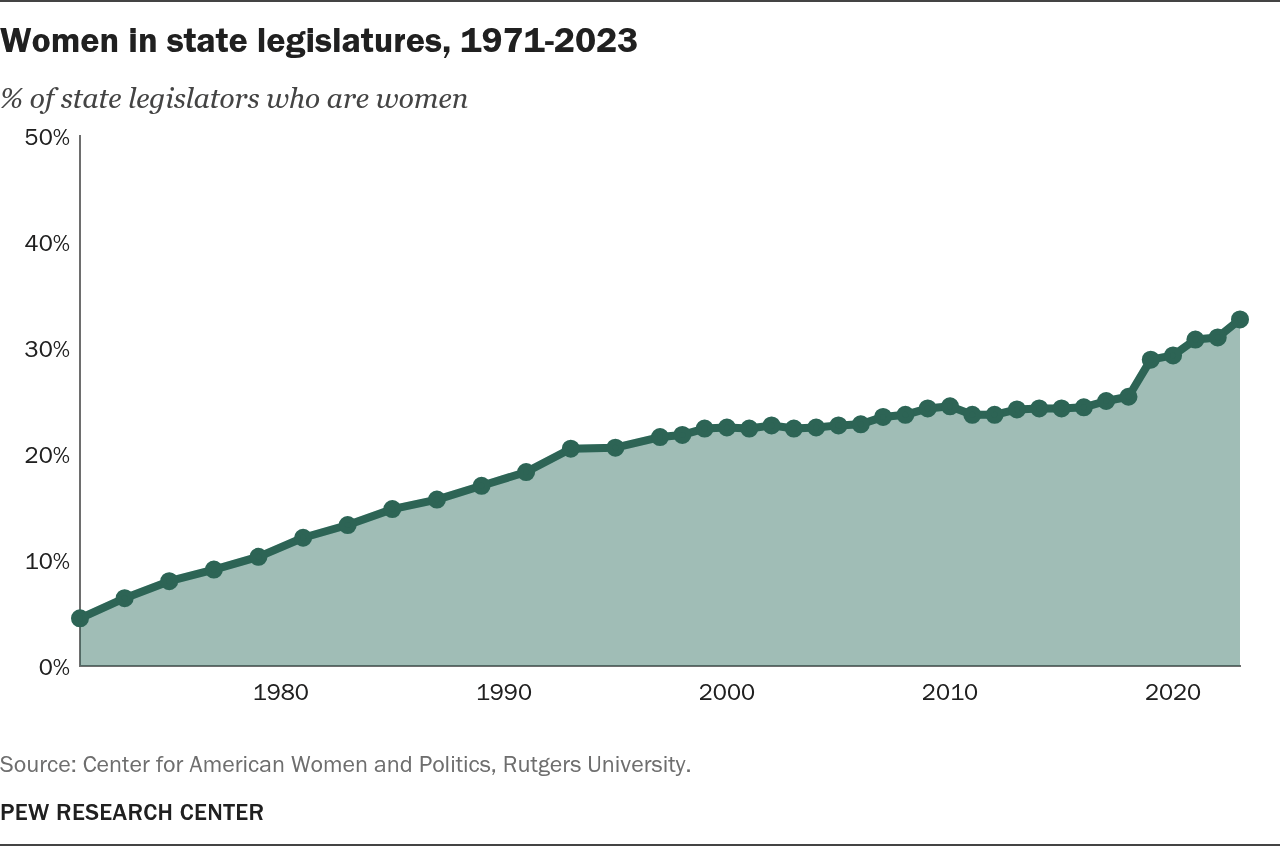
State legislatures
| Year | Share of state legislators who are women |
|---|---|
| 1971 | 4.5% |
| 1973 | 6.4% |
| 1975 | 8.0% |
| 1977 | 9.1% |
| 1979 | 10.3% |
| 1981 | 12.1% |
| 1983 | 13.3% |
| 1985 | 14.8% |
| 1987 | 15.7% |
| 1989 | 17.0% |
| 1991 | 18.3% |
| 1993 | 20.5% |
| 1995 | 20.6% |
| 1997 | 21.6% |
| 1998 | 21.8% |
| 1999 | 22.4% |
| 2000 | 22.5% |
| 2001 | 22.4% |
| 2002 | 22.7% |
| 2003 | 22.4% |
| 2004 | 22.5% |
| 2005 | 22.7% |
| 2006 | 22.8% |
| 2007 | 23.5% |
| 2008 | 23.7% |
| 2009 | 24.3% |
| 2010 | 24.5% |
| 2011 | 23.7% |
| 2012 | 23.7% |
| 2013 | 24.2% |
| 2014 | 24.3% |
| 2015 | 24.3% |
| 2016 | 24.4% |
| 2017 | 25.0% |
| 2018 | 25.4% |
| 2019 | 28.9% |
| 2020 | 29.3% |
| 2021 | 30.8% |
| 2022 | 31.00% |
| 2023 | 32.70% |
Women make up 29.9% of state senate seats and 33.7% of state house or assembly seats. Three women serve as state senate president, and another 13 as senate presidents pro tempore. An additional eight are speakers of state houses.
In 2019, Nevada became the first state with a majority-women state legislature. Women currently hold a 62% majority of the Nevada state legislature – the largest percentage of any state. West Virginia has the smallest share, at 11.9%.
The first women to serve in a state legislature were Clara Cressingham, Carrie C. Holly and Frances Klock, all Republicans who were elected to the Colorado House of Representatives in 1894.

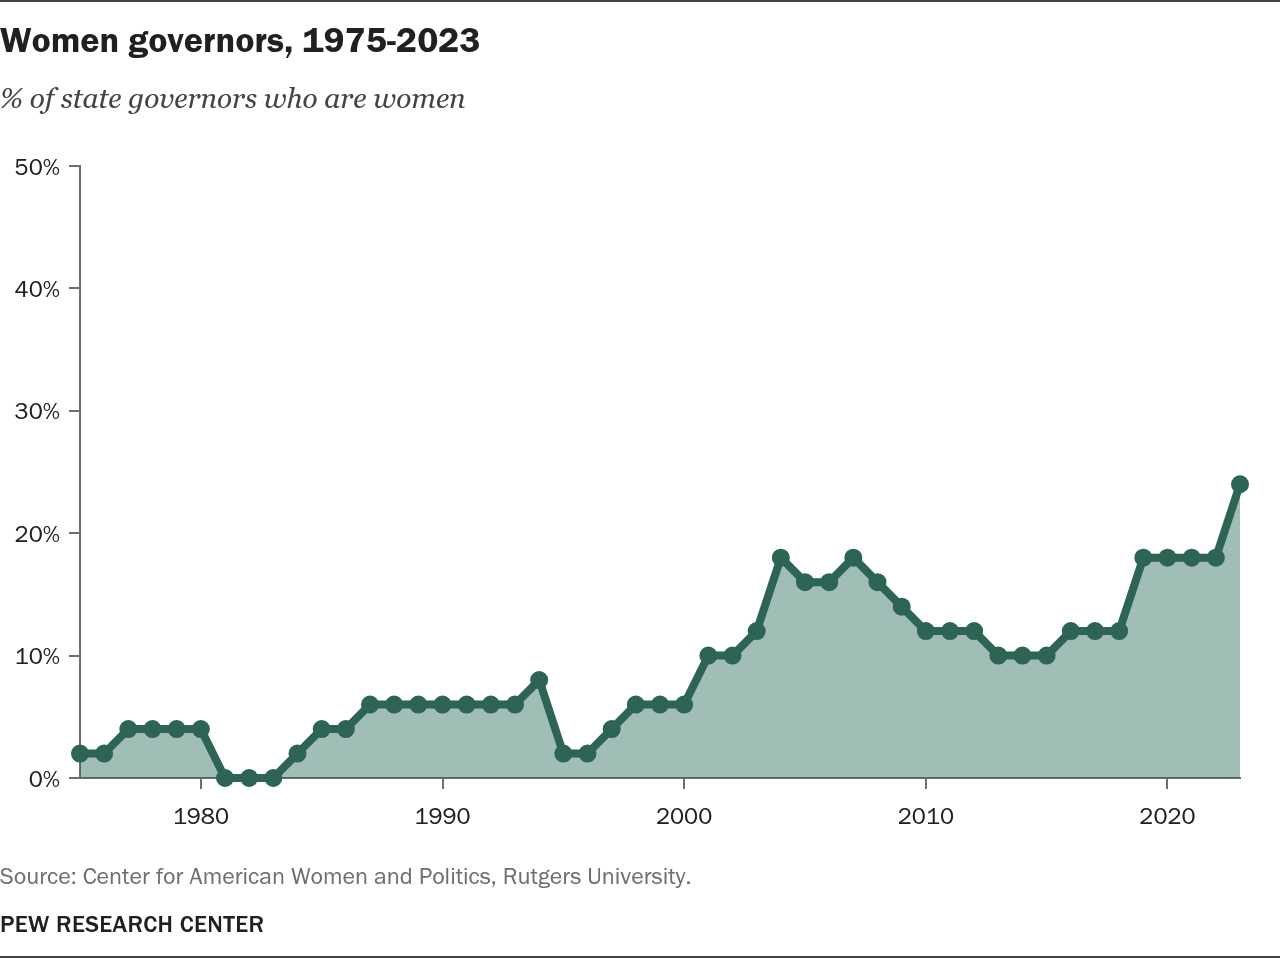
Governors
| Year | Share of state governors who are women |
|---|---|
| 1975 | 2% |
| 1976 | 2% |
| 1977 | 4% |
| 1978 | 4% |
| 1979 | 4% |
| 1980 | 4% |
| 1981 | 0% |
| 1982 | 0% |
| 1983 | 0% |
| 1984 | 2% |
| 1985 | 4% |
| 1986 | 4% |
| 1987 | 6% |
| 1988 | 6% |
| 1989 | 6% |
| 1990 | 6% |
| 1991 | 6% |
| 1992 | 6% |
| 1993 | 6% |
| 1994 | 8% |
| 1995 | 2% |
| 1996 | 2% |
| 1997 | 4% |
| 1998 | 6% |
| 1999 | 6% |
| 2000 | 6% |
| 2001 | 10% |
| 2002 | 10% |
| 2003 | 12% |
| 2004 | 18% |
| 2005 | 16% |
| 2006 | 16% |
| 2007 | 18% |
| 2008 | 16% |
| 2009 | 14% |
| 2010 | 12% |
| 2011 | 12% |
| 2012 | 12% |
| 2013 | 10% |
| 2014 | 10% |
| 2015 | 10% |
| 2016 | 12% |
| 2017 | 12% |
| 2018 | 12% |
| 2019 | 18% |
| 2020 | 18% |
| 2021 | 18% |
| 2022 | 18% |
| 2023 | 24% |
To date, 49 women have served as governors in 32 states. In 2023, eight Democratic and four Republican women serve as governors.
Wyoming Democrat Nellie Tayloe Ross was the first woman governor. She assumed office by a special election in 1924 to succeed her deceased husband. Ella Grasso, a Connecticut Democrat, was the first woman governor elected without spousal connections, in 1975.

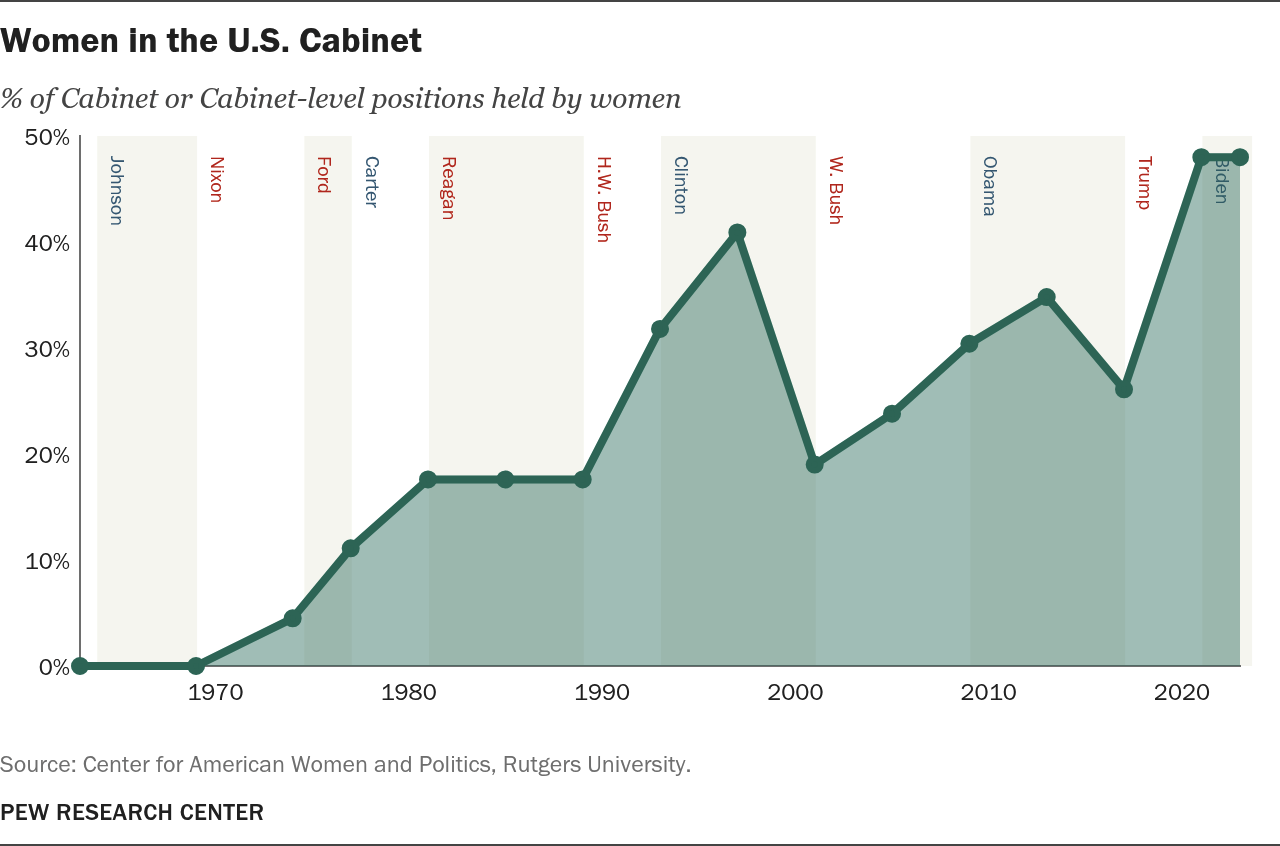
Cabinet-level positions
| Administration | Share of Cabinet positions held by women |
|---|---|
| 1963 | 0.0% |
| 1969 | 0.0% |
| 1973 | N/A |
| 1974 | 4.5% |
| 1977 | 11.1% |
| 1981 | 17.6% |
| 1985 | 17.6% |
| 1989 | 17.6% |
| 1993 | 31.8% |
| 1997 | 40.9% |
| 2001 | 19.0% |
| 2005 | 23.8% |
| 2009 | 30.4% |
| 2013 | 34.8% |
| 2017 | 26.1% |
| 2021 | 48.0% |
| 2023 | 48.0% |
President Joe Biden’s Cabinet includes 12 women out of the 25 positions he has designated as Cabinet or Cabinet-level. That is the highest share of women in history, at 48%. Former President Bill Clinton’s second-term Cabinet had the second-highest share of women, at 41%.
Under Biden, three of the top Cabinet posts – the vice president, secretary of treasury and director of national intelligence – are each held by women for the first time. Biden’s Cabinet includes four White women, four Black women, one Asian American woman, one Hispanic woman, one American Indian woman and one multiracial woman.
The first woman in a Cabinet-level position was Frances Perkins, appointed as secretary of labor by then-President Franklin D. Roosevelt in 1933. To date, seven women have served as labor secretary, more than in any other Cabinet or Cabinet-level position.

Fortune 500 CEOs

| Year | Share of CEOs who are women |
|---|---|
| 1995 | 0.0% |
| 1996 | 0.2% |
| 1997 | 0.4% |
| 1998 | 0.4% |
| 1999 | 0.4% |
| 2000 | 0.4% |
| 2001 | 0.8% |
| 2002 | 1.2% |
| 2003 | 1.4% |
| 2004 | 1.6% |
| 2005 | 1.8% |
| 2006 | 2.0% |
| 2007 | 2.4% |
| 2008 | 2.4% |
| 2009 | 3.0% |
| 2010 | 3.0% |
| 2011 | 2.4% |
| 2012 | 3.6% |
| 2013 | 4.0% |
| 2014 | 4.8% |
| 2015 | 4.8% |
| 2016 | 4.2% |
| 2017 | 6.4% |
| 2018 | 4.8% |
| 2019 | 6.6% |
| 2020 | 7.4% |
| 2021 | 8.20% |
| 2022 | 8.80% |
| 2023 | 10.60% |
The share of women CEOs of Fortune 500 companies reached an all-time high of 10.6% in 2023, with 53 women heading major firms.
Katharine Graham of The Washington Post Co. was the first woman CEO to make the Fortune 500 list, in 1972.

Fortune 500 board members

| Year | Share of board members who are women |
|---|---|
| 1995 | 9.6% |
| 1996 | 10.2% |
| 1997 | 10.6% |
| 1998 | 11.1% |
| 1999 | 11.2% |
| 2000 | 11.7% |
| 2001 | 12.4% |
| 2003 | 13.6% |
| 2005 | 14.7% |
| 2006 | 14.6% |
| 2007 | 14.8% |
| 2008 | 15.2% |
| 2009 | 15.2% |
| 2010 | 15.7% |
| 2011 | 16.1% |
| 2012 | 16.6% |
| 2013 | 16.9% |
| 2016 | 20.2% |
| 2017 | 22.2% |
| 2018 | 22.5% |
| 2019 | 27.0% |
| 2020 | 26.50% |
| 2021 | 30.00% |
| 2022 | 30.40% |
The share of women sitting on the boards of Fortune 500 companies has been gradually increasing for decades, from 9.6% in 1995 to 30.4% in 2022.

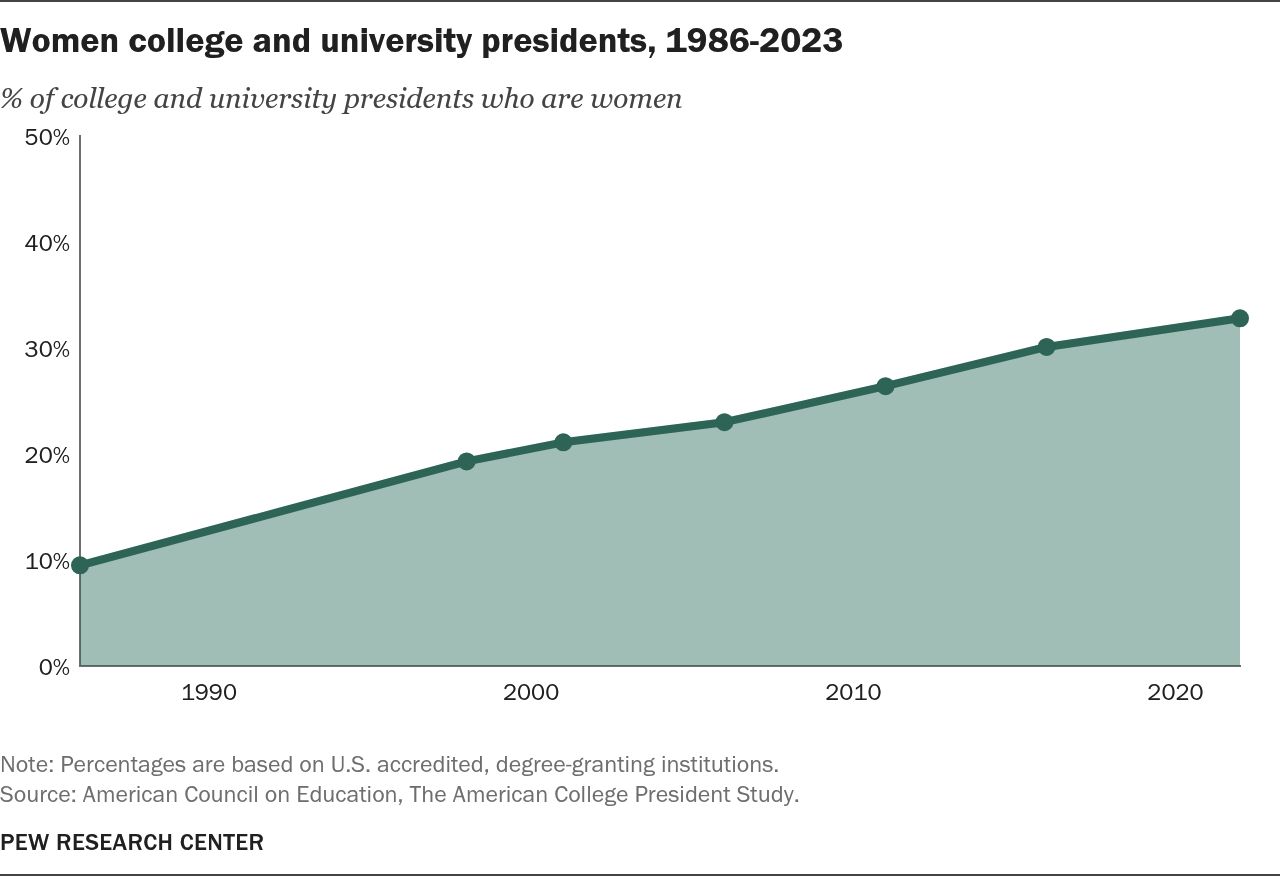
College and university presidents
| Year | Share of college and university presidents who are women |
|---|---|
| 1986 | 9.5% |
| 1998 | 19.3% |
| 2001 | 21.1% |
| 2006 | 23.0% |
| 2011 | 26.4% |
| 2016 | 30.1% |
| 2022 | 32.80% |
In 2022, 32.8% of university presidents were women, more than triple the share in 1986.
Frances Elizabeth Willard became the first woman college president in 1871, heading the Evanston College for Ladies in Illinois, which later merged with Northwestern University. In 1974, Lorene L. Rogers was the first woman to lead a major research university (University of Texas), and Judith Rodin in 1994 became the first permanent woman president of an Ivy League institution (University of Pennsylvania).
CORRECTION (Feb. 8, 2024): Due to a rounding error, a previous version of this analysis and an accompanying graphic misstated the percentage of voting members in the House of Representatives who were women at the start of the 118th Congress in 2023.
Note: This interactive was originally published in January 2015. It was updated in September 2023 to reflect more recent data.