
The United States at 250: How the Country Has Changed in the Past 50 Years

In July, the United States will celebrate its 250th anniversary. The country’s last major milestone was 50 years ago, at its bicentennial on July 4, 1976.
U.S. society has changed profoundly since then. Over the past five decades, the U.S. population has aged significantly, with the percentage of people 65 and older nearly doubling. The country has also become more racially and ethnically diverse, as growing shares of people identify as Asian or Hispanic. And following more than 70 million immigrant arrivals, the percentage of foreign-born people in the population has more than tripled.
Americans are also less likely to be married than ever before. Women – who now have far more options outside of the home than they did in 1976 – have contributed to a boom in higher education and helped expand the workforce. And even though many Americans are financially better off than they were 50 years ago, economic gaps have widened.
Ahead of the nation’s birthday, Pew Research Center identified some prominent trends across key areas of American life: demographics, work, family and economics. Our 50-year comparisons are based on U.S. Census Bureau data collected between 1970 and 2024.

Demographics
People celebrate the U.S. bicentennial in Beulah, Colorado. More than 2,100 U.S. citizenship candidates during a 2022 naturalization ceremony in Los Angeles. (Tony Korody/Sygma, Gary Coronado/Los Angeles Times via Getty Images)
The U.S. population has grown by more than 120 million people to a new total of roughly 340 million over the past 50 years, with much of that growth driven by immigrants, longer life spans, as well as Asian and Hispanic Americans. Geographically, there has been a significant movement of people to Southern and Western states.
An aging population
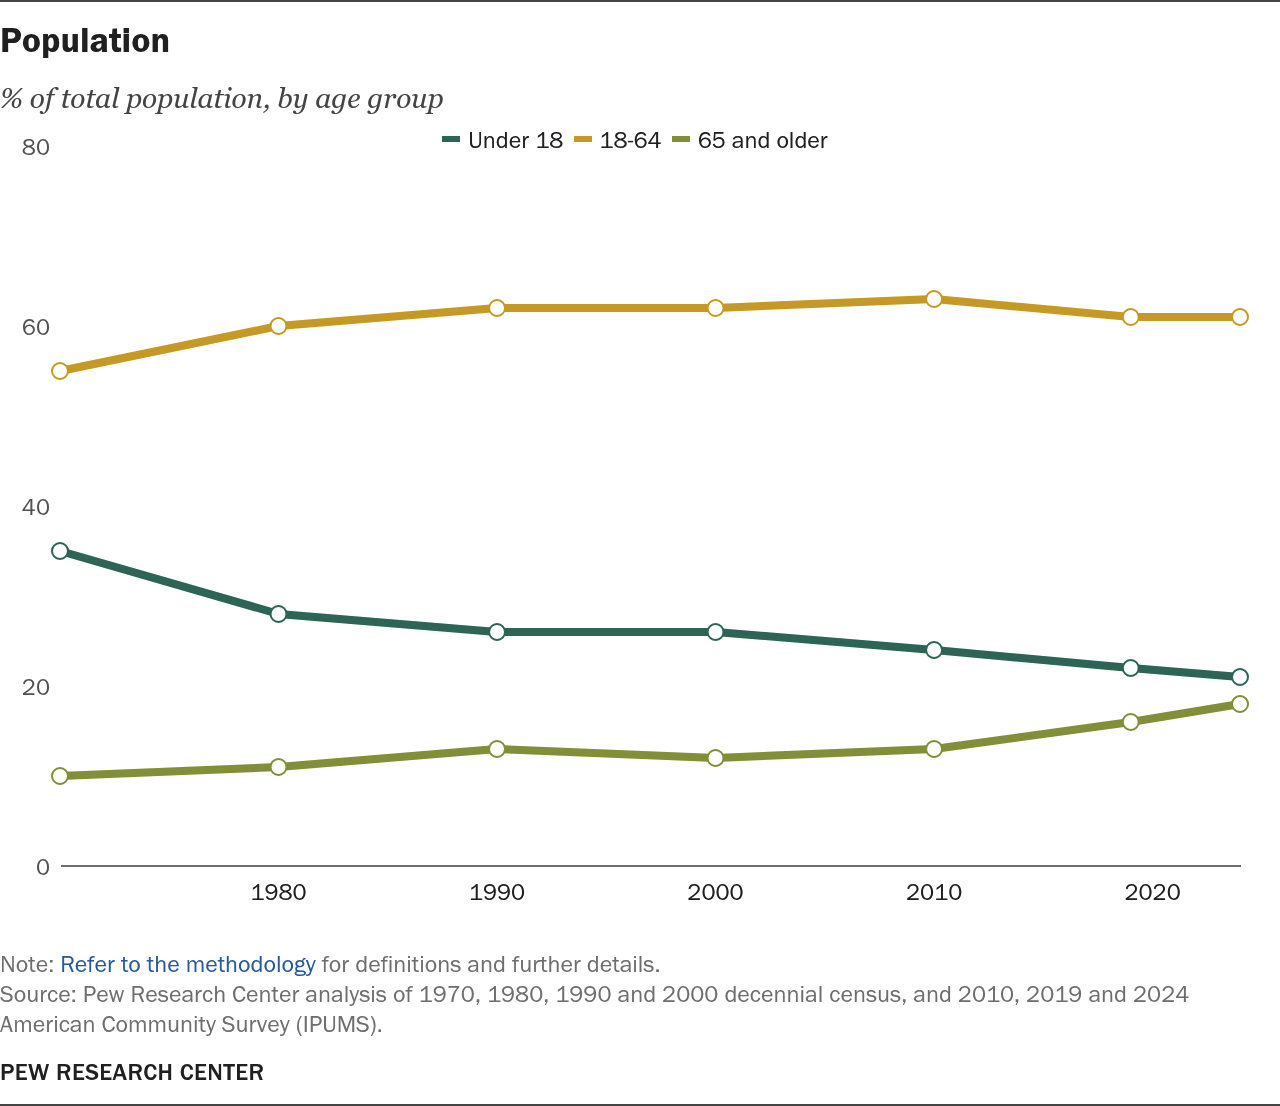
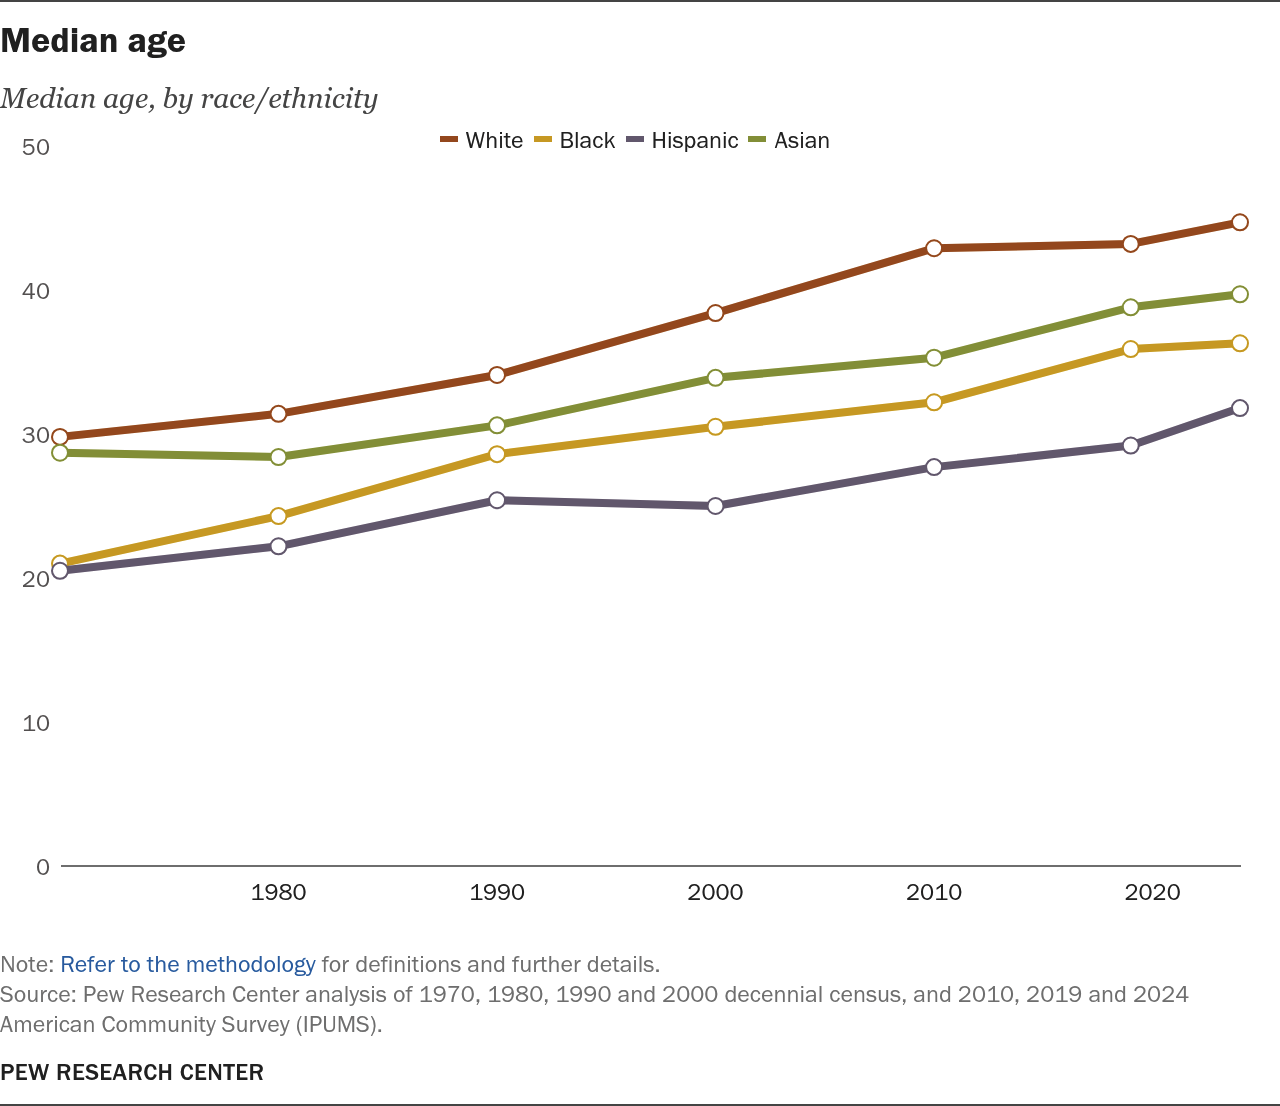
Since 1970, the share of Americans ages 65 and older has nearly doubled from 10% to 18%. The median age rose across racial and ethnic groups, but White Americans and Black Americans saw the sharpest increases.
A more diverse America
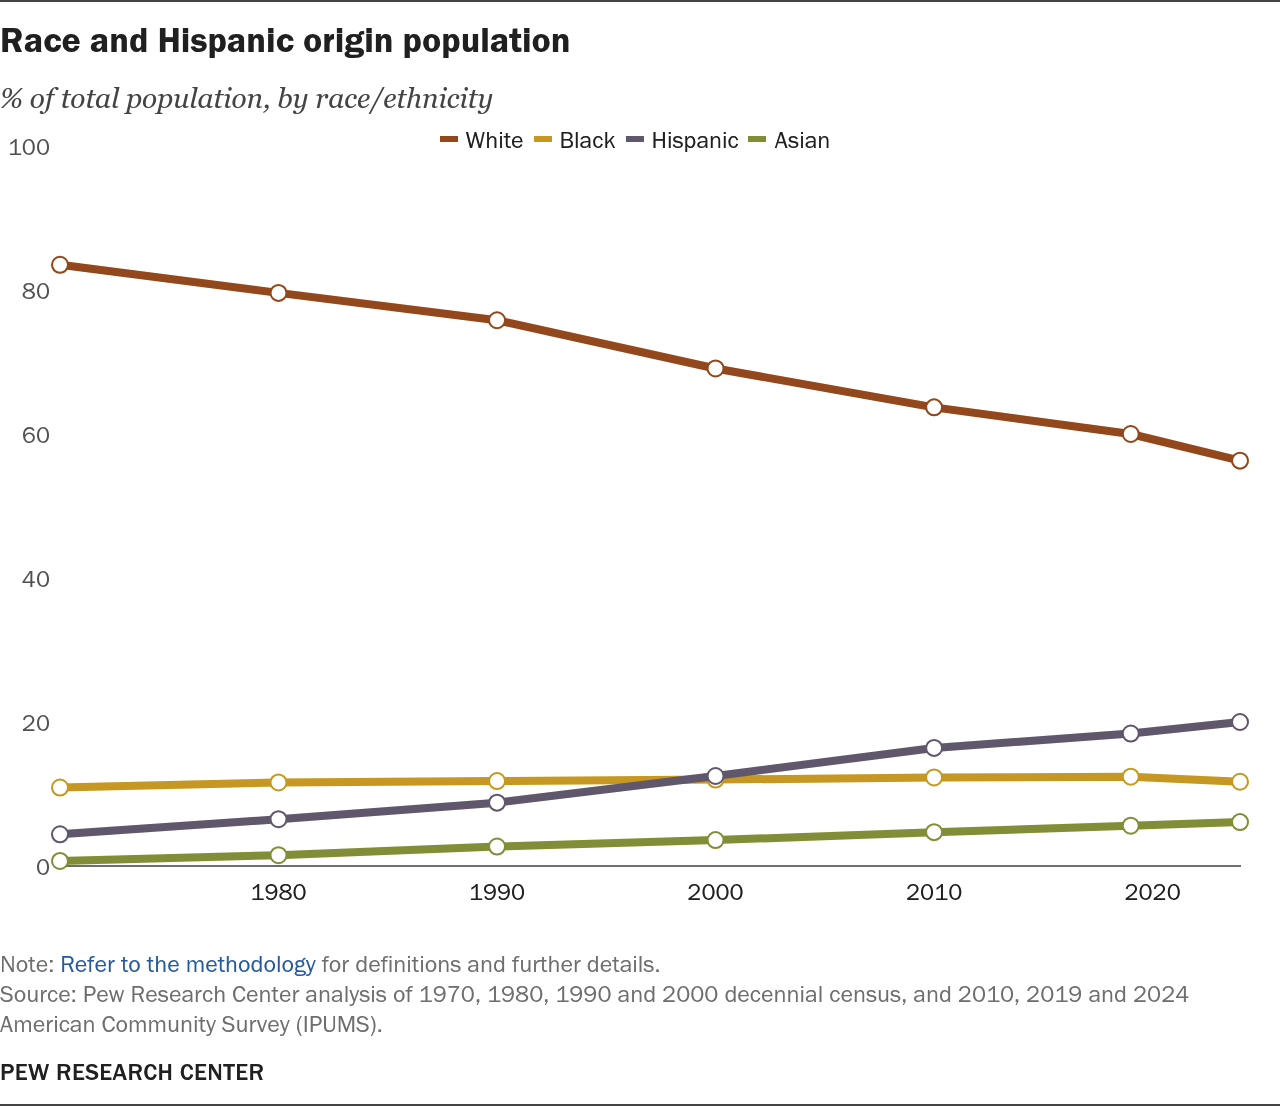
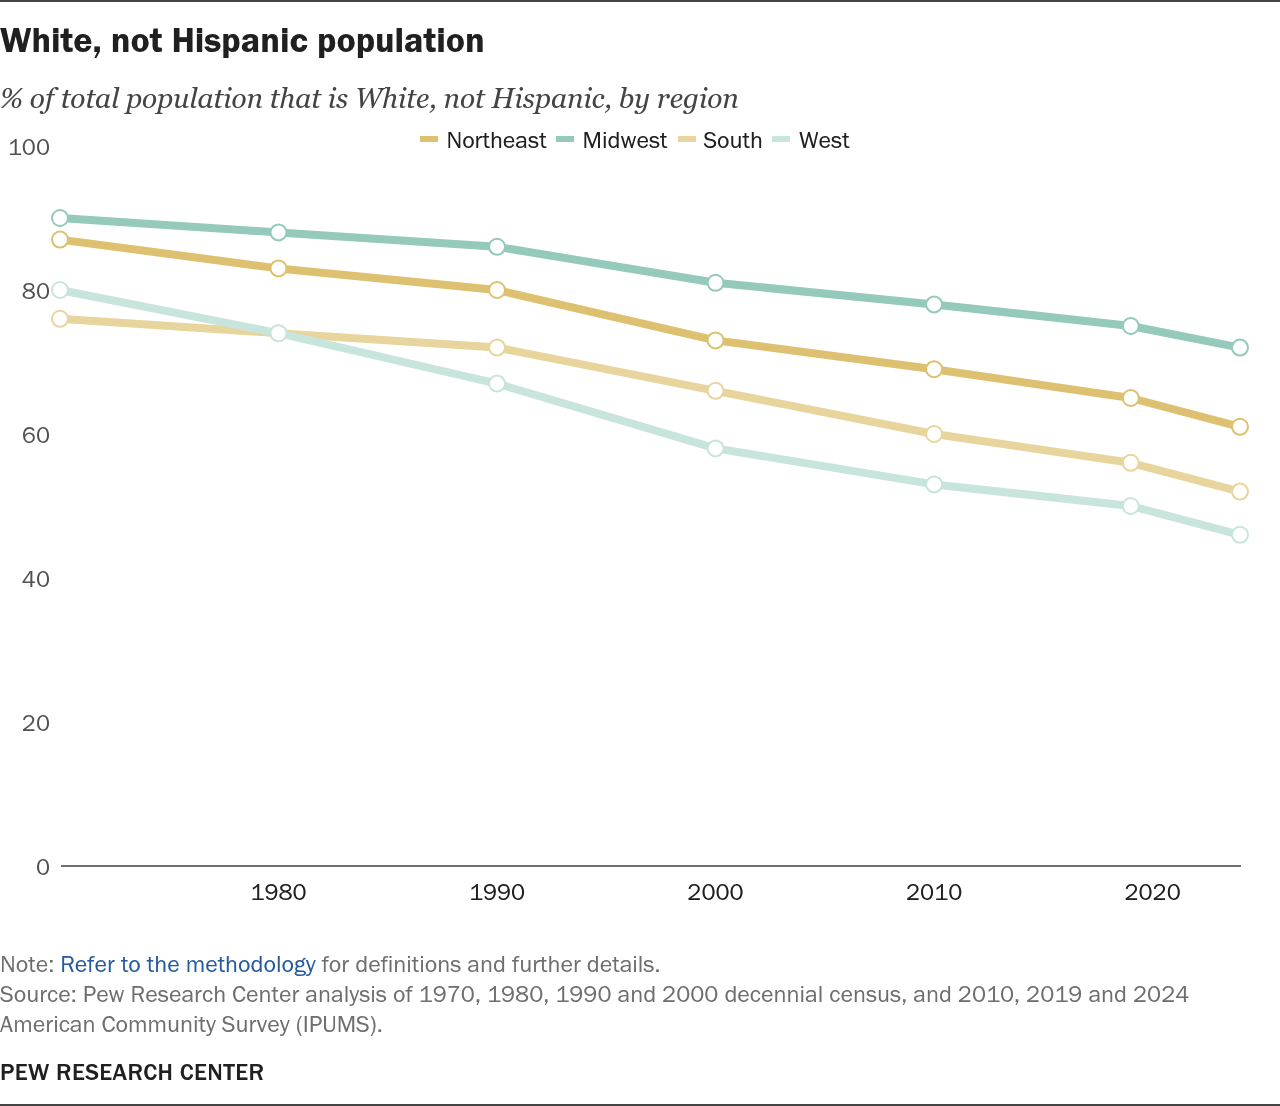
The share of the U.S. population that is White (and not Hispanic) has dropped steadily since 1970, while the share of Hispanics has more than quadrupled. White Americans now make up around half or less of the populations in the South and West.
A rising share of immigrants
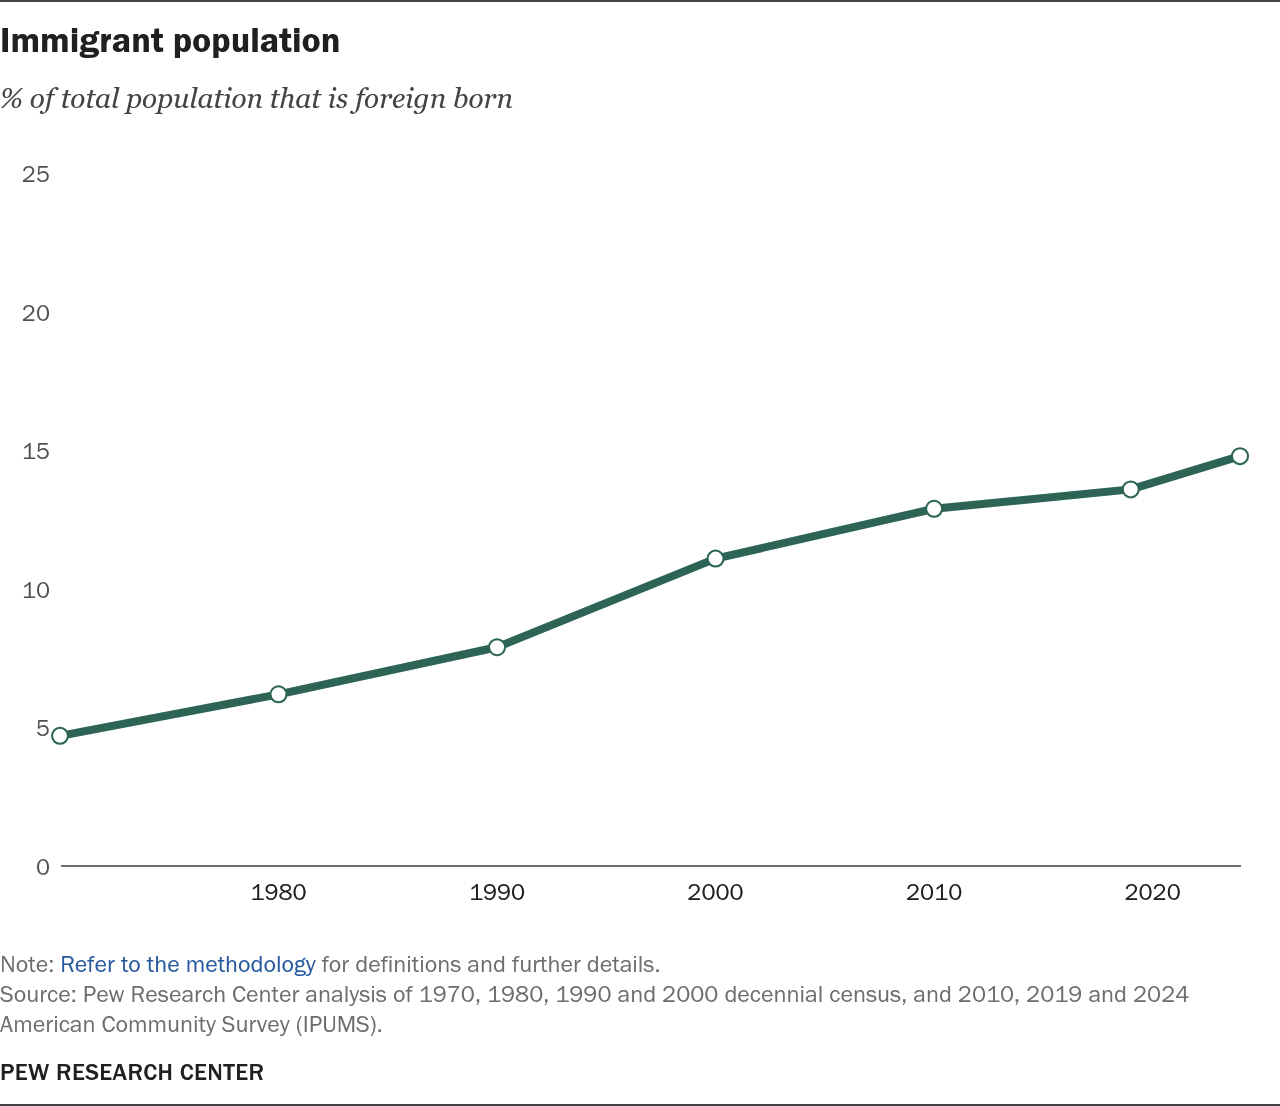
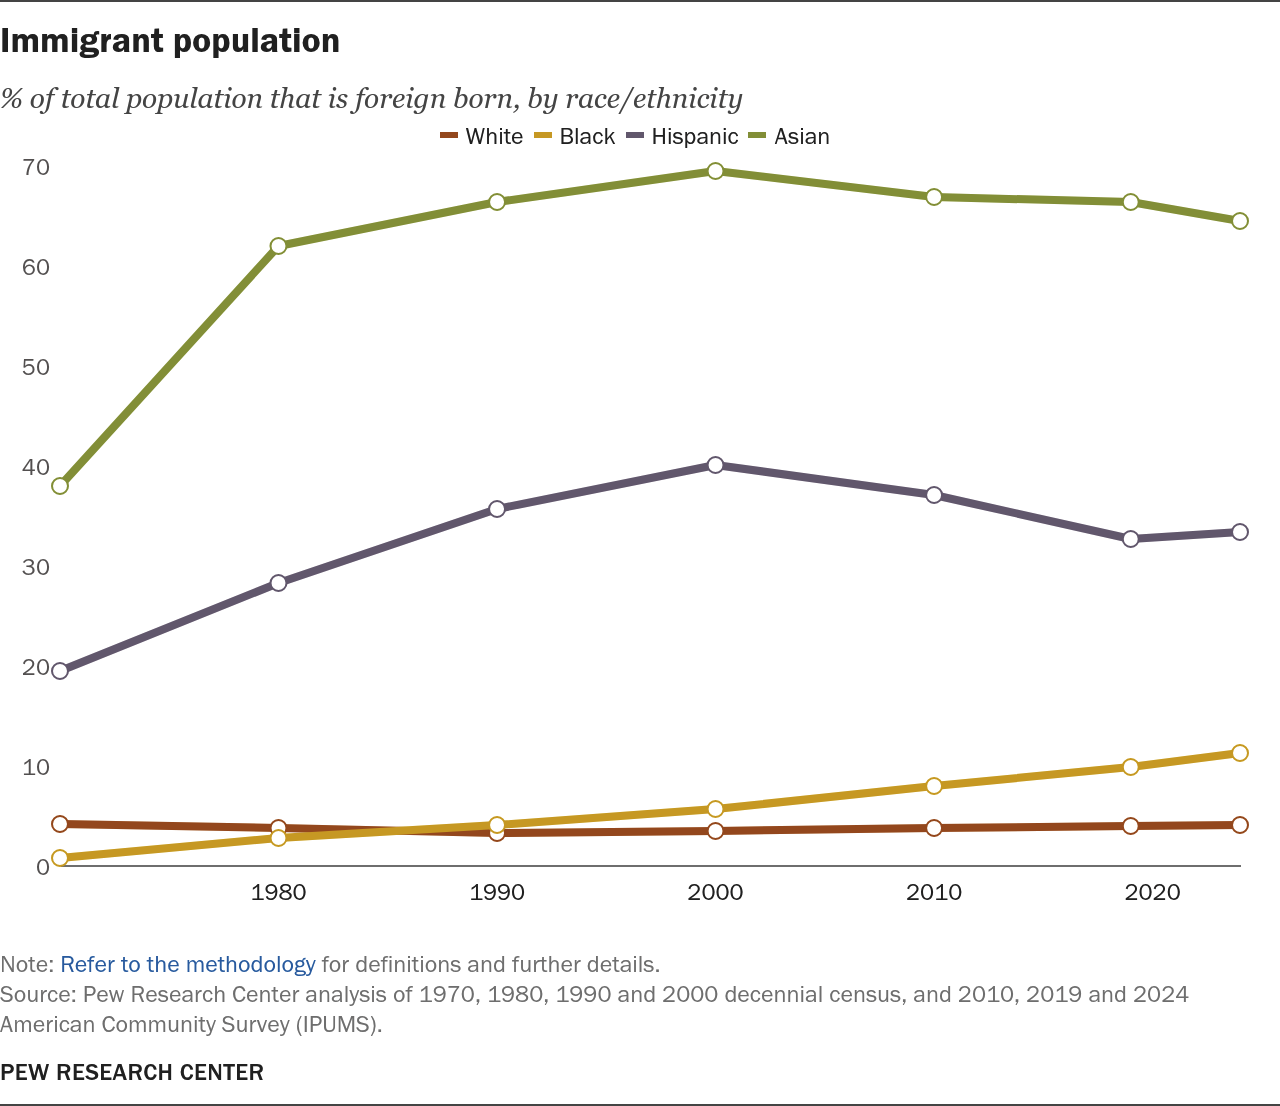
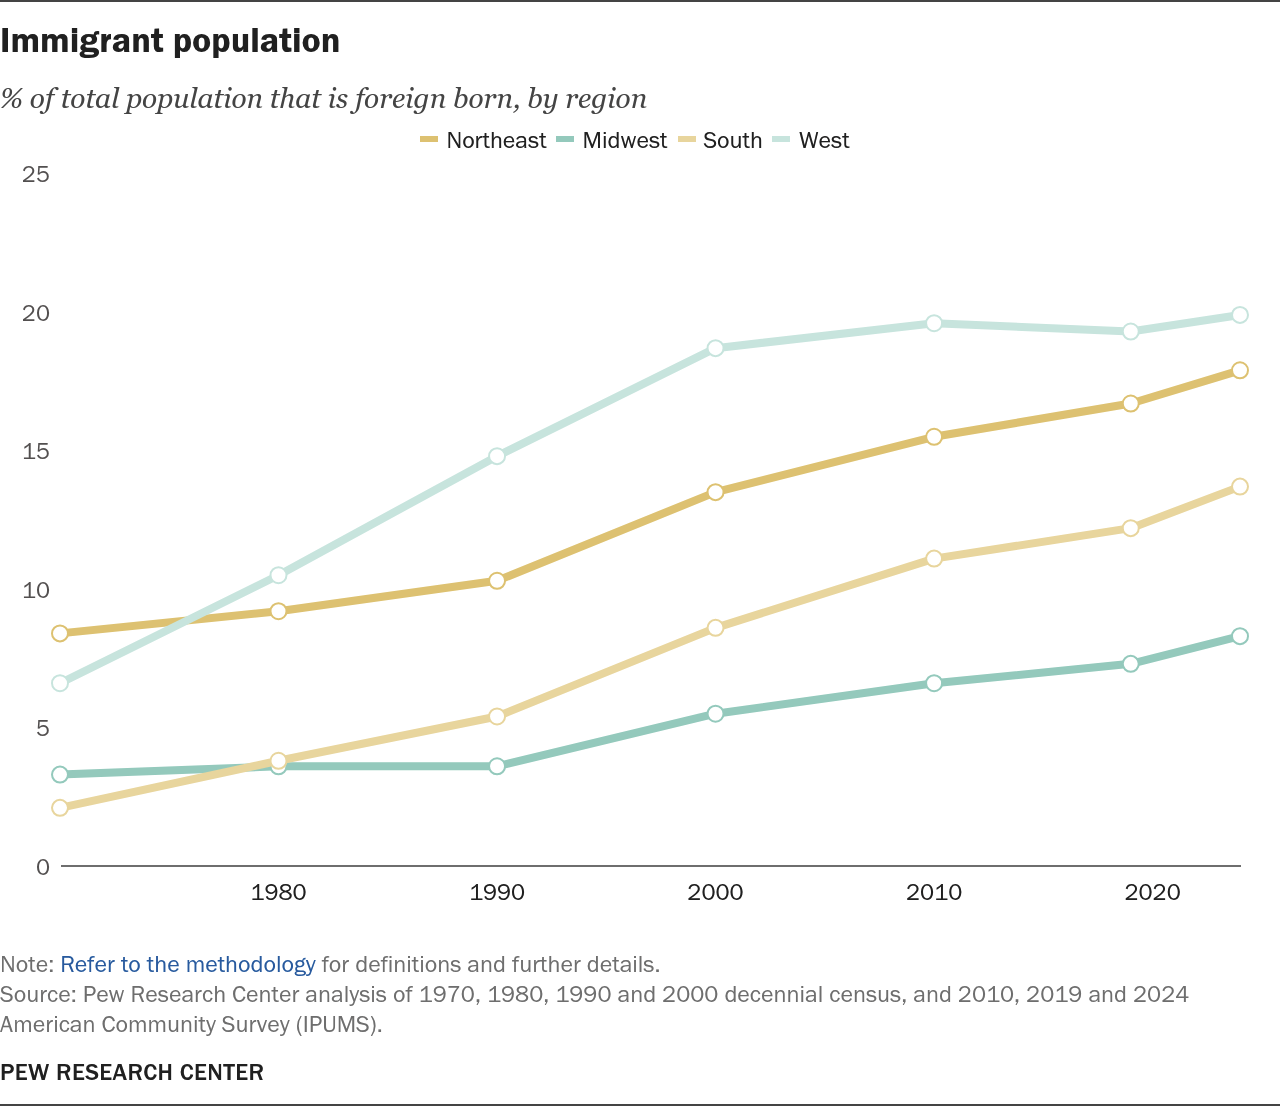
The share of foreign-born people in the U.S. has more than tripled since 1970 – from 4.7% (an all-time low) to 14.8% in 2024. The immigrant share is highest among Asian and Hispanic Americans, as well as those living in the West and the Northeast.
The rise of the Sunbelt
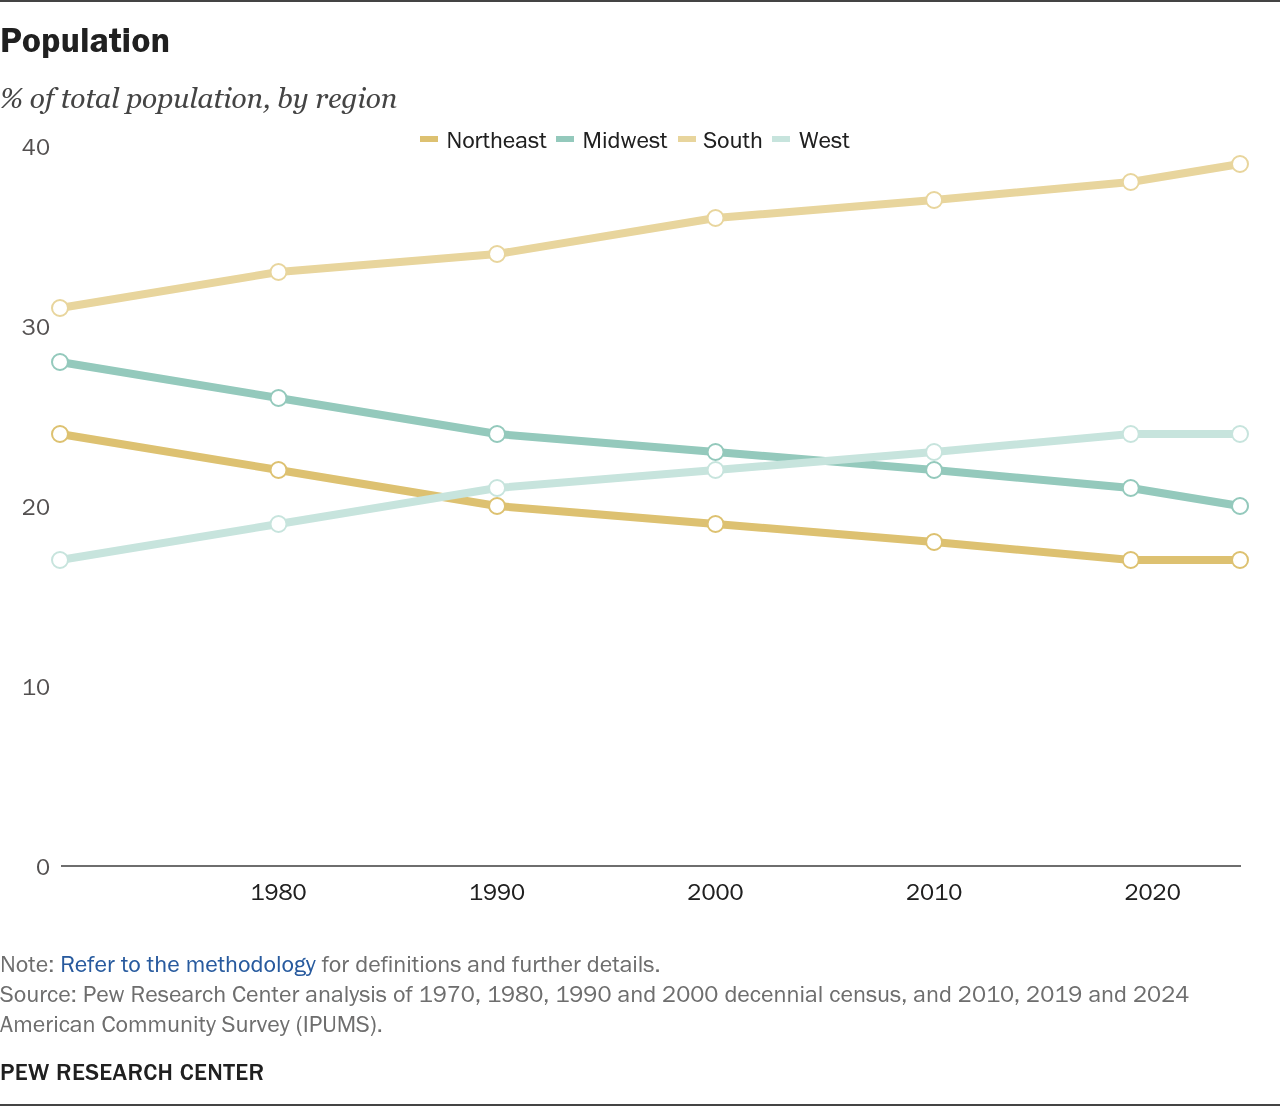
In 1970 less than half of the U.S. population lived in the South (31%) and West (17%), while today, more than six-in-ten Americans live in these states.

Work
Employees in the computer room of a Philadelphia IRS office in 1965. Traders analyze computer data in 2017. (Marion Trikosko/PhotoQuest, Tetra Images via Getty Images)
The transformation of the U.S. from an industrial economy to a service- and information-based economy has been accompanied by major changes in the workforce. Higher education enrollments vastly expanded, leading to more adults completing college. The U.S. labor force has grown, in no small part due to the increase in women working outside the home. Overall, earnings for the typical worker have increased.
Gains in higher education
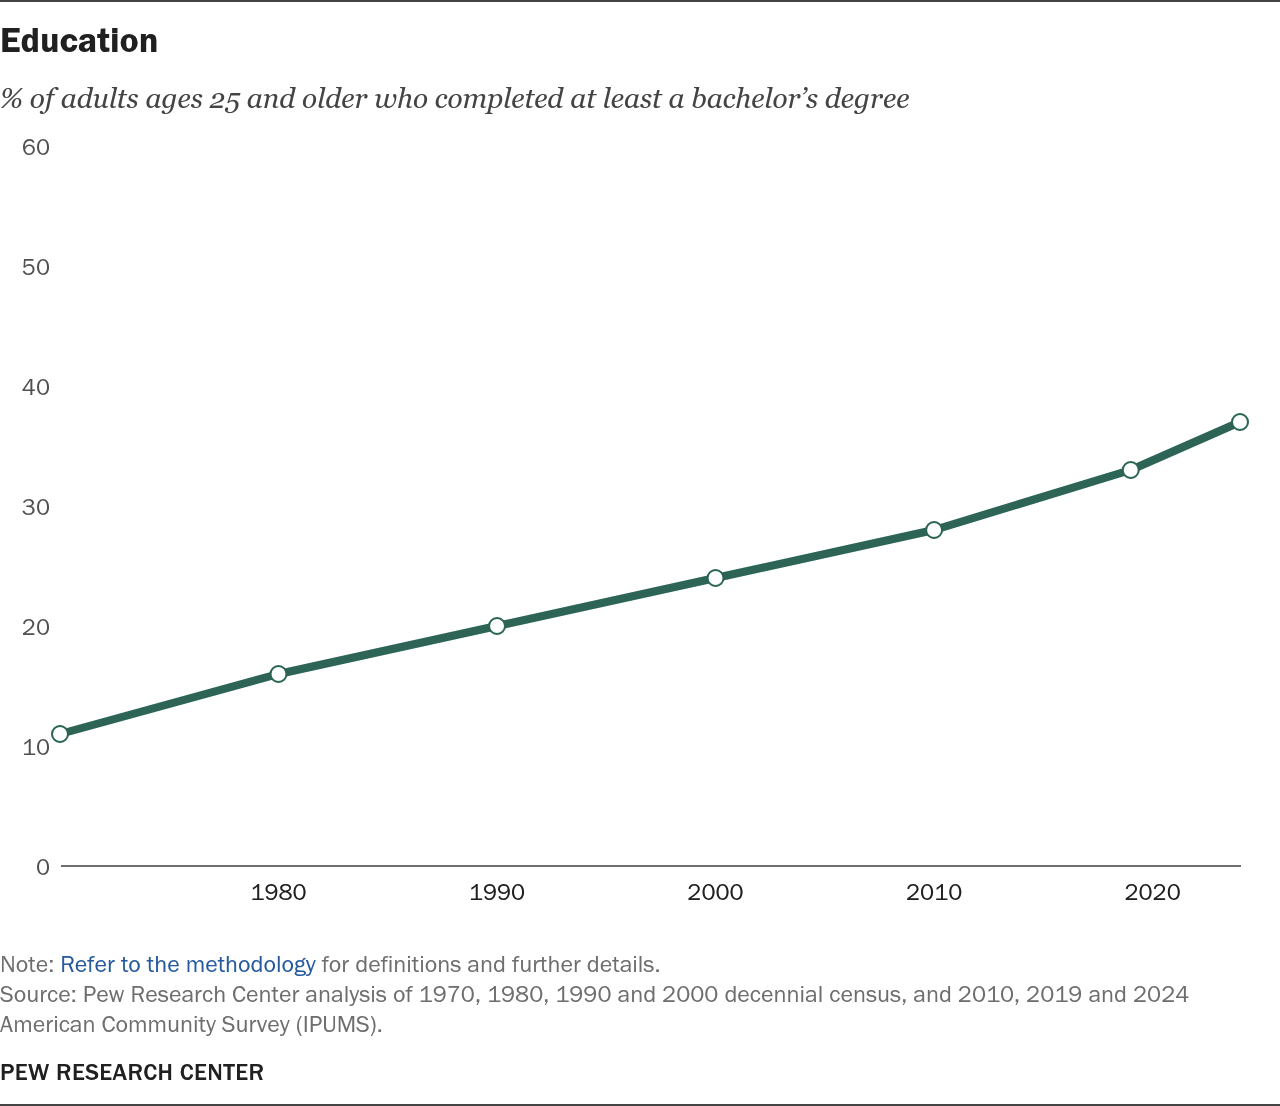
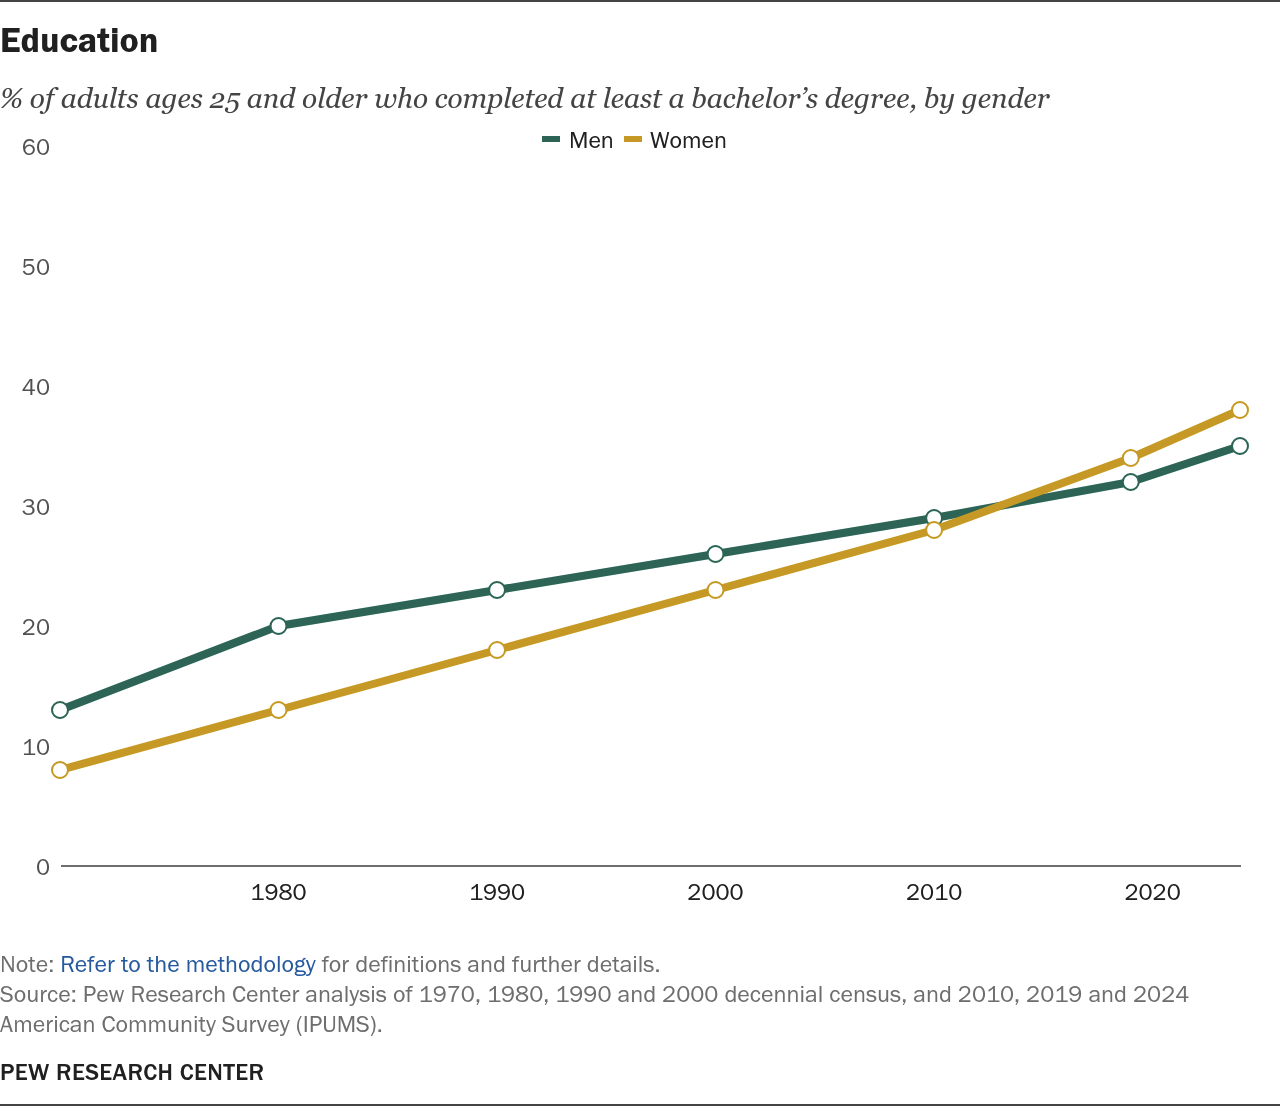
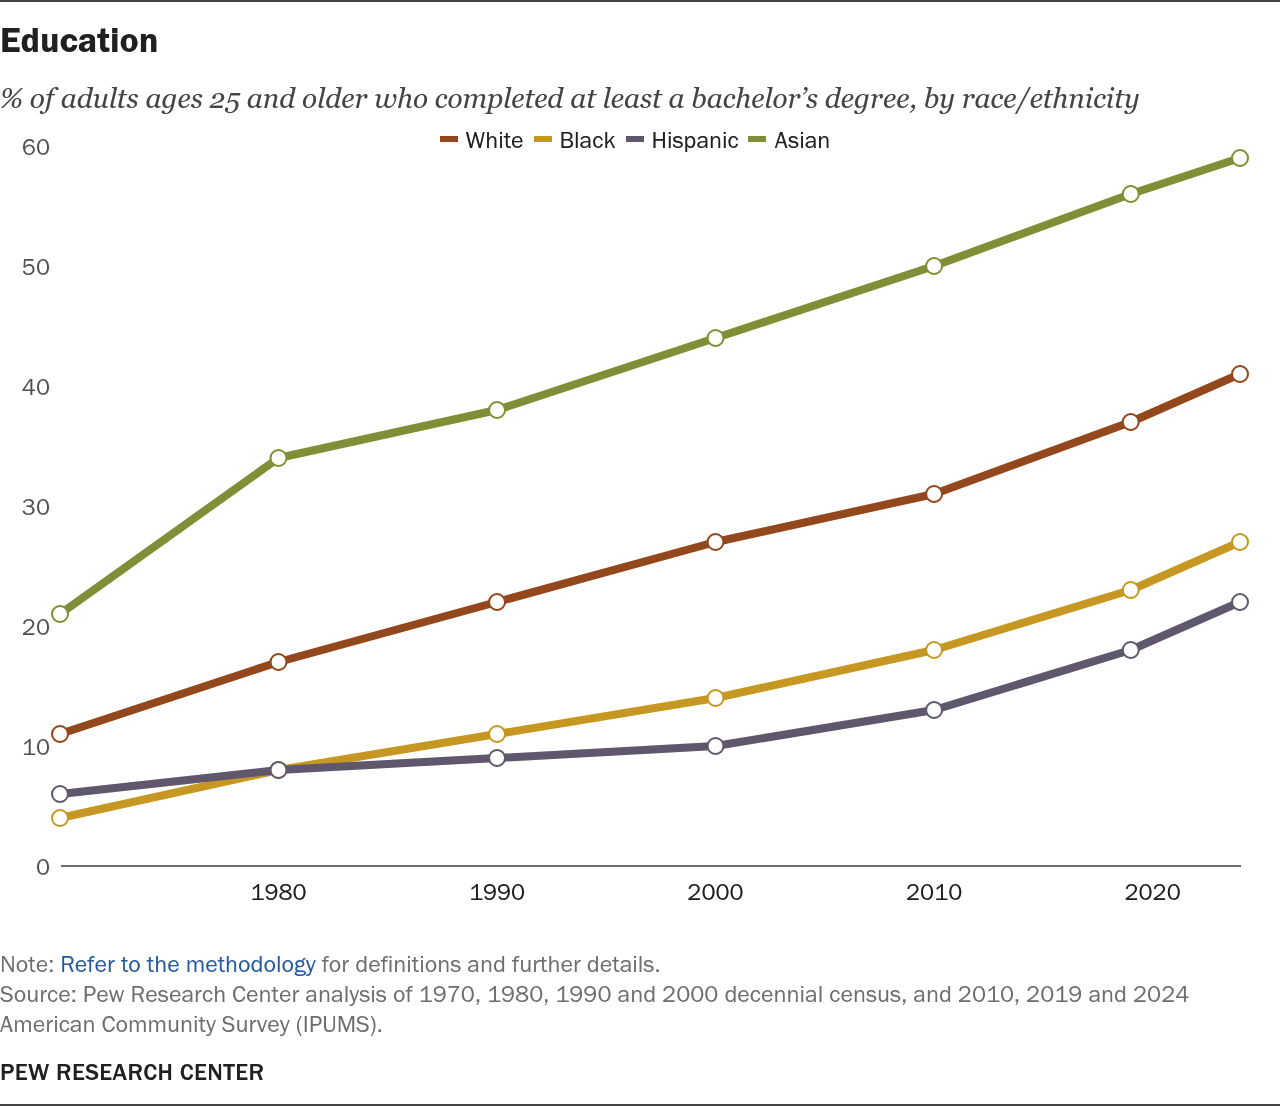
The share of adults who have completed at least a bachelor’s degree has more than tripled since 1970, from 11% to 37%. The increase has been greater for women than men.
Women remake the workforce
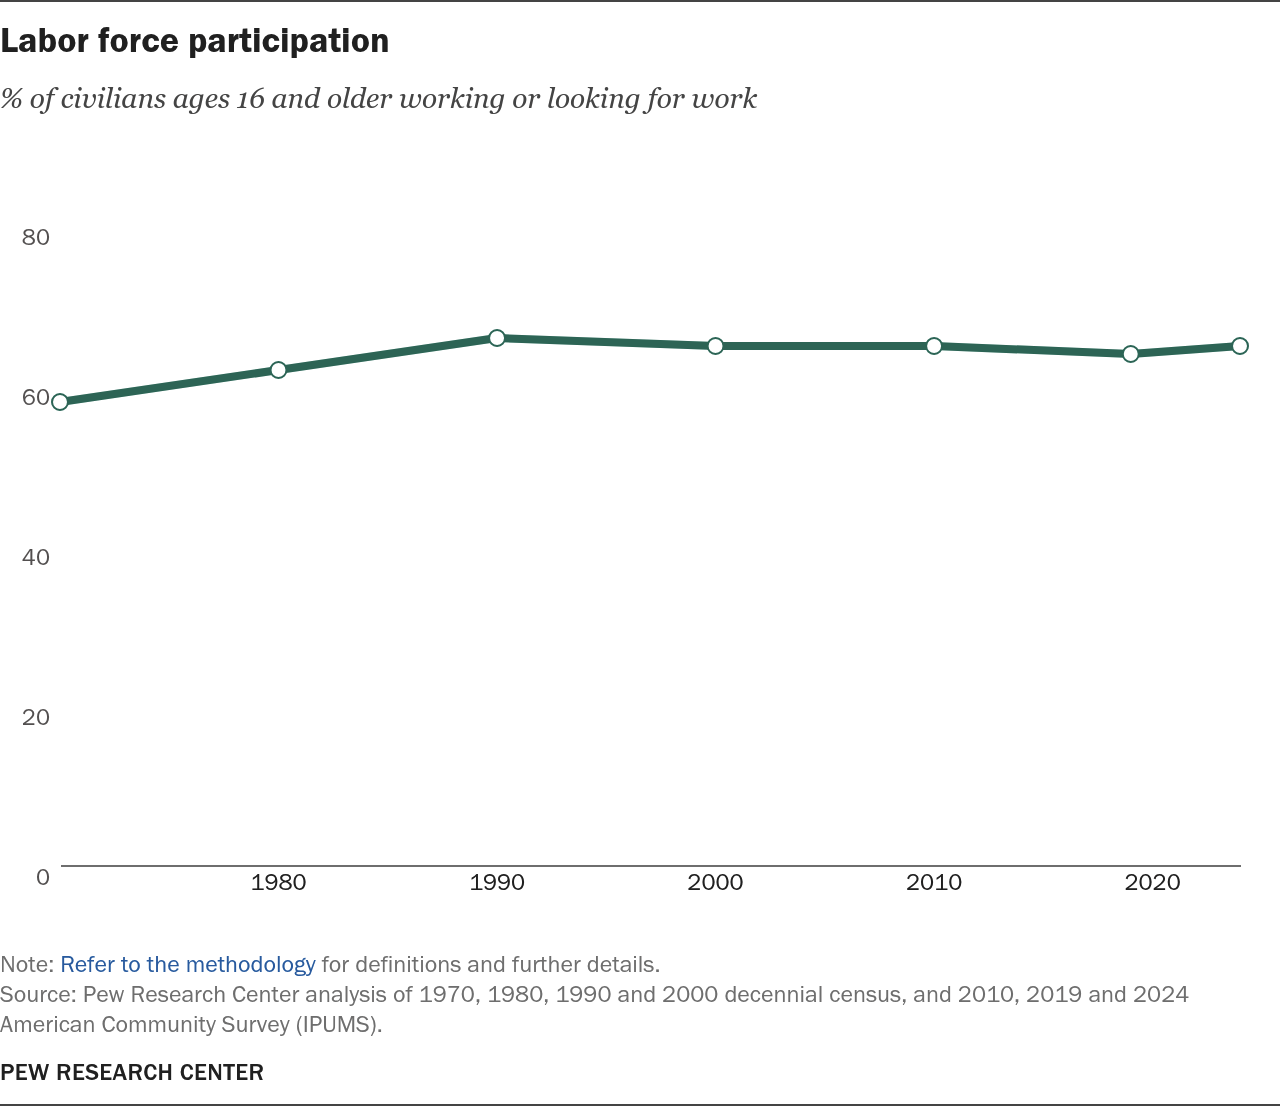
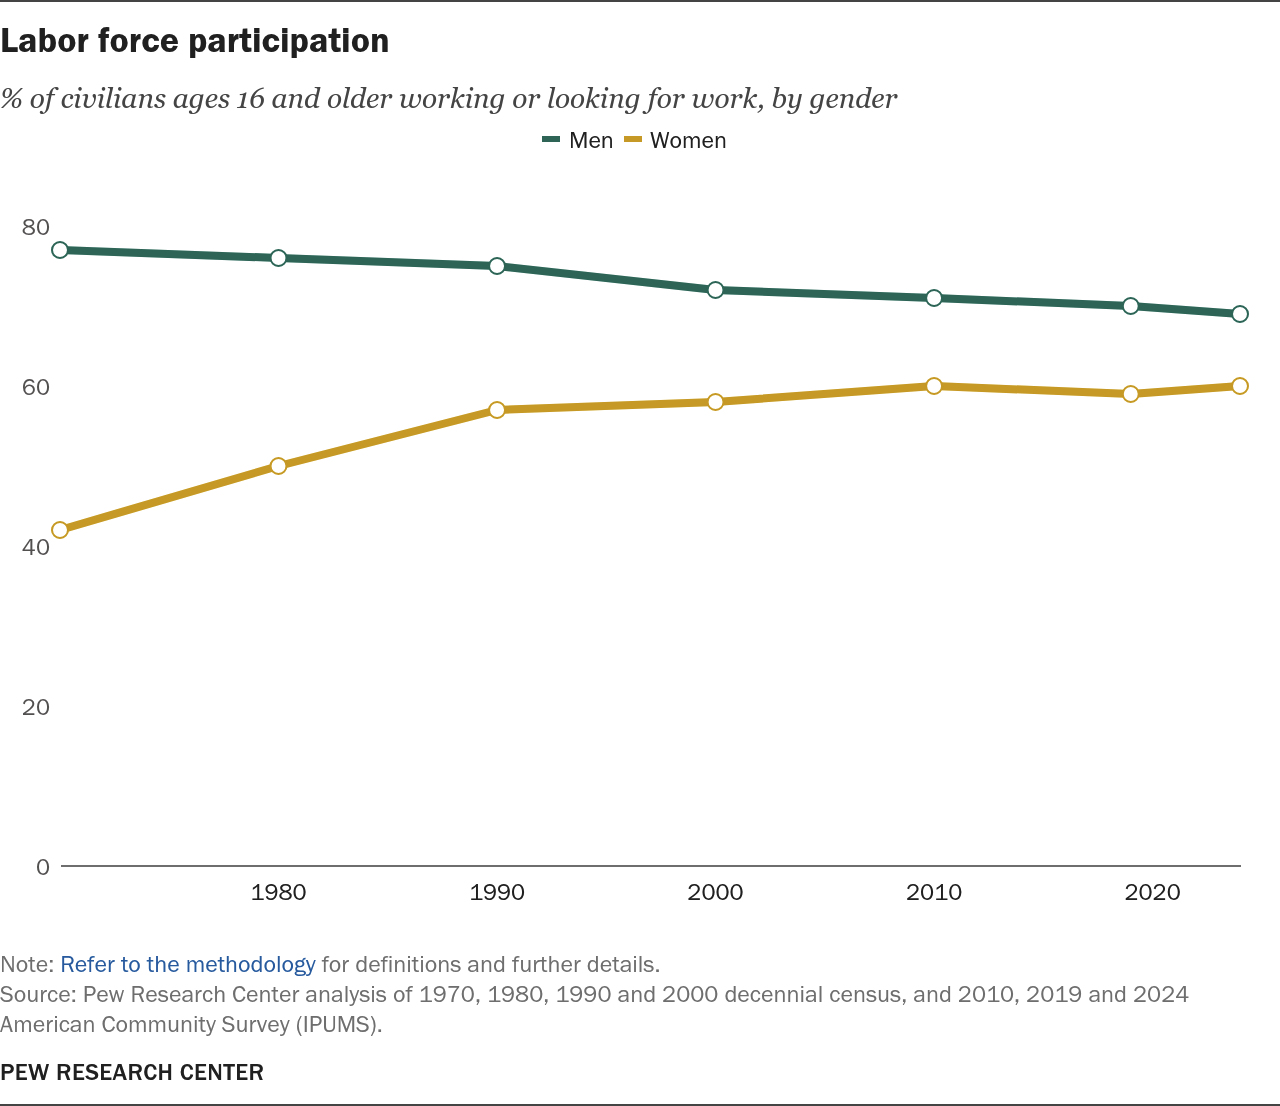
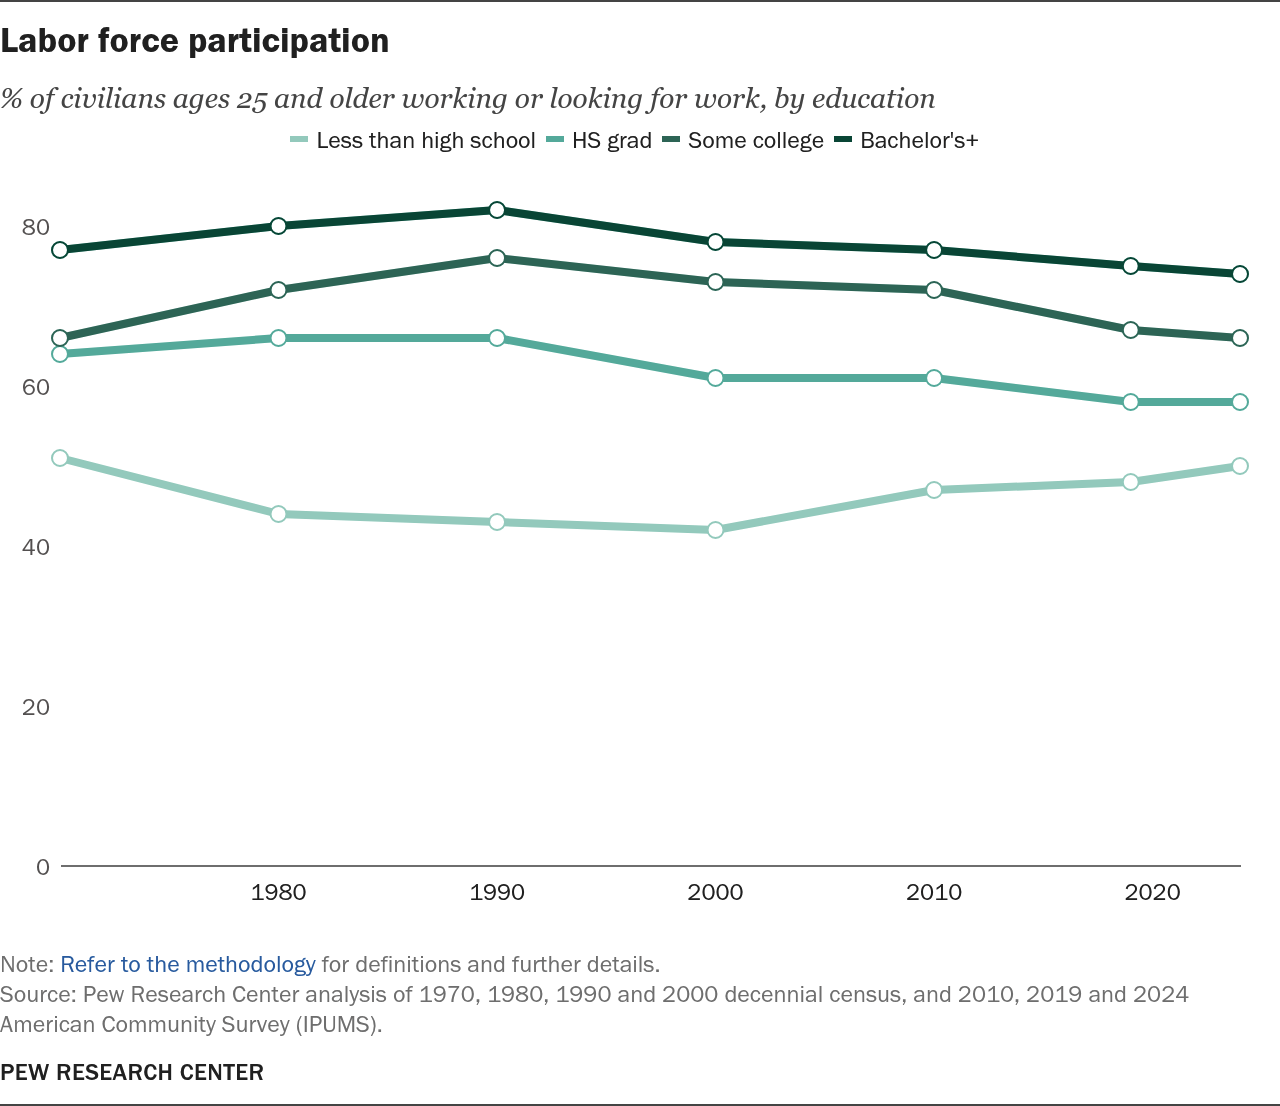
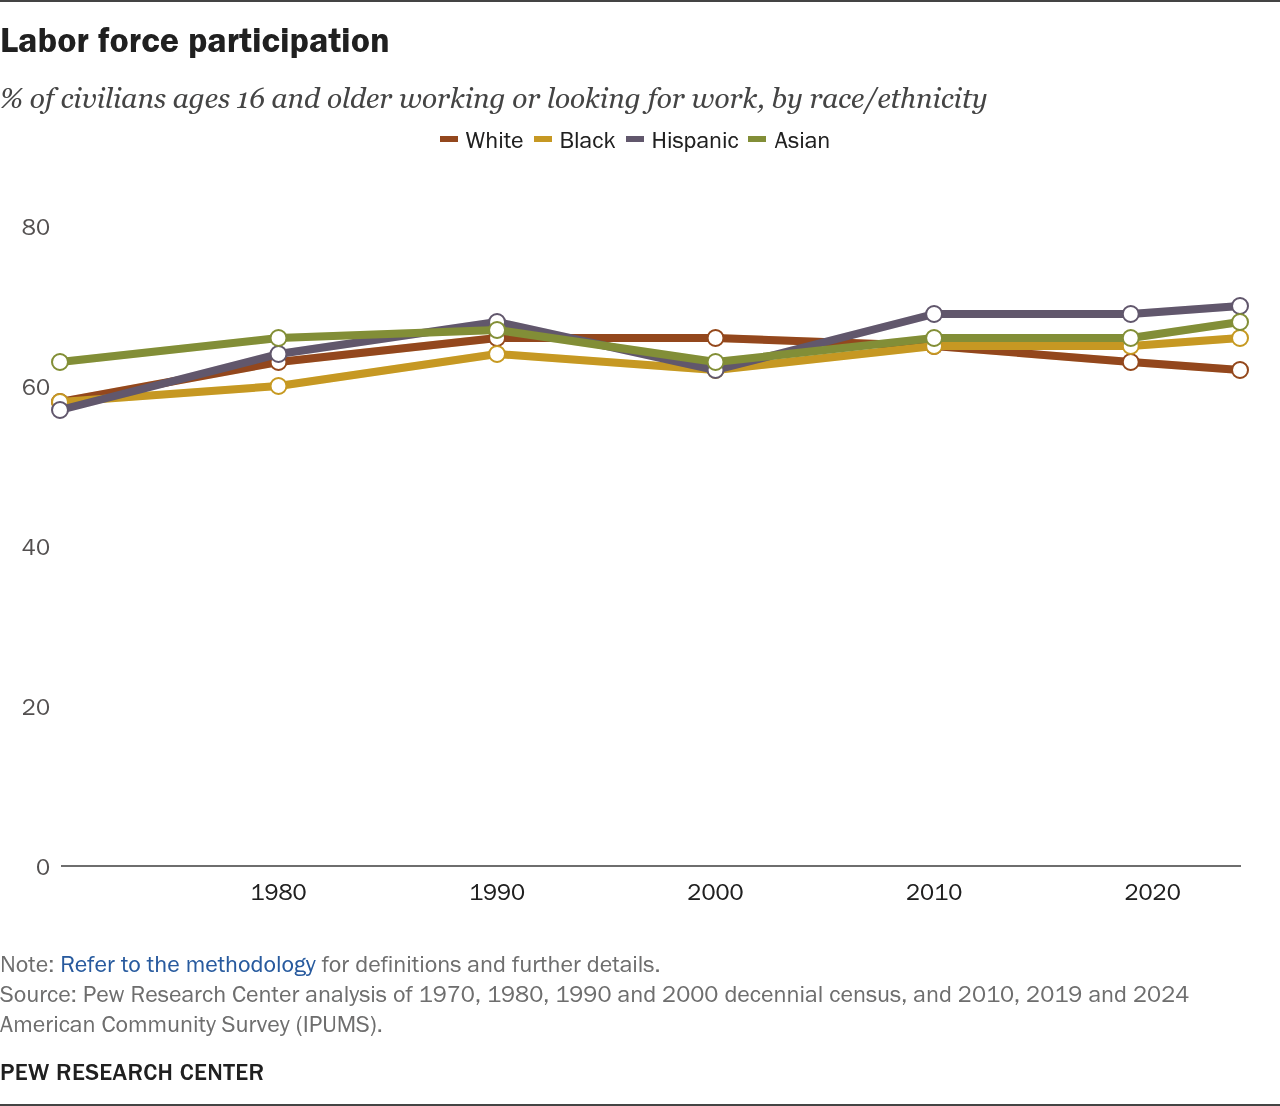
The share of the population working or looking for work has modestly increased since 1970. Labor force participation has increased among women but declined among men.
Earnings gaps widen
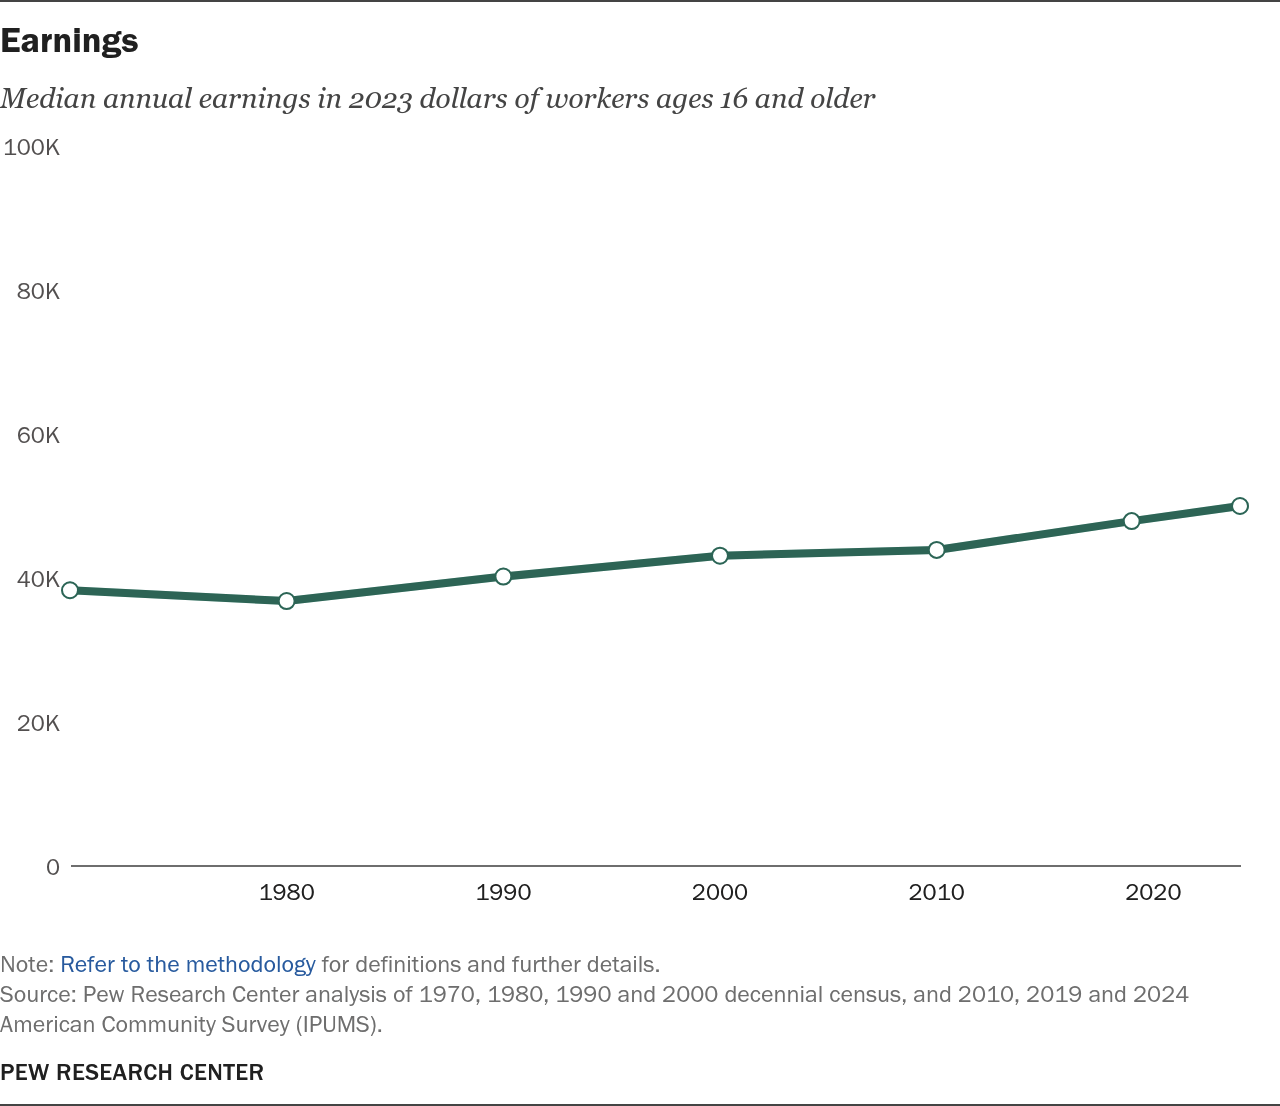
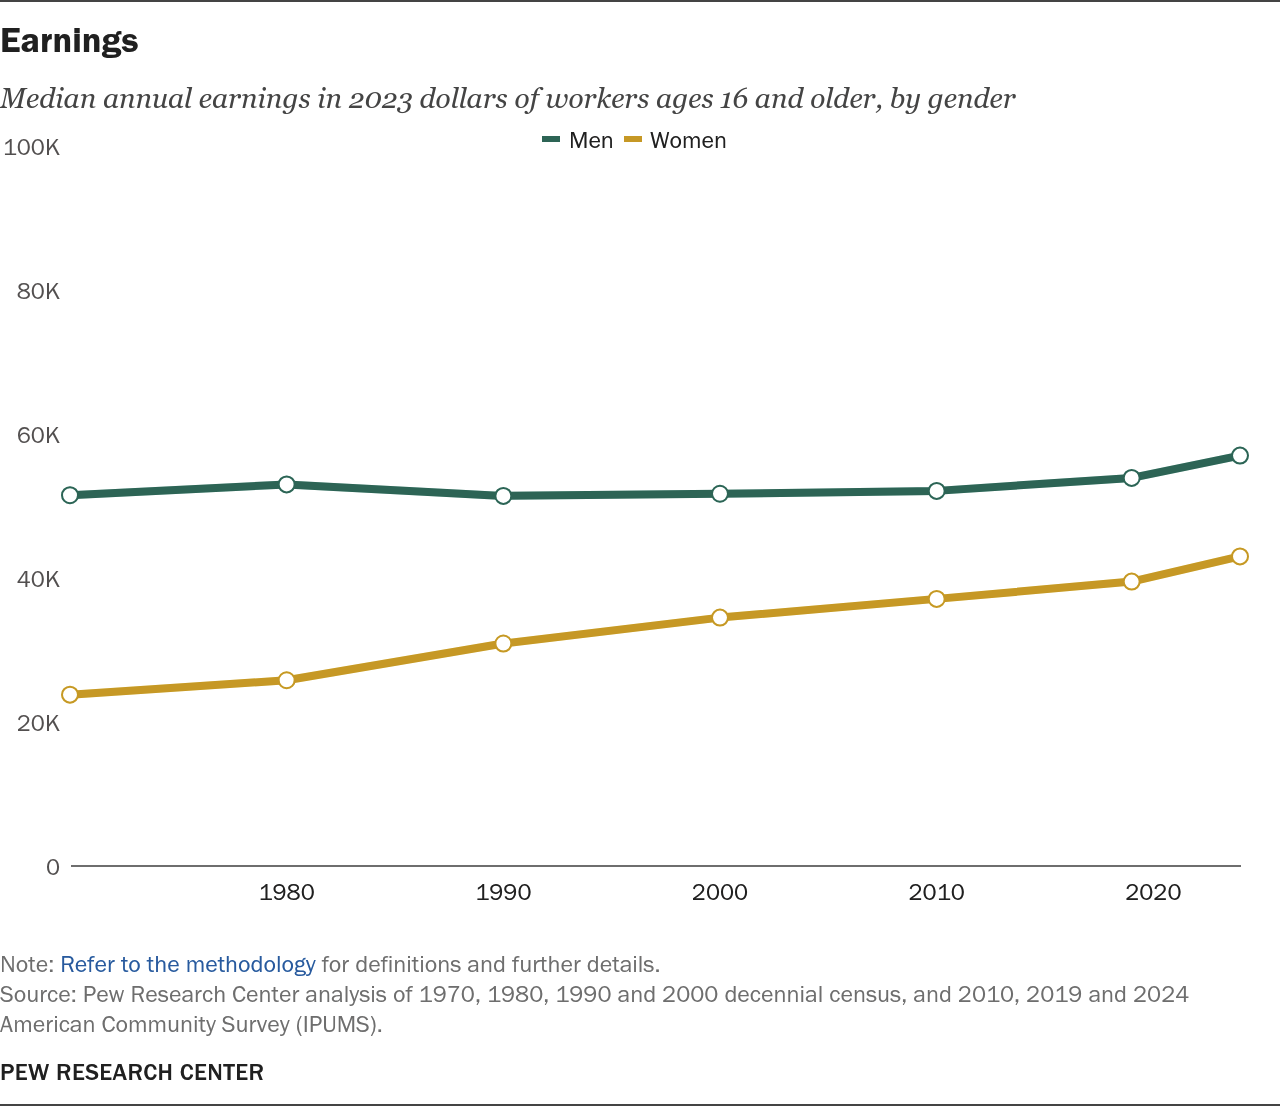
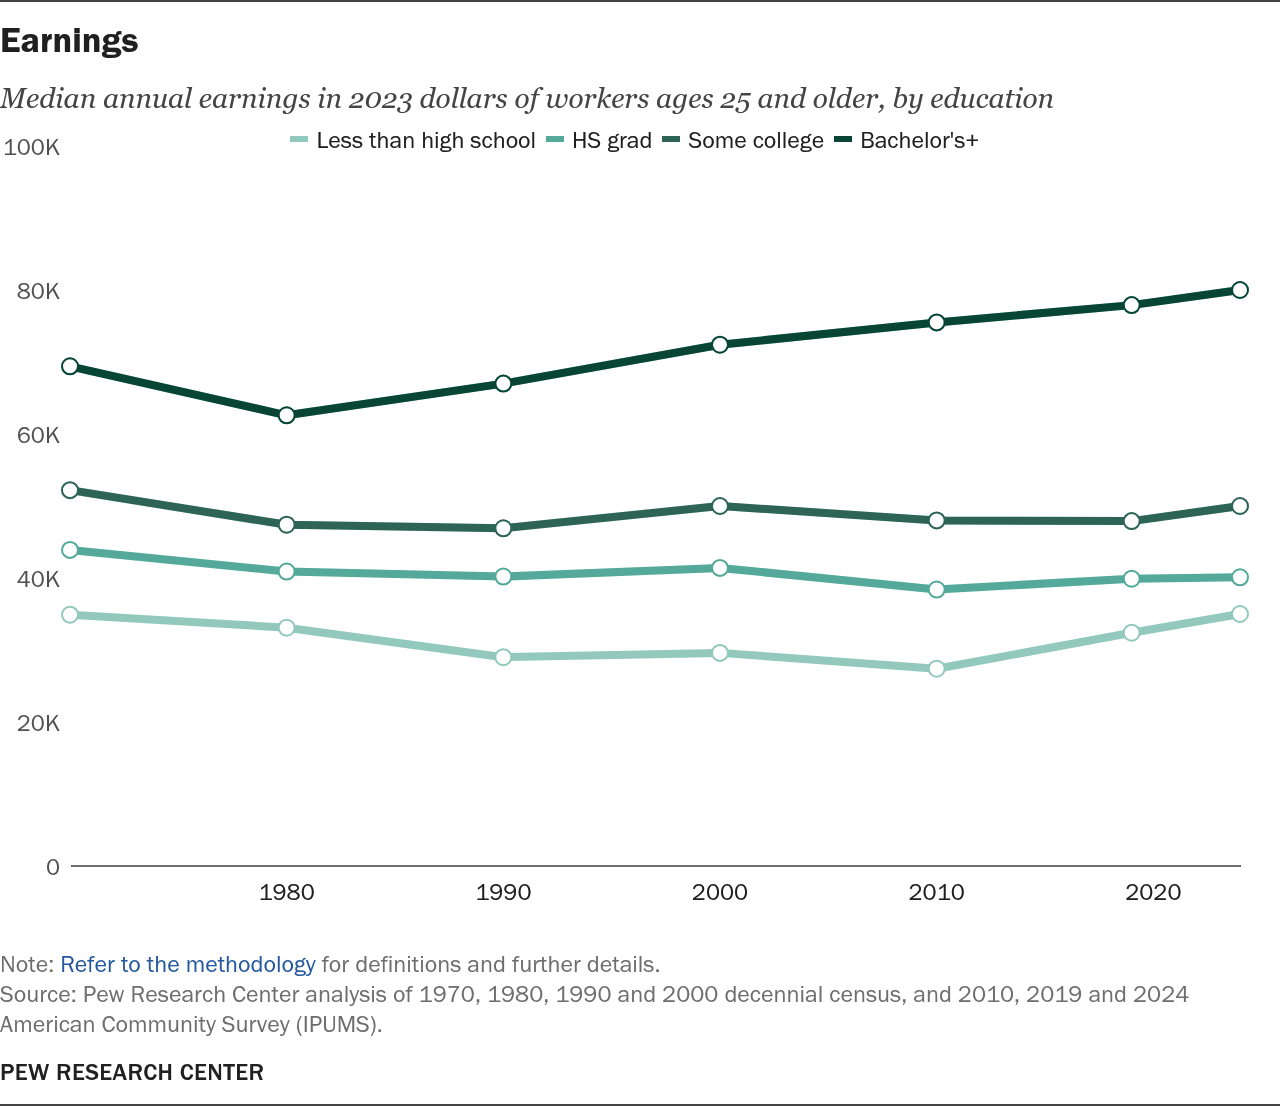
The median inflation-adjusted annual earnings of workers have increased since 1970. But the gains are uneven, going mainly to workers with at least a bachelor’s degree rather than those with less education.

Family
Families celebrate the U.S. bicentennial in Beulah, Colorado. A family shares a meal inside their multigenerational home in Fairfax, Virginia, in 2022. (Tony Korody/Sygma, Astrid Riecken/The Washington Post via Getty Images)
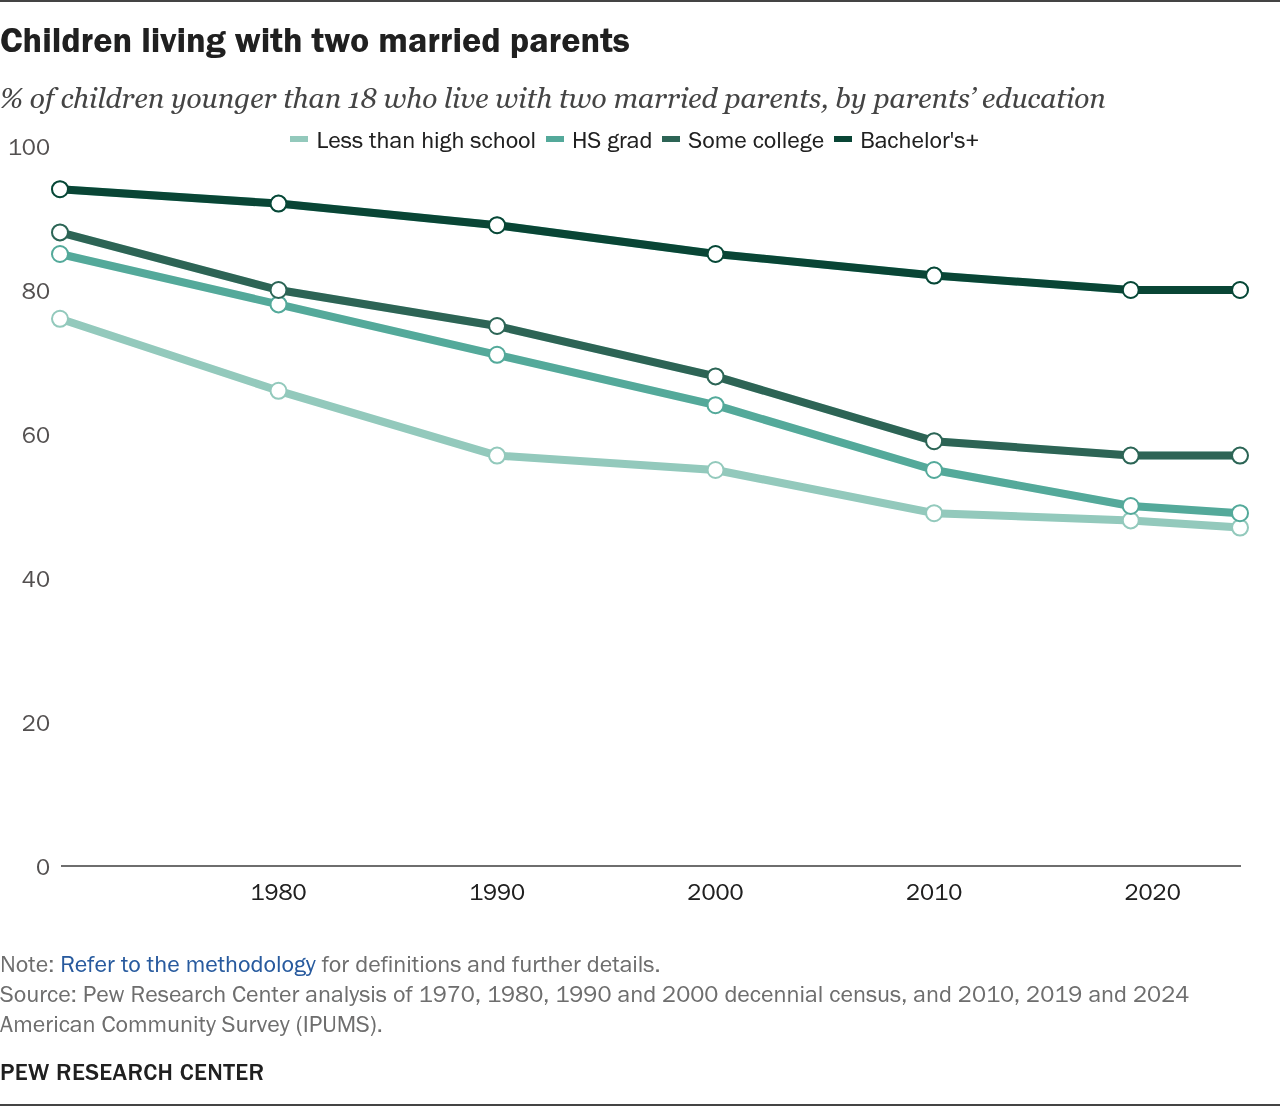
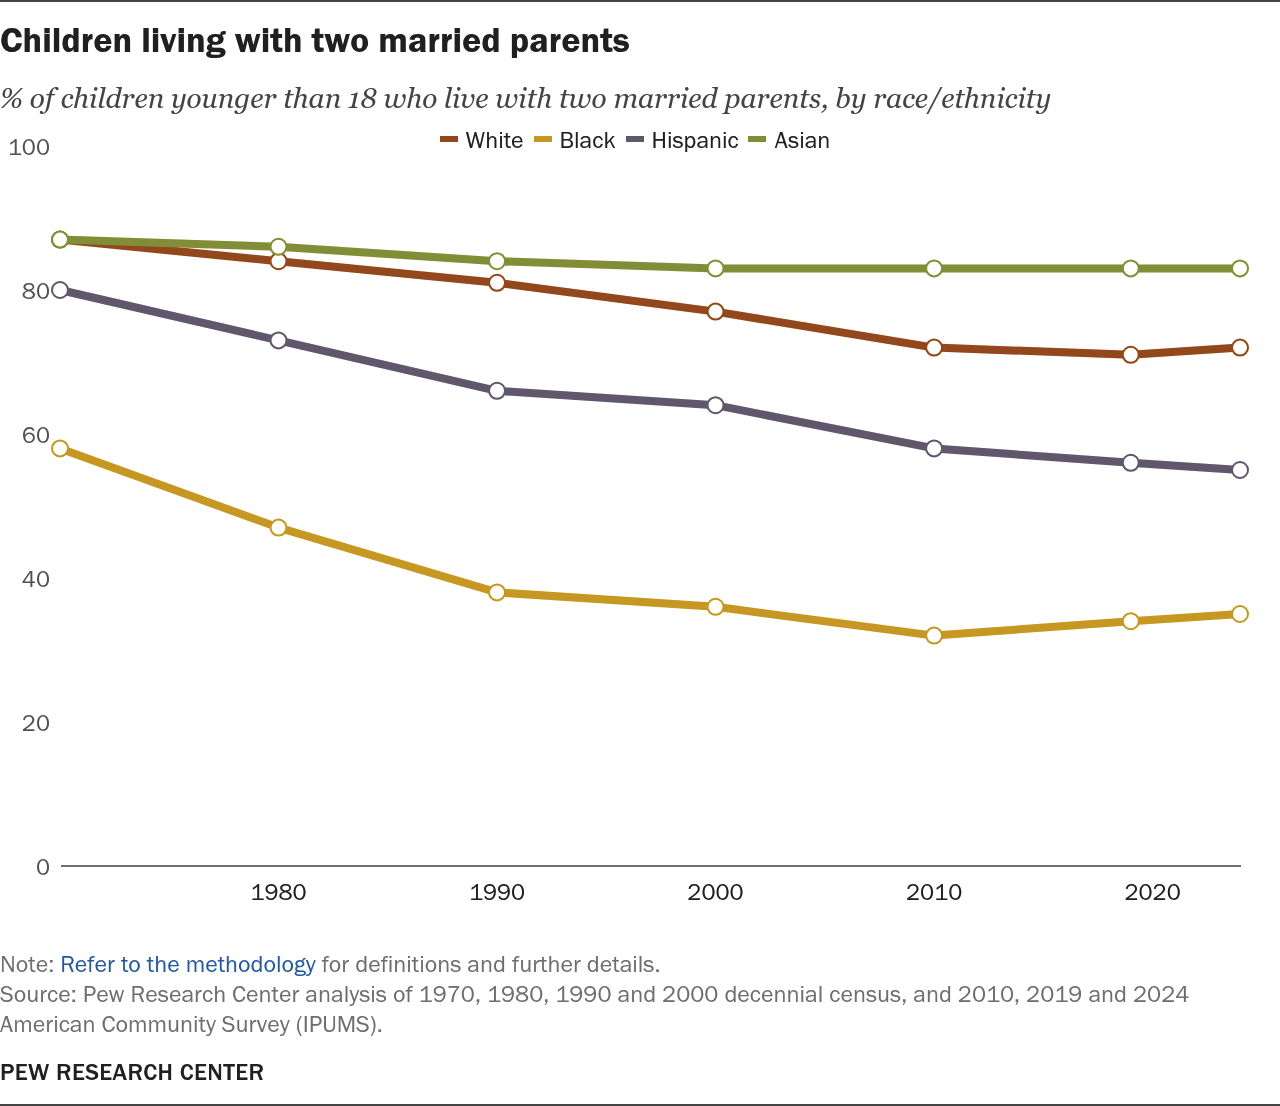
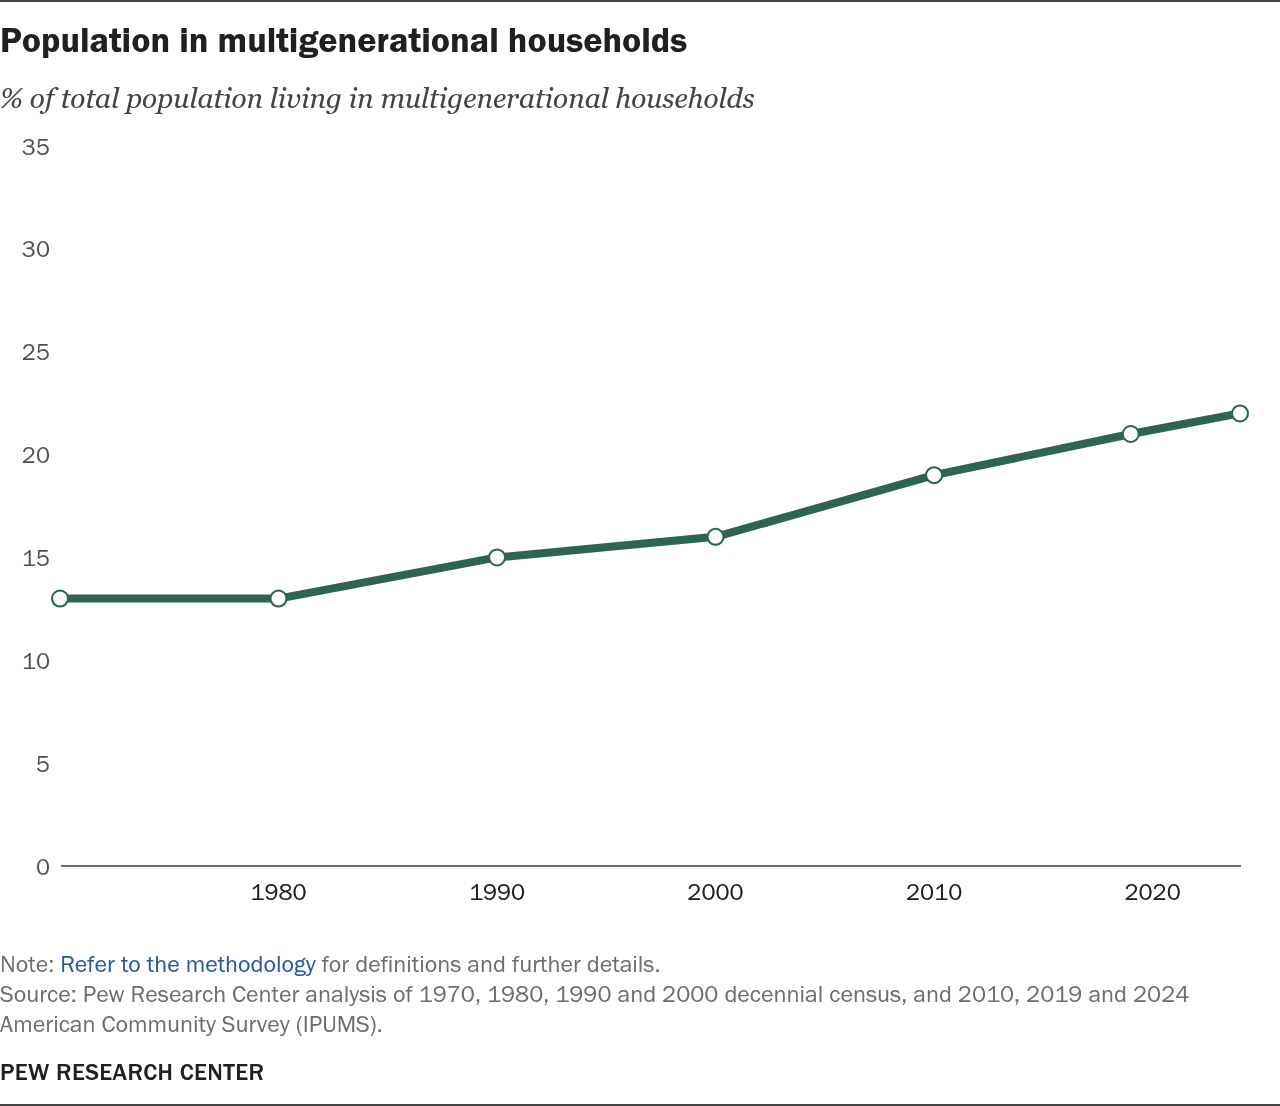
The American family has witnessed substantial changes since the 1970s. Americans marry and have children at later ages than they once did, and fewer Americans are doing these things at all. Living arrangements have also shifted over this period: A smaller share of children live with two married parents, and a greater share of the population lives in multigenerational households.
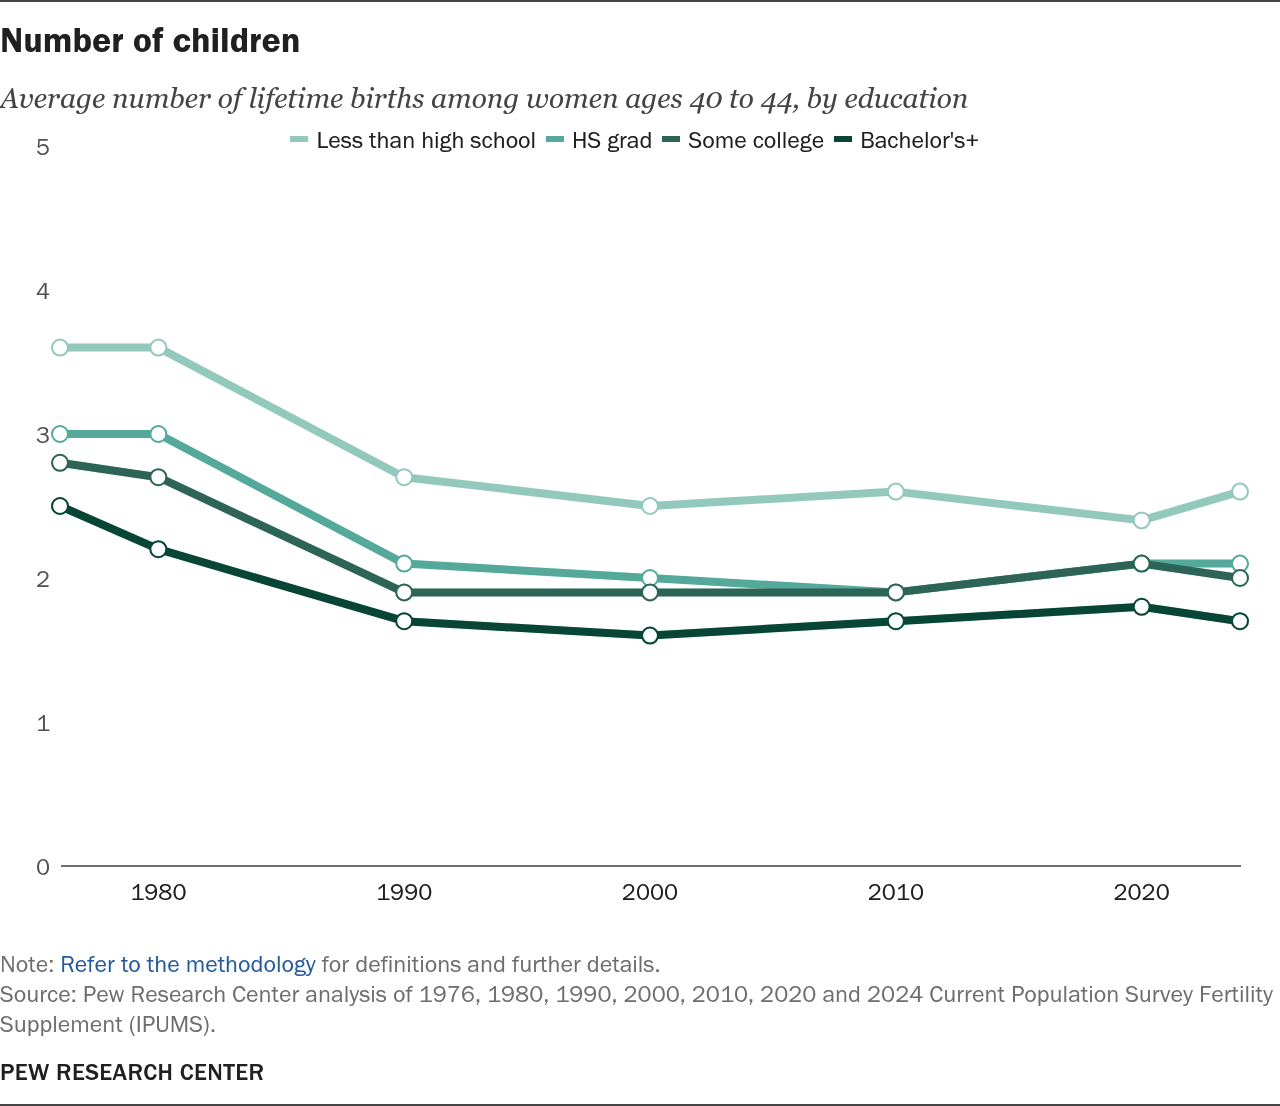
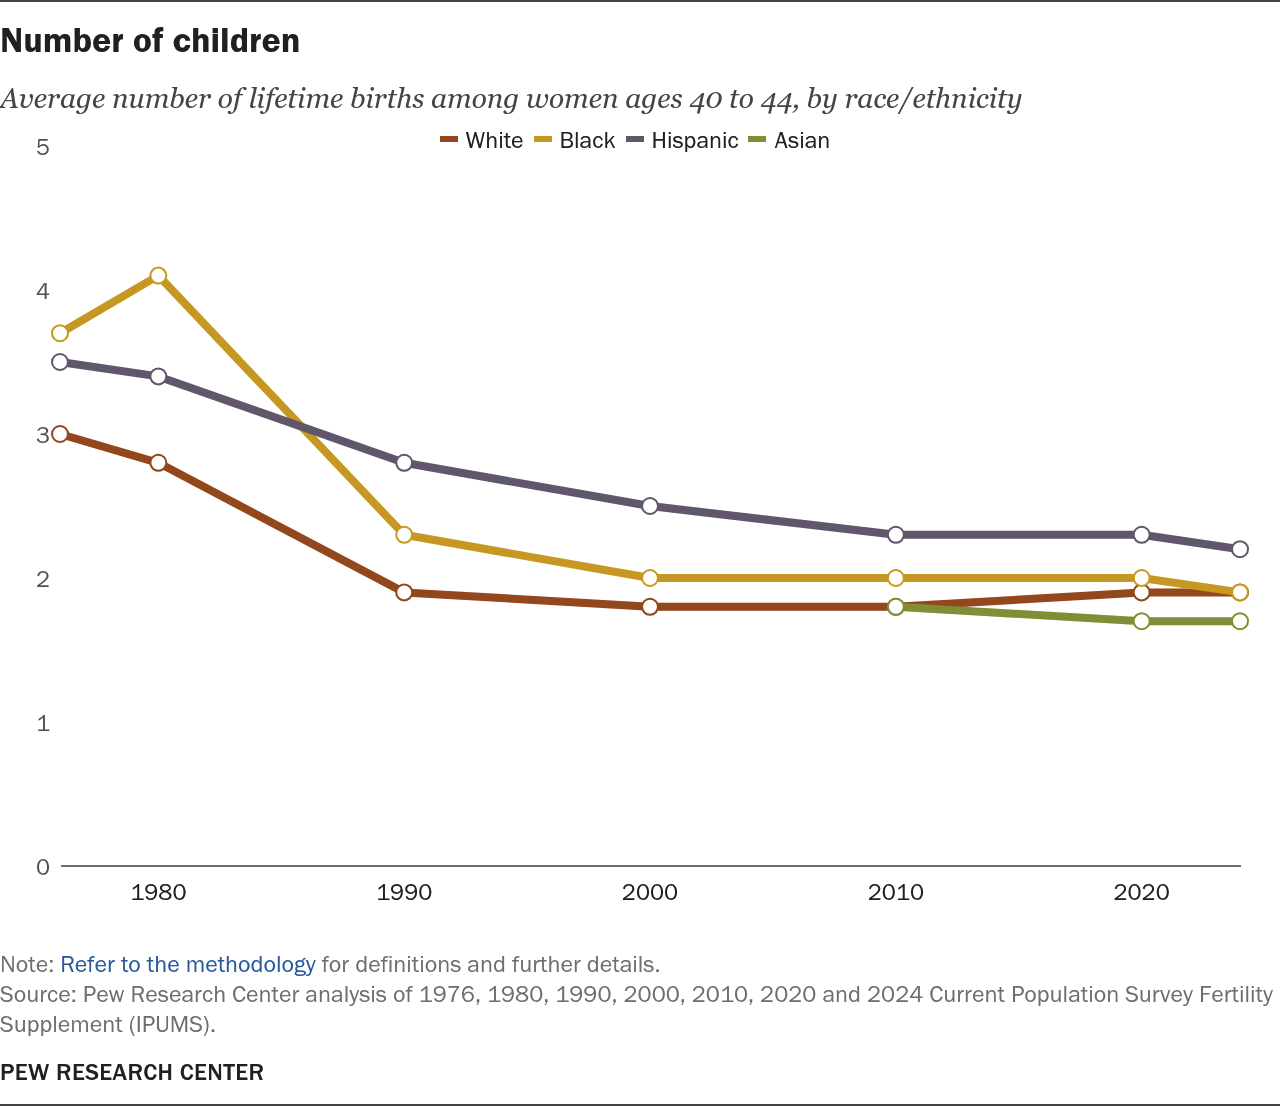
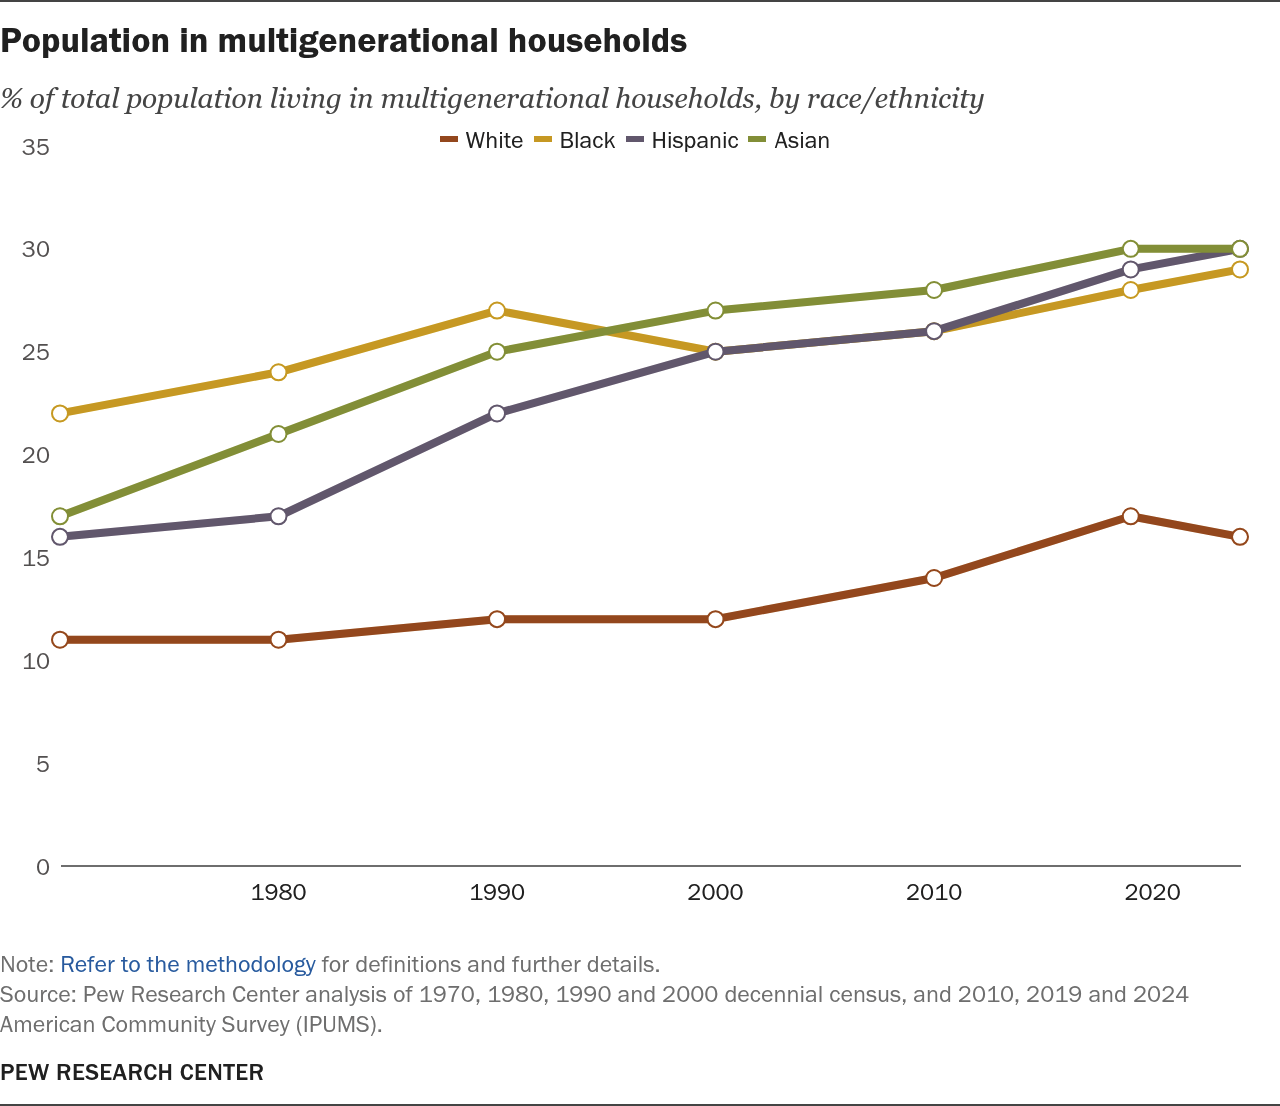
These changes have occurred unevenly across demographic groups, and as a result, gaps by education and race and ethnicity have gotten wider.
The decline of marriage
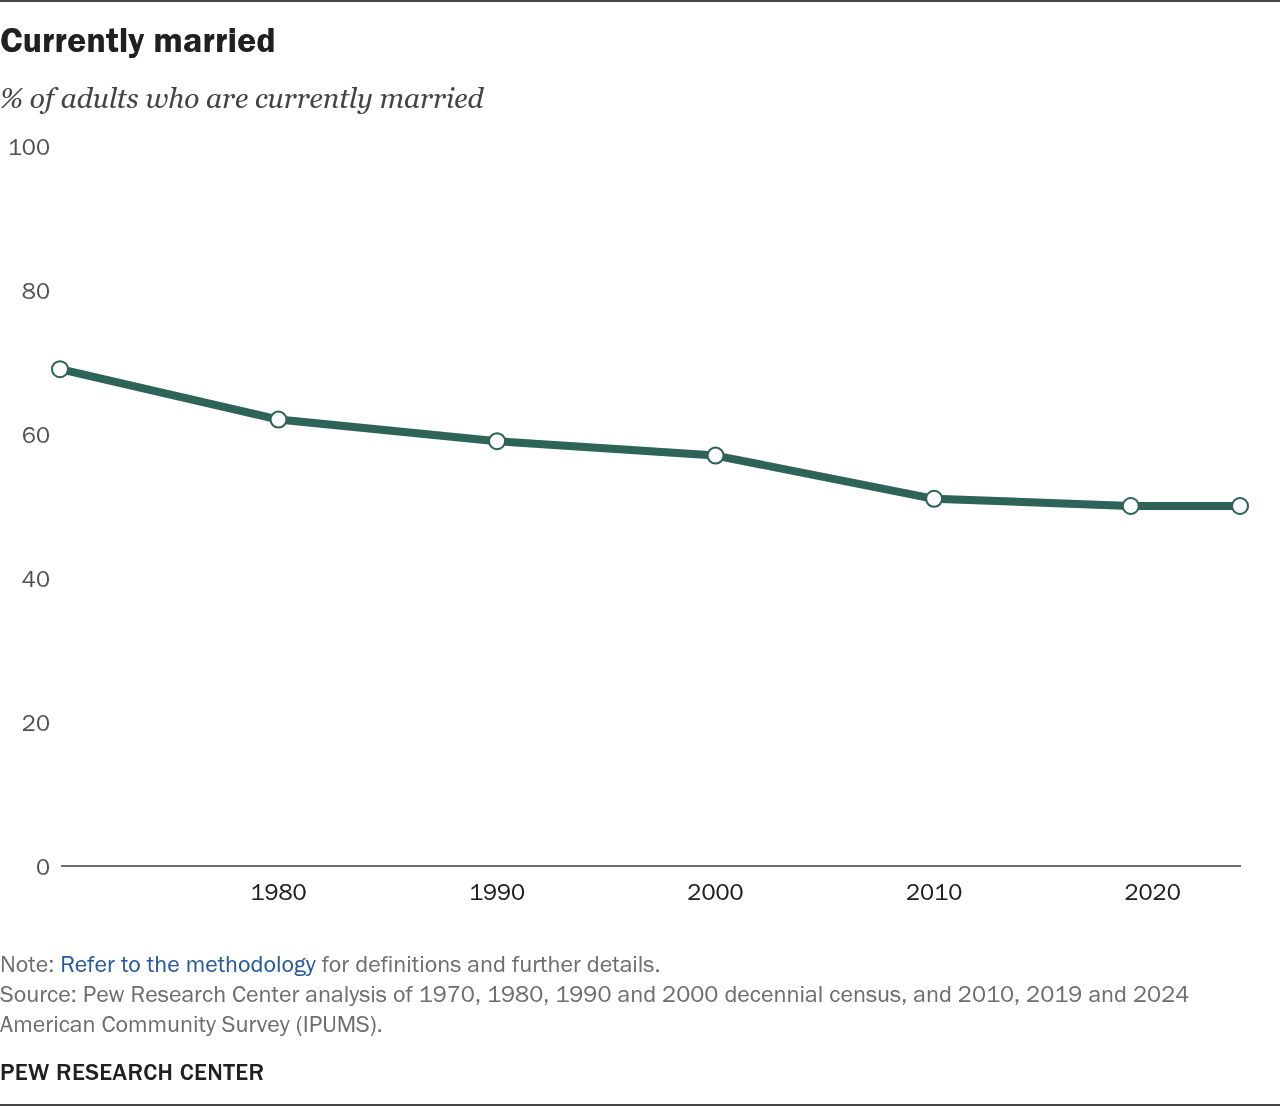
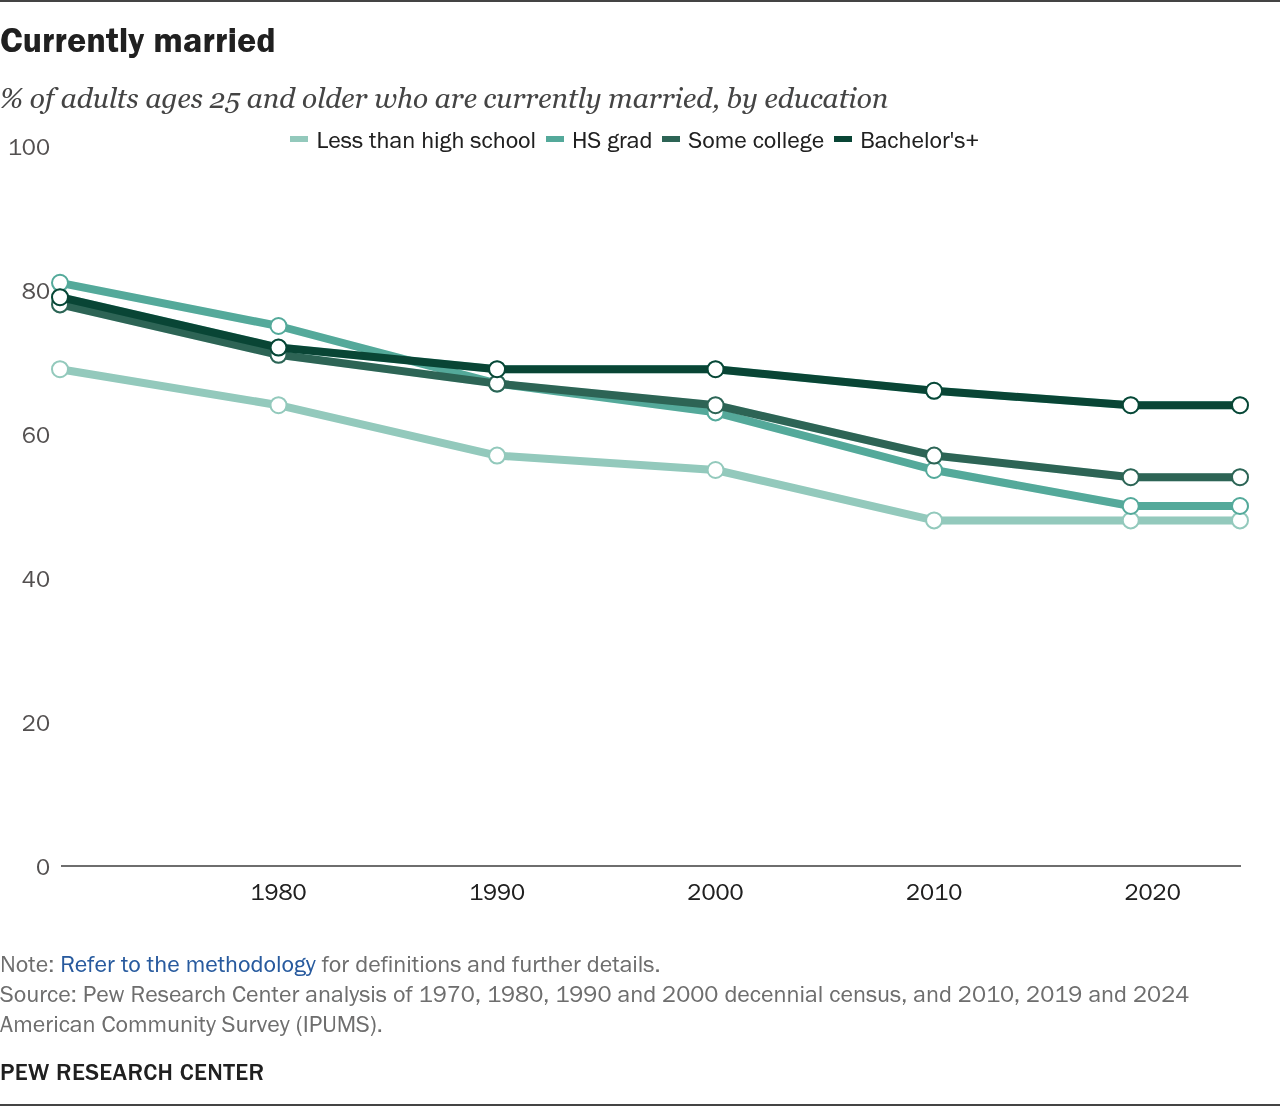
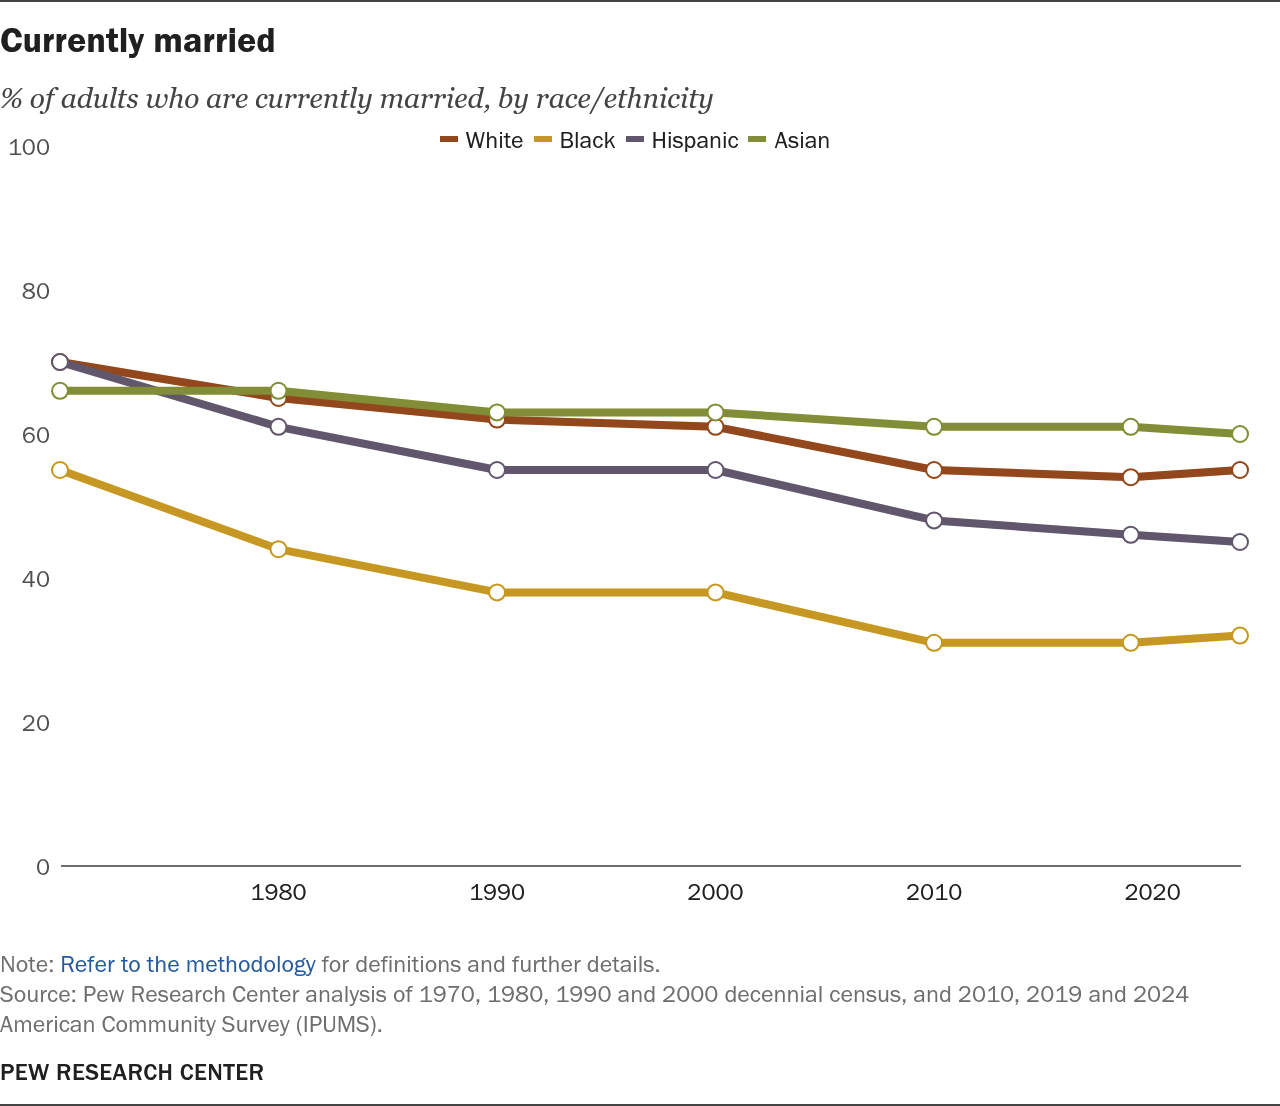
The share of adults who are currently married is now 50%, down from 69% in 1970. The drop has been steeper for adults without a four-year college degree.
Read about historic trends in divorce, cohabitation and same-sex marriage on our website.
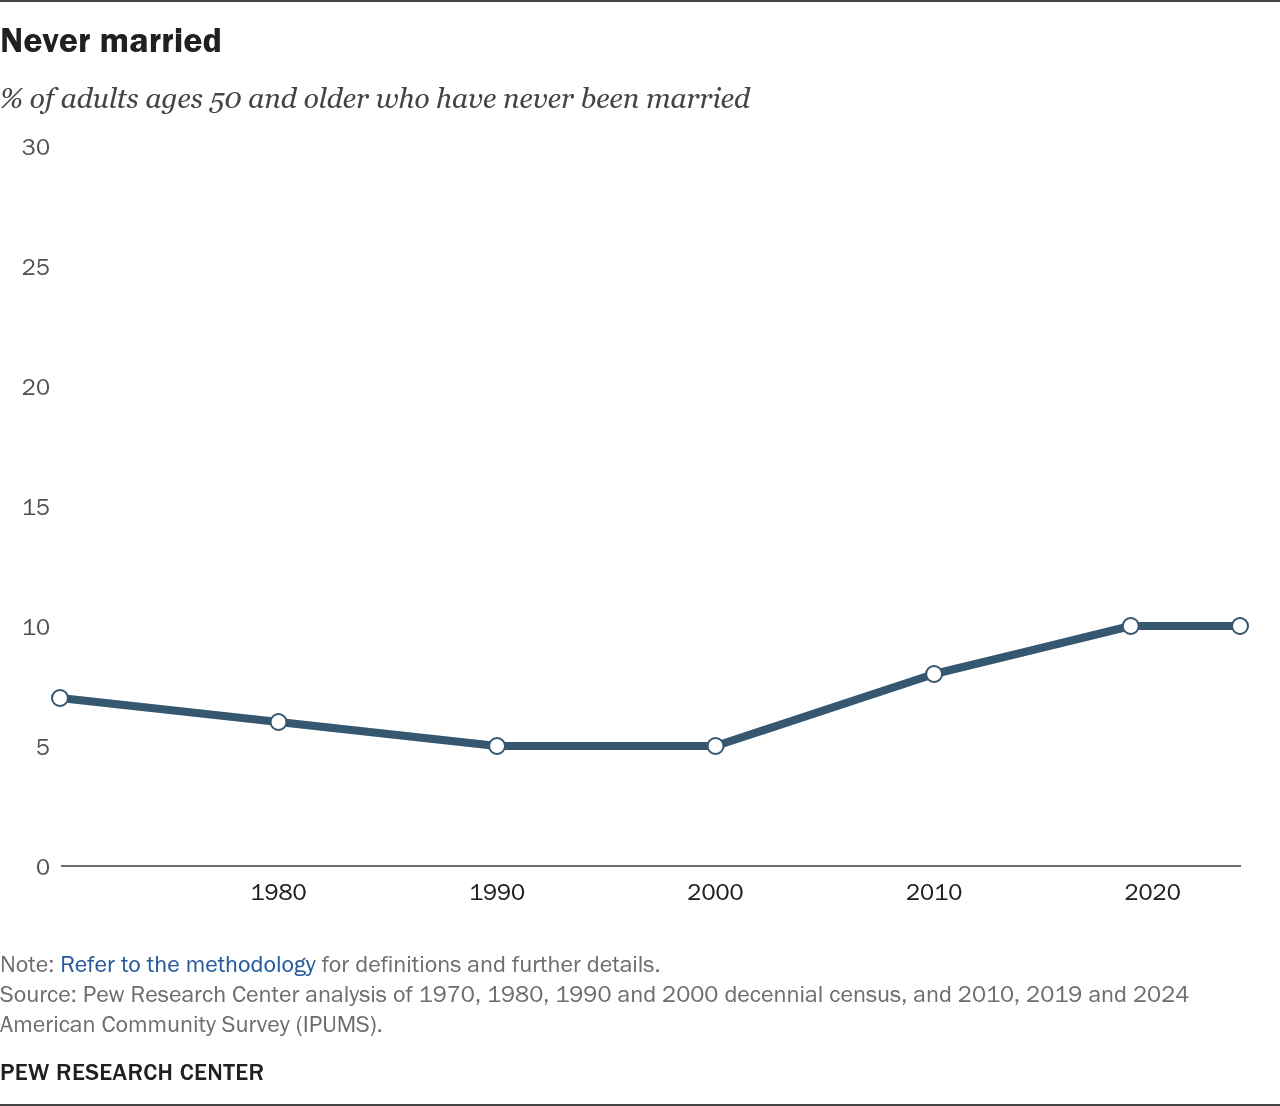
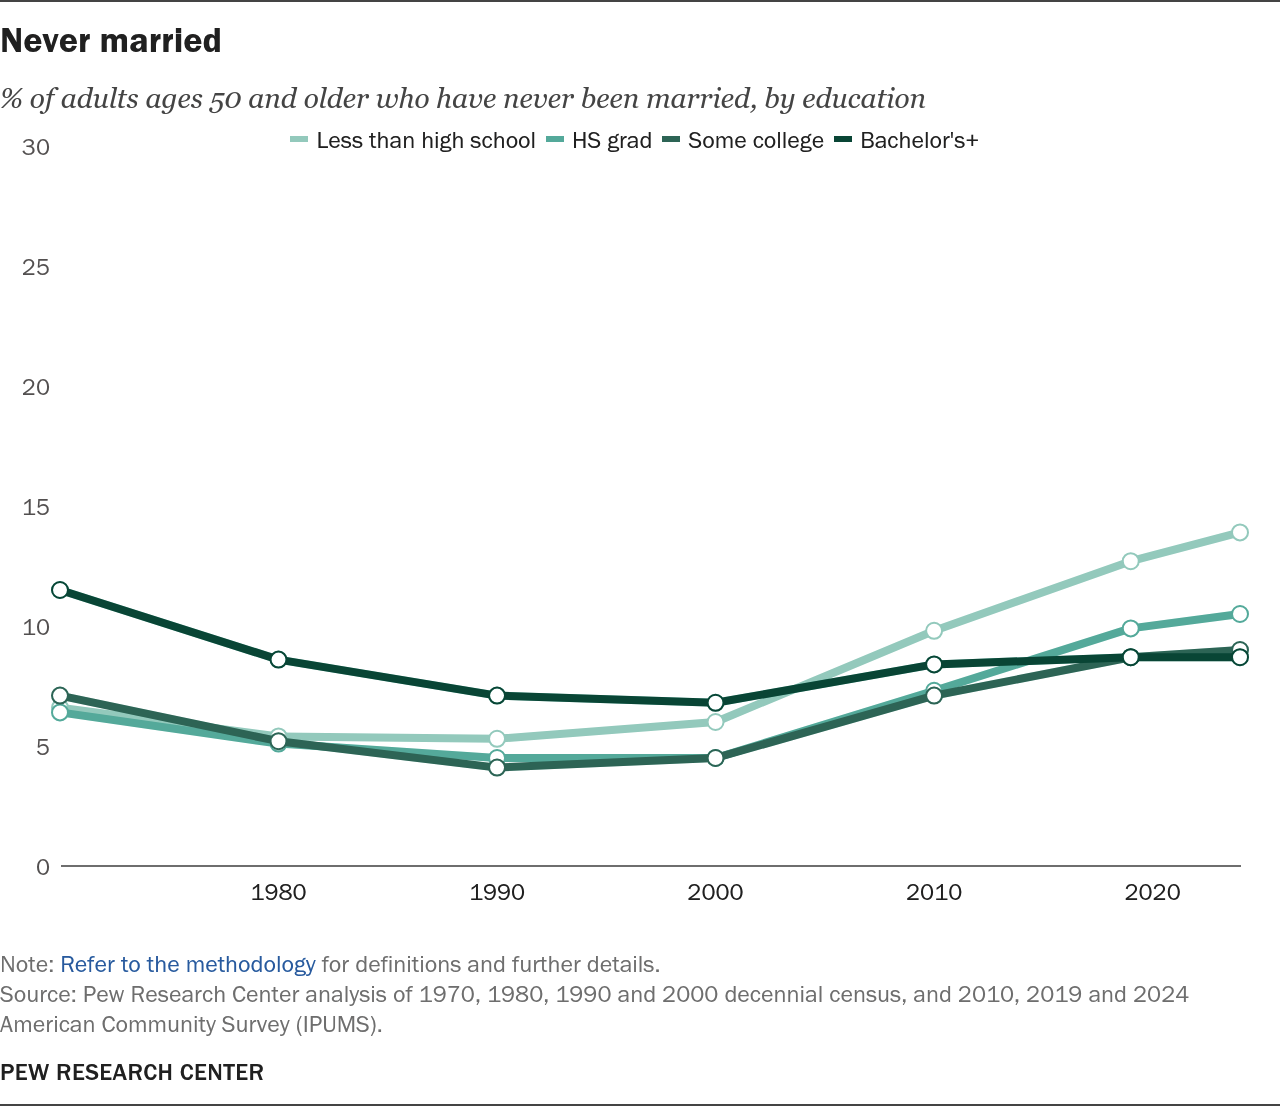
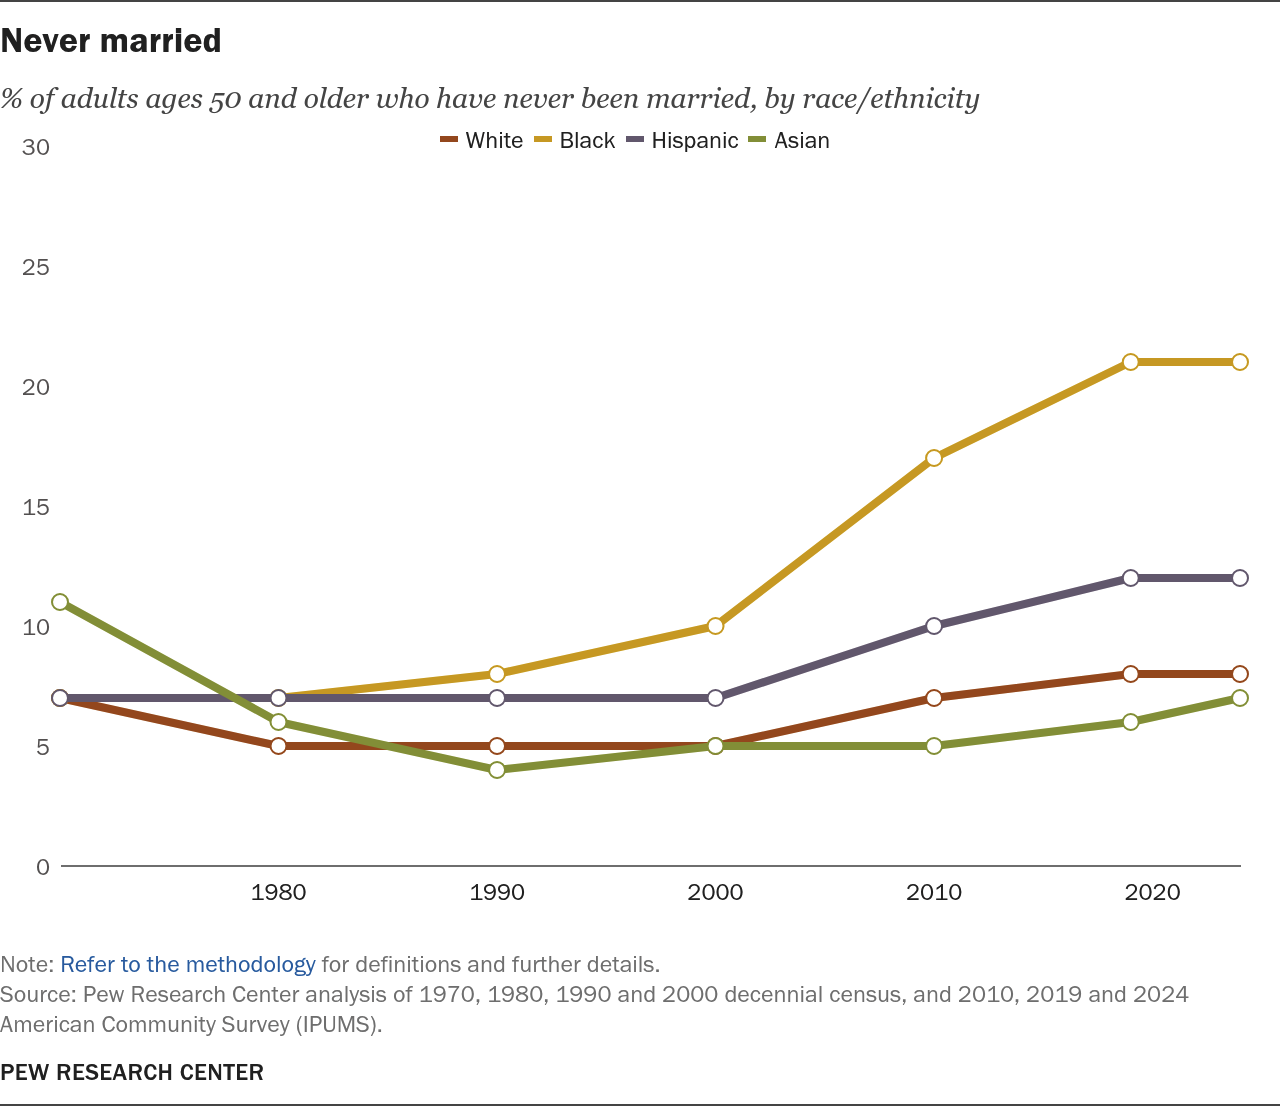
The share of adults ages 50 and older who have never been married has risen modestly since 1970. The largest increase has been for Black adults, where the never-married share tripled over this period.
Falling fertility
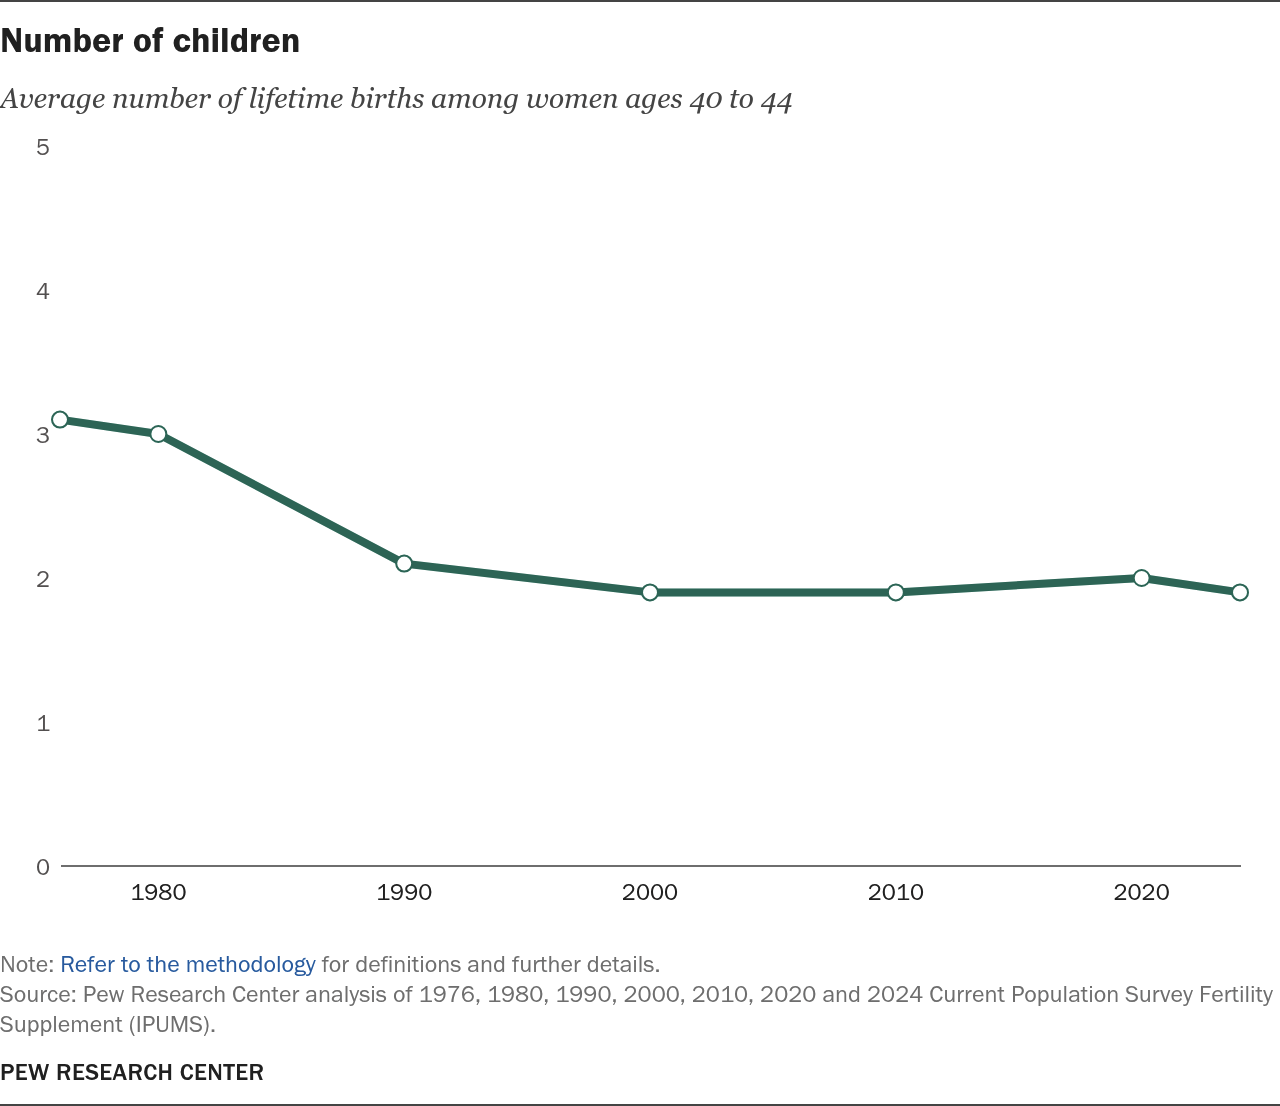
Fertility, measured here as the average number of children ever born to women ages 40 to 44, has fallen, in part due to the introduction of the birth control pill, delays in marriage and increases in women’s employment. Fifty years ago, U.S. women had an average of about three children, and since 1990, that number has hovered at about two children.
The changing American family
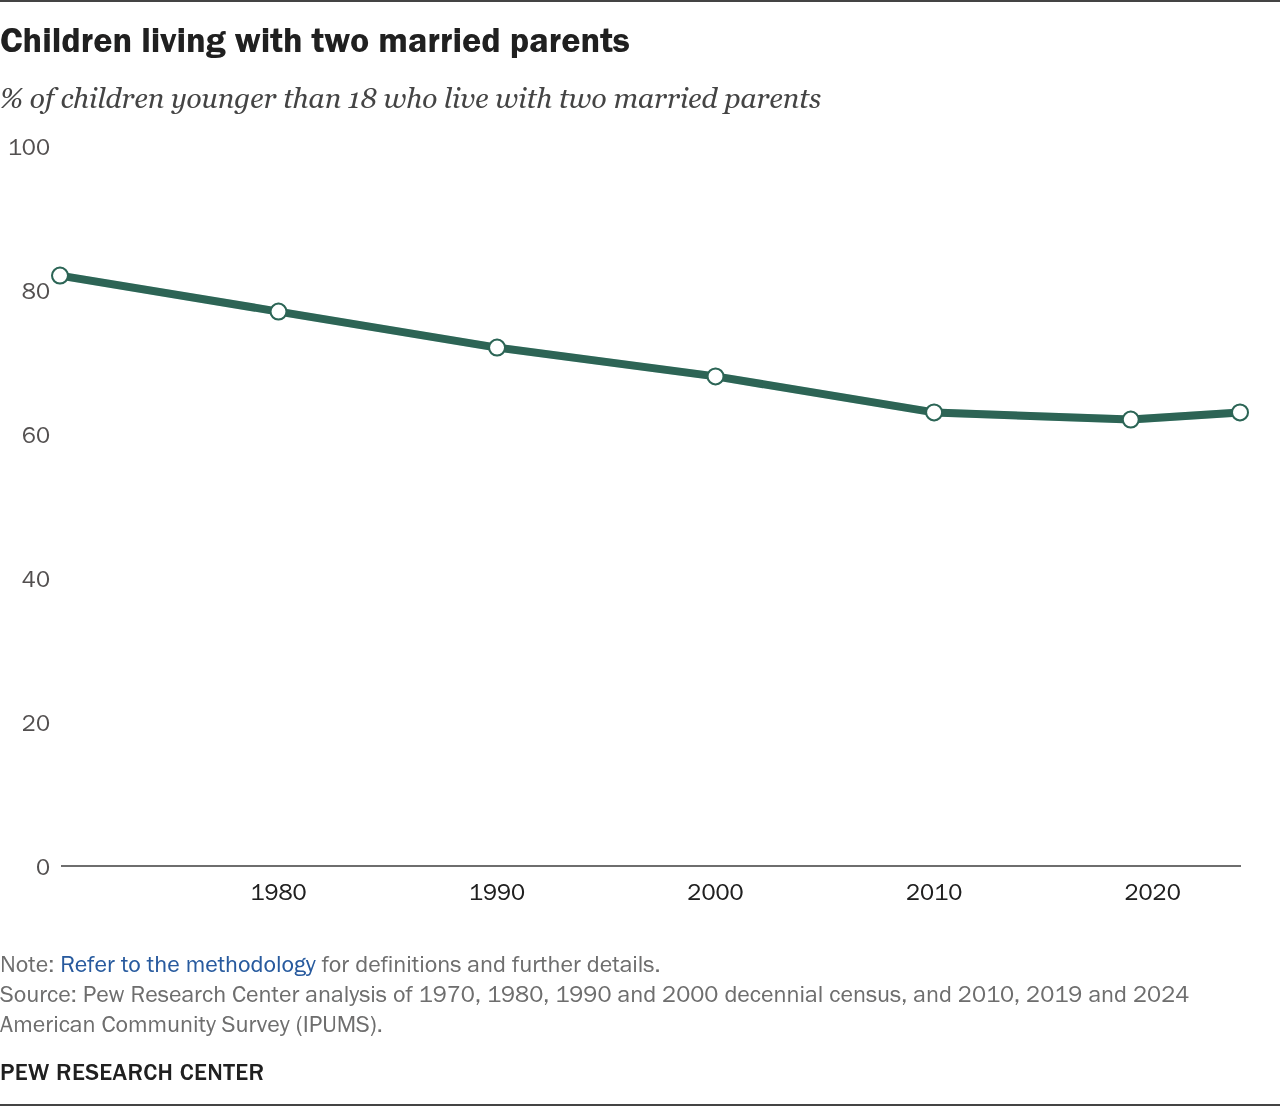
Children in the U.S. are much less likely to live with two married parents today than they were 50 years ago. This change has occurred across racial and ethnic groups with the exception of households headed by Asian adults, where the share has remained largely unchanged.
More generations under one roof
The share of Americans living in a household with more than one adult generation, or a multigenerational household, has increased substantially since 1970. This increase has been greater for Black, Hispanic and Asian Americans (reaching almost 30%) than for White Americans (rising to 16%).

Economics
The New York Stock Exchange in 1973. Over 50 years later, the New York Stock Exchange in 2024. (PL Gould/Images Press, Angela Weiss via Getty Images)
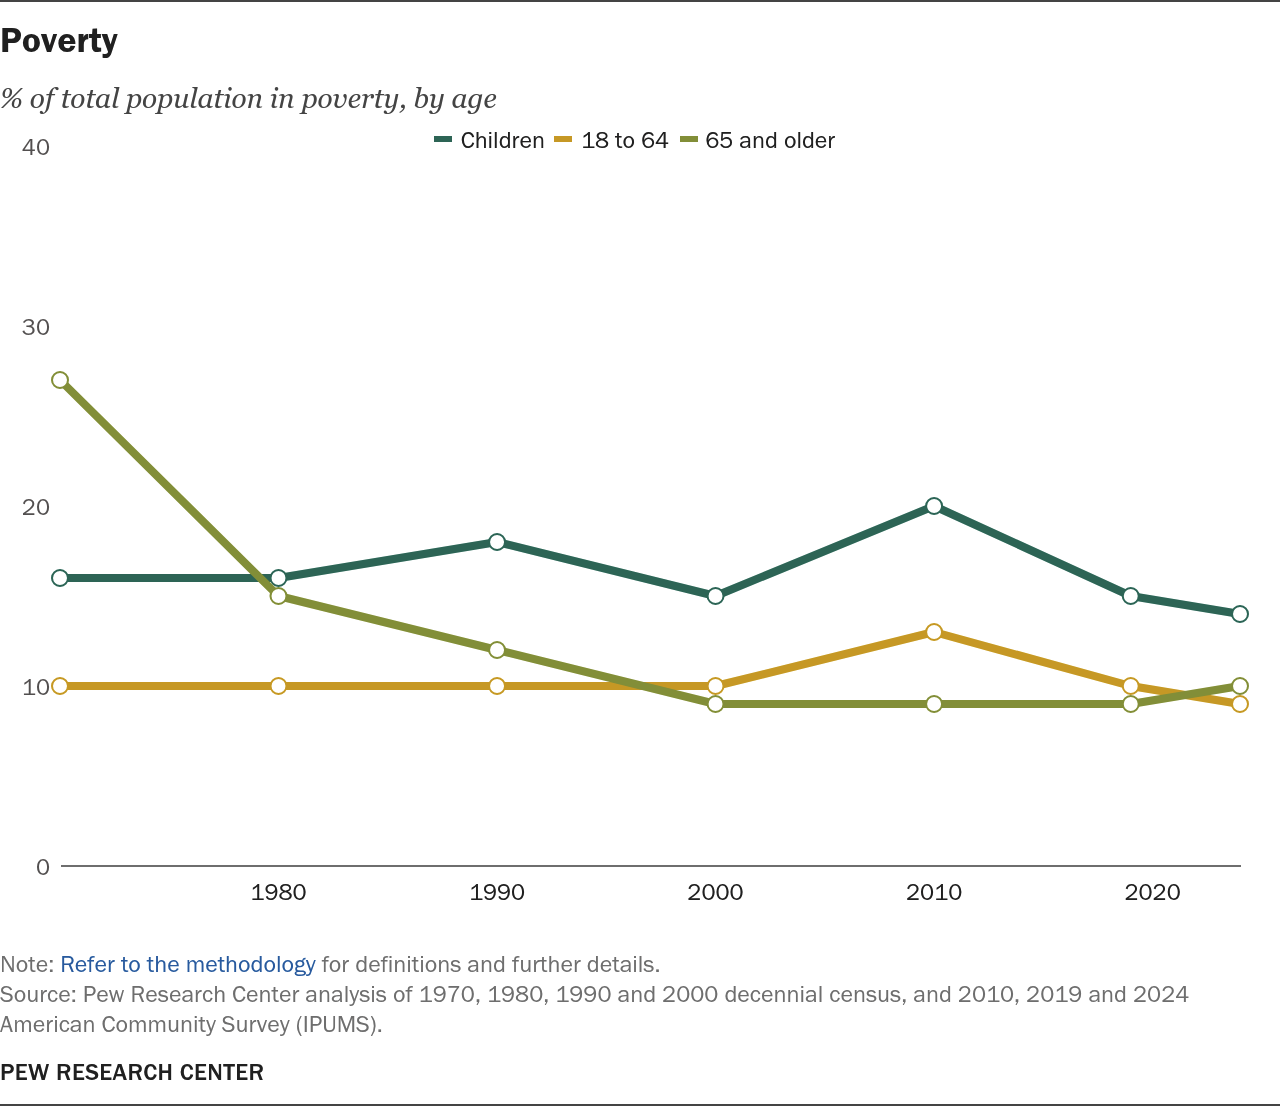
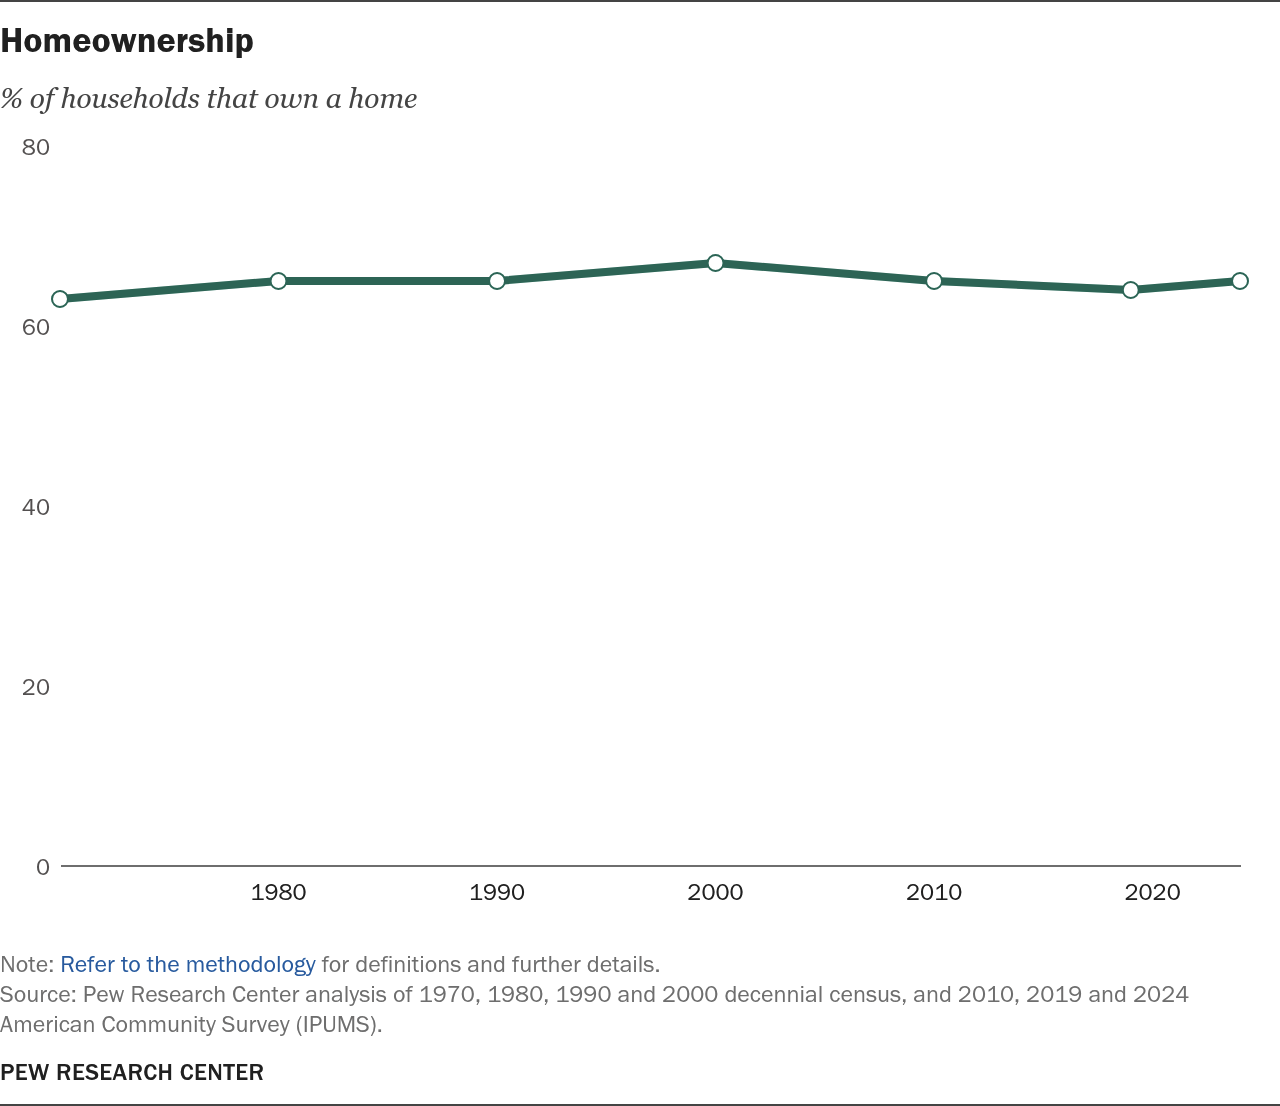
How much American standards of living have improved since 1970 partly depends on the measure. As the economy has grown, the share of Americans in poverty has declined and poverty among older Americans especially has fallen sharply. At the same time, the middle class has shrunk, and a growing share of adults are in the lower class. And homeownership has increased only marginally.
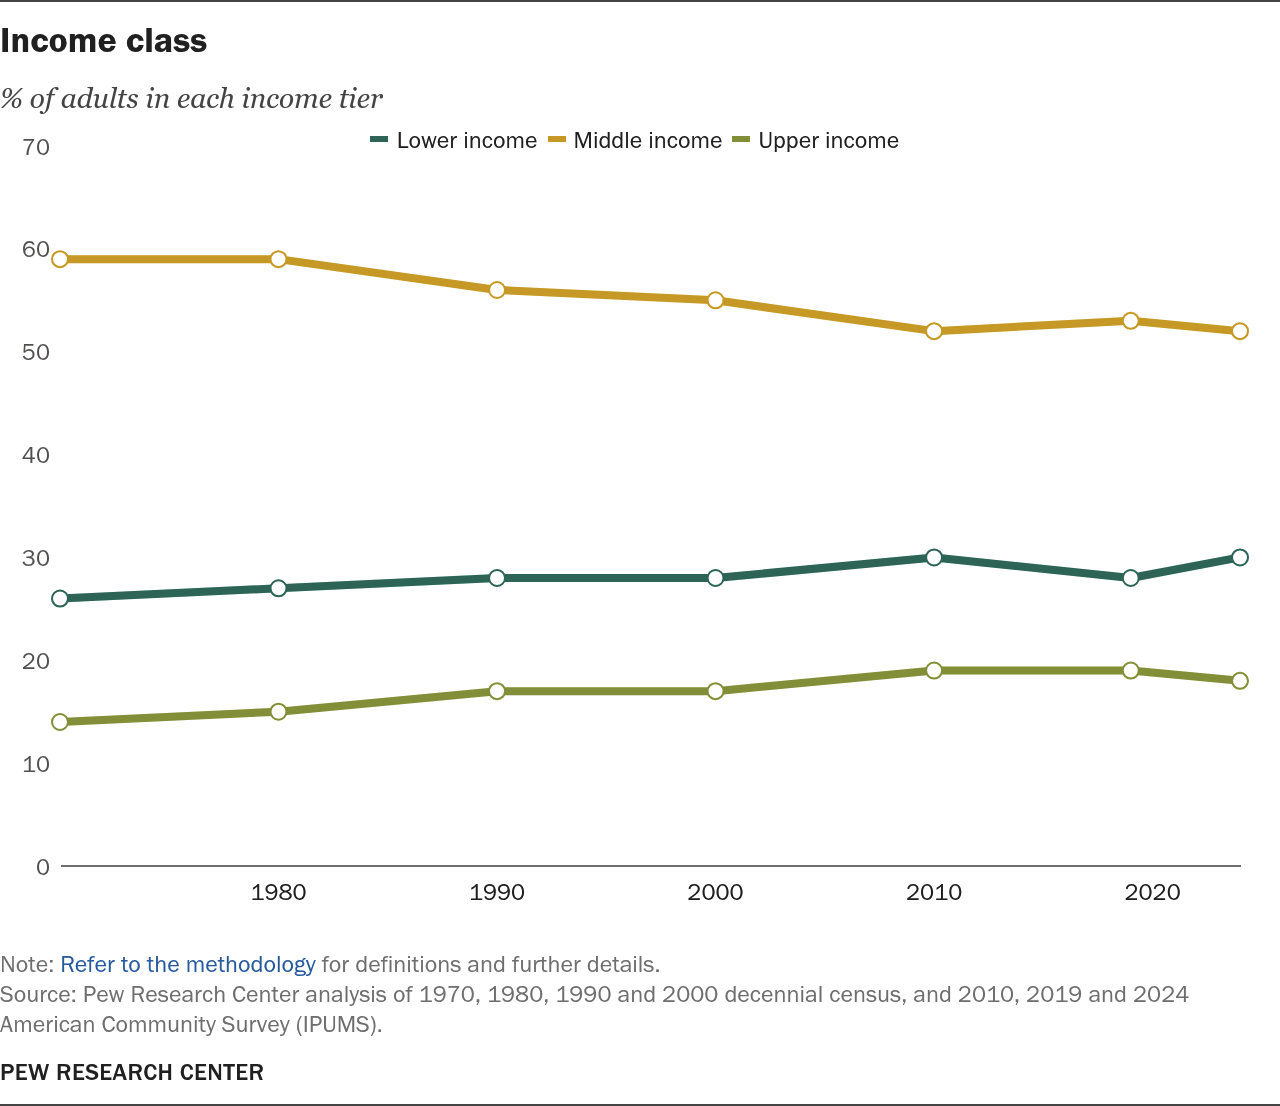
A shrinking middle class
The percentage of adults in the middle class has decreased since 1970, as the share in both the lower-income and upper-income tiers has grown.
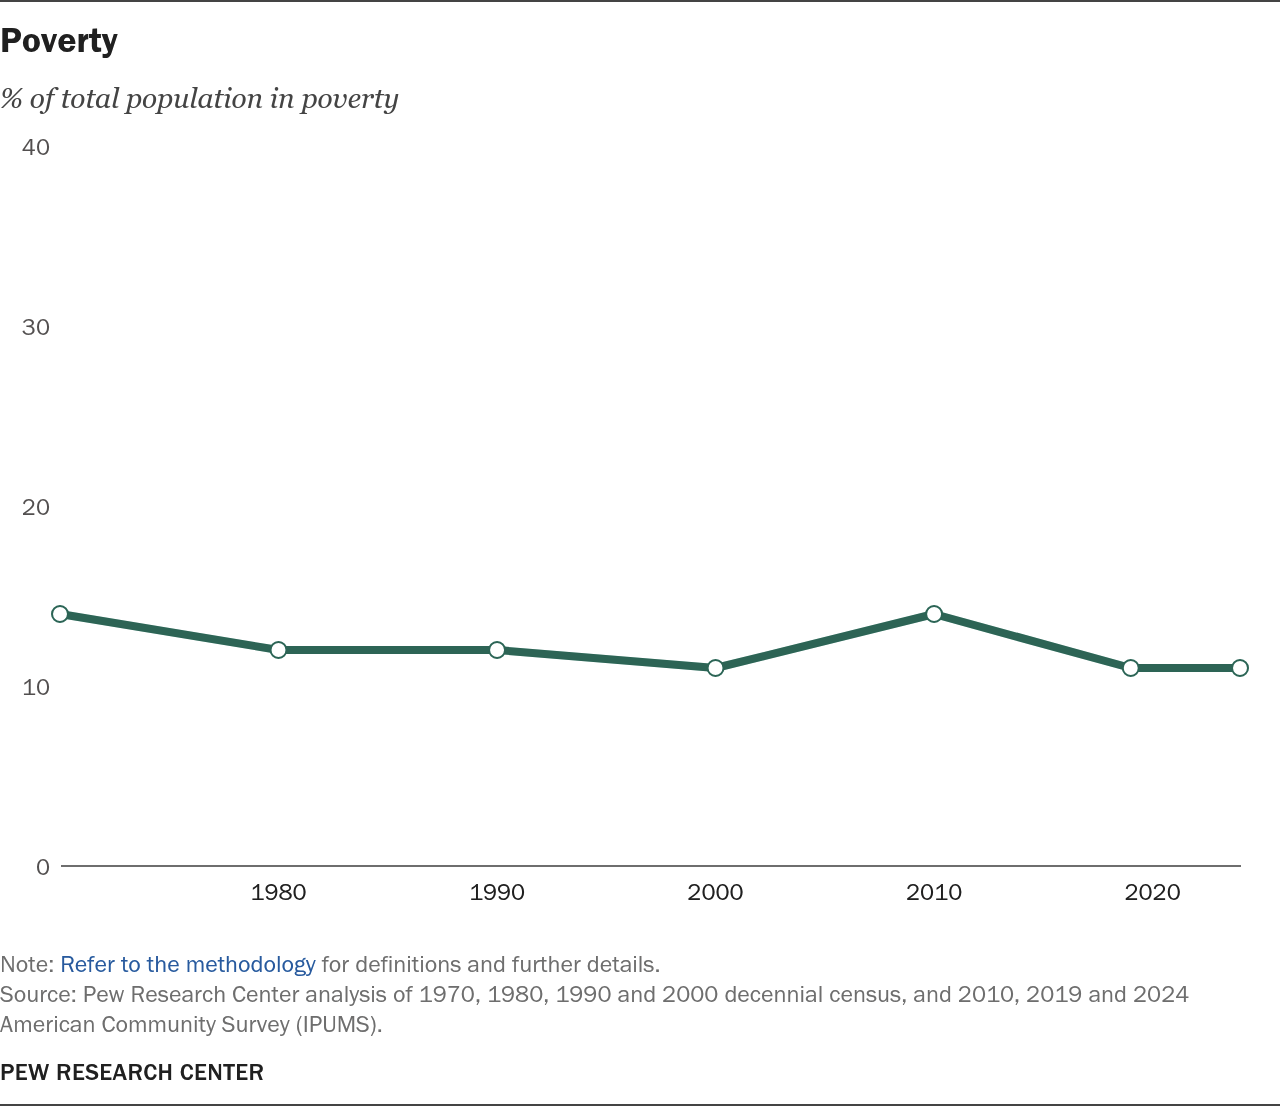
A modest drop in poverty
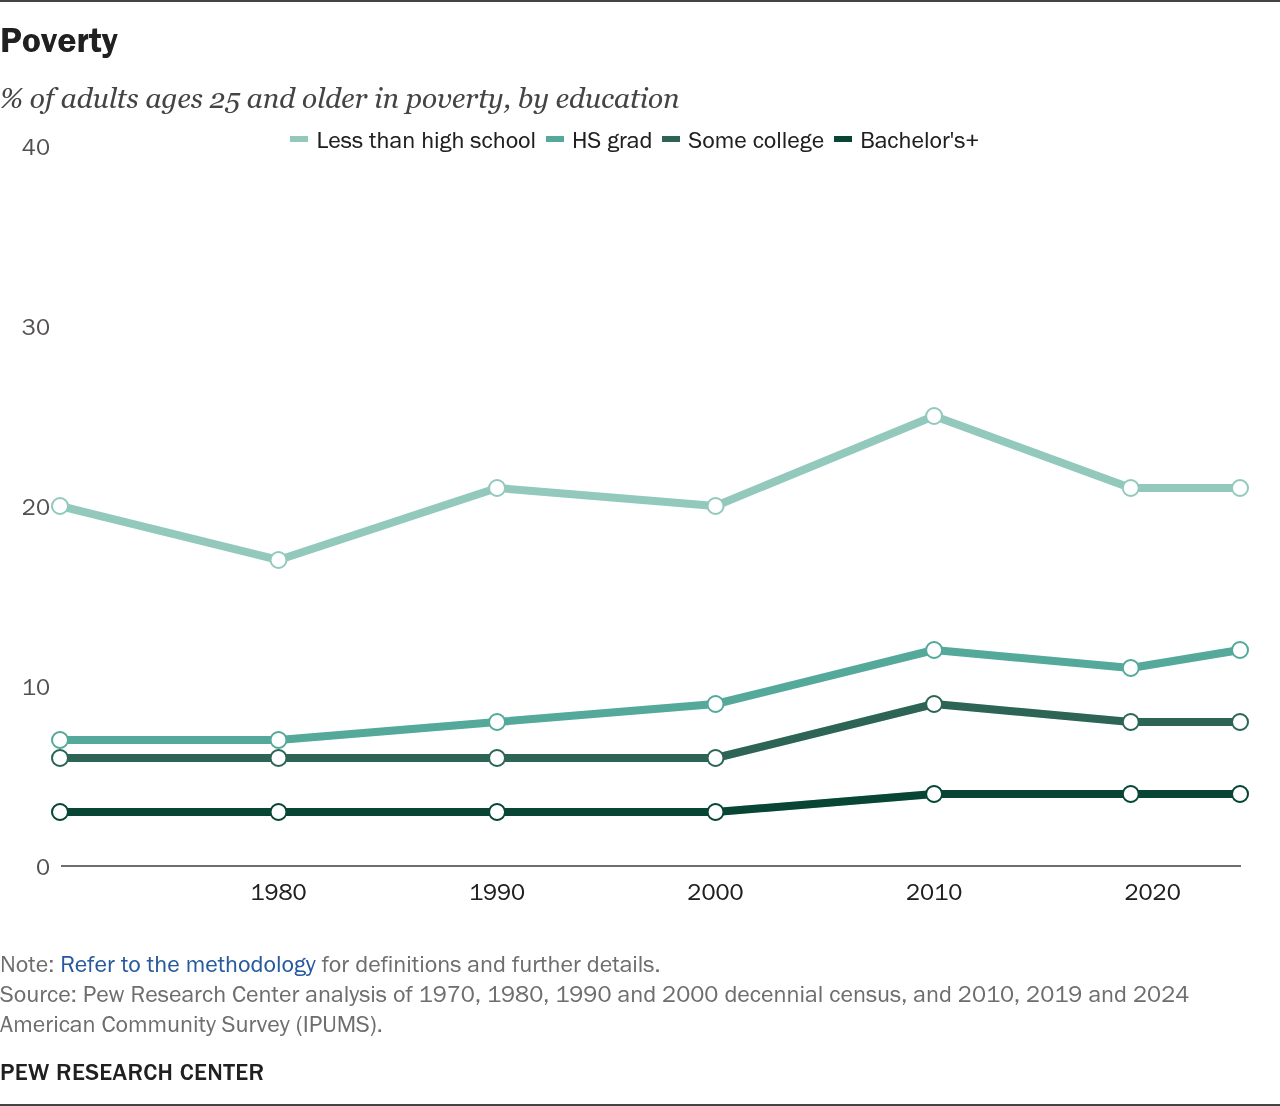
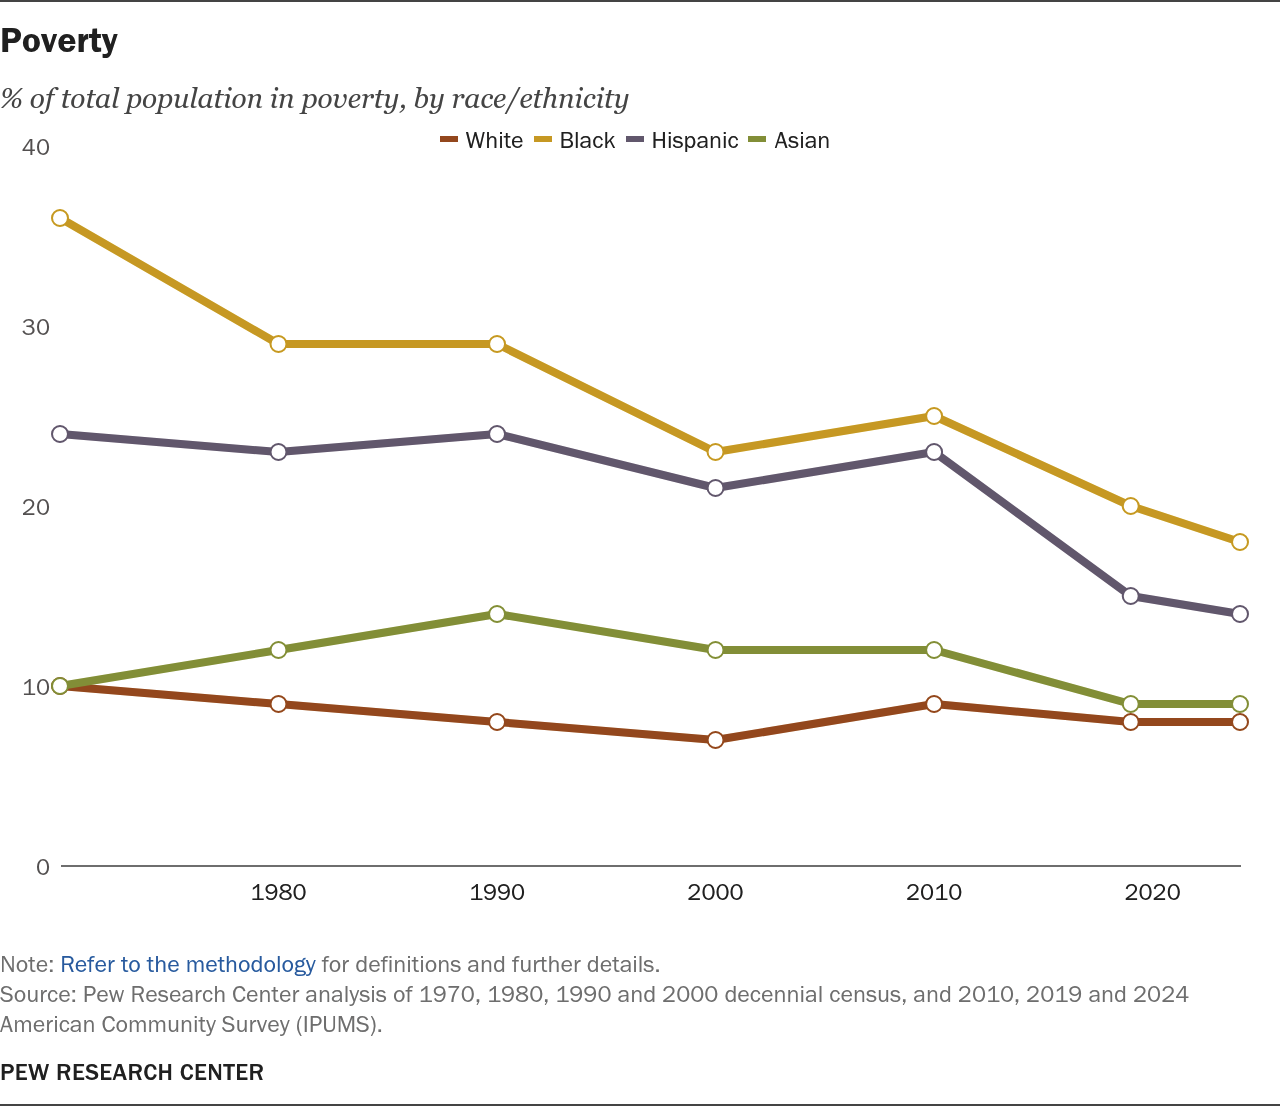
The share of Americans in poverty has declined, especially among older Americans. Adults who never attended college remain much more likely than those who did to be living in poverty.
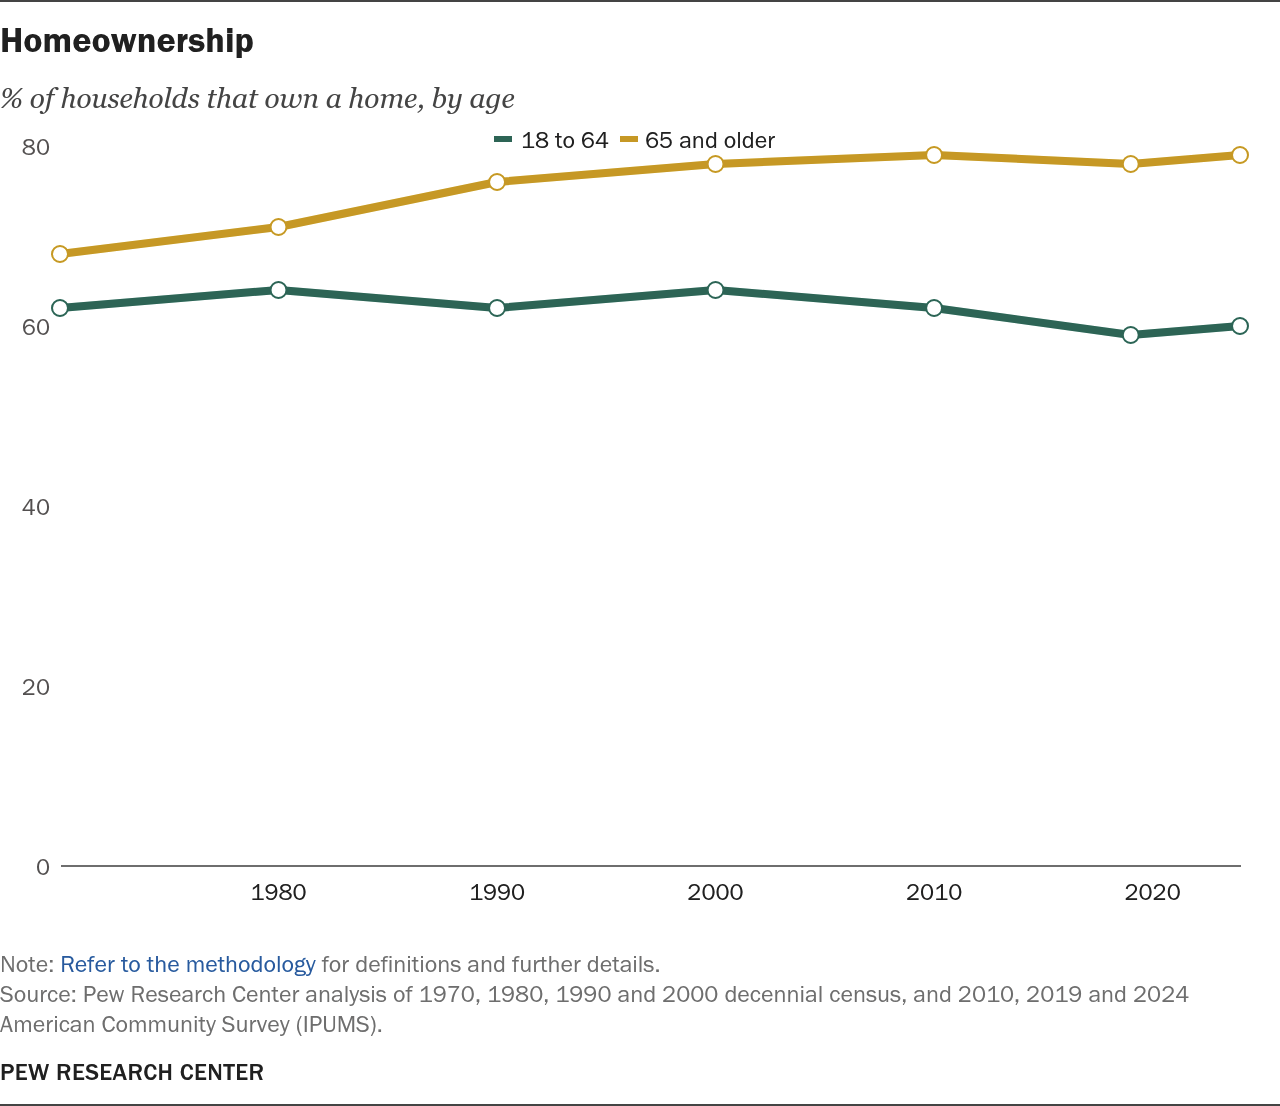
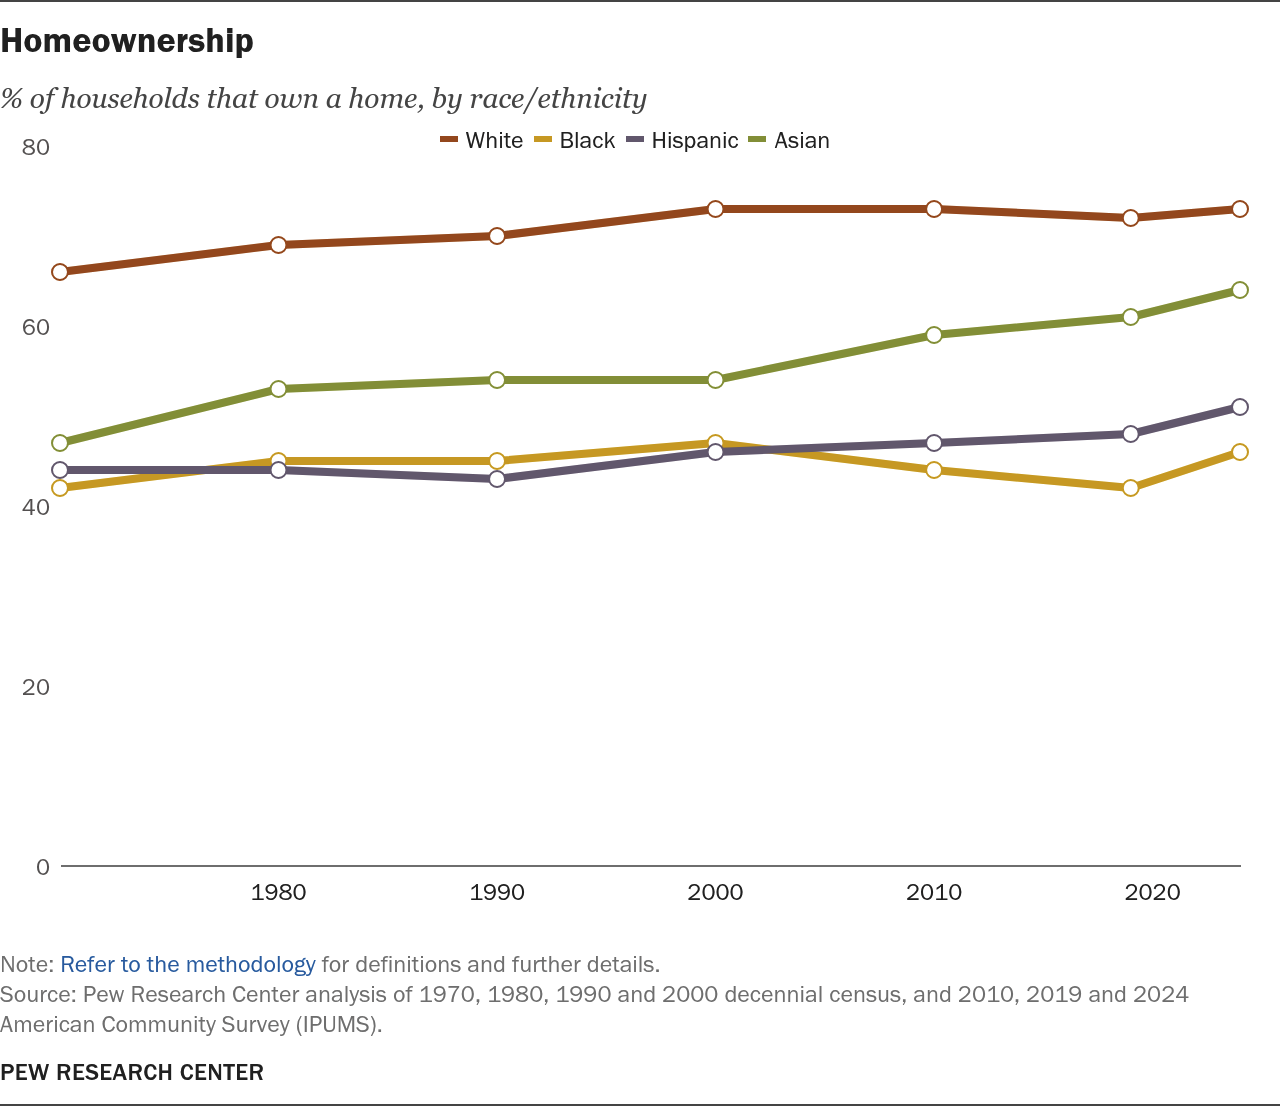
Uneven homeownership gains
Homeownership has increased only modestly since 1970. It has slightly decreased among adults ages 18 to 64 but has expanded significantly for those 65 and older.
Acknowledgments
This interactive fact sheet was written by Senior Economist Richard Fry, Senior Demographer Jeffrey Passel and Research Associate Jake Hays. It was edited by Senior Writer/Editor Dalia Fahmy. Research Analyst Dana Braga conducted the analysis of the number of children.
Research Associate Luis Noé-Bustamente, Research Analyst Kiley Hurst and Research Assistant Blen Wondimu number checked the essay. Editorial Assistant Mia Hennen copy edited the essay.
Information Graphics Designer John Carlo Mandapat and Digital Producer Reem Nadeem contributed to the production.
Kim Parker, Director of Social Trends Research; Juliana Horowitz, Senior Associate Director of Social Trends Research; Mark Hugo Lopez, Director of Race and Ethnicity Research; and Sahana Mukherjee, Associate Director of Race and Ethnicity Research, provided conceptual guidance and oversight.
Senior Communications Manager Tanya Arditi oversaw dissemination.