Pew Research Center

FOR RELEASE MAY 29, 2025

The Experiences of LGBTQ Americans Today

Most LGBTQ adults say there’s a lot of social acceptance for people who are gay or lesbian, but few say the same for those who are transgender

BY Rachel Minkin, Juliana Menasce Horowitz, Luona Lin and Dana Braga

FOR MEDIA OR OTHER INQUIRIES:

Communications Department
202.419.4372
www.pewresearch.org

RECOMMENDED CITATION

Pew Research Center, May 2025, "The Experiences of LGBTQ Americans Today"

About Pew Research Center

Pew Research Center is a nonpartisan, nonadvocacy fact tank that informs the public about the issues, attitudes and trends shaping the world. It does not take policy positions. The Center conducts public opinion polling, demographic research, computational social science research and other data-driven research. It studies politics and policy; news habits and media; the internet and technology; religion; race and ethnicity; international affairs; social, demographic and economic trends; science; research methodology and data science; and immigration and migration. Pew Research Center is a subsidiary of The Pew Charitable Trusts, its primary funder.

© Pew Research Center 2026

Table of contents

  • About Pew Research Center
  • The Experiences of LGBTQ Americans Today
  • 1. Social acceptance for gay, lesbian, bisexual, nonbinary and transgender people
  • 2. Personal experiences with acceptance and discrimination
  • 3. Experiences with coming out as gay, lesbian, bisexual or transgender
  • 4. LGBTQ identities
  • 5. Community, friends and LGBTQ spaces
  • Acknowledgments
  • Methodology

The Experiences of LGBTQ Americans Today

Most LGBTQ adults say there’s a lot of social acceptance for people who are gay or lesbian, but few say the same for those who are transgender

About this project

Pew Research Center conducted this study to understand the experiences of lesbian, gay, bisexual, transgender and queer adults in the United States 10 years after the Supreme Court’s Obergefell v. Hodges ruling legalized same-sex marriage nationwide. The survey explores how LGBTQ adults see the impact of Obergefell, how they view social acceptance for LGBTQ adults more broadly, and their personal experiences.  

This project builds on a similar survey we conducted in 2013 among gay, lesbian, bisexual and transgender adults and a series of 2022 focus groups that explored the experiences of transgender and nonbinary adults. Together, studies like these provide a composite snapshot of American identity. They also address significant data gaps where internal diversity or emerging demographic or social identities are not represented in traditional data sources.

For this study, we surveyed 3,959 LGBTQ U.S. adults from Jan. 8 to Jan. 19, 2025. The sample for this survey includes respondents from three different sources: Pew Research Center’s American Trends Panel (ATP), SSRS’s Opinion Panel (OP), and Ipsos’ Knowledge Panel (KP). The ATP is a group of people recruited through national, random sampling of residential addresses who have agreed to take surveys regularly. 

The survey included oversamples of transgender adults and gay, lesbian or bisexual adults who are married or living with a partner from Ipsos’ KnowledgePanel. Like the ATP, the Opinion Panel and KnowledgePanel are probability-based online survey web panels recruited primarily through national, random sampling of residential addresses.

Interviews were conducted either online or by telephone with a live interviewer. The survey is weighted to be representative of the U.S. LGBTQ adult population by gender, race, ethnicity, partisan affiliation, education and other factors.

Here are the questions used for this analysis, the topline and the survey methodology.

The Pew Research Center is a subsidiary of The Pew Charitable Trusts, its primary funder. This report was made possible with support from the Trusts and from the People & Voices Initiative.

Terminology

References to LGBTQ adults include adults who identify as lesbian, gay, bisexual, transgender or queer.

Throughout this report, references to gay, lesbian and bisexual adults exclude those who are transgender. Transgender adults are of any sexual orientation. Queer adults are included in the total and in the gay or lesbian, bisexual, and trans totals if they indicated they also identify with these terms. The number of queer respondents who do not identify as gay or lesbian, bisexual, or trans is too small to analyze separately.

Respondents indicated whether they are a man, a woman, nonbinary or describe their gender in some other way. They were asked separately to indicate their sexual orientation, if they are transgender and if they consider themselves queer. Gender was collected for analysis and not as a screening question.

References to White, Black and Asian adults include only those who are not Hispanic and identify as only one race. Hispanics are of any race. The views and experiences of Asian Americans are not analyzed separately in this report due to sample limitations.

References to those living in urban, suburban and rural areas are based on respondents’ answer to the following question: “How would you describe the community where you currently live? (1) urban, (2) suburban, (3) rural.”

References to college graduates or people with a college degree comprise those with a bachelor’s degree or more education. “Some college” includes those with an associate degree and those who attended college but did not obtain a degree. “High school” refers to those who have a high school diploma or its equivalent, such as a General Educational Development (GED) certificate.

All references to party affiliation include those who lean toward that party. Republicans include those who identify as Republicans and independents who lean toward the Republican Party. Democrats include those who identify as Democrats and independents who lean toward the Democratic Party.

June 26, 2025, marks 10 years since the Supreme Court ruled in Obergefell v. Hodges that the right to same-sex marriage is guaranteed across the United States.
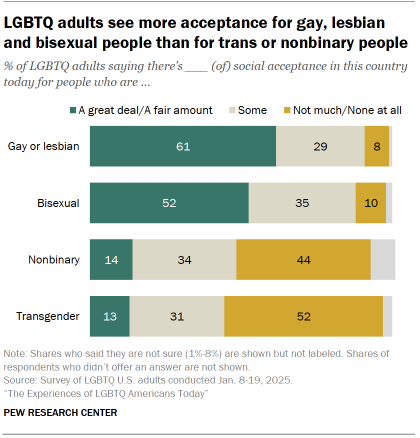
Chart shows LGBTQ adults see more acceptance for gay, lesbian and bisexual people than for trans or nonbinary people

The decision, which represented a major change in U.S. family law, reflected shifting public opinion on same-sex marriage. In 2004, 31% of Americans supported it, while 60% opposed. By 2015, 55% supported same-sex marriage, while 39% opposed. And support has continued to grow: In 2023, 63% of Americans expressed support for same-sex marriage.

To explore how lesbian, gay, bisexual, transgender and queer adults see the impact of Obergefell, and how they view social acceptance for these groups more broadly, we surveyed 3,959 LGBTQ adults from Jan. 8 to Jan. 19, 2025.

This study, which builds on a similar Pew Research Center survey conducted in 2013, also looks at the experiences of LGBTQ adults at a time when many in these groups see the political climate as unfavorable, especially for transgender people.

In broad strokes, the survey finds some sense of social progress, as well as a feeling that acceptance will continue to grow. But it also highlights experiences with discrimination, especially among transgender adults. And it underscores the diversity of experiences across and within LGBTQ groups – from coming out, to navigating public spaces, to connecting with a broader LGBTQ community.

Related: Same-Sex Parents Raising Kids

How we defined LGBTQ groups for analysis

Throughout this report, references to gay, lesbian and bisexual adults exclude those who are transgender. Transgender adults are of any sexual orientation (28% of trans adults we surveyed identify as gay or lesbian, 53% are bisexual, and 8% are straight).

Queer adults are included in the total and in the gay or lesbian, bisexual, and trans totals if they indicated they also identify with these terms. The number of queer respondents who do not identify as gay or lesbian, bisexual, or trans is too small to analyze separately.

Read Chapter 4 for more detail on the questions we asked related to sexual orientation and gender identity.

Key findings

LGBTQ adults have mixed views on how much social acceptance there is for certain groups.

  • 61% of LGBTQ adults say there’s at least a fair amount of acceptance for people who are gay or lesbian. About half (52%) say the same for people who are bisexual. Far fewer say there’s a great deal or fair amount of acceptance for people who are nonbinary (14%) or transgender (13%). 
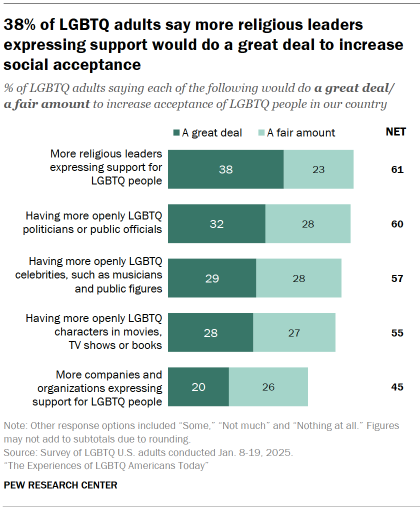
Chart shows 38% of LGBTQ adults say more religious leaders expressing support would do a great deal to increase social acceptance
  • Most LGBTQ adults say there is more acceptance today compared with 10 years ago for each of these groups. And majorities expect there to be even more acceptance 10 years from now.
  • In thinking about what might increase acceptance, many LGBTQ adults point to more support from religious leaders and to greater representation in politics and entertainment. Fewer see a lot of value in corporations or organizations expressing support for LGBTQ people.

Related: About two-thirds of LGBTQ adults have participated in Pride Month events

Two-thirds of LGBTQ adults say the Obergefell decision made people more accepting of same-sex couples.
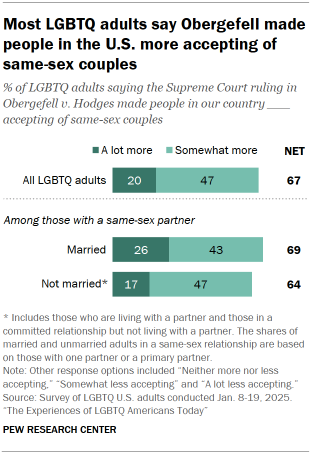
Chart shows Most LGBTQ adults say Obergefell made people in the U.S. more accepting of same-sex couples
  • This includes 47% who say the Supreme Court ruling made people somewhat more accepting and 20% who say it made people a lot more accepting.
  • LGBTQ adults who are in a same-sex marriage are more likely than those who are in a same-sex relationship but not married to say the ruling made people a lot more accepting (26% vs. 17%).

Majorities of gay or lesbian adults (73%) and transgender adults (68%) say they have been subject to slurs or jokes because of their sexual orientation or gender identity.
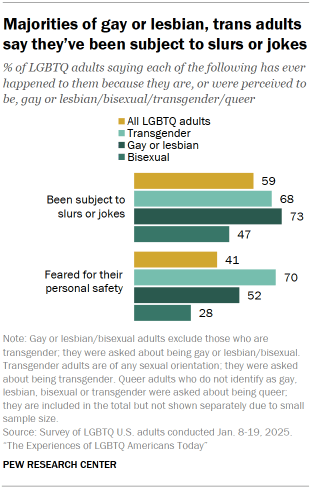
Chart shows Majorities of gay or lesbian, trans adults say they’ve been subject to slurs or jokes
  • Transgender adults are about twice as likely as gay or lesbian adults to say this has happened to them recently – that is, in the 12 months prior to the survey (42% vs. 22%).
  • 70% of transgender adults say they have feared for their personal safety at some point. About half of gay or lesbian adults (52%) and 28% of bisexual adults say the same.
  • Among LGBTQ adults overall, 24% say they have received poor service at stores or restaurants, 21% say they have been treated poorly by doctors or nurses, and 19% say they have been treated unfairly by an employer because of their sexual orientation or gender identity.
  • Transgender adults are more likely than others to say they have been treated poorly by health care professionals (42% vs. 24% of gay or lesbian adults and 16% of bisexual adults).

Many LGBTQ adults say they were first aware of their sexual orientation or gender identity at an early age but didn’t tell anyone until later.
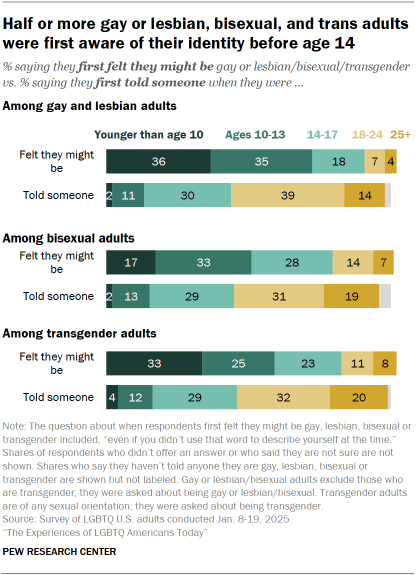
Chart shows Half or more gay or lesbian, bisexual, and trans adults were first aware of their identity before age 14
  • 71% of gay or lesbian adults, 50% of bisexual adults, and 58% of transgender adults say they were first aware of their identity before age 14. Much smaller shares say they had told someone about it by that age.
  • Among gay or lesbian adults, men are more likely than women to say they first felt they might be gay at age 13 or younger (78% vs. 53%). But men and women respond similarly when asked at what age they first came out to someone.
  • The opposite is true among bisexual adults: Women are more likely than men to say they first thought they might be bisexual at age 13 or younger (53% vs. 39%). Bisexual women are also much more likely than bisexual men to say they came out to someone before age 18 (50% vs. 24%).

Younger gay, lesbian and bisexual adults tend to say they came out at an earlier age compared with their older counterparts.

  • 67% of gay or lesbian adults under 30 say they came out to someone before age 18. Smaller shares in their 30s (53%), 40s (37%), 50s (32%) or ages 60 and older (24%) say the same.
  • Similarly, 56% of bisexual adults under 30 say they first came out before age 18, but fewer than half in older age groups report doing so.

Bisexual adults are more likely than gay, lesbian and transgender adults to say they haven’t come out to any of their family, friends or co-workers.

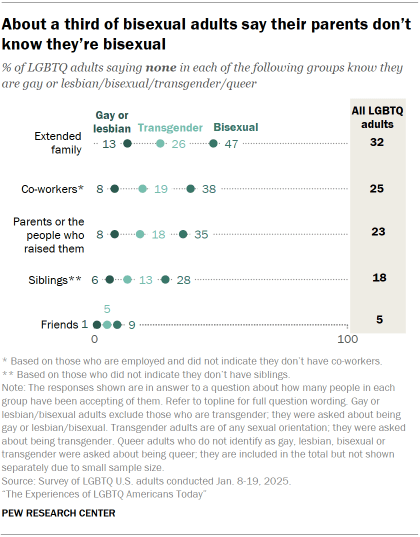
  • For example, 47% of bisexual adults say they’re not out to any of their extended family. This compares with 26% of transgender adults and 13% of gay or lesbian adults.
  • Overall, 32% of LGBTQ adults say no one in their extended family knows they are gay, lesbian, bisexual, transgender or queer. About a quarter (23%) say their parents or the people who raised them don’t know. And 25% say none of their co-workers know (among those who are employed and have co-workers).
  • Smaller shares say none of their siblings (18% among those who have siblings) or none of their friends (5%) know about this part of their identity.

Gay or lesbian adults are more likely than bisexual and trans adults to say their family members have been accepting of their identity.
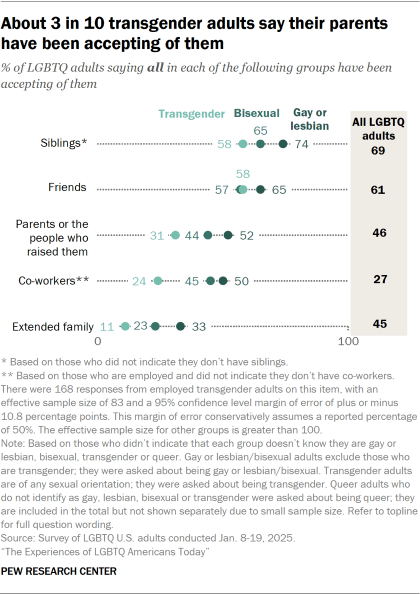
Chart shows About 3 in 10 transgender adults say their parents have been accepting of them
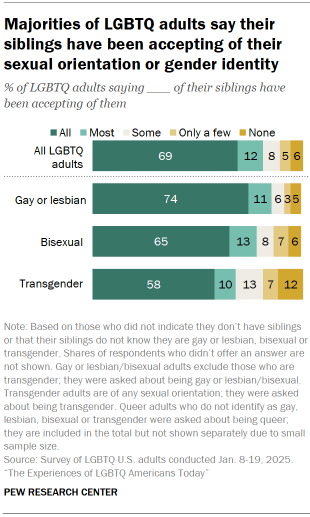
  • 74% of gay or lesbian adults say all of their siblings have been accepting (among those who have siblings). Smaller shares of bisexual (65%) and transgender (58%) adults say the same.
  • Gay or lesbian adults are also more likely than others to say this about their parents or the people who raised them, and about their extended family. 
  • A majority of LGBTQ adults (61%) say all of their friends have been accepting of them.

About four-in-ten LGBTQ adults (42%) say their sexual orientation or gender identity is highly important to who they are as a person.

  • 67% of transgender adults say being trans is extremely or very important to who they are. Smaller shares of gay or lesbian adults (54%) and bisexual adults (29%) say this about their own identity.
  • LGBTQ adults who are Black (48%) or Hispanic (47%) are more likely than those who are White (39%) to say their LGBTQ identity is highly important to who they are. (There aren’t enough Asian LGBTQ adults in the sample to analyze their views separately.)

About a quarter of LGBTQ adults (23%) say they feel extremely or very connected to a broader LGBTQ community, but this varies by group.
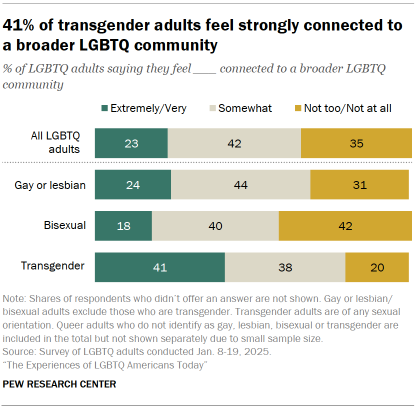
Chart shows 41% of transgender adults feel strongly connected to a broader LGBTQ community
  • 41% of transgender adults feel this level of connection, compared with 24% of gay or lesbian adults and 18% of bisexual adults.
  • 63% of transgender adults also say all or most of their friends are LGBTQ. This is far greater than the shares of gay or lesbian adults (30%) and bisexual adults (20%) who say the same.

Some views and experiences of LGBTQ adults vary by party.
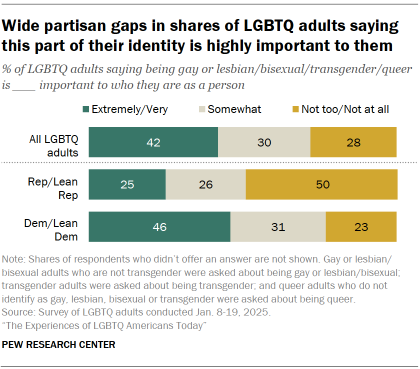
Chart shows Wide partisan gaps in shares of LGBTQ adults saying this part of their identity is highly important to them
  • LGBTQ adults who are Democrats or lean Democratic are more likely than Republicans and Republican leaners to say Obergefell made people more accepting of same-sex couples (70% vs. 55%).
  • 46% of LGBTQ Democrats say being gay, lesbian, bisexual, transgender or queer is extremely or very important to who they are as a person. This compares with 25% of LGBTQ Republicans.
  • LGBTQ Democrats are more likely than their Republican counterparts to say all or most of their friends are LGBTQ (31% vs. 13%).
  • Overall, 80% of LGBTQ adults are Democrats and 16% are Republicans.

About half of gay or lesbian adults say they have at least a fair amount in common with most bisexual or straight people.

  • Majorities of gay or lesbian (77%), bisexual (71%), and transgender (74%) adults say they have a great deal or a fair amount in common with most others in their own group.
  • About half of gay and lesbian adults say they have a great deal or a fair amount in common with bisexual people (50%) and straight people (51%). A smaller share (28%) say they have a lot in common with transgender people.
  • Bisexual adults are more likely than gay or lesbian adults to say they have at least a fair amount in common with straight people (61% vs. 51%). A quarter say they have at least a fair amount in common with transgender people.
  • Most transgender adults say they have a lot in common with gay, lesbian and bisexual people. But it’s important to note that 28% of trans adults themselves identify as gay or lesbian, and 53% identify as bisexual.

LGBTQ adults tend to be young, and that’s especially true of transgender adults.
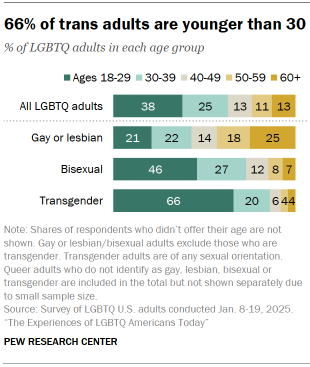
Chart shows 66% of trans adults are younger than 30
  • The median age of LGBTQ adults is 34, versus 47 for all U.S. adults.1
  • Overall, 38% of LGBTQ adults are ages 18 to 29, and 25% are in their 30s. Only 13% are ages 60 and older.
  • 66% of transgender adults are younger than 30. This compares with 46% of bisexual adults and 21% of gay or lesbian adults.
  • In turn, 25% of gay or lesbian adults are ages 60 and older, while just 7% of bisexual adults and 4% of transgender adults are in this age group.

Half of all LGBTQ adults are women, 40% are men and 8% are nonbinary.
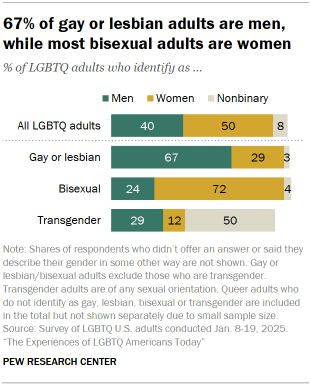
Chart shows 67% of gay or lesbian adults are men, while most bisexual adults are women
  • Men account for 67% of gay or lesbian adults. The gender composition looks different among bisexual adults: 72% are women.
  • Among trans adults, more are men (29%) than are women (12%). The largest share (50%) are nonbinary, while 8% describe their gender in some other way.

Jump to read more about:

  • Changing acceptance of LGBTQ people
  • Acceptance by family, friends and co-workers, and experiences with discrimination
  • Coming out
  • LGBTQ identities
  • Community, friends and LGBTQ spaces

CORRECTION (Sept. 11, 2025): In a previous version of the chart “About 3 in 10 transgender adults say their parents have been accepting of them,” the shares of all LGTBQ adults who say all their co-workers are accepting and all their extended family are accepting were transposed. This has been updated, and the report’s findings are not affected.
1. Social acceptance for gay, lesbian, bisexual, nonbinary and transgender people

When it comes to how much social acceptance there is for people who are gay, lesbian, bisexual, nonbinary or transgender in the U.S. today, LGBTQ adults see the most acceptance for those who are gay or lesbian.

How we defined LGBTQ groups for analysis

Throughout this report, references to gay, lesbian and bisexual adults exclude those who are transgender. Transgender adults are of any sexual orientation (28% of trans adults we surveyed identify as gay or lesbian, 53% are bisexual, and 8% are straight).

Queer adults are included in the total and in the gay or lesbian, bisexual, and trans totals if they indicated they also identify with these terms. The number of queer respondents who do not identify as gay or lesbian, bisexual, or trans is too small to analyze separately.

Read Chapter 4 for more on the questions we asked related to sexual orientation and gender identity.

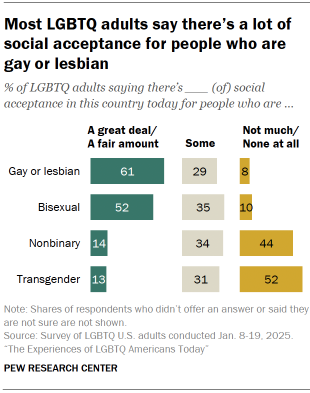
Chart shows Most LGBTQ adults say there’s a lot of social acceptance for people who are gay or lesbian

A majority (61%) say there is a great deal or a fair amount of acceptance for people who are gay or lesbian. And about half (52%) say the same for those who are bisexual.

Much smaller shares say there’s a great deal or a fair amount of acceptance for people who are nonbinary (14%) or transgender (13%).

Roughly half (52%) say there’s not much or no acceptance at all for transgender people. And 44% say this is the case for nonbinary people.

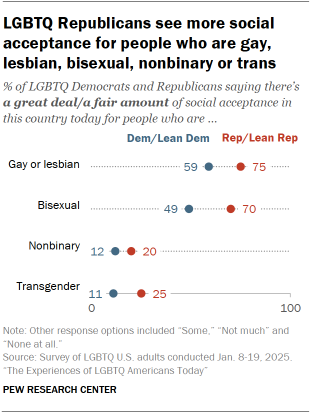
Chart shows LGBTQ Republicans see more social acceptance for people who are gay, lesbian, bisexual, nonbinary or trans

Views on social acceptance are mostly similar across LGBTQ groups. But those who are bisexual (56%) are more likely than those who are gay or lesbian (50%) or transgender (46%) to say there’s a lot of acceptance for bisexual people.

LGBTQ adults who are nonbinary (57%) are more likely than LGBTQ men and women (43% each) to say there is not much or no acceptance at all for nonbinary people.

LGBTQ Republicans are more likely than LGBTQ Democrats to say there’s a great deal or a fair amount of acceptance for people who are:

  • Gay or lesbian (75% vs. 59%)
  • Bisexual (70% vs. 49%)
  • Nonbinary (20% vs. 12%)
  • Transgender (25% vs. 11%)

Views of social acceptance 10 years ago and 10 years from now

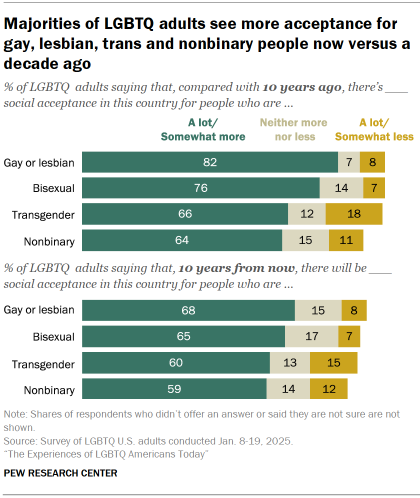
We also asked LGBTQ adults their views of social acceptance today for people who are gay, lesbian, bisexual, nonbinary or transgender compared with 10 years ago, and how they expect things to be 10 years from now. What we found is that majorities see progress over the past decade and expect more acceptance in the future.

Chart shows Majorities of LGBTQ adults see more acceptance for
gay, lesbian, trans and nonbinary people now versus a
decade ago

Most LGBTQ adults say acceptance has increased for people who are:

  • Gay or lesbian (82% say there’s a lot or somewhat more acceptance today than 10 years ago)
  • Bisexual (76%)
  • Transgender (66%)
  • Nonbinary (64%)

Even among those who say there isn’t much acceptance for these groups, majorities see more acceptance than in the past.

Looking ahead, majorities also expect there to be even more social acceptance for these groups in the future. These shares range somewhat: 68% think there will be more acceptance for people who are gay or lesbian 10 years from now, while 59% say the same for nonbinary people.

Views by age

Similar shares of LGBTQ adults ages 18 to 49 and ages 50 and older say there’s at least somewhat more acceptance for people who are gay or lesbian compared with 10 years ago (83% and 82%). But younger LGBTQ adults are more likely than older ones to say there’s more acceptance today for people who are:

  • Bisexual (78% vs. 69%)
  • Transgender (68% vs. 57%)
  • Nonbinary (68% vs. 52%)

Impact of Obergefell v. Hodges on acceptance of same-sex couples

In 2015, the Supreme Court ruled in Obergefell v. Hodges that the right to same-sex marriage is guaranteed across the U.S. We asked LGBTQ adults how they think this decision has impacted society’s acceptance of same-sex couples.

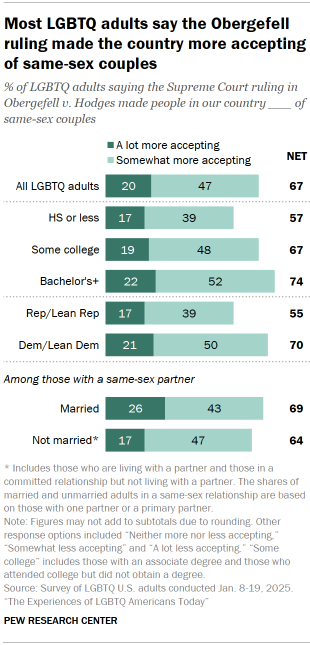
Chart shows Most LGBTQ adults say the Obergefell ruling made the country more accepting of same-sex couples

Two-thirds of LGBTQ adults say the ruling made the country at least somewhat more accepting of same-sex couples. This includes 20% who say it has made people a lot more accepting.

About a quarter (24%) say Obergefell made people neither more nor less accepting. And 9% say it made them a lot or somewhat less accepting of same-sex couples.

Views by education

LGBTQ adults with more education are more likely than those with less to say the ruling has made the country more accepting of same-sex couples.

About three quarters (74%) of LGBTQ adults with at least a bachelor’s degree say this. By comparison, two-thirds of those with some college and 57% of those with a high school diploma or less education say the same.

Views by party

Among LGBTQ adults, Democrats are more likely than Republicans to say Obergefell has made the country more accepting of same-sex couples (70% vs. 55%).

The difference is mostly driven by the shares saying the ruling has made the country somewhat more accepting of same-sex couples. Half of LGBTQ Democrats say this, compared with 39% among LGBTQ Republicans. There’s a much smaller difference between the shares saying Obergefell made people a lot more accepting (21% vs. 17%).

Views by marital status

Among LGBTQ adults who are in a committed same-sex relationship, similar shares of those who are married and those who are not say the ruling has made the country more accepting of same-sex couples (69% vs. 64%).2

However, those in a same-sex marriage are more likely than those who are in a same-sex relationship but not married to say Obergefell has made the country a lot more accepting of same-sex couples (26% vs. 17%).

Factors that might increase social acceptance for LGBTQ people

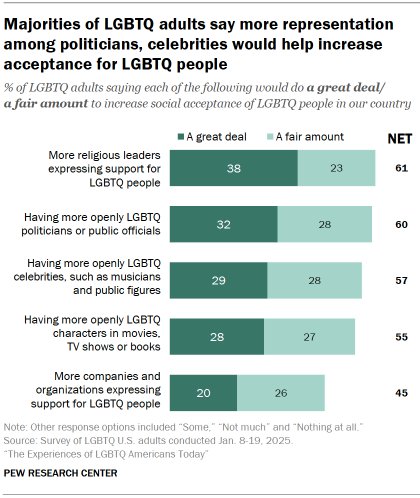
Majorities of LGBTQ adults say each of the following would do a great deal or a fair amount to increase acceptance of LGBTQ people:

Chart shows Majorities of LGBTQ adults say more representation among politicians, celebrities would help increase acceptance for LGBTQ people
  • More religious leaders expressing support for LGBTQ people (61%)
  • Having more openly LGBTQ politicians or public officials (60%)
  • Having more openly LGBTQ celebrities, such as musicians and public figures (57%)
  • Having more openly LGBTQ characters in movies, TV shows or books (55%)

Fewer than half (45%) say having more companies and organizations expressing support for LGBTQ people would do a lot to increase social acceptance.

Views by education

LGBTQ adults with at least a bachelor’s degree are more likely than those with less education to say each of these things we asked about would do a lot to increase acceptance. For example, 73% of those with at least a bachelor’s degree say more religious leaders expressing support for LGBTQ people would do a lot. By comparison, 55% of those with some college or less education say the same.

Views by party

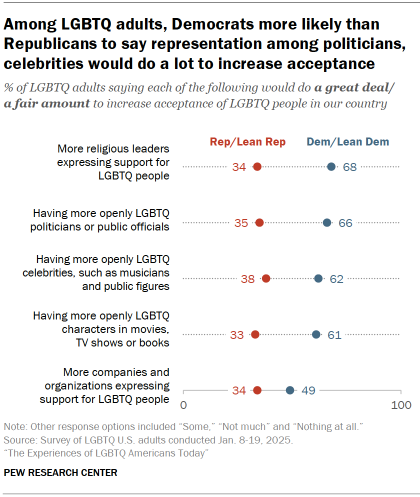
By double-digit margins, LGBTQ Democrats are more likely than LGBTQ Republicans to say the following would do a great deal or a fair amount to increase acceptance:

Chart shows Among LGBTQ adults, Democrats more likely than Republicans to say representation among politicians, celebrities would do a lot to increase acceptance
  • More religious leaders expressing support for LGBTQ people (68% vs. 34%)
  • More openly LGBTQ politicians or public officials (66% vs. 35%)
  • More openly LGBTQ celebrities, such as musicians and public figures (62% vs. 38%)
  • More openly LGBTQ characters in movies, TV shows or books (61% vs. 33%)
  • More companies and organizations expressing support for LGBTQ people (49% vs. 34%)

2. Personal experiences with acceptance and discrimination

We asked LGBTQ adults whether they feel accepted by their family, friends and co-workers, and about their experiences with discrimination based on their LGBTQ identity.

How we defined LGBTQ groups for analysis

Throughout this report, references to gay, lesbian and bisexual adults exclude those who are transgender. Transgender adults are of any sexual orientation (28% of trans adults we surveyed identify as gay or lesbian, 53% are bisexual, and 8% are straight).

Queer adults are included in the total and in the gay or lesbian, bisexual, and trans totals if they indicated they also identify with these terms. The number of queer respondents who do not identify as gay or lesbian, bisexual or trans is too small to analyze separately.

Read Chapter 4 for more detail on the questions we asked related to sexual orientation and gender identity.

Some LGBTQ adults are not out to different people in their lives. Varying shares say no one in each of the following groups knows about their sexual orientation or gender identity:

Chart shows About a third of bisexual adults say their parents don’t know they’re bisexual
  • Their extended family (32%)
  • Their co-workers (25% among those with co-workers)
  • Their parents or the people who raised them (23%)
  • Their siblings (18% among those with siblings)
  • Their friends (5%)

Bisexual adults are more likely than others to say no one in these groups knows about their identity. For example, 47% of bisexual adults say no one in their extended family knows, compared with 26% of transgender adults and 13% of gay or lesbian adults.

Acceptance by family, friends and co-workers

Parents

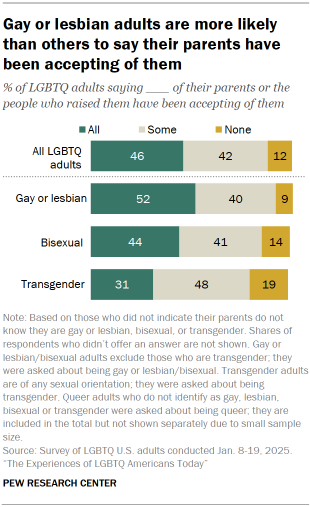
Chart shows Gay or lesbian adults are more likely than others to say their parents have been accepting of them

Figures for parents exclude those who say none of their parents or the people who raised them know about their identity.

Fewer than half of LGBTQ adults who are out to their parents or the people who raised them (46%) say they are all accepting. Another 42% say some have been accepting, while 12% say none of them have been accepting.

Gay or lesbian adults are the most likely – and transgender adults the least likely – to say all of their parents or the people who raised them are accepting. About half of gay or lesbian adults (52%) say this is the case, compared with 44% of bisexual adults and 31% of transgender adults.

Siblings

Chart shows Majorities of LGBTQ adults say their siblings have been accepting of their sexual orientation or gender identity

Figures for siblings exclude those who don’t have siblings and those who say none of their siblings know about their identity.

Most LGBTQ adults (69%) say all of their siblings have been accepting of them.

Again, gay or lesbian adults stand out as the most likely to say all of their siblings have been accepting (74% vs. 65% of bisexual adults and 58% of transgender adults).

Extended family

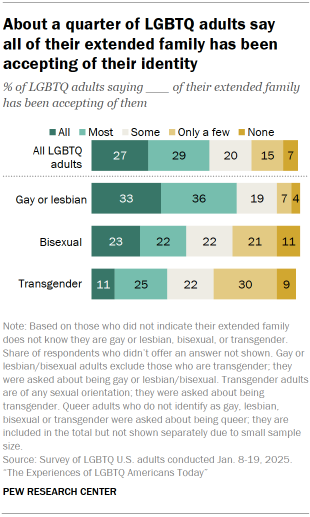
Figures for extended family exclude those who say none of their extended family know about their identity.

Chart shows About a quarter of LGBTQ adults say all of their extended family has been accepting of their identity

Levels of acceptance drop for extended family such as grandparents, aunts and cousins: 56% of LGBTQ adults say all or most of their extended family has been accepting of them, including 27% who say all have been.

Acceptance by extended family varies widely across groups:

  • Gay or lesbian adults: 69% say all or most have been accepting, with 33% saying all have been.
  • Bisexual adults: 45% say all or most, with 23% saying all.
  • Transgender adults: 35% say all or most, with 11% saying all.

Friends and co-workers

Figures for friends exclude those who say none of their friends know about their identity.

Figures for co-workers exclude those who don’t have co-workers and those who say none of their co-workers know about their identity.

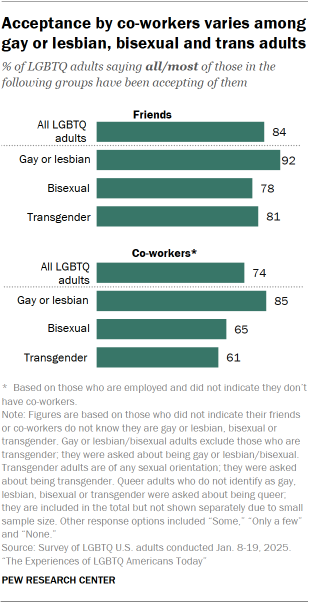
Chart shows Acceptance by co-workers varies among gay or lesbian, bisexual and trans adults

Majorities of LGBTQ adults say all or most of their friends and co-workers have been accepting.

Most (84%) say all or most of their friends have been accepting, including 61% who say all have been.

While majorities across LGBTQ groups say all or most of their friends have been accepting, gay or lesbian adults are the most likely to say this (92% vs. 81% of transgender and 78% of bisexual adults).

Experiences vary more widely when it comes to co-workers.

About three-quarters of employed LGBTQ adults (74%) say all or most of their co-workers have been accepting. Again, larger shares of gay or lesbian adults (85%) say this than bisexual (65%) and transgender adults (61%).

While majorities across groups say all or most of their co-workers have been accepting, there are stark differences in the shares saying all have been accepting:

  • Gay or lesbian adults: 50%
  • Bisexual adults: 45%
  • Transgender adults: 24%

Experiences with discrimination

The survey also asked respondents if they have faced certain forms of discrimination because they are – or were perceived to be – gay, lesbian, bisexual or transgender.

Chart shows 7 in 10 trans adults say they’ve feared for their personal safety because of their gender identity

More than half of LGBTQ adults (59%) say they have been subject to slurs and jokes, with 20% saying they experienced this in the 12 months prior to the survey.

Roughly four in-ten (41%) say they have feared for their personal safety at some point because of their LGBTQ identity. And about one-in-five or more say they have:

  • Received poor service at restaurants, hotels or other places of business (24%)
  • Been treated poorly by doctors, nurses or other health care professionals (21%)
  • Been treated unfairly by an employer in hiring, pay or promotion (19%).

Gay or lesbian and transgender adults are more likely than bisexual adults to say they have faced each of these experiences. For example, majorities of gay or lesbian adults (73%) and transgender adults (68%) say they have been subject to slurs or jokes, compared with 47% of bisexual adults.

Transgender adults are more likely than others to say they have feared for their personal safety and have been treated poorly by health care professionals. And they are especially likely to say that each of the following has happened to them in the 12 months prior to the survey:

  • Been subject to slurs or jokes (42% vs. 22% of gay or lesbian and 16% of bisexual adults)
  • Feared for their personal safety (44% vs. 12% and 8%)
  • Been treated poorly by health care professionals (20% vs. 5% and 4%)
  • Been treated unfairly by an employer (11% vs. 4% each).

These experiences don’t vary much based on whether LGBTQ adults live in urban, suburban or rural areas.

LGBTQ men are more likely than LGBTQ women to say they have faced certain forms of discrimination. But this largely reflects the fact that men are more likely to be gay while women are more likely to be bisexual, and bisexual adults are overall less likely to report experiencing discrimination. 

Navigating same-sex relationships in public spaces

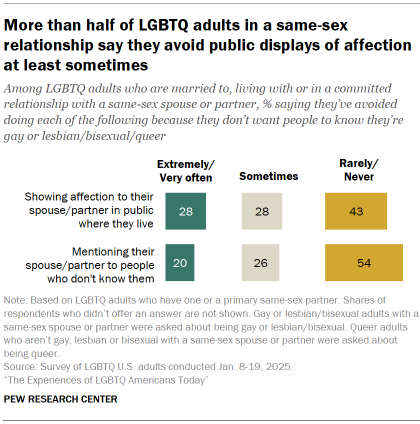
Chart shows More than half of LGBTQ adults in a same-sex relationship say they avoid public displays of affection at least sometimes

We asked LGBTQ adults who are in a same-sex relationship whether they avoid doing certain things in public because they don’t want people to know their sexual orientation.3

  • 57% say they avoid showing affection to their spouse or partner in public where they live at least sometimes. This includes 28% who say they do this extremely or very often.
  • 46% say they avoid mentioning their spouse or partner to people who don’t know them at least sometimes, with 20% saying they do this extremely or very often.

Those who live in urban, suburban and rural areas give similar answers on these questions.

3. Experiences with coming out as gay, lesbian, bisexual or transgender

To better understand the coming out experiences of gay, lesbian, bisexual and transgender adults, we asked them:

  • How old they were when they first felt they might be gay, lesbian, bisexual or trans, even if they didn’t use those words to describe themselves at the time.
  • How old they were when they first told someone that they were or might be gay, lesbian, bisexual or trans.
How we defined LGBTQ groups for analysis

Throughout this report, references to gay, lesbian and bisexual adults exclude those who are transgender. Transgender adults are of any sexual orientation (28% of trans adults we surveyed identify as gay or lesbian, 53% are bisexual, and 8% are straight).

Queer adults are included in the total and in the gay or lesbian, bisexual, and trans totals if they indicated they also identify with these terms. The number of queer respondents who do not identify as gay or lesbian, bisexual, or trans is too small to analyze separately.

Read Chapter 4 for more on the questions we asked related to sexual orientation and gender identity.

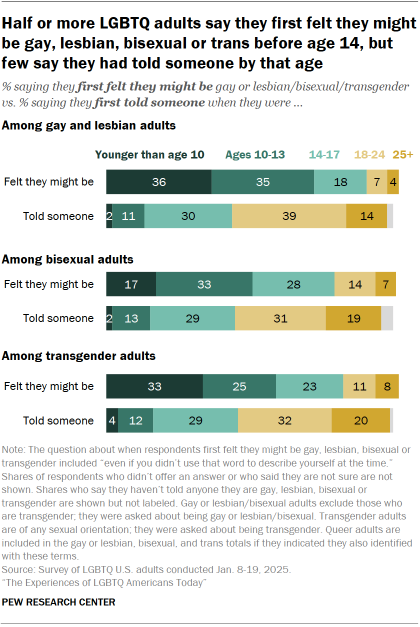
Chart shows Half or more LGBTQ adults say they first felt they might be gay, lesbian, bisexual or trans before age 14, but few say they had told someone by that age

Half or more in each group say they knew they were gay, lesbian, bisexual or trans before age 14. Far fewer say they first told someone by that age.

  • Gay and lesbian adults: 71% knew by age 14, while 13% had told someone by that age
  • Bisexual adults: 50% vs. 15%
  • Transgender adults: 58% vs. 16%

Small shares ranging from 1% to 4% across these groups say they haven’t told anyone they are gay, lesbian, bisexual or trans. 

These experiences vary by age and gender among gay, lesbian and bisexual adults. The number of transgender adults in the survey is too small to break out demographic groups.

Experiences by age

Gay or lesbian adults

Most gay or lesbian adults across age groups say they first felt they might be gay or lesbian before age 14.

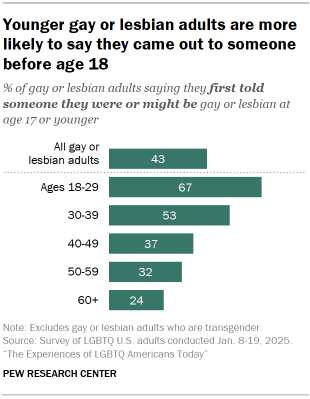
Chart shows Younger gay or lesbian adults are more likely to say they came out to someone before age 18

But younger gay or lesbian adults are far more likely than their older counterparts to say they first came out to someone at an early age.

Two-thirds of gay or lesbian adults ages 18 to 29 say they first told someone before they were 18, including 31% who say they first came out to someone at age 13 or younger.

By comparison, 53% of those in their 30s and fewer than half of those in their 40s (37%), 50s (32%) or ages 60 and older (24%) say they had told someone by the time they were 18. Few in these groups say they came out to someone when they were 13 or younger.

Bisexual adults

There are more pronounced age differences among bisexual adults on these questions.

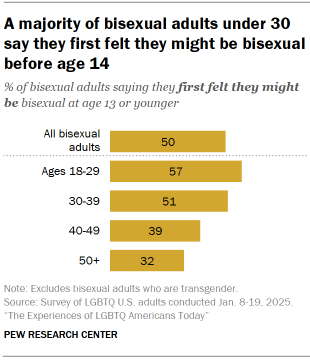
Chart shows A majority of bisexual adults under 30 say they first felt they might be bisexual before age 14

A majority of those ages 18 to 29 (57%) and 51% of those in their 30s say they first felt they might be bisexual at age 13 or younger. Smaller shares of those in their 40s (39%) or ages 50 and older (32%) say the same. (The two oldest age categories are combined for bisexual adults due to sample size limitations.)

Some 56% of bisexual adults ages 18 to 29 say they had told someone by the time they were 18. This compares with 42% of bisexual adults in their 30s, 32% of those in their 40s, and 17% of those ages 50 and older.

Experiences by gender

Gay or lesbian adults
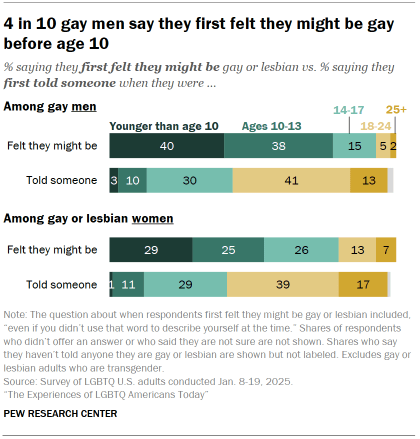
Chart shows 4 in 10 gay men say they first felt they might be gay before age 10

About eight-in-ten gay men (78%) say they first felt they might be gay at age 13 or earlier, including 40% who say they were first aware of their sexual orientation before age 10. Smaller shares of gay or lesbian women (53%) say they first felt they might be gay or lesbian at age 13 or younger, with 29% saying this happened before age 10.

Men and women give similar answers when asked at what age they first came out to someone. About four-in-ten each say this happened by age 18.

Bisexual adults
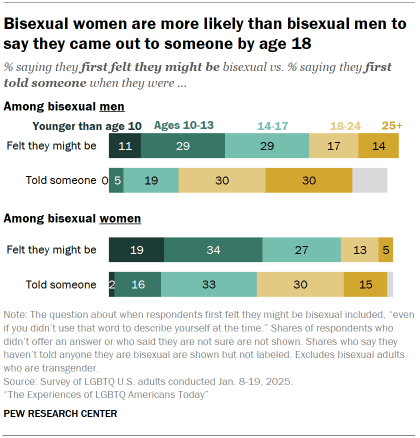
Chart shows Bisexual women are more likely than bisexual men to say they came out to someone by age 18

Among bisexual adults, women are more likely than men to say they first felt they might be bisexual at an early age:

  • 53% of bisexual women say this happened at age 13 or younger, with 19% saying they first felt they might be bisexual before age 10.
  • 39% of bisexual men say they first felt they might be bisexual before age 14, with 11% saying this happened before age 10.

Bisexual women (50%) are about twice as likely as bisexual men (24%) to say they had come out to someone by the time they turned 18. And 18% of bisexual women – compared with 5% of bisexual men – say this happened at age 13 or younger.

Roughly one-in-ten bisexual men (12%) say they haven’t told anyone about their sexual orientation. This is the case for only 2% of bisexual women.

Experiences of bisexual adults in a committed relationship

About nine-in-ten bisexual adults who are in a committed relationship, including those who are married or living with a partner, say their partner knows they are bisexual.4

Among those in a different-sex relationship (sometimes referred to as an opposite-sex relationship), women are more likely than men to say their partner knows they are bisexual (93% vs. 69%).

Overall, 87% of bisexual women in a committed relationship say their spouse or partner is a man. And 77% of partnered bisexual men are in a relationship with a woman. There aren’t enough bisexual adults in same-sex relationships in the sample to look at men and women separately.

4. LGBTQ identities

To better understand how LGBTQ adults identify, we asked respondents three separate questions:

  • If they are gay or lesbian, bisexual, straight or something else
  • If they are transgender
  • If they think of themselves as queer

When it comes to sexual orientation, more than half of LGBTQ adults (55%) describe themselves as bisexual. Four-in-ten are gay or lesbian, while small shares are straight (1%) or something else (3%).

About one-in-ten LGBTQ adults (9%) are transgender. This includes 4% who are nonbinary, 3% who are men, 1% who are women and 1% who describe their gender in some other way.

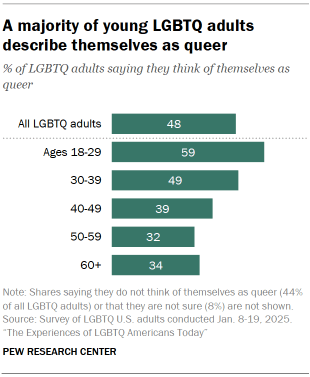
Chart shows majority of young LGBTQ adults describe themselves as queer

About half of all LGBTQ adults (48%) think of themselves as queer, while 44% do not (8% are not sure). Younger LGBTQ adults are particularly likely to identify as queer: 59% of those ages 18 to 29 think of themselves this way, compared with about half of those in their 30s and fewer than half in older age groups. 

Answers to these questions reveal that LGBTQ identities often overlap. For example, 80% of transgender adults are gay, lesbian or bisexual. And 82% of trans adults also think of themselves as queer.

For the remainder of this chapter, references to gay, lesbian and bisexual adults exclude those who are transgender. Transgender adults are of any sexual orientation. Queer adults are included in the total and in the gay or lesbian, bisexual, and trans totals if they indicated they also identify with these terms. The number of queer respondents who do not identify as gay or lesbian, bisexual, or trans is too small to analyze separately.

Importance of being LGBTQ to overall identity

About four-in-ten LGBTQ adults (42%) say being gay, lesbian, bisexual, transgender or queer is extremely or very important to who they are as a person. But there are differences across groups.

Two-thirds of trans adults say being transgender is highly important to who they are. A narrower majority of gay and lesbian adults (54%) say the same about being gay or lesbian. Fewer than half of bisexual adults (29%) see being bisexual as highly important to who they are.

Chart shows About 4 in 10 LGBTQ adults say their LGBTQ identity is extremely or very important to who they are

The shares saying their LGBTQ identity is extremely or very important to them do not vary considerably by age, income or education. But there are some differences by race and ethnicity.

Some 48% of Black LGBTQ adults and 47% of Hispanic LGBTQ adults say this part of their identity is highly important to who they are, compared with 39% of White LGBTQ adults. (The number of Asian LGBTQ adults in the sample is too small to analyze separately.)

There are also wide gaps by party: 46% of LGBTQ Democrats and Democratic leaners say this part of their identity is extremely or very important, compared with 25% of LGBTQ Republicans and Republican leaners. Half of Republicans – versus 23% of Democrats – say it’s not too or not at all important.

Gender expression among LGBTQ adults

Scholars have explored gender expression among LGBTQ adults in terms of how they describe their own masculinity and femininity, as well as how they think others perceive them.

We asked LGBTQ adults to rate themselves on two scales:

  • A masculinity scale from 0 to 4, where 4 means extremely masculine and 0 means not at all masculine.
  • A femininity scale from 0 to 4, where 4 means extremely feminine and 0 means not at all feminine.

We then subtracted ratings on the femininity scale from ratings on the masculinity scale to come up with an overall rating for each respondent. For example, if someone rated themselves a 4 on the masculinity scale and a 1 on the femininity scale, their overall rating would be 3. We combined the overall ratings into the following categories:

  • Highly masculine (4, 3)
  • Lean masculine (2, 1)
  • Equally masculine and feminine or neither masculine nor feminine (0)
  • Lean feminine (-1, -2)
  • Highly feminine (-3, -4)

We also asked these questions in a September 2024 survey of all U.S. adults focused on society’s views of men and masculinity.

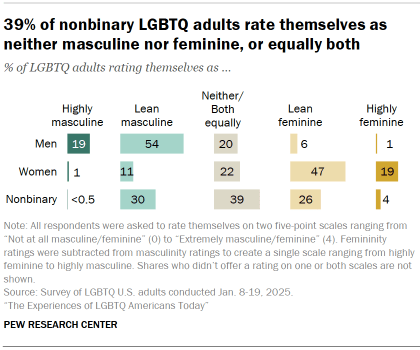
Overall, 19% of LGBTQ men see themselves as highly masculine; 54% say they lean masculine, 20% say they are neither or both equally, and 7% say they lean feminine or are highly feminine.

Among LGBTQ women, 19% say they are highly feminine, and 47% say they lean feminine. About one-in-five (22%) say they are neither or both equally, and 12% lean masculine or are highly masculine.

About four-in-ten nonbinary LGBTQ adults (39%) say that they are equally masculine and feminine or that they are neither. Similar shares place themselves on the masculine (31%) and feminine (30%) sides of the scale.

Chart shows 39% of nonbinary LGBTQ adults rate themselves as neither masculine nor feminine, or equally both

In the fall 2024 survey, 42% of all U.S. men rated themselves as highly masculine, while 35% of women saw themselves as highly feminine. (Because the number of nonbinary adults in the general public survey is too small to analyze, the question was only asked of men and women.)

Gay and bisexual men give themselves similar ratings on the scale. But among women, those who are bisexual are more likely than those who are gay or lesbian to see themselves as feminine.

  • 71% of bisexual women see themselves as feminine, including 19% who rate themselves as highly feminine.
  • 53% of gay or lesbian women see themselves as feminine, including 20% who rate themselves as highly feminine.

About a quarter of gay or lesbian women (23%) say they are highly masculine or lean masculine, compared with 8% of bisexual women.

There aren’t enough trans men and trans women in the sample to analyze separately.

Views by age

As is the case among U.S. men overall, younger LGBTQ men are less likely than older ones to see themselves as highly masculine. Some 12% of LGBTQ men younger than 50 rate themselves this way, compared with 30% of those ages 50 and older.

There are no differences by age in where LGBTQ women place themselves on the scale.

Views by party

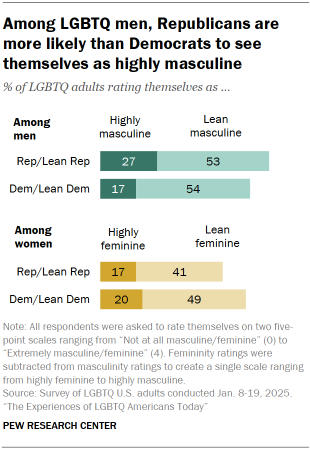
Chart shows Among LGBTQ men, Republicans are more likely than Democrats to see themselves as highly masculine

Republican LGBTQ men are more likely than their Democratic counterparts to rate themselves as highly masculine (27% vs. 17%). Among all U.S. men, 53% of Republicans say they are highly masculine, compared with 29% of Democratic men.

Democratic and Republican LGBTQ women are about equally likely to rate themselves as highly feminine (20% and 17%). But Democrats are more likely than Republicans to say they lean feminine (49% vs. 41%).

Another 18% of Republican LGBTQ women place themselves on the masculine side of the scale, compared with 10% of their Democratic counterparts.

How LGBTQ adults say other people would describe their gender expression

In addition to asking LGBTQ adults to rate themselves on masculinity and femininity scales, we asked them how they think other people would describe them based on their appearance, style or mannerisms.

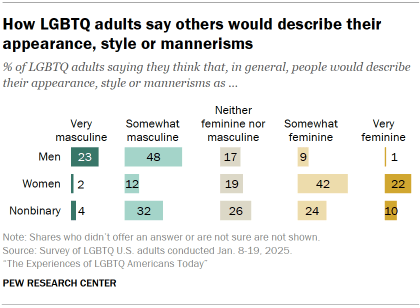
Chart shows How LGBTQ adults say others would describe their appearance, style or mannerisms

About seven-in-ten LGBTQ men (72%) say people would describe them as at least somewhat masculine, with 23% saying other people see them as very masculine.

Similarly, most LGBTQ women (64%) say people would describe them as at least somewhat feminine, with 22% saying others see them as very feminine.

These answers are largely consistent with how LGBTQ men and women describe their own gender expression.

Among nonbinary LGBTQ adults, 26% think other people would describe them as neither feminine nor masculine. About a third (34%) think people see them as at least somewhat feminine, and a similar share (36%) say others would describe them as at least somewhat masculine.

5. Community, friends and LGBTQ spaces

We asked LGBTQ Americans some questions to better understand:

  • How connected they feel to a broader LGBTQ community
  • How much they feel they have in common with people who are gay or lesbian, bisexual, transgender or straight
  • How many of their friends are LGBTQ
  • What LGBTQ people think of where they live
How we defined LGBTQ groups for analysis

Throughout this report, references to gay, lesbian and bisexual adults exclude those who are transgender. Transgender adults are of any sexual orientation (28% of trans adults we surveyed identify as gay or lesbian, 53% are bisexual, and 8% are straight).

Queer adults are included in the total and in the gay or lesbian, bisexual, and trans totals if they indicated they also identify with these terms. The number of queer respondents who do not identify as gay or lesbian, bisexual, or trans is too small to analyze separately.

Read Chapter 4 for more detail on the questions we asked related to sexual orientation and gender identity.

Connections to a broader LGBTQ community

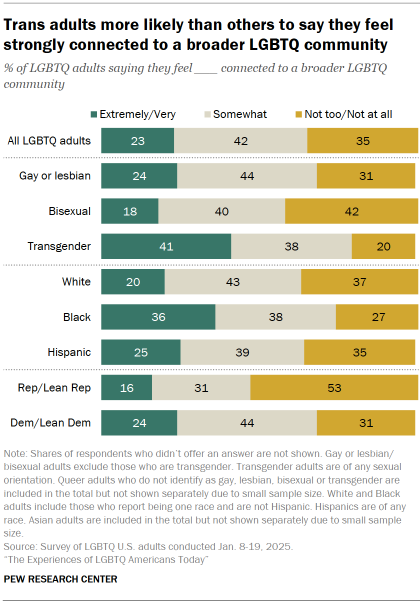
About a quarter of LGBTQ adults (23%) say they feel extremely or very connected to a broader LGBTQ community. Another 42% feel somewhat connected, and 35% feel not too or not at all connected.

Chart shows Trans adults more likely than others to say they feel strongly connected to a broader LGBTQ community

Views on this vary by:

  • LGBTQ group: 41% of transgender adults say they feel extremely or very connected, compared with 24% of gay or lesbian adults and 18% of bisexual adults. About four-in-ten bisexual adults (42%) say they feel not too or not at all connected, greater than the shares of gay or lesbian (31%) and transgender (20%) adults who say the same.
  • Race and ethnicity: 36% of Black LGBTQ adults say they feel extremely or very connected, compared with 25% of Hispanic LGBTQ adults and 20% of White LGBTQ adults. (The number of Asian LGBTQ adults in the sample is too small to analyze separately.)
  • Party: 24% of LGBTQ Democrats and Democratic leaners say they feel extremely or very connected, compared with 16% of LGBTQ Republicans and Republican leaners. In turn, Republicans are more likely than Democrats to say they feel not too or not at all connected to a broader LGBTQ community (53% vs. 31%).

How much do LGBTQ adults think they have in common with certain groups?

We asked LGBTQ adults how much they think they have in common with most people who are:

  • Gay or lesbian
  • Bisexual
  • Transgender
  • Straight

Perhaps unsurprisingly, large shares of gay or lesbian (77%), bisexual (71%) and transgender (74%) adults say they have a great deal or a fair amount in common with most others in their own group.

But views are more mixed when each is asked about other groups.

Gay or lesbian adults

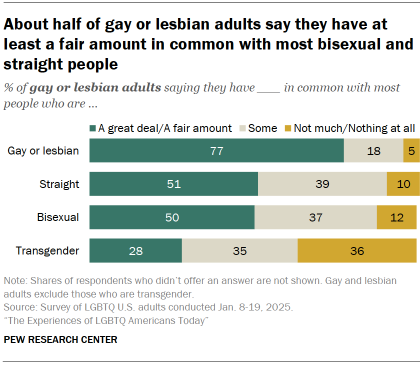
Chart shows About half of gay or lesbian adults say they have at least a fair amount in common with most bisexual and straight people

Half of gay or lesbian adults say they have at least a fair amount in common with people who are bisexual (50%). A similar share (51%) say they have a lot in common with people who are straight.

Fewer (28%) say they have a lot in common with people who are transgender.

These figures are based on gay and lesbian adults who are not transgender.

Bisexual adults

Chart shows Most trans adults – many of whom are gay, lesbian or bisexual themselves – say they have a lot in common with other people in these groups

A majority of bisexual adults (61%) say they have a great deal or a fair amount in common with most people who are straight.

A smaller majority (55%) say they have at least a fair amount in common with gay or lesbian adults. And just 25% say the same about people who are transgender.

These figures are based on bisexual adults who are not transgender.

Transgender adults

Chart shows Most transgender adults say all or most of their friends are LGBTQ

Majorities of transgender adults say they have a great deal or a fair amount in common with people who are gay or lesbian (63%) and people who are bisexual (63%).

A far smaller share of trans adults (27%) say they have a lot in common with most people who are straight.

It is important to note that transgender adults in our survey include those of any sexual orientation: 28% of trans adults also identify as gay or lesbian, 53% are bisexual, and 8% are straight.

LGBTQ friendships

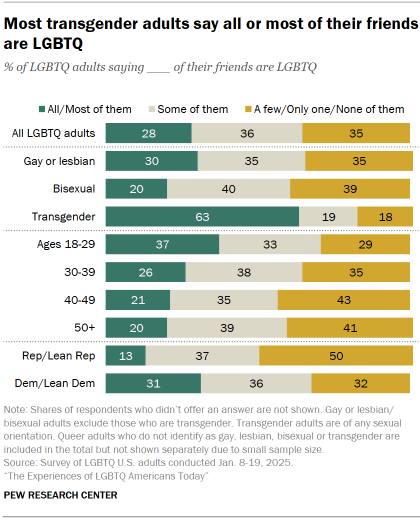
Roughly three-in-ten LGBTQ adults (28%) say all or most of their friends are LGBTQ.

Chart shows Most transgender adults say all or most of their friends are LGBTQ

Another 36% say that some of their friends are LGBTQ. And 35% say only a few, only one or none of their friends are.

This varies by several factors:

  • LGBTQ group: 63% of transgender adults say all or most of their friends are LGBTQ. This is far greater than shares of gay or lesbian (30%) and bisexual (20%) adults who say the same.
  • Age: LGBTQ adults younger than 30 are more likely than their older counterparts to say all or most of their friends are LGBTQ (37% vs. 23% of those ages 30 and older).
  • Party: LGBTQ Democrats are more likely than their Republican counterparts to say all or most of their friends are LGBTQ (31% vs. 13%). In fact, half of LGBTQ Republicans say only a few, only one or none of their friends are.

How LGBTQ adults describe where they live and what is important to them in a local community

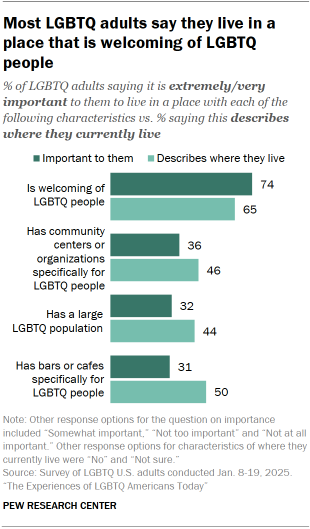
About three-quarters of LGBTQ adults (74%) say it is extremely or very important to them personally to live somewhere that is welcoming of LGBTQ people (regardless of whether this describes where they currently live). Smaller shares say the same about living in a place that:

Chart shows Most LGBTQ adults say they live in a place that is welcoming of LGBTQ people
  • Has community centers or organizations that are specifically for LGBTQ people (36% see this as highly important)
  • Has a large LGBTQ population (32%)
  • Has bars or cafes that are specifically for LGBTQ people (31%)

Except for living in a place that is welcoming of LGBTQ people, more say each of these characteristics describes where they currently live than say they are highly important to them personally.

Overall, 65% say their local community is welcoming of people who are LGBTQ. And half say there are bars or cafes specifically for LGBTQ people.  

Similar shares say their area has community centers or organizations specifically for LGBTQ people (46%) and has a large LGBTQ population (44%).

Views by LGBTQ group

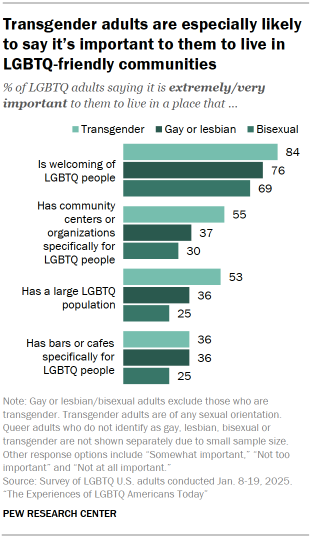
Transgender adults are more likely than gay, lesbian or bisexual adults to say living in a place with most of these qualities is extremely or very important to them. When it comes to living in a place with LGBTQ bars or cafes, transgender adults are as likely as gay or lesbian adults to say this is important to them.

Chart shows Transgender adults are especially likely to say it’s important to them to live in LGBTQ-friendly communities

Meanwhile, bisexual adults are less likely than others to say that it’s important to them to live somewhere with these characteristics.

Similar shares of gay or lesbian (55%) and transgender (53%) adults say they live somewhere with community centers or organizations specifically for LGBTQ people.

And gay or lesbian adults are especially likely to say they live in a place that:

  • Is welcoming of LGBTQ people (73% of gay or lesbian adults, compared with 62% of bisexual adults and 58% of transgender adults)
  • Has bars or cafes specifically for LGBTQ people (58% vs. 45% each)

Bisexual adults (41%) are less likely than gay or lesbian adults (49%) to say they live somewhere that has a large LGBTQ population. Some 44% of transgender adults say the same.

Views by community type

LGBTQ adults who live in rural areas are far less likely that those in urban and suburban areas to say most of these characteristics are highly important to them and that they describe where they currently live.

Across community types, majorities say it’s extremely or very important to them to live in a place that is welcoming of LGBTQ people. In suburban and rural communities, more say this quality is highly important to them than say it describes where they currently live.

  • Suburban areas: 75% say this is extremely or very important, while 65% say it describes where they live
  • Rural areas: 61% vs. 45%

Among those in urban areas, the shares saying this is important to them (79%) are similar to the shares saying it describes where they live (77%).

LGBTQ adults in urban areas are more likely than those in the suburbs or in rural areas to say each of the characteristics we asked about describes where they live. And those in suburban areas are more likely than those in rural communities to say this.

Acknowledgments

The Pew Research Center is a subsidiary of The Pew Charitable Trusts, its primary funder. This report was made possible with support from the Trusts and from the People & Voices Initiative.  

This report is a collaborative effort based on the input and analysis of the following individuals. Find related reports online at pewresearch.org/topic/gender-lgbtq.

Kim Parker, Director of Social Trends Research
Juliana Horowitz, Senior Associate Director, Research       
Rachel Minkin, Research Associate
Luona Lin, Research Associate
Kiley Hurst, Research Analyst             
Dana Braga, Research Analyst
Isabel Goddard, Former Research Associate
John Carlo Mandapat, Information Graphics Designer                                           
Anna Jackson, Editorial Assistant
Julia O’Hanlon, Communications Manager
Andrew Grant, Communications Associate

In addition, the project benefited greatly from the guidance of the Pew Research Center methodology team: Courtney Kennedy, Andrew Mercer, Ashley Amaya, Dorene Asare-Marfo, Dana Popky, Anna Brown, Arnold Lau and Thomas May.

Editorial guidance was provided by Rachel Drian, Associate Director, Communications; and Neha Sahgal, Vice President, Research. We received important input on the questionnaire and report from colleagues Gabe Borelli, Anna Brown, Alexandra Cahn, Claire Dannenbaum, Naomi Forman-Katz, Shannon Greenwood, Anna Lieb, Eugenie Park, Jacob Poushter and Kaitlyn Radde.

Finally, we received invaluable advice in developing the study from Jaimie Kelton, host and producer of The Queer Family Podcast; Abbie Goldberg, Jan and Larry Landry University Professor, Clark University; Brad Sears, Rand Schrader Distinguished Scholar of Law and Policy, Williams Institute; Christy Mallory, Roberta A. Conroy Interim Executive Director and Legal Director, Williams Institute; Naomi Goldberg, Executive Director, Movement Advancement Project; and Lisa Diamond, Distinguished Professor of Psychology and Gender Studies, University of Utah.

Methodology

The American Trends Panel survey methodology

Overview

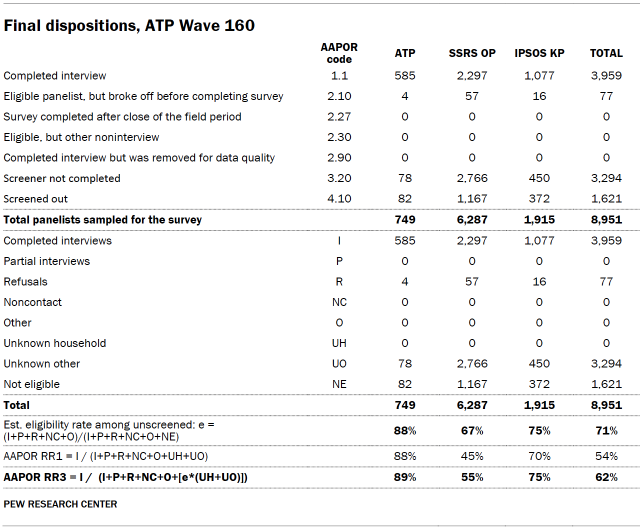
Data in this report comes from Wave 160 of the American Trends Panel (ATP), Pew Research Center’s nationally representative panel of randomly selected U.S. adults. The survey was conducted Jan. 8-19, 2025, among a sample of lesbian, gay, bisexual, transgender and queer (LGBTQ) U.S. adults. A total of 3,959 eligible, LGBTQ adults responded out of 8,951 who were sampled, for a survey-level response rate of 62% (AAPOR RR3).5 This includes 585 respondents from the ATP, 2,297 from the SSRS Opinion Panel (OP) and 1,077 from the Ipsos Knowledge Panel (KP).

The cumulative response rate accounting for nonresponse to the recruitment surveys and attrition is 1%. The break-off rate among eligible panelists who logged on to the survey and completed at least one item is 2%. The margin of sampling error for the full sample of 3,959 respondents is plus or minus 2.2 percentage points.

SSRS and Ipsos conducted the surveys for Pew Research Center. SSRS conducted the ATP and OP surveys via online (n=2,821) and live telephone (n=62) interviewing. Ipsos conducted the KP survey online only. Interviews were conducted in both English and Spanish.

To learn more about the ATP, read “About the American Trends Panel.”6

Panel recruitment

Since 2018, the ATP has used address-based sampling (ABS) for recruitment. A study cover letter and a pre-incentive are mailed to a stratified, random sample of households selected from the U.S. Postal Service’s Computerized Delivery Sequence File. This Postal Service file has been estimated to cover 90% to 98% of the population.7 Within each sampled household, the adult with the next birthday is selected to participate. Other details of the ABS recruitment protocol have changed over time but are available upon request.8 Prior to 2018, the ATP was recruited using landline and cellphone random-digit-dial surveys administered in English and Spanish.

A national sample of U.S. adults has been recruited to the ATP approximately once per year since 2014. In some years, the recruitment has included additional efforts (known as an “oversample”) to improve the accuracy of data for underrepresented groups. For example, Hispanic adults, Black adults and Asian adults were oversampled in 2019, 2022 and 2023, respectively.

Sample design

The overall target population for this survey is noninstitutionalized persons ages 18 and older living in the United States who describe themselves as lesbian, gay, bisexual, transgender or queer. All active ATP members who had previously indicated that they were gay, lesbian, bisexual or transgender were invited to participate in this wave.

The ATP was supplemented with samples from SSRS’ Opinion Panel (OP) and Ipsos’ Knowledge Panel (KP). For the OP sample, all active panel members who previously described themselves as any of the following were invited to participate: asexual, bisexual, gay or lesbian, intersex, nonbinary, pansexual, queer, same gender loving, transgender or two-spirit. For the KP sample, all panel members who had previously indicated that they were gay, lesbian or bisexual and married or living with a partner or previously indicated that they were transgender, nonbinary or that their sex assigned at birth on their original birth certificate differed from their current gender identity were invited to participate.

At the start of the survey, potentially eligible respondents were asked a series of screening questions to confirm their eligibility to complete the survey. For the ATP and OP samples, respondents were considered eligible if they indicated they were lesbian, gay, bisexual, transgender or queer. Respondents from the KP sample were considered eligible if they indicated that they were married or living with a partner and lesbian, gay or bisexual, or that they were transgender (regardless of marital status).

Questionnaire development and testing

The questionnaire was developed by Pew Research Center in consultation with SSRS and Ipsos. The web program used for online respondents was rigorously tested on both PC and mobile devices by the SSRS and Ipsos project teams and Pew Research Center researchers. The SSRS and Ipsos project teams also populated test data that was analyzed in SPSS to ensure the logic and randomizations were working as intended before launching the survey.

For several questions, respondents were asked specifically about being gay or lesbian, bisexual, queer or transgender. Due to sample size limitations and concerns about survey length, transgender respondents who also indicated they are gay, lesbian, bisexual and/or queer were only asked questions about being transgender.

Incentives

All respondents were offered a post-paid incentive for their participation. ATP and OP respondents may receive the post-paid incentive in the form of a check or gift code to online merchants such as Amazon.com, Target.com or Walmart.com.  Incentive amounts ranged from $5 to $20 for ATP respondents, and $5 to $10 for OP respondents, depending on whether the respondent belongs to a part of the population that is harder or easier to reach. Differential incentive amounts were designed to increase panel survey participation among groups that traditionally have low survey response propensities.

Ipsos operates an ongoing modest incentive program for KnowledgePanel to encourage participation and create member loyalty. The incentive program includes special raffles and sweepstakes with both cash rewards and other prizes to be won. Typically, panel members are assigned no more than one survey per week. On average, panel members complete two to three surveys per month with durations of 10 to 15 minutes per survey. An additional incentive is usually provided for longer surveys.

Data collection protocol

The data collection field period for this survey was Jan. 8 to Jan. 19, 2025. Surveys were conducted via self-administered web survey or by live telephone interviewing. 

For panelists who take surveys online:9 Postcard notifications were mailed to a subset of ATP panelists on Jan. 8.10 Survey invitations were sent out in two separate launches: soft launch and full launch. 902 panelists were included in the soft launch (60 from ATP, 593 from OP and, 249 from KP), which began with an initial invitation sent on Jan. 8. All remaining English- and Spanish-speaking sampled online panelists were included in the full launch and were sent an invitation on Jan. 9.

Table shows Invitation and reminder dates for web respondents, ATP Wave 160

Panelists participating online were sent an email invitation and up to four email reminders if they did not respond to the survey. ATP panelists who consented to SMS messages were sent an SMS invitation with a link to the survey and up to four SMS reminders.

For panelists who take surveys over the phone with a live interviewer: Prenotification postcards were mailed to ATP panelists on Jan. 3. Soft launch took place on Jan. 8 and involved dialing until a total of 11 interviews had been completed. All remaining English- and Spanish-speaking sampled phone panelists’ numbers were dialed throughout the remaining field period. Panelists who take surveys via phone can receive up to six calls from trained SSRS interviewers.

Data quality checks

To ensure high-quality data, Center researchers performed data quality checks to identify any respondents showing patterns of satisficing. This includes checking for whether respondents left questions blank at very high rates or always selected the first or last answer presented. As a result of this checking, no respondents were removed from the survey dataset prior to weighting and analysis.

Weighting

The survey was weighted in a process that accounts for multiple stages of sampling and nonresponse that occur at different points in the panel survey process. First, each panelist begins with a base weight that reflects their probability of recruitment into the panel. Base weights for OP and KP respondents were provided by SSRS and Ipsos respectively. Respondents from each sample were assigned to one of three sample groups and their base weights were combined and scaled to account for the sample design:

  1. Transgender
  2. Not transgender, and married or living with a partner and lesbian, gay or bisexual
  3. All other lesbian, gay, bisexual or queer

The combined base weights were calibrated to align with the following estimated benchmarks for the population of U.S. LGBTQ adults: Sample group, lesbian/gay/bisexual status, gender, marital status, age, education, race/ethnicity, years living in the U.S. (among foreign born), volunteerism, voter registration, frequency of internet use, religious affiliation, party affiliation, census region and metropolitan status.

Because there are no official benchmarks for this population, weighting parameters were estimated using the eligible respondents to W160 from the ATP sample. First, all ATP respondents who completed the screening questions were weighted to match the full set of ATP members who were sampled on the following dimensions: age, gender, education, race/ethnicity, years living in the U.S. (among foreign-born), volunteerism, voter registration, frequency of internet use, religious affiliation, party affiliation, census region and metropolitan status. These weights were then used to calculate weighting parameters based on ATP respondents to W160 who were screened as eligible. 

In a final step, the weights were trimmed at the 1st and 99th percentiles to reduce the loss in precision stemming from variance in the weights. Sampling errors and tests of statistical significance take into account the effect of weighting.

The following table shows the unweighted sample sizes and the error attributable to sampling that would be expected at the 95% level of confidence for different groups in the survey.

Table shows Sample sizes and margins of error, ATP Wave 160

Sample sizes and sampling errors for other subgroups are available upon request. In addition to sampling error, one should bear in mind that question wording and practical difficulties in conducting surveys can introduce error or bias into the findings of opinion polls.

Dispositions and response rates

Table shows Final dispositions, ATP Wave 160
Table shows Cumulative response rate, ATP Wave 160

© Pew Research Center 2025