We asked LGBTQ Americans some questions to better understand:
- How connected they feel to a broader LGBTQ community
- How much they feel they have in common with people who are gay or lesbian, bisexual, transgender or straight
- How many of their friends are LGBTQ
- What LGBTQ people think of where they live
Connections to a broader LGBTQ community
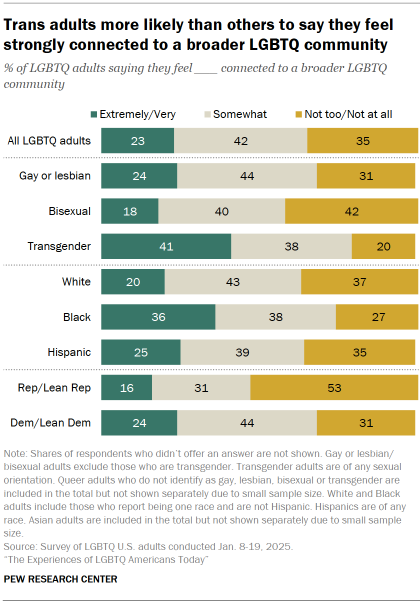
About a quarter of LGBTQ adults (23%) say they feel extremely or very connected to a broader LGBTQ community. Another 42% feel somewhat connected, and 35% feel not too or not at all connected.
Views on this vary by:
- LGBTQ group: 41% of transgender adults say they feel extremely or very connected, compared with 24% of gay or lesbian adults and 18% of bisexual adults. About four-in-ten bisexual adults (42%) say they feel not too or not at all connected, greater than the shares of gay or lesbian (31%) and transgender (20%) adults who say the same.
- Race and ethnicity: 36% of Black LGBTQ adults say they feel extremely or very connected, compared with 25% of Hispanic LGBTQ adults and 20% of White LGBTQ adults. (The number of Asian LGBTQ adults in the sample is too small to analyze separately.)
- Party: 24% of LGBTQ Democrats and Democratic leaners say they feel extremely or very connected, compared with 16% of LGBTQ Republicans and Republican leaners. In turn, Republicans are more likely than Democrats to say they feel not too or not at all connected to a broader LGBTQ community (53% vs. 31%).
How much do LGBTQ adults think they have in common with certain groups?
We asked LGBTQ adults how much they think they have in common with most people who are:
- Gay or lesbian
- Bisexual
- Transgender
- Straight
Perhaps unsurprisingly, large shares of gay or lesbian (77%), bisexual (71%) and transgender (74%) adults say they have a great deal or a fair amount in common with most others in their own group.
But views are more mixed when each is asked about other groups.
Gay or lesbian adults
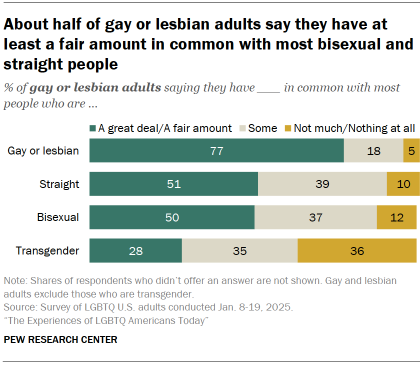
Half of gay or lesbian adults say they have at least a fair amount in common with people who are bisexual (50%). A similar share (51%) say they have a lot in common with people who are straight.
Fewer (28%) say they have a lot in common with people who are transgender.
These figures are based on gay and lesbian adults who are not transgender.
Bisexual adults

A majority of bisexual adults (61%) say they have a great deal or a fair amount in common with most people who are straight.
A smaller majority (55%) say they have at least a fair amount in common with gay or lesbian adults. And just 25% say the same about people who are transgender.
These figures are based on bisexual adults who are not transgender.
Transgender adults

Majorities of transgender adults say they have a great deal or a fair amount in common with people who are gay or lesbian (63%) and people who are bisexual (63%).
A far smaller share of trans adults (27%) say they have a lot in common with most people who are straight.
It is important to note that transgender adults in our survey include those of any sexual orientation: 28% of trans adults also identify as gay or lesbian, 53% are bisexual, and 8% are straight.
LGBTQ friendships
Roughly three-in-ten LGBTQ adults (28%) say all or most of their friends are LGBTQ.
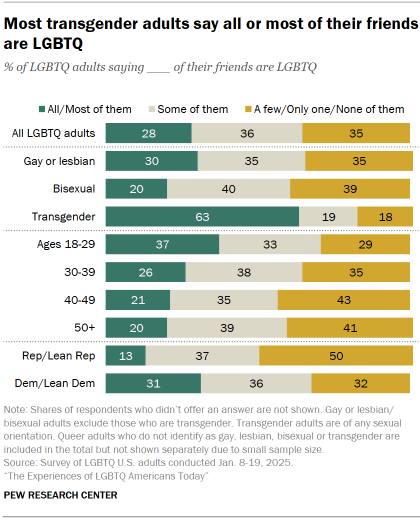
Another 36% say that some of their friends are LGBTQ. And 35% say only a few, only one or none of their friends are.
This varies by several factors:
- LGBTQ group: 63% of transgender adults say all or most of their friends are LGBTQ. This is far greater than shares of gay or lesbian (30%) and bisexual (20%) adults who say the same.
- Age: LGBTQ adults younger than 30 are more likely than their older counterparts to say all or most of their friends are LGBTQ (37% vs. 23% of those ages 30 and older).
- Party: LGBTQ Democrats are more likely than their Republican counterparts to say all or most of their friends are LGBTQ (31% vs. 13%). In fact, half of LGBTQ Republicans say only a few, only one or none of their friends are.
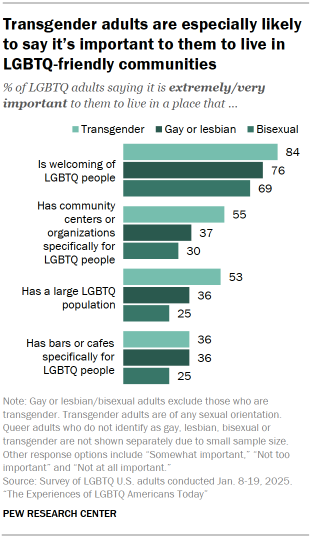
How LGBTQ adults describe where they live and what is important to them in a local community
About three-quarters of LGBTQ adults (74%) say it is extremely or very important to them personally to live somewhere that is welcoming of LGBTQ people (regardless of whether this describes where they currently live). Smaller shares say the same about living in a place that:
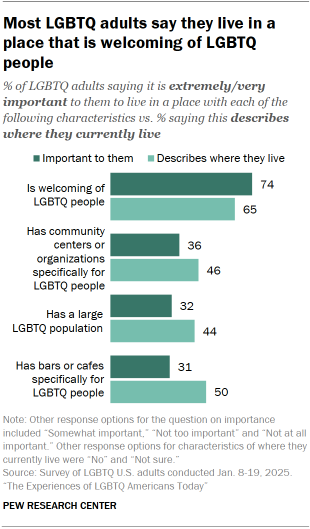
- Has community centers or organizations that are specifically for LGBTQ people (36% see this as highly important)
- Has a large LGBTQ population (32%)
- Has bars or cafes that are specifically for LGBTQ people (31%)
Except for living in a place that is welcoming of LGBTQ people, more say each of these characteristics describes where they currently live than say they are highly important to them personally.
Overall, 65% say their local community is welcoming of people who are LGBTQ. And half say there are bars or cafes specifically for LGBTQ people.
Similar shares say their area has community centers or organizations specifically for LGBTQ people (46%) and has a large LGBTQ population (44%).
Views by LGBTQ group
Transgender adults are more likely than gay, lesbian or bisexual adults to say living in a place with most of these qualities is extremely or very important to them. When it comes to living in a place with LGBTQ bars or cafes, transgender adults are as likely as gay or lesbian adults to say this is important to them.
Meanwhile, bisexual adults are less likely than others to say that it’s important to them to live somewhere with these characteristics.
Similar shares of gay or lesbian (55%) and transgender (53%) adults say they live somewhere with community centers or organizations specifically for LGBTQ people.
And gay or lesbian adults are especially likely to say they live in a place that:
- Is welcoming of LGBTQ people (73% of gay or lesbian adults, compared with 62% of bisexual adults and 58% of transgender adults)
- Has bars or cafes specifically for LGBTQ people (58% vs. 45% each)
Bisexual adults (41%) are less likely than gay or lesbian adults (49%) to say they live somewhere that has a large LGBTQ population. Some 44% of transgender adults say the same.
Views by community type
LGBTQ adults who live in rural areas are far less likely that those in urban and suburban areas to say most of these characteristics are highly important to them and that they describe where they currently live.
Across community types, majorities say it’s extremely or very important to them to live in a place that is welcoming of LGBTQ people. In suburban and rural communities, more say this quality is highly important to them than say it describes where they currently live.
- Suburban areas: 75% say this is extremely or very important, while 65% say it describes where they live
- Rural areas: 61% vs. 45%
Among those in urban areas, the shares saying this is important to them (79%) are similar to the shares saying it describes where they live (77%).
LGBTQ adults in urban areas are more likely than those in the suburbs or in rural areas to say each of the characteristics we asked about describes where they live. And those in suburban areas are more likely than those in rural communities to say this.


