Pew Research Center

FOR RELEASE MARCH 13, 2025

The Gender Gap in Teen Experiences

Teen girls and boys in the U.S. face different pressures and have different experiences at school but want the same things out of life

BY Kim Parker and Kiley Hurst

FOR MEDIA OR OTHER INQUIRIES:

Communications Department
202.419.4372
www.pewresearch.org

RECOMMENDED CITATION

Pew Research Center, March 2025, "The Gender Gap in Teen Experiences"

About Pew Research Center

Pew Research Center is a nonpartisan, nonadvocacy fact tank that informs the public about the issues, attitudes and trends shaping the world. It does not take policy positions. The Center conducts public opinion polling, demographic research, computational social science research and other data-driven research. It studies politics and policy; news habits and media; the internet and technology; religion; race and ethnicity; international affairs; social, demographic and economic trends; science; research methodology and data science; and immigration and migration. Pew Research Center is a subsidiary of The Pew Charitable Trusts, its primary funder.

© Pew Research Center 2026

Table of contents

  • About Pew Research Center
  • The Gender Gap in Teen Experiences
  • 1. Problems teens see in their schools
  • 2. Pressures teens are facing
  • 3. Teens’ friendships and emotional support networks
  • 4. Teens’ future plans and goals
  • Acknowledgments
  • Methodology

The Gender Gap in Teen Experiences

Teen girls and boys in the U.S. face different pressures and have different experiences at school but want the same things out of life

How we did this

Pew Research Center conducted this study to better understand teens’ views on their school experiences, friendships and future plans.

The Center conducted an online survey of 1,391 U.S. teens ages 13 to 17 from Sept. 18 to Oct. 10, 2024, through Ipsos. Ipsos recruited the teens via their parents, who were part of its KnowledgePanel. The KnowledgePanel is a probability-based web panel recruited primarily through national, random sampling of residential addresses. The survey was weighted to be representative of U.S. teens ages 13 to 17 who live with their parents by age, gender, race and ethnicity, household income, and other categories.

Questions in this report that focus on students’ experiences in their school were not asked of the 91 students who said they are homeschooled.

Here are the questions used for this report, along with responses, and the survey methodology­­­.

This research was reviewed and approved by an external institutional review board (IRB), Advarra, an independent committee of experts specializing in helping to protect the rights of research participants.

Terminology

References to White and Black teens include those who identify as only one race and are not Hispanic. Hispanic teens are of any race. The views and experiences of Asian teens are not analyzed separately in this report due to sample limitations. Asian teens’ responses – and responses of teens from other racial and ethnic groups – are incorporated into the general figures throughout the report but are not analyzed separately due to sample limitations.

All references to party affiliation include those who lean toward that party. Republicans include those who identify as Republicans and those who say they lean toward the Republican Party. Democrats include those who identify as Democrats and those who say they lean toward the Democratic Party.

American teens face a host of challenges these days – both inside and outside the classroom. A new Pew Research Center survey of U.S. teens ages 13 to 17 finds that, while there is some common ground, many of the problems and pressure points teens are dealing with differ significantly for boys and girls. In addition, many teens see imbalances in how boys and girls are experiencing school and how they’re performing academically.

Anxiety and depression tops the list of problems teens say their peers at school are dealing with, of the issues we asked about. Three-in-ten teens say it’s extremely or very common among their fellow students. And on balance, teens say anxiety and depression is more common among girls at their school than among boys. At the same time, majorities of teen boys and girls alike say girls have it easier when it comes to having friends they can turn to for emotional support.1
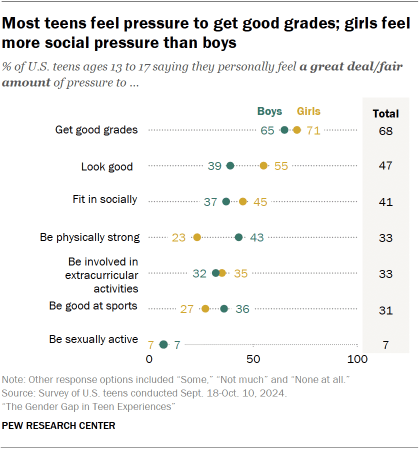
Chart shows Most teens feel pressure to get good grades; girls feel
more social pressure than boys

Academics are the biggest source of pressure for teens today. Roughly seven-in-ten (68%) say they personally feel a great deal or fair amount of pressure to get good grades. Girls and boys are about equally likely to say this (71% vs. 65%).

Girls are significantly more likely than boys to say they face at least a fair amount of pressure to:

  • Look good (55% vs. 39%)
  • Fit in socially (45% vs. 37%)

Greater shares of boys than girls say they face pressure to:

  • Be physically strong (43% vs. 23%)
  • Be good at sports (36% vs. 27%)

Teens’ plans for the future
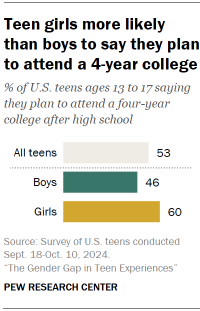
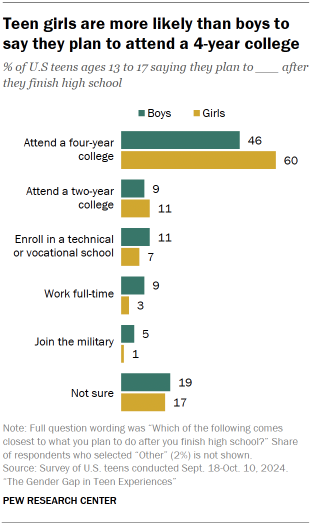
Chart shows Teen girls more likely than boys to say they plan to attend a 4-year college

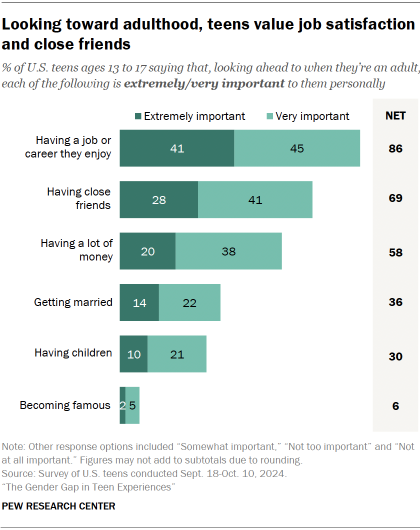
Looking ahead, boys and girls want many of the same things out of life. Majorities of teens say it’s extremely or very important to them that as adults they have a job or career they enjoy (86%), have close friends (69%) and have a lot of money (58%).

But they may take different paths to get there. Teen girls are significantly more likely than teen boys to say they plan to attend a four-year college after they graduate from high school (60% vs. 46%).
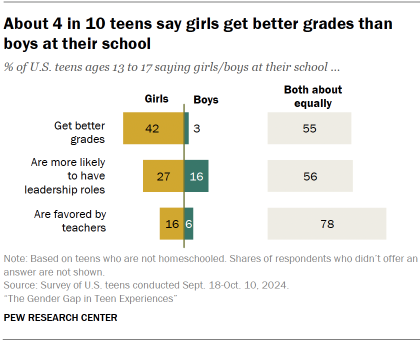
Chart shows About 4 in 10 teens say girls get better grades than boys at their school

In turn, boys are more likely than girls to say they’ll go to a vocational school (11% vs. 7%), work full time (9% vs. 3%) or join the military (5% vs. 1%) after high school.

This survey – conducted Sept. 18-Oct. 10, 2024, among 1,391 teens ages 13 to 17 – focused on school experiences, friendships and future plans.

Other key findings

Chart shows Majority of teens say girls have it easier when it comes to having friends for emotional support
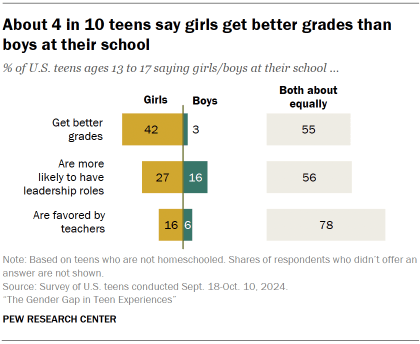
  • 42% of teens say girls at their school get better grades than boys. Only 3% say boys get better grades than girls, and 55% say things are about equal. Additionally, about one-in-four teens (27%) say girls at their school get more leadership positions than boys, while 16% say boys get more of these positions; 56% say there’s no differences.
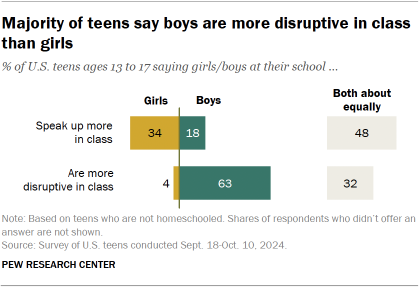
  • 63% of teens say boys are more disruptive in class than girls. Only 4% say girls are more disruptive, and 32% say there’s no difference. Inversely, teens are more likely to say girls speak up more in class than to say the same about boys (34% vs. 18%). Roughly half (48%) say there’s no difference.
  • Almost all teens (98%) say they have at least one close friend, with 34% saying they have five or more. Boys and girls are equally likely to say they have at least one close friend. We also asked whether they think one group has it easier when it comes to having friends they can turn to for emotional support: A 58% majority of teens say girls do. Very few say boys have an easier time (7%), and 35% say it’s about the same for both.
  • Thinking ahead to their adult lives, teens place less importance on getting married or having children than they do on job satisfaction, friendship and financial success. Republican teens and those who lean to the Republican Party are more likely than Democrats and Democratic leaners to say marriage and parenthood are important to them.

1. Problems teens see in their schools

We asked U.S. teens how common a variety of problems are among students at their school.

Chart shows 3 in 10 teens say anxiety and depression is highly common among their peers at school

Anxiety and depression tops the list, with 30% of teens saying it’s extremely or very common at their school.

About one-in-five teens (22%) say bullying is extremely or very common at their school. A similar share (19%) say the same about drug use.

Some 17% of students say physical fights are highly common at their school, and 14% say alcohol use is highly common.

Girls are more likely than boys to say anxiety and depression is extremely or very common at their school (35% vs. 24%). Girls are also more likely to say the same about alcohol use (17% vs. 10%). Girls and boys are about equally likely to say the other items are common at their school.

Are problems in school more common among boys or girls?

We asked teens who say these issues are at least somewhat common at their school whether each is more common among boys or girls.

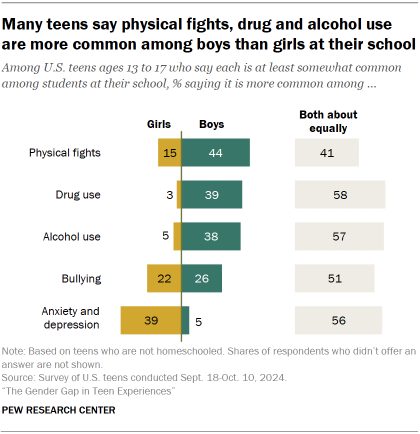
With the exception of physical fights, about half or more of these teens say the issues are equally common among boys and girls. Still, among those who see a gender difference, the scale more often tips toward boys.

More common among boys

Chart shows Many teens say physical fights, drug and alcohol use are more common among boys than girls at their school
  • Among teens who say physical fights are at least somewhat common at their school, 44% say these are more common among boys. Another 15% say fights are more common among girls, and 41% say there’s not much difference.
  • Among those who say drug use is common at their school, 39% say it’s more common among boys, while only 3% say it’s more common among girls; 58% say there isn’t much difference. The pattern is almost identical when it comes to perceptions of alcohol use.

More common among girls

  • 39% of teens who say anxiety and depression is common at their school say it’s more common among girls. Only 5% say it’s more common among boys, and 56% say it affects both about equally. Girls are more likely than boys to say these mental health challenges are more common for girls at their school (50% vs. 28%). For their part, boys are more likely than girls to say that it’s about equal (64% vs. 49%).

Mixed views

  • Teens who say bullying is common at their school are divided on whether it’s more common among boys or girls. About one-in-four (26%) say it’s more common among boys, 22% say girls and 51% say both about equally. Boys themselves lean toward the perception that bullying is more prevalent among boys, while girls are split in their views.

Do teens see gender biases in their schools?

Some of the current discussion about how men are doing in the U.S. today relative to women focuses on gender gaps in K-12 education. To explore this topic from a teen perspective, we asked teens whether they think boys or girls are doing better in school and whether they receive different treatment.

In three key areas – grades, leadership opportunities and treatment by teachers – majorities of teens say things are about equal. But those who do see a gender difference tend to think girls have advantages over boys.

Chart shows About 4 in 10 teens say girls get better grades than boys at their school
  • Grades: 42% of teens say girls get better grades than boys at their school. Only 3% say boys get better grades than girls; 55% say things are about equal. Girls are more likely than boys to say girls get better grades at their school (47% vs. 36%), while a higher share of boys than girls say there’s no difference (59% vs 52%).
  • Leadership roles: 27% of teens say girls are more likely than boys to have leadership roles at their school; 16% say boys are more likely to have these roles. A 56% majority say boys and girls are about equally likely to have leadership roles. Girls and boys are largely in agreement about this.
  • Teacher favoritism: A large majority of teens (78%) say teachers treat girls and boys about equally at their school. Among the rest, 16% say teachers favor girls and 6% say they favor boys. Boys are especially likely to say teachers favor girls (23% say this, compared with 9% of girls).
Chart shows Majority of teens say boys are more disruptive in class than girls

We also asked teens whether girls or boys speak up more in class, and whether they think one group is more disruptive.

  • Speaking up in class: 34% of teens say girls speak up more than boys in class, while 18% say boys speak up more. About half (48%) say both speak up about equally. Girls and boys have similar views on this.
  • Disrupting class: A 63% majority of teens say boys are more disruptive in class than girls. Only 4% say girls are more disruptive. About a third (32%) say it’s about the equal. Again, girls and boys largely agree on this.
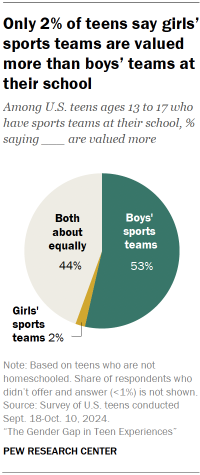
Chart shows Only 2% of teens say girls’ sports teams are valued more than boys’ teams at their school

When it comes to athletics, 53% of teens who have sports teams at their school say the boys’ teams are valued more than the girls’ teams. Only 2% say the girls’ teams are valued more, and 44% say the teams are valued about equally.

Boys and girls tend to agree on this, with 51% of boys and 56% of girls saying more value is placed on the boys’ teams at their school.

2. Pressures teens are facing

In addition to asking about the problems their peers at school are dealing with, we asked teens about the pressures they personally face.

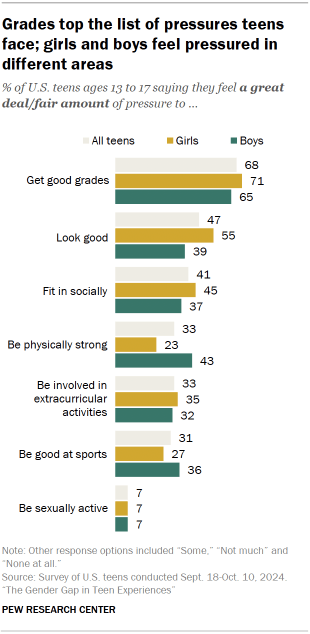
Chart shows Grades top the list of pressures teens face; girls and boys feel pressured in different areas

By far the biggest source of pressure for teens is their grades. Roughly seven-in-ten teens (68%) say they face a great deal or fair amount of pressure to get good grades.

Substantial shares of teens say they feel certain social pressures as well. Some 47% say they feel at least a fair amount of pressure to look good, and 41% feel pressure to fit in socially.

A third say they feel a great deal or fair amount of pressure to be physically strong. The same share feel pressure to be involved in extracurricular activities. And 31% say they feel pressure to be good at sports.

Very few teens (7%) say they feel a great deal or fair amount of pressure to be sexually active.

Differences by gender

While girls and boys share some of the same pressure points, there are significant differences in certain areas.

Where girls feel more pressure than boys

  • Looking good: A 55% majority of girls say they feel a great deal or fair amount of pressure to look good. A smaller share of boys (39%) say the same.
  • Fitting in socially: While 45% of girls say they feel pressure to fit in socially, the share is lower among boys (37%).

Where boys feel more pressure than girls

  • Being physically strong: By a margin of 20 percentage points, boys are more likely than girls to say they feel a great deal or fair amount of pressure to be physically strong (43% vs. 23%).
  • Being good at sports: 36% of boys feel pressure to be good at sports, compared with 27% of girls.

Where boys and girls feel equally pressured

There are three areas where roughly equal shares of teen boys and girls say they feel a great deal or fair amount of pressure.

  • Getting good grades: 71% of teen girls compared with 65% of teen boys say they feel a great deal or a fair amount of pressure to get good grades.
  • Being involved in extracurricular activities: 35% of girls and 32% of boys.
  • Being sexually active: 7% for both girls and boys.

3. Teens’ friendships and emotional support networks

Friendships play a large role in many teens’ lives. Relationships with friends can also be a predictor of long-term outcomes for teens, including the quality of their adult relationships and work performance.

We asked U.S. teens a few questions about their friend networks, and more specifically, whether they can turn to these networks for emotional support.

Number and gender of friends

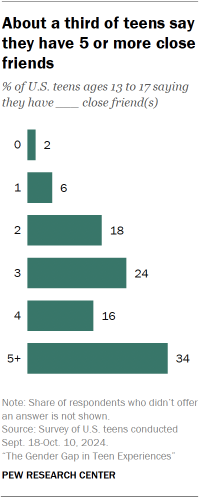
Chart shows About a third of teens say they have 5 or more close friends

Roughly two-thirds of teens (64%) say they have between one and four close friends. About a third (34%) say they have five or more close friends – fairly similar to the share of U.S. adults who say the same. Only 2% of teens say they have no close friends.

Teens’ friends are often the same gender as them. About half of teens who have at least one close friend (49%) say all of their friends are the same gender as them. Another 48% say their friends are a mix of genders, while only 2% of teens say none of their friends are the same gender as them.

There are no major differences between teen boys and girls in the number of friends they have or the gender makeup of their close friend circles. This is slightly different from what we found among adults – women are more likely than men to say all or most of their close friends are their same gender as them (71% vs. 61%).

Emotional support networks

Chart shows Teen girls are more likely than boys to have a friend they can lean on for emotional support

Among teens with at least one close friend, most teens (89%) say they have at least one friend they can turn to for emotional support, while 11% say they do not. However, there are some notable gender gaps on this question.

Boys are less likely than girls to say they have a close friend they can turn to if they need emotional support. Still a large majority of boys (85%) say they do; 16% say they don’t have a friend they can turn to.

Among teen girls, 95% say they have a close friend they can go to for emotional support, while only 5% say they don’t.

Chart shows Majority of teens say girls have it easier when it comes to having friends for emotional support

Relatedly, a recent Center survey of adults found a significant gap in the shares of women and men who said they would be extremely or very likely to turn to a friend as a source emotional support (54% of women vs. 38% of men).

We also asked teens whether they think boys or girls have it easier when it comes to having friends they can turn to for emotional support. A 58% majority of teens say girls have it easier. About a third (35%) say it’s about the same for both, while only 7% say boys have it easier.

Teen girls and boys gave similar answers on this question, with majorities of each group saying girls have it easier. Still, girls were more likely than boys to say boys have it easier (10% vs. 3%).

4. Teens’ future plans and goals

Given the current gender gap in college completion and the growing share of adults who don’t want to have children, we were curious about teens’ long-term goals and plans for adulthood. 

Plans after high school

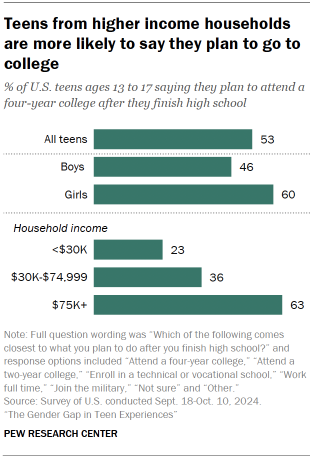
Chart shows Teens from higher income households are more likely to say they plan to go to college

When we asked teens what they plan to do after they finish high school, 53% said they plan to attend a four-year college.

Among teens, plans for attending college after high school differ by key demographics:

  • Gender: 60% of girls, compared with 46% of boys, say they plan to attend a four-year college.
  • Household income: Teens from households that make over $75,000 annually are the most likely to say they plan to go to a four-year college after high school (63%). A much smaller share of teens from households with incomes under $30,000 say the same (23%).

Some teens have other plans for after high school, including:

  • Attending a two-year college (10%)
  • Enrolling in a technical or vocational school (9%)
  • Working full time (6%)
  • Joining the military (3%)

About one-in-five teens (18%) are unsure of their plans.

Chart shows Teen girls are more likely than boys to say they plan to attend a 4-year college

Boys are more likely than girls to say they plan to enroll in a technical school, work full time or join the military after high school.

Boys and girls are about equally likely to say they aren’t sure of what they plan to do after high school.

There are also racial and ethnic differences on a couple of items. A 55% majority of White teens say they plan to attend a four-year college, while Hispanic teens are less likely to say this (43%). Among Black teens, 50% say they’ll attend a four-year college (not significantly different from White or Hispanic teens). In turn, Black and Hispanic teens are more likely than White teens to say they plan to attend a two-year college (13% and 15% vs. 7%). The sample size for Asian teens is too small for separate analysis.

Future goals

We also asked teens about some long-term goals – specifically, what they hope to achieve as adults.

Chart shows Looking toward adulthood, teens value job satisfaction
and close friends

A large majority of teens (86%) say it’s extremely or very important to them to have a job or career they enjoy when they’re an adult. This includes 41% who say this is extremely important.

Majorities also say having close friends (69%) and having a lot of money (58%) are highly important to them.

Smaller shares of teens place a high level of importance on family life milestones like getting married (36%) and having children (30%). We saw a similar pattern among adults in 2023 when we asked what they thought was important in order for people to live a fulfilling life. Job satisfaction and having close friends ranked higher marriage and parenthood.

Of the potential goals we asked about, fame is least important among teens. Only 6% say becoming famous is important to them personally. By contrast, 80% say this is not too or not at all important.

Boys and girls answer similarly on all these items, except for one: Girls are 9 points more likely than boys to say having close friends is highly important to them (74% vs. 65%).

There are also a couple notable racial and ethnic differences. Black and Hispanic teens are more likely than White teens to say having a lot of money is extremely or very important. Some 76% of Black teens and 66% of Hispanic teens say this, compared with 50% of White teens.

In turn, White teens are more likely to say having close friends in adulthood is highly important: 75% say this, compared with 64% of Hispanic teens and 62% of Black teens.

Views by political party

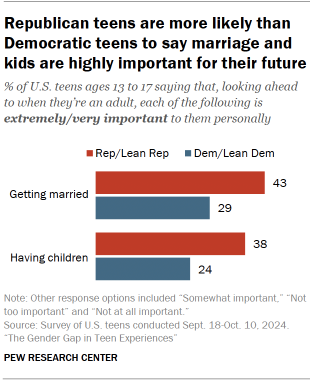
Chart shows Republican teens are more likely than Democratic teens to say marriage and kids are highly important for their future

Republican and Republican-leaning teens are more likely than Democratic and Democratic leaners to say getting married (43% vs. 29%) and having children (38% vs. 24%) are highly important to them personally.

This also mirrors what we saw when we asked adults what makes a fulfilling life. In 2023, about a third of Republican adults said having children or being married is extremely or very important in order for people to live a fulfilling life. About one-in-five or fewer Democratic adults said the same.

On the other items, teens from both parties give similar answers.

Acknowledgments

This report is a collaborative effort based on the input and analysis of the following individuals. Find related reports online at pewresearch.org/topic/gender-lgbtq.

Kim Parker, Director of Social Trends Research
Juliana Horowitz, Senior Associate Director, Research
Rachel Minkin, Research Associate
Isabel Goddard, Former Research Associate          
Luona Lin, Research Associate
Kiley Hurst, Research Analyst             
Dana Braga, Research Analyst
Reem Nadeem, Digital Producer        
John Carlo Mandapat, Information Graphics Designer     
Anna Jackson, Editorial Assistant                                              
Julia O’Hanlon, Communications Manager
Maya Pottiger, Communications Associate

In addition, the project benefited greatly from the guidance of the Pew Research Center methodology team: Courtney Kennedy, Andrew Mercer, Ashley Amaya, Dorene Asare-Marfo, Dana Popky, Anna Brown and Arnold Lau.

Methodology

The analysis in this report is based on a self-administered web survey conducted from Sept. 18 to Oct. 10, 2024, among a sample of 1,391 dyads, with each dyad (or pair) comprised of one U.S. teen ages 13 to 17 and one parent per teen. The margin of sampling error for the full sample of 1,391 teens is plus or minus 3.3 percentage points. The survey was conducted by Ipsos Public Affairs in English and Spanish using KnowledgePanel, its nationally representative online research panel.

The research plan for this project was submitted to an external institutional review board (IRB), Advarra, which is an independent committee of experts that specializes in helping to protect the rights of research participants. The IRB thoroughly vetted this research before data collection began. Due to the risks associated with surveying minors, this research underwent a full board review and received approval (Approval ID Pro00080537).

KnowledgePanel members are recruited through probability sampling methods and include both those with internet access and those who did not have internet access at the time of their recruitment. KnowledgePanel provides internet access for those who do not have it and, if needed, a device to access the internet when they join the panel. KnowledgePanel’s recruitment process was originally based exclusively on a national random-digit-dialing (RDD) sampling methodology. In 2009, Ipsos migrated to an address-based sampling (ABS) recruitment methodology via the U.S. Postal Service’s Delivery Sequence File (DSF). The Delivery Sequence File has been estimated to cover as much as 98% of the population, although some studies suggest that the coverage could be in the low 90% range.2

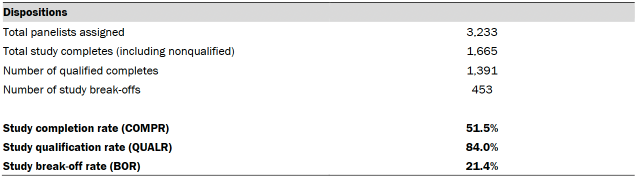
Panelists were eligible for participation in this survey if they indicated on an earlier profile survey that they were the parent of a teen ages 13 to 17. A random sample of 3,233 eligible panel members were invited to participate in the study. Responding parents were screened and considered qualified for the study if they reconfirmed that they were the parent of at least one child age 13 to 17 and granted permission for their teen who was chosen to participate in the study. In households with more than one eligible teen, parents were asked to think about one randomly selected teen and that teen was instructed to complete the teen portion of the survey. A survey was considered complete if both the parent and selected teen completed their portions of the questionnaire, or if the parent did not qualify during the initial screening.

Of the sampled panelists, 1,665 (excluding break-offs) responded to the invitation and 1,391 qualified, completed the parent portion of the survey, and had their selected teen complete the teen portion of the survey, yielding a final stage completion rate of 51.5% and a qualification rate of 84%.3 The cumulative response rate accounting for nonresponse to the recruitment surveys and attribution is 2.7%. The break-off rate among those who logged on to the survey (regardless of whether they completed any items or qualified for the study) is 21.4%.

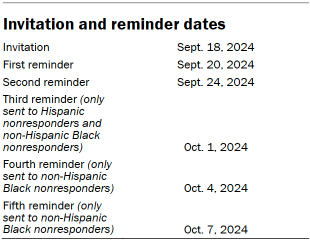
Table shows Invitation and reminder dates

Upon completion, qualified respondents received a cash-equivalent incentive worth $10 for completing the survey. To encourage response from non-Hispanic Black panelists, the incentive was $40.

All panelists received email invitations and any nonresponders received reminders, shown in the table. The field period was closed on Oct. 10, 2024.

Weighting

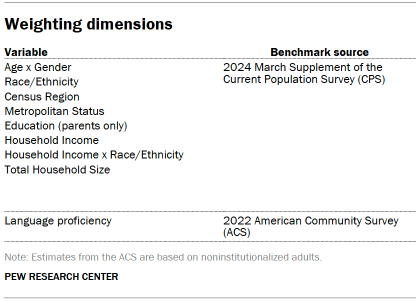
Weighting dimensions

The analysis in this report was performed using separate weights for parents and teens. The parent weight was created in a multistep process that begins with a base design weight for the parent, which is computed to reflect their probability of selection for recruitment into the KnowledgePanel. These selection probabilities were then adjusted to account for the probability of selection for this survey which included oversamples of Black and Hispanic parents. Next, an iterative technique was used to align the parent design weights to population benchmarks for parents of teens ages 13 to 17 on the dimensions identified in the accompanying table, to account for any differential nonresponse that may have occurred.

To create the teen weight, an adjustment factor was applied to the final parent weight to reflect the selection of one teen per household. Finally, the teen weights were further raked to match the demographic distribution for teens ages 13 to 17 who live with parents. The teen weights were adjusted on the same teen dimensions as parent dimensions with the exception of teen education, which was not used in the teen weighting.

Sampling errors and tests of statistical significance take into account the effect of weighting. Interviews were conducted in both English and Spanish.

In addition to sampling error, one should bear in mind that question wording and practical difficulties in conducting surveys can introduce error or bias into the findings of opinion polls.

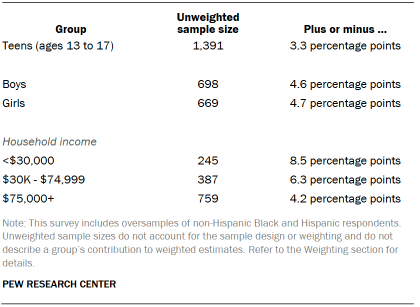
The following table shows the unweighted sample sizes and the error attributable to sampling that would be expected at the 95% level of confidence for different groups in the survey:

Table shows unweighted sample sizes

Sample sizes and sampling errors for subgroups are available upon request.

Dispositions and response rates

The tables below display dispositions used in the calculation of completion, qualification and cumulative response rates.4

Table shows Dispositions
Table shows Cumulative response rate calculations

© Pew Research Center, 2025