Pew Research Center

FOR RELEASE MAY 23, 2024

Is College Worth It?

As economic outcomes for young adults with and without degrees have improved, Americans hold mixed views on the value of college

BY Richard Fry, Dana Braga and Kim Parker

FOR MEDIA OR OTHER INQUIRIES:

Communications Department
202.419.4372
www.pewresearch.org

RECOMMENDED CITATION

Pew Research Center, May 2024, "Is College Worth It?"

About Pew Research Center

Pew Research Center is a nonpartisan, nonadvocacy fact tank that informs the public about the issues, attitudes and trends shaping the world. It does not take policy positions. The Center conducts public opinion polling, demographic research, computational social science research and other data-driven research. It studies politics and policy; news habits and media; the internet and technology; religion; race and ethnicity; international affairs; social, demographic and economic trends; science; research methodology and data science; and immigration and migration. Pew Research Center is a subsidiary of The Pew Charitable Trusts, its primary funder.

© Pew Research Center 2026

Table of contents

  • About Pew Research Center
  • Is College Worth It?
  • 1. Labor market and economic trends for young adults
  • 2. Public views on the value of a college degree
  • Acknowledgments
  • Methodology

Is College Worth It?

As economic outcomes for young adults with and without degrees have improved, Americans hold mixed views on the value of college

How we did this

Pew Research Center conducted this study to better understand public views on the importance of a four-year college degree. The study also explores key trends in the economic outcomes of young adults among those who have and have not completed a four-year college degree.

The analysis in this report is based on three data sources. The labor force, earnings, hours, household income and poverty characteristics come from the U.S. Census Bureau’s Annual Social and Economic Supplement of the Current Population Survey. The findings on net worth are based on the Federal Reserve’s Survey of Consumer Finances.

The data on public views on the value of a college degree was collected as part of a Center survey of 5,203 U.S. adults conducted Nov. 27 to Dec. 3, 2023. Everyone who took part in the survey is a member of Pew Research Center’s American Trends Panel (ATP), an online survey panel that is recruited through national, random sampling of residential addresses. Address-based sampling ensures that nearly all U.S. adults have a chance of selection. The survey is weighted to be representative of the U.S. adult population by gender, race, ethnicity, partisan affiliation, education and other categories. Read more about the ATP’s methodology.

Here are the questions used for this report, along with responses, and the survey’s methodology.

Terminology

Young adults refers to Americans ages 25 to 34.

Noncollege adults include those who have some college education as well as those who graduated from high school but did not attend college. Adults who have not completed high school are not included in the analysis of noncollege adults. About 6% of young adults have not completed high school. Trends in some labor market outcomes for those who have not finished high school are impacted by changes in the foreign-born share of the U.S. population. The Census data used in this analysis did not collect information on nativity before 1994.

Some college includes those with an associate degree and those who attended college but did not obtain a degree.

The some college or less population refers to adults who have some college education, those with a high school diploma only and those who did not graduate high school.

A full-time, full-year worker works at least 50 weeks per year and usually 35 hours a week or more.

The labor force includes all who are employed and those who are unemployed but looking for work.

The labor force participation rate is the share of a population that is in the labor force.

Young adults living independently refers to those who are not living in the home of either of their parents.

Household income is the sum of incomes received by all members of the household ages 15 and older. Income is the sum of earnings from work, capital income such as interest and dividends, rental income, retirement income, and transfer income (such as government assistance) before payments for such things as personal income taxes, Social Security and Medicare taxes, union dues, etc. Non-cash transfers such as food stamps, health benefits, subsidized housing and energy assistance are not included. As household income is pretax, it does not include stimulus payments or tax credits for earned income and children/dependent care.

Net worth, or wealth, is the difference between the value of what a household owns (assets) and what it owes (debts).

All references to party affiliation include those who lean toward that party. Republicans include those who identify as Republicans and those who say they lean toward the Republican Party. Democrats include those who identify as Democrats and those who say they lean toward the Democratic Party.

At a time when many Americans are questioning the value of a four-year college degree, economic outcomes for young adults without a degree are improving.

Pie chart shows Only 22% of U.S. adults say the cost of college is worth it even if someone has to take out loans

After decades of falling wages, young U.S. workers (ages 25 to 34) without a bachelor’s degree have seen their earnings increase over the past 10 years. Their overall wealth has gone up too, and fewer are living in poverty today.

Things have also improved for young college graduates over this period. As a result, the gap in earnings between young adults with and without a college degree has not narrowed.

The public has mixed views on the importance of having a college degree, and many have doubts about whether the cost is worth it, according to a new Pew Research Center survey.

  • Only one-in-four U.S. adults say it’s extremely or very important to have a four-year college degree in order to get a well-paying job in today’s economy. About a third (35%) say a college degree is somewhat important, while 40% say it’s not too or not at all important.
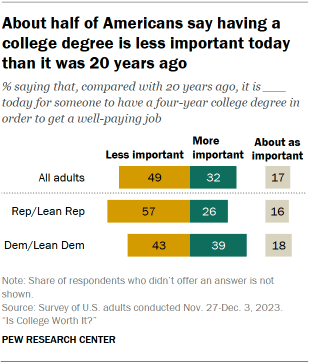
  • Roughly half (49%) say it’s less important to have a four-year college degree today in order to get a well-paying job than it was 20 years ago; 32% say it’s more important, and 17% say it’s about as important as it was 20 years ago.
  • Only 22% say the cost of getting a four-year college degree today is worth it even if someone has to take out loans. Some 47% say the cost is worth it only if someone doesn’t have to take out loans. And 29% say the cost is not worth it.

These findings come amid rising tuition costs and mounting student debt. Views on the cost of college differ by Americans’ level of education. But even among four-year college graduates, only about a third (32%) say college is worth the cost even if someone has to take out loans – though they are more likely than those without a degree to say this.

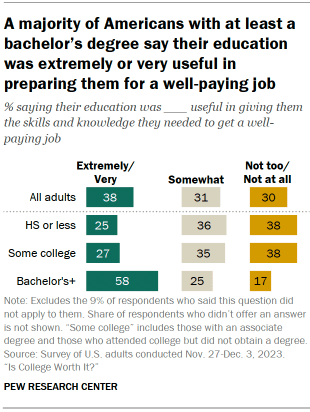
Four-year college graduates (58%) are much more likely than those without a college degree (26%) to say their education was extremely or very useful in giving them the skills and knowledge they needed to get a well-paying job. (This finding excludes the 9% of respondents who said this question did not apply to them.)
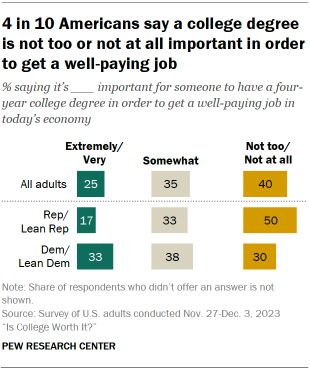
Chart shows 4 in 10 Americans say a college degree is not too or not at all important in order to get a well-paying job

Views on the importance of college differ widely by partisanship. Republicans and Republican-leaning independents are more likely than Democrats and Democratic leaners to say:

  • It’s not too or not at all important to have a four-year college degree in order to get a well-paying job (50% of Republicans vs. 30% of Democrats)
  • A college degree is less important now than it was 20 years ago (57% vs. 43%)
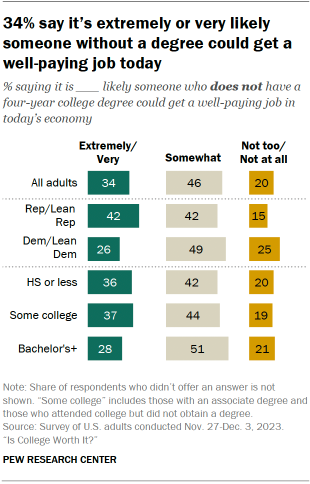
  • It’s extremely or very likely someone without a four-year college degree can get a well-paying job (42% vs. 26%)

Labor force trends and economic outcomes for young adults

At the same time that the public is expressing doubts about the value of college, a new Center analysis of government data finds young adults without a college degree are doing better on some key measures than they have in recent years.

A narrow majority of workers ages 25 to 34 do not have a four-year college degree (54% in 2023). Earnings for these young workers mostly trended downward from the mid-1970s until roughly a decade ago.

Outcomes have been especially poor for young men without a college degree. Other research has shown that this group saw falling labor force participation and sagging earnings starting in the early 1970s, but the last decade has marked a turning point.

This analysis looks at young men and young women separately because of their different experiences in the labor force.

Trends for young men

  • Labor force participation: The share of young men without a college degree who were working or looking for work dropped steadily from 1970 until about 2014. Our new analysis suggests things have stabilized somewhat for this group over the past decade. Meanwhile, labor force participation among young men with a four-year degree has remained mostly flat.
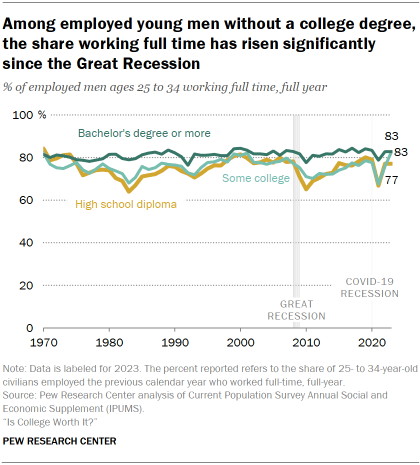
  • Full-time, full-year employment: The share of employed young men without a college degree who are working full time and year-round has varied somewhat over the years – trending downward during recessions. It’s risen significantly since the Great Recession of 2007-09, with the exception of a sharp dip in 2021 due to the COVID-19 pandemic. For employed young men with a college degree, the share working full time, full year has remained more stable over the years.
Chart shows Earnings of young men without a college degree have increased over the past 10 years
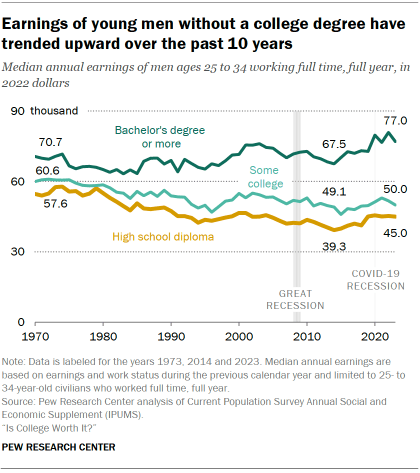
  • Median annual earnings: Since 2014, earnings have risen for young men with some college education and for those whose highest attainment is a high school diploma. Even so, earnings for these groups remain below where they were in the early 1970s. Earnings for young men with a bachelor’s degree have also trended up, for the most part, over the past 10 years.
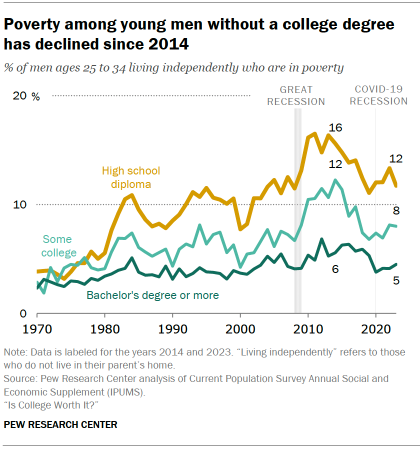
  • Poverty: Among young men without a college degree who are living independently from their parents, the share in poverty has fallen significantly over the last decade. For example, 12% of young men with a high school diploma were living in poverty in 2023, down from a peak of 17% in 2011. The share of young men with a four-year college degree who are in poverty has also fallen and remains below that of noncollege young men.

Trends for young women

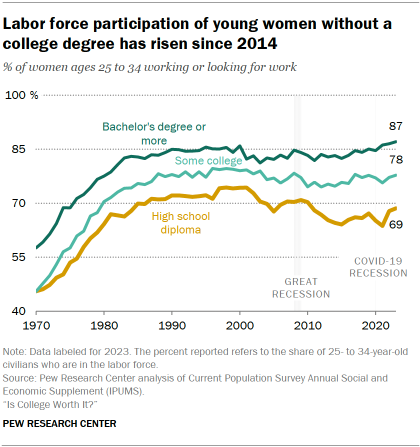
  • Labor force participation: The shares of young women with and without a college degree in the labor force grew steadily from 1970 to about 1990. Among those without a college degree, the share fell after 2000, and the drop-off was especially sharp for young women with a high school diploma. Since 2014, labor force participation for both groups of young women has increased.
  • Full-time, full-year employment: The shares of employed young women working full time and year-round, regardless of their educational attainment, have steadily increased over the decades. There was a decline during and after the Great Recession and again (briefly) in 2021 due to the pandemic. Today, the shares of women working full time, full year are the highest they’ve ever been across education levels.
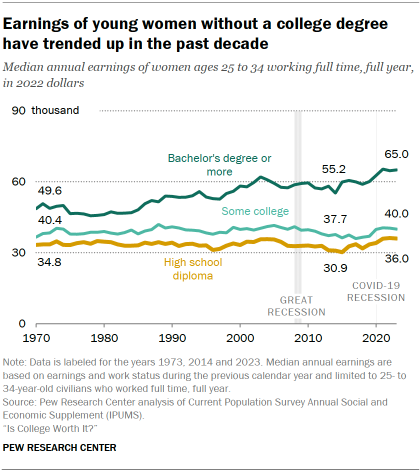
Chart shows Earnings of young women without a college degree have trended up in the past decade
  • Median annual earnings: Median earnings for young women without a college degree were relatively flat from 1970 until about a decade ago. These women did not experience the steady decline in earnings that noncollege young men did over this period. By contrast, earnings have grown over the decades for young women with a college degree. In the past 10 years, earnings for women both with and without a college degree have risen.
  • Poverty: As is the case for young men without a college degree, the share of noncollege young women living in poverty has fallen substantially over the past decade. In 2014, 31% of women with a high school diploma who lived independently from their parents were in poverty. By 2023, that share had fallen to 21%. Young women with a college degree remain much less likely to be in poverty than their counterparts with less education.

1. Labor market and economic trends for young adults

A majority of the nation’s 36 million workers ages 25 to 34 have not completed a four-year college degree. In 2023, there were 19 million young workers who had some college or less education, including those who had not finished high school.

Chart shows Number of U.S. workers without a college degree peaked around 1990

The overall number of employed young adults has grown over the decades as more young women joined the workforce. The number of employed young adults without a college degree peaked around 1990 at 25 million and then started to fall, as more young people began finishing college.

This chapter looks at the following key labor market and economic trends separately for young men and young women by their level of education:

  • Labor force participation
  • Individual earnings
  • Household income
  • Poverty
  • Net worth1

Economic outcomes for young men

When looking at how young adults are doing in the job market, it generally makes the most sense to analyze men and women separately. They tend to work in different occupations and have different career patterns, and their educational paths have diverged in recent decades.

Labor force participation

In 1970, almost all young men whose highest educational attainment was a high school diploma (98%) were in the labor force, meaning they were working or looking for work. By 2013, only 88% of high school-educated young men were in the labor force. Today, that share is 87%.

Chart shows Labor force participation has declined among young men without a college degree

Similarly, 96% of young men whose highest attainment was some college education were in the labor force in 1970. Today, the share is 89%.

By comparison, labor force participation among young men with at least a bachelor’s degree has remained relatively stable these past few decades. Today, 94% of young men with at least a bachelor’s degree are in the labor force.

The long-running decline in the labor force participation of young men without a bachelor’s degree may be due to several factors, including declining wages, the types of jobs available to this group becoming less desirable, rising incarceration rates and the opioid epidemic.2

The U.S. job market since the Great Recession

Looking at labor force and earnings trends over the past several decades, it’s important to keep in mind broader forces shaping the national job market.

The Great Recession officially ended in June 2009, but the national job market recovered slowly. At the beginning of the Great Recession in the fourth quarter of 2007, the national unemployment rate was 4.6%. Unemployment peaked at 10.4% in the first quarter of 2010. It was not until the fourth quarter of 2016 that unemployment finally returned to its prerecession level (4.5%).

Studies suggest that things started to look up for less-skilled workers around 2014. Among men with less education, hourly earnings began rising in 2014 after a decade of stagnation. Wage growth for low-wage workers also picked up in 2014. The tightening labor markets in the last five years of the expansion after the Great Recession improved the labor market prospects of “vulnerable workers” considerably.

The COVID-19 pandemic interrupted the tight labor market, but the COVID-19 recession and recovery were quite different from the Great Recession in their job market impact. The more recent recession was arguably more severe, as the national unemployment rate reached 12.9% in the second quarter of 2020. But it was short – officially lasting two months, compared with the 18-month Great Recession – and the labor market bounced back much quicker. Unemployment was 3.3% before the COVID-19 recession; three years later, unemployment had once again returned to that level.

Full-time, full-year employment
Chart shows Among employed young men without a college degree, the share working full time has risen significantly since the Great Recession

Since the Great Recession of 2007-09, young men without a four-year college degree have seen a significant increase in the average number of hours they work.

  • Today, 77% of young workers with a high school education work full time, full year, compared with 69% in 2011.
  • 83% of young workers with some college education work full time, full year, compared with 70% in 2011.

The share of young men with a college degree who work full time, year-round has remained fairly steady in recent decades – at about 80% – and hasn’t fluctuated with good or bad economic cycles.

Annual earnings

Annual earnings for young men without a college degree were on a mostly downward path from 1973 until roughly 10 years ago (with the exception of a bump in the late 1990s).3

Earnings have been increasing modestly over the past decade for these groups.

Chart shows Earnings of young men without a college degree have trended upward over the past 10 years
  • Young men with a high school education who are working full time, full year have median earnings of $45,000 today, up from $39,300 in 2014. (All figures are in 2022 dollars.)
  • The median earnings of young men with some college education who are working full time, full year are $50,000 today, similar to their median earnings in 2014 ($49,100).

It’s important to note that median annual earnings for both groups of noncollege men remain below their 1973 levels.

Median earnings for young men with a four-year college degree have increased over the past 10 years, from $67,500 in 2014 to $77,000 today.

Unlike young men without a college degree, the earnings of college-educated young men are now above what they were in the early 1970s. The gap in median earnings between young men with and without a college degree grew significantly from the late 1970s to 2014. In 1973, the typical young man with a degree earned 23% more than his high school-educated counterpart. By 2014, it was 72% more. Today, that gap stands at 71%.4

Household income

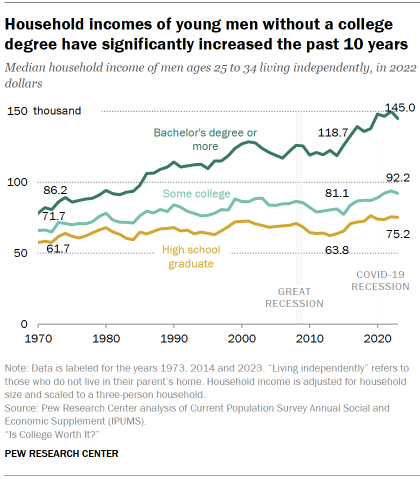
Household income has also trended up for young men in the past 10 years, regardless of educational attainment.

Chart shows Household incomes of young men without a college degree have significantly increased the past 10 years

This measure takes into account the contributions of everyone in the household. For this analysis, we excluded young men who are living in their parents’ home (about 20% of 25- to 34-year-old men in 2023).

  • The median household income of young men with a high school education is $75,200 today, up from $63,800 in 2014. This is slightly lower than the highpoint reached around 2019.
  • The median household income of young men with some college education is $92,200 today, up from $81,100 in 2014. This is close to the 2022 peak of $93,800.

The median household income of young men with at least a bachelor’s degree has also increased from a low point of $118,700 in 2014 after the Great Recession to $145,000 today.

The gap in household income between young men with and without a college degree grew significantly between 1980 and 2014. In 1980, the median household income of young men with at least a bachelor’s degree was about 38% more than that of high school graduates. By 2014, that gap had widened to 86%.

Over the past 10 years, the income gap has fluctuated. In 2023, the typical college graduate’s household income was 93% more than that of the typical high school graduate.

Poverty

The 2001 recession and Great Recession resulted in a large increase in poverty among young men without a college degree.

Chart shows Poverty among young men without a college degree has declined since 2014
  • In 2000, among young men living independently of their parents, 8% of those with a high school education were in poverty. Poverty peaked for this group at 17% around 2011 and has since declined to 12% in 2023.
  • Among young men with some college education, poverty peaked at 12% around 2014, up from 4% in 2000. Poverty has fallen for this group since 2014 and stands at 8% as of 2023.
  • Young men with a four-year college degree also experienced a slight uptick in poverty during the 2001 recession and Great Recession. In 2014, 6% of young college graduates were in poverty, up from 4% in 2000. Poverty among college graduates stands at 5% in 2023.

Economic outcomes for young women

Labor force trends for young women are very different than for young men. There are occupational and educational differences between young women and men, and their earnings have followed different patterns.

Labor force participation

Unlike the long-running decline for noncollege young men, young women without a college degree saw their labor force participation increase steadily from 1970 to about 1990.

Chart shows Labor force participation of young women without a college degree has risen since 2014

By 2000, about three-quarters of young women with a high school diploma and 79% of those with some college education were in the labor force.

Labor force participation has also trended upward for college-educated young women and has consistently been higher than for those with less education.
After rising for decades, labor force participation for young women without a college degree fell during the 2001 recession and the Great Recession. Their labor force participation has increased slightly since 2014.

As of 2023, 69% of young women with a high school education were in the labor force, as were 78% of young women with some college education. Today’s level of labor force participation for young women without a college degree is slightly lower than the level seen around 2000.

The decline in labor force participation for noncollege women partly reflects the declining labor force participation for mothers with children under 18 years of age. Other research has suggested that without federal paid parental and family leave benefits for parents, some women with less education may leave the labor force after having a baby.

In contrast, labor force participation for young women with a college degree has fully recovered from the recessions of the early 2000s. Today, 87% of college-educated young women are in the labor force, the highest estimate on record.

Full-time, full-year employment

Young women without a college degree have steadily increased their work hours over the decades. The past 10 years in particular have seen a significant increase in the share of employed noncollege women working full time, full year (with the exception of 2021).

Chart shows Share of employed young women with a high school diploma working full-time is the highest it’s ever been
  • In 2023, 69% of employed young women with a high school education worked full time, full year, up from 56% in 2014. This share is the highest it’s ever been.
  • In 2023, 65% of employed women with some college worked full time, full year, up from 58% in 2014. This is among the highest levels ever.

The trend in the share working full time, full year has been similar for young women with college degrees. By 2023, 78% of these women worked full time, full year, the highest share it’s ever been.

Annual earnings

Unlike young men, young women without a college education did not see their earnings fall between 1970 and 2000.

Chart shows Earnings of young women without a college degree have trended up in the past decade

The 2001 recession and Great Recession also did not significantly impact the earnings of noncollege young women. In the past 10 years, their median earnings have trended upward.

  • For young women with a high school diploma, median earnings reached $36,000 in 2023, up from $30,900 in 2014.
  • For those with some college, median earnings rose to $40,000 in 2023 from $37,700 in 2014.

For young women with a college degree, median earnings rose steadily from the mid-1980s until the early 2000s. By 2003, they reached $62,100, but this declined to $55,200 by 2014. In the past 10 years, the median earnings of college-educated young women have risen, reaching $65,000 in 2023.

In the mid-1980s, the typical young woman with a college degree earned about 48% more than her counterpart with a high school diploma. The pay gap among women has widened since then, and by 2014, the typical college graduate earned 79% more than the typical high school graduate. The gap has changed little over the past 10 years.

Household income

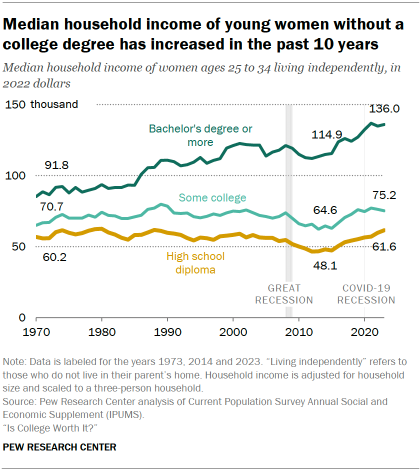
Noncollege young women living independently from their parents have experienced large household income gains over the past 10 years, measured at the median.

Chart shows Median household income of young women without a college degree has increased in the past 10 years
  • In 2023, young women with a high school diploma had a median household income of $61,600, up from $48,100 in 2014.
  • The pattern is similar for young women with some college education. Their median income rose to $75,200 in 2023 from $64,600 in 2014.

The median household income for young women with a four-year college degree is significantly higher than it is for their counterparts without a degree. College-educated young women have made substantial gains in the past 10 years.

The income gap between young women with and without a college degree has widened over the decades. In 1980, the median household income of young women with a college degree was 50% higher than that of high school-educated women. By 2014, the income gap had grown to 139%. Today, the household income advantage of college-educated women stands at 121% ($136,000 vs. $61,600).

Poverty

Chart shows Poverty among young women without a college degree has steeply declined in the past 10 years

Poverty trends for young women mirror those for young men, although young women are overall more likely to be in poverty than young men. The past 10 years have resulted in a steep reduction in the share of noncollege women in poverty.

  • Today, 21% of young women with a high school diploma are living in poverty. This is down from 31% in 2014.
  • 15% of young women with some college education live in poverty, compared with 21% in 2014.
  • Young women with a college degree are consistently far less likely than either group to be living in poverty (5% in 2023).

Wealth trends for households headed by a young adult

Along with young adults’ rising incomes over the past 10 years, there’s been a substantial increase in their wealth. This part of our analysis does not look at men and women separately due to limitations in sample size.

Chart shows The typical net worth of young adults with and without college degrees has increased over the past 10 years

In 2022, households headed by a young high school graduate had a median net worth of $30,700, up from $12,700 in 2013. Those headed by a young adult with some college education had a median net worth of $52,900, up from $15,700 in 2013.

The typical wealth level of households headed by a young college graduate was $120,200 in 2022, up from $46,600 in 2013.

There has not been any significant narrowing of the wealth gap between young high school graduate and young college graduate households since 2013.

Wealth increased for Americans across age groups over this period due to several factors. Many were able to save money during the pandemic lockdowns. In addition, home values increased, and the stock market surged.

2. Public views on the value of a college degree

We asked Americans what they think about the value of a four-year college degree from a few different angles:

  • Is a degree important in order for someone to get a well-paying job in today’s economy?
  • Has the value of a degree changed in recent decades?
  • Can someone without a degree get a well-paying job?
  • How useful do people think their own education was in preparing them for a well-paying job?
  • Is the cost of college worth it today?

The importance of a four-year college degree

Four-in-ten Americans say it is not too or not at all important to have a four-year college degree in order to get a well-paying job in today’s economy.

Chart shows About half of Americans say having a college degree is less important today than it was 20 years ago

Only 25% say it’s extremely or very important to have a college degree, and 35% say it’s somewhat important.

We also asked the public about the importance of a college degree now versus 20 years ago.

About half of Americans (49%) say it’s less important today than it was in the past for someone to have a four-year degree in order to get a well-paying job. About a third (32%) say having a degree is more important now, and 17% say its importance hasn’t really changed.

Differences by party

Chart shows Half of Republicans say a college degree is not too or not at all important in order to get a well-paying job

Half of Republicans and Republican-leaning independents – compared with 30% of Democrats and Democratic leaners – say it’s not too or not at all important to have a four-year college degree to get a well-paying job.

And a majority of Republicans (57%) say having a degree is less important today than it was 20 years ago; 43% of Democrats say the same.

These partisan gaps hold even after controlling for differences in the educational attainment of Republicans and Democrats.

Differences by education

College graduates are more likely than those with less education to say that having a college degree is extremely or very important (30% vs. 22%).

But views on whether having a college degree is more or less important today than it was 20 years ago don’t differ significantly by education. Roughly half of four-year college graduates (51%) and those with less education (48%) say it’s less important today for someone to have a college degree than it was in the past.

Adults with a postgraduate degree, however, have somewhat different views than those with a bachelor’s degree on both of these measures. Some 35% of postgraduates say it’s extremely or very important to have a four-year college degree in order to get a well-paying job, compared with 27% of those whose highest attainment is a bachelor’s degree.

And 39% of postgraduates – compared with 30% of those with a bachelor’s degree – say it’s more important to have a college degree today than it was 20 years ago.

Differences by age

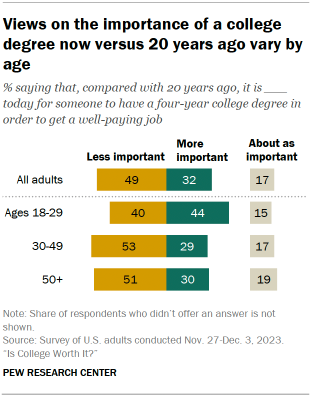
Chart shows Views on the importance of a college degree now versus 20 years ago vary by age

Young adults stand out in their views on the importance of a college degree today versus in the past.

Among those ages 18 to 29, 44% say having a degree is more important today in order to get a well-paying job than it was 20 years ago. By comparison, 29% of those 30 to 49 and 30% of those 50 and older say the same.

Getting a high-paying job without a college degree

Americans also have mixed views when it comes to whether someone without a four-year college degree could get a well-paying job in today’s economy.

Chart shows 34% say it’s extremely or very likely someone without a degree could get a well-paying job today

Only about a third (34%) say it’s extremely or very likely that someone withouta four-year degree could get this kind of job.

Nearly half say it’s somewhat likely that someone without a college degree could get a well-paying job, and 20% say it’s not too or not at all likely.

These views differ by:

  • Partisanship: 42% of Republicans and 26% of Democrats say it’s extremely or very likely someone without a four-year degree could get a well-paying job. Among Democrats, 25% say it’s not too or not at all likely; just 15% of Republicans say the same.
  • Education: 28% of adults with at least a bachelor’s degree say it’s extremely or very likely that someone without a college degree could get a well-paying job today. This compares with 37% of those with some college and 36% of those with a high school diploma or less education.
Do Americans think their education prepared them for the workplace?

Chart shows A majority of Americans with at least a bachelor’s degree say their education was extremely or very useful in preparing them for a well-paying job

When thinking about how useful their own education was in giving them the skills and knowledge needed to get a well-paying job, a majority of those with a four-year college degree or more education (58%) say it was extremely or very useful. (This finding excludes the 9% of respondents who said this question did not apply to them.)

Adults with a postgraduate degree are especially likely to say their education was extremely or very useful: 72% say this, compared with 47% of those whose highest attainment is a bachelor’s.

By comparison, adults with less education have more mixed views. Among those who have not completed a bachelor’s degree, 38% say their education was not too or not at all useful in giving them the skills and knowledge needed to get a well-paying job; 35% say it was somewhat useful, and 26% say it was extremely or very useful.

These views don’t differ as substantially by age or by party.

Is college worth the cost?

Chart shows Nearly half of Americans say college is worth the cost only if someone doesn’t have to take out loans

When asked about the cost of college these days, many Americans question whether it’s worth it if a student has to take on debt. Nearly half of adults (47%) say a four-year college degree is worth the cost, but only if someone doesn’t have to take out loans in order to attend.

Only 22% say college is worth the cost even if someone has to take out loans. And 29% say college isn’t worth the cost.

Meanwhile, data from the Federal Reserve shows that more than four-in-ten adults who attended college say they took out student loans for their education.

Views on the value of college differ by partisanship, education and age. But notably, in all groups except for Republicans, pluralities say the cost of college is worth it only if someone doesn’t have to take out loans.

Differences by party

A narrow majority of Democrats (54%) say the cost of getting a four-year college degree is worth it, but only if someone doesn’t have to take out loans. A smaller share of Republicans (41%) say the same.

About one-in-four Democrats (26%), compared with 19% of Republicans, say the cost is worth it even with loans.

Republicans are twice as likely as Democrats to say college is not worth the cost (38% vs. 19%).

Differences by education

Americans with at least a four-year college degree are much more likely than those with less education to say that college is worth the cost even if someone has to take out loans (32% vs. 17%).

Those with a postgraduate degree are among the most likely to express this view: 37% say college is worth the cost even after taking out loans. This compares with 29% among those with a bachelor’s but no postgraduate degree.

Even so, across all education levels, more say a four-year degree is worth the cost only if someone doesn’t take on debt than say it’s worth the cost with debt.

Those with some college or less education are about twice as likely as those with at least a bachelor’s degree to say the cost of getting a degree isn’t worth it at all (35% vs. 18%).

Differences by age

Young adults are more likely than their older counterparts to say the cost of a degree is worth it only if someone doesn’t take out loans: 55% of those ages 18 to 29 say this, compared with 48% of those 30 to 49 and 44% of those 50 and older.

And 18- to 29-year-olds are less likely to say the cost isn’t worth it at all (22% vs. roughly three-in-ten among older age groups).

Acknowledgments

This report is a collaborative effort based on the input and analysis of the following individuals. Find related reports online at pewresearch.org/topic/economy-work.

Kim Parker, Director, Social Trends Research
Juliana Horowitz, Associate Director, Research
Richard Fry, Senior Economist         
Dana Braga, Research Assistant      
Isabel Goddard, Research Associate
Kiley Hurst, Research Analyst
Rakesh Kochhar, Senior Researcher
John Carlo Mandapat, Information Graphics Designer
Anna Jackson, Editorial Assistant                                                   
Julia O’Hanlon, Communications Manager
Mithila Samak, Communications Associate

Methodology

The American Trends Panel survey methodology

Overview

The American Trends Panel (ATP), created by Pew Research Center, is a nationally representative panel of randomly selected U.S. adults. Panelists participate via self-administered web surveys. Panelists who do not have internet access at home are provided with a tablet and wireless internet connection. Interviews are conducted in both English and Spanish. The panel is being managed by Ipsos.

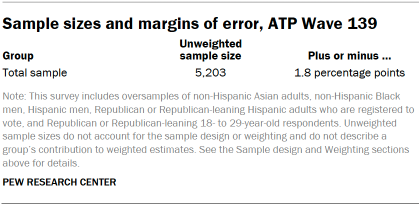
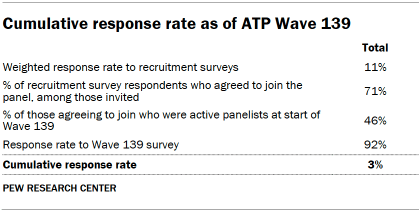
Data in this report is drawn from ATP Wave 139, conducted from Nov. 27 to Dec. 3, 2023, and includes an oversample of non-Hispanic Asian adults, non-Hispanic Black men, Hispanic men, Republican or Republican leaning Hispanic adults who are registered to vote, and Republican or Republican leaning 18- to 29-year-olds in order to provide more precise estimates of the opinions and experiences of these smaller demographic subgroups. These oversampled groups are weighted back to reflect their correct proportions in the population. A total of 5,203 panelists responded out of 5,655 who were sampled, for a response rate of 92%. The cumulative response rate accounting for nonresponse to the recruitment surveys and attrition is 3%. The break-off rate among panelists who logged on to the survey and completed at least one item is 1%. The margin of sampling error for the full sample of 5,203 respondents is plus or minus 1.8 percentage points.

Panel recruitment

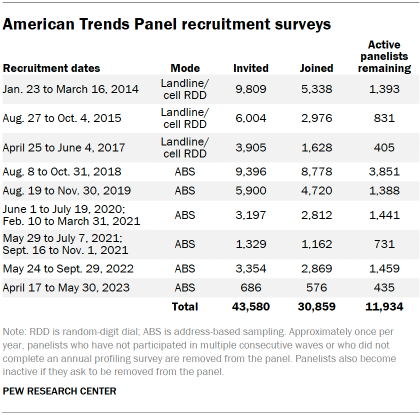
The ATP was created in 2014, with the first cohort of panelists invited to join the panel at the end of a large, national, landline and cellphone random-digit-dial survey that was conducted in both English and Spanish. Two additional recruitments were conducted using the same method in 2015 and 2017, respectively. Across these three surveys, a total of 19,718 adults were invited to join the ATP, of whom 9,942 (50%) agreed to participate.

Table shows American Trends Panel recruitment surveys

In August 2018, the ATP switched from telephone to address-based sampling (ABS) recruitment. A study cover letter and a pre-incentive are mailed to a stratified, random sample of households selected from the U.S. Postal Service’s Delivery Sequence File. This Postal Service file has been estimated to cover as much as 98% of the population, although some studies suggest that the coverage could be in the low 90% range.5 Within each sampled household, the adult with the next birthday is asked to participate. Other details of the ABS recruitment protocol have changed over time but are available upon request.6

We have recruited a national sample of U.S. adults to the ATP approximately once per year since 2014. In some years, the recruitment has included additional efforts (known as an “oversample”) to boost sample size with underrepresented groups. For example, Hispanic adults, Black adults and Asian adults were oversampled in 2019, 2022 and 2023, respectively.

Across the six address-based recruitments, a total of 23,862 adults were invited to join the ATP, of whom 20,917 agreed to join the panel and completed an initial profile survey. Of the 30,859 individuals who have ever joined the ATP, 11,934 remained active panelists and continued to receive survey invitations at the time this survey was conducted.

The American Trends Panel never uses breakout routers or chains that direct respondents to additional surveys.

Sample design

The overall target population for this survey was noninstitutionalized persons ages 18 and older living in the U.S., including Alaska and Hawaii. It featured a stratified random sample from the ATP in which non-Hispanic Asian adults, non-Hispanic Black men, Hispanic men, Republican or Republican leaning Hispanic adults who are registered to vote, and Republican or Republican leaning 18- to 29-year-olds were selected with certainty. The remaining panelists were sampled at rates designed to ensure that the share of respondents in each stratum is proportional to its share of the U.S. adult population to the greatest extent possible. Respondent weights are adjusted to account for differential probabilities of selection as described in the Weighting section below.

Questionnaire development and testing

The questionnaire was developed by Pew Research Center in consultation with Ipsos. The web program was rigorously tested on both PC and mobile devices by the Ipsos project management team and Pew Research Center researchers. The Ipsos project management team also populated test data that was analyzed in SPSS to ensure the logic and randomizations were working as intended before launching the survey.

Incentives

All respondents were offered a post-paid incentive for their participation. Respondents could choose to receive the post-paid incentive in the form of a check or a gift code to Amazon.com or could choose to decline the incentive. Incentive amounts ranged from $5 to $15 depending on whether the respondent belongs to a part of the population that is harder or easier to reach. Differential incentive amounts were designed to increase panel survey participation among groups that traditionally have low survey response propensities.

Data collection protocol

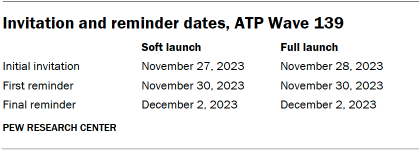
The data collection field period for this survey was Nov. 27 to Dec. 3, 2023. Postcard notifications were mailed to all ATP panelists with a known residential address on Nov. 27.

Invitations were sent out in two separate launches: soft launch and full launch. Sixty panelists were included in the soft launch, which began with an initial invitation sent on Nov. 27. The ATP panelists chosen for the initial soft launch were known responders who had completed previous ATP surveys within one day of receiving their invitation. All remaining English- and Spanish-speaking sampled panelists were included in the full launch and were sent an invitation on Nov. 28.

All panelists with an email address received an email invitation and up to two email reminders if they did not respond to the survey. All ATP panelists who consented to SMS messages received an SMS invitation and up to two SMS reminders.

Table shows Invitation and reminder dates, ATP Wave 139

Data quality checks

To ensure high-quality data, the Center’s researchers performed data quality checks to identify any respondents showing clear patterns of satisficing. This includes checking for whether respondents left questions blank at very high rates or always selected the first or last answer presented. As a result of this checking, four ATP respondents were removed from the survey dataset prior to weighting and analysis.

Weighting

Table shows American Trends Panel weighting dimensions

The ATP data is weighted in a multistep process that accounts for multiple stages of sampling and nonresponse that occur at different points in the survey process. First, each panelist begins with a base weight that reflects their probability of selection for their initial recruitment survey. These weights are then rescaled and adjusted to account for changes in the design of ATP recruitment surveys from year to year. Finally, the weights are calibrated to align with the population benchmarks in the accompanying table to correct for nonresponse to recruitment surveys and panel attrition. If only a subsample of panelists was invited to participate in the wave, this weight is adjusted to account for any differential probabilities of selection.

Among the panelists who completed the survey, this weight is then calibrated again to align with the population benchmarks identified in the accompanying table and trimmed at the 1st and 99th percentiles to reduce the loss in precision stemming from variance in the weights. Sampling errors and tests of statistical significance take into account the effect of weighting.

The following table shows the unweighted sample sizes and the error attributable to sampling that would be expected at the 95% level of confidence for different groups in the survey.

Table shows Sample sizes and margins of error, ATP Wave 139

Sample sizes and sampling errors for other subgroups are available upon request. In addition to sampling error, one should bear in mind that question wording and practical difficulties in conducting surveys can introduce error or bias into the findings of opinion polls.

Dispositions and response rates

Table shows Final dispositions, ATP Wave 139
Table shows Cumulative response rate as of ATP Wave 139

Current Population Survey methodology

Most of the analysis of the labor market and economic outcomes of young adults is derived from the Current Population Survey (CPS). Administered jointly by the U.S. Census Bureau and the Bureau of Labor Statistics, the CPS is a monthly survey of approximately 60,000 occupied households that typically interviews about 50,000 households. It is the source of the nation’s official statistics on unemployment and is explicitly designed to survey the labor force. It is representative of the civilian, noninstitutionalized population.

This analysis used the Annual Social and Economic Supplement (ASEC) of the CPS, conducted in March of every year. The ASEC survey typically features an expanded sample of more than 75,000 households with about 70,000 interviews. The ASEC collected in 2023 had about 57,000 households. The ASEC is the basis for the Census Bureau’s annual income and poverty reports.

The pandemic hampered the collection of data in 2020 and 2021, and thus the underlying sample sizes in these years tend to be smaller. For example, in 2021 the sample included about 900 women ages 25 to 34 who were high school graduates working full time, full year.

The Census Bureau generated entropy balance weights for the 2020 and 2021 ASEC to account for nonrandom nonresponse. Our analysis used these weights.

Estimates of household income refer to the prior calendar year. Household incomes are adjusted for the number of people in a household using the methodology from Pew Research Center’s previous work on the American middle class. Income is rescaled for this analysis because a four-person household with an income of, say, $50,000, faces a tighter budget constraint than a two-person household with the same income. Household incomes are expressed in 2022 dollars using the Chained Consumer Price Index for all Urban Consumers (C-CPI-U) between 2001 and 2023 and the Consumer Price Index for all Urban Consumers Retroactive Series (R-CPI-U-RS) between 1979 and 2000.

The CPS microdata used in this report are the Integrated Public Use Microdata Series (IPUMS) provided by the University of Minnesota. The IPUMS assigns uniform codes, to the extent possible, to data collected in the CPS over the years. Read more information about the IPUMS, including variable definition and sampling error.

Survey of Consumer Finances methodology

The household wealth analysis is based on the Survey of Consumer Finances (SCF) sponsored by the Federal Reserve Board of Governors and the Department of the Treasury. It has been conducted every three years since 1983 and is designed to provide detailed information on the finances of U.S. families. The 2022 SCF sample included approximately 4,600 families with household heads of any age. The small sample size of young adult household heads across education groups prevented us from analyzing their wealth by gender. For example, the 2022 SCF sampled a total of 113 families with a household head ages 25 to 34 whose highest educational attainment was a high school diploma.

© Pew Research Center, 2024