What teachers, teens and the U.S. public say about current curriculum debates
BYLuona Lin, Juliana Menasce Horowitz, Kiley Hurst and Dana Braga
About Pew Research Center
Pew Research Center is a nonpartisan, nonadvocacy fact tank that informs the public about the issues, attitudes and trends shaping the world. It does not take policy positions. The Center conducts public opinion polling, demographic research, computational social science research and other data-driven research. It studies politics and policy; news habits and media; the internet and technology; religion; race and ethnicity; international affairs; social, demographic and economic trends; science; research methodology and data science; and immigration and migration. Pew Research Center is a subsidiary of The Pew Charitable Trusts, its primary funder.
What teachers, teens and the U.S. public say about current curriculum debates
How we did this
Pew Research Center conducted this study to better understand how public K-12 teachers, teens and the American public see topics related to race, sexual orientation and gender identity playing out in the classroom.
The bulk of the analysis in this report is based on an online survey of 2,531 U.S. public K-12 teachers conducted from Oct. 17 to Nov. 14, 2023. The teachers surveyed are members of RAND’s American Teacher Panel, a nationally representative panel of public school K-12 teachers recruited through MDR Education. Survey data is weighted to state and national teacher characteristics to account for differences in sampling and response to ensure they are representative of the target population.
For the questions for the general public, we surveyed 5,029 U.S. adults from Nov. 9 to Nov. 16, 2023. The adults surveyed are members of the Ipsos KnowledgePanel, a nationally representative online survey panel. Panel members are randomly recruited through probability-based sampling, and households are provided with access to the Internet and hardware if needed. To ensure that the results of this survey reflect a balanced cross section of the nation, the data is weighted to match the U.S. adult population by gender, age, education, race and ethnicity and other categories.
For questions for teens, we conducted an online survey of 1,453 U.S. teens from Sept. 26 to Oct. 23, 2023, through Ipsos. Ipsos recruited the teens via their parents, who were part of its KnowledgePanel. The survey was weighted to be representative of U.S. teens ages 13 to 17 who live with their parents by age, gender, race and ethnicity, household income, and other categories. The survey on teens was reviewed and approved by an external institutional review board (IRB), Advarra, an independent committee of experts specializing in helping to protect the rights of research participants.
Throughout the report, references to White, Black and Asian adults include those who are not Hispanic and identify as only one race. Hispanics are of any race. The views and experiences of teachers and teens who are Asian American or part of other racial and ethnic groups are not analyzed separately in this report due to sample limitations. Data for these groups is incorporated into the general population figures throughout the report.
All references to party affiliation include those who lean toward that party. Republicans include those who identify as Republicans and those who say they lean toward the Republican Party. Democrats include those who identify as Democrats and those who say they lean toward the Democratic Party.
Political leaning of school districts is based on whether the majority of those residing in the school district voted for Republican Donald Trump or Democrat Joe Biden in the 2020 presidential election.
Amid national debates about what schools are teaching, we asked public K-12 teachers, teens and the American public how they see topics related to race, sexual orientation and gender identity playing out in the classroom.
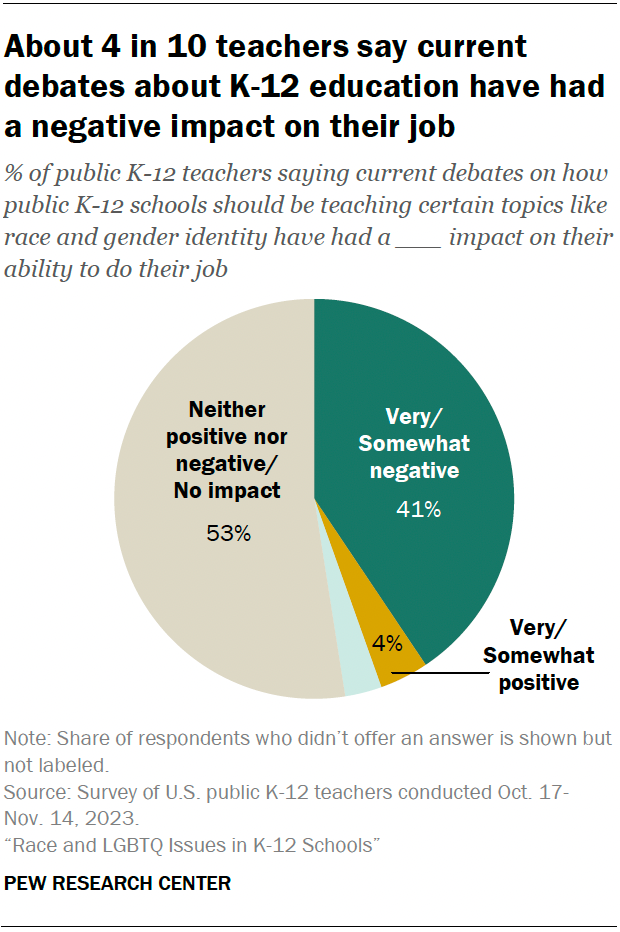
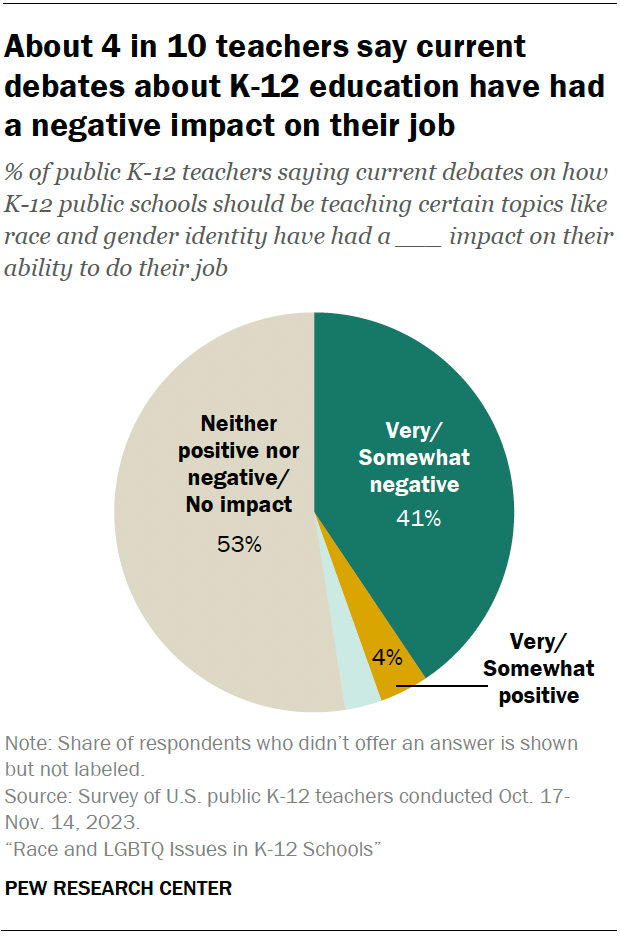
A sizeable share of teachers (41%) say these debates have had a negative impact on their ability to do their job. Just 4% say these debates have had a positive impact, while 53% say the impact has been neither positive nor negative or that these debates have had no impact.
And 71% of teachers say teachers themselves don’t have enough influence over what’s taught in public schools in their area.
In turn, a majority of teachers (58%) say their state government has too much influence over this. And more say the federal government, the local school board and parents have too much influence than say they don’t have enough.
Most of the findings in this report come from a survey of 2,531 U.S. public K-12 teachers conducted Oct. 17-Nov. 14, 2023, using the RAND American Teacher Panel.1 The survey looks at teachers’ views on:
Race and LGBTQ issues in the classroom (Chapter 1)
Current debates over what schools should be teaching and the role of key groups (Chapter 2)
This report also includes some findings from a survey of U.S. teens ages 13 to 17 (Chapter 3) and a survey of U.S. adults (Chapter 4). For details about these surveys, refer to the Methodology section of this report. Among the key findings:
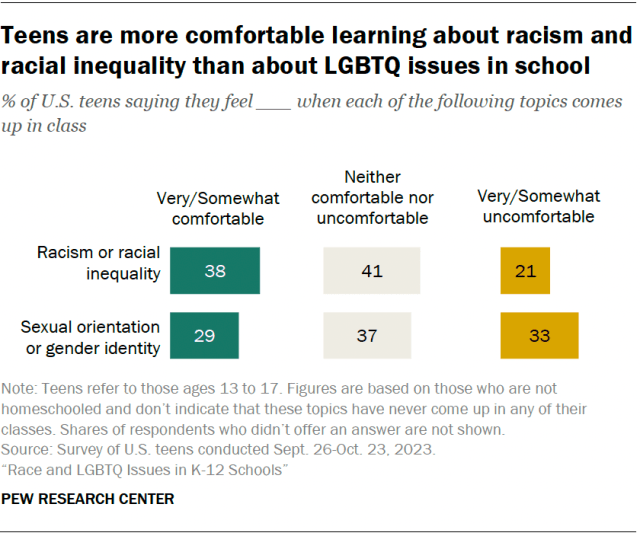
38% of teens say they feel comfortable when topics related to racism or racial inequality come up in class (among those who say these topics have come up). A smaller share (29%) say they feel comfortable when topics related to sexual orientation or gender identity come up.
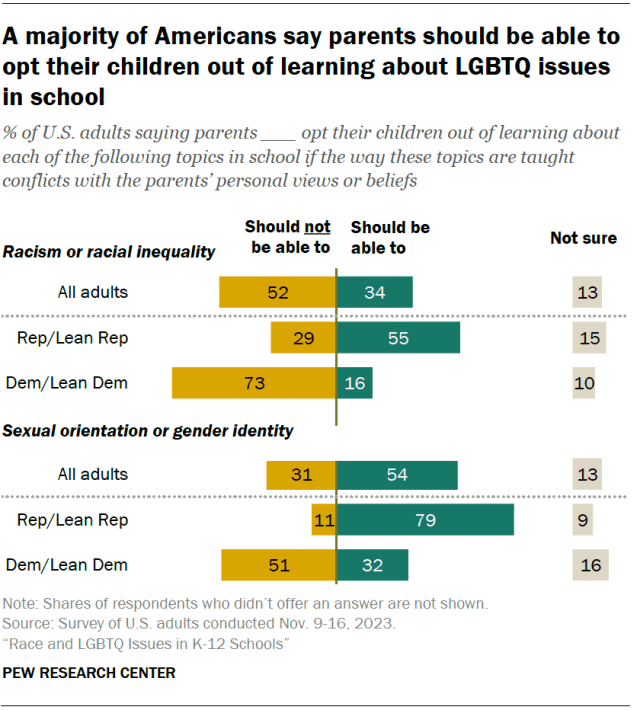
Among the American public, more say parents should be able to opt their children out of learning about LGBTQ issues than say the same about topics related to race (54% vs. 34%).
What do teachers think students should learn about slavery and gender identity?
We asked public K-12 teachers what they think students should learn in school about two topics in particular:
Whether the legacy of slavery still affects the position of Black people in American society today.
Whether a person’s gender can be different from or is determined by their sex at birth.
For these questions, elementary, middle and high school teachers were asked about elementary, middle and high school students, respectively.
The legacy of slavery
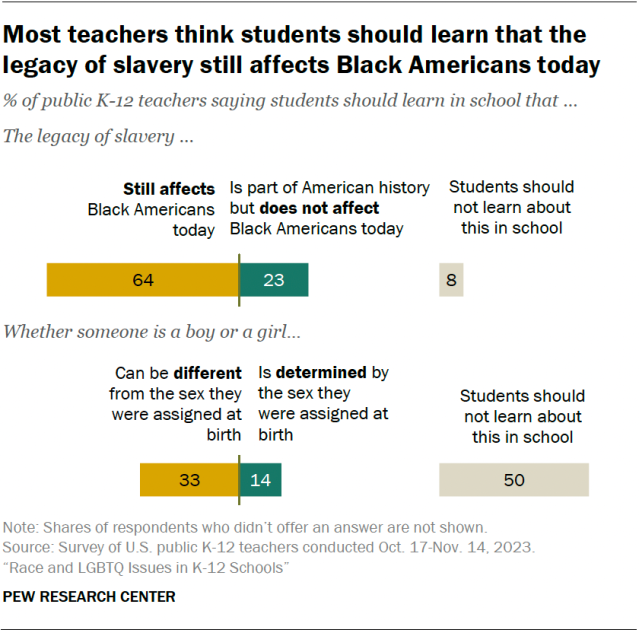
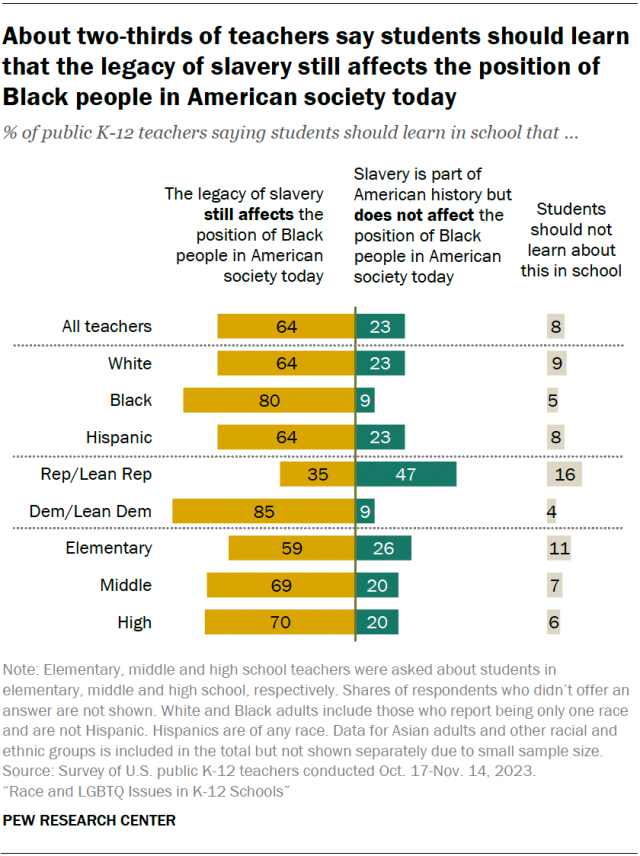
Most teachers (64%) say students should learn that the legacy of slavery still affects the position of Black people in American society today.
About a quarter (23%) say students should learn that slavery is part of American history but no longeraffects the position of Black people in American society. Just 8% say students shouldn’t learn about this topic in school at all.
Majorities of elementary, middle and high school teachers say students should learn that the legacy of slavery still has an impact on the lives of Black Americans.
Gender identity
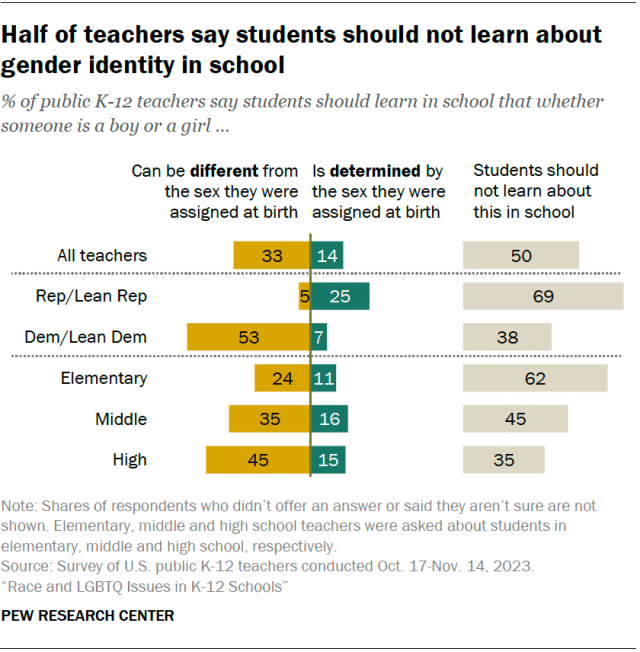
When it comes to teaching about gender identity – specifically whether a person’s gender can be different from or is determined by their sex assigned at birth – half of public K-12 teachers say students shouldn’t learn about this in school.
A third of teachers think students should learn that someone can be a boy or a girl even if that is different from the sex they were assigned at birth.
A smaller share (14%) say students should learn that whether someone is a boy or a girl is determined by their sex at birth.
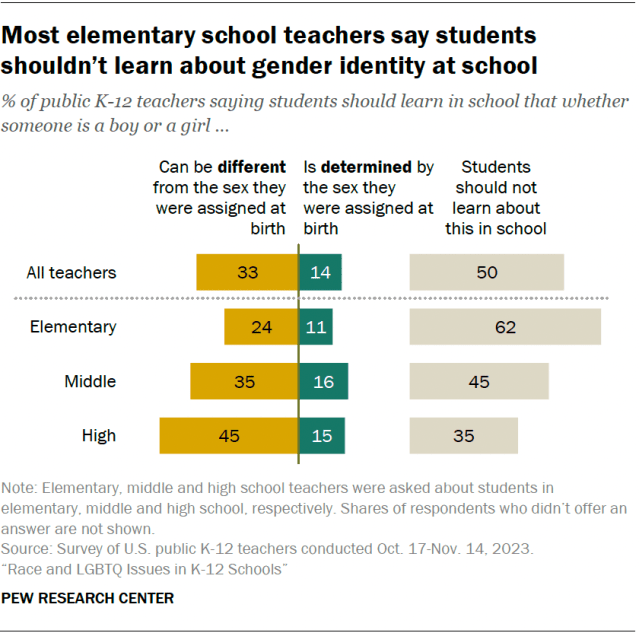
Views differ among elementary, middle and high school teachers. But teachers across the three levels are more likely to say students should learn that a person’s gender can be different from their sex at birth than to say students should learn gender is determined by sex at birth.
Most elementary school teachers (62%) say students shouldn’t learn about gender identity in school. This is much larger than the shares of middle and high school teachers who say the same (45% and 35%).
What parents and teens say
Parents of K-12 students are more divided on what their children should learn in school about these topics.
In the 2022 survey, 49% of parents said they’d rather their children learn that the legacy of slavery still affects the position of Black people in American society today, while 42% said they’d rather their children learn that slavery no longer affects Black Americans.
When it comes to gender identity, 31% of parents said they’d rather their children learn that gender can be different from sex at birth. An identical share said they would rather their children learn gender is determined by sex at birth. Another 37% of parents said their children shouldn’t learn about gender identity in school.
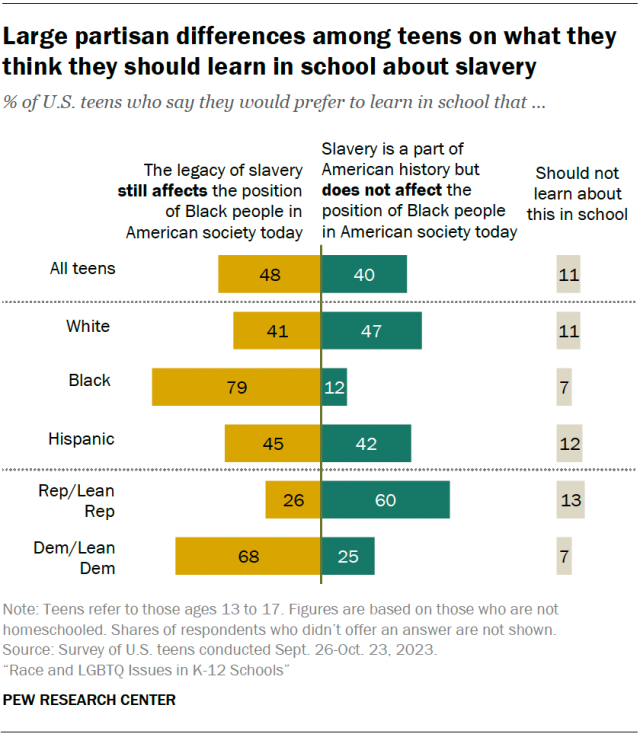
Teens, like parents, are more divided than teachers on these questions. About half of teens (48%) say they’d rather learn that the legacy of slavery still affects the position of Black Americans today. Four-in-ten would prefer to learn that slavery no longer affects Black Americans.
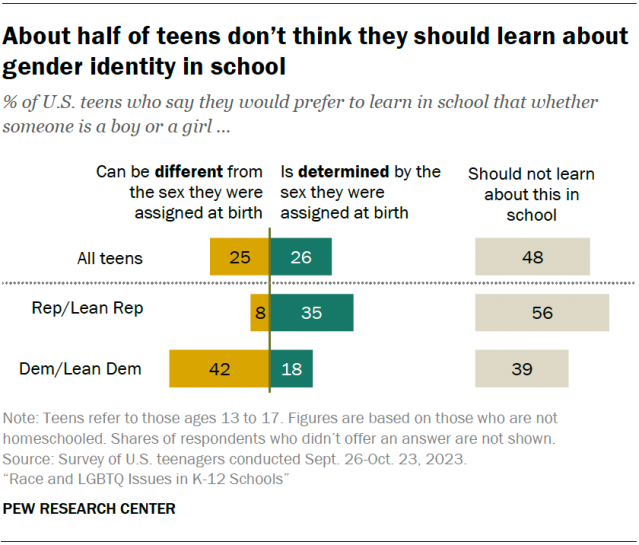
And teens are about evenly divided when it comes to what they prefer to learn about gender identity. A quarter say they’d rather learn that a person’s gender can be different from their sex at birth; 26% would prefer to learn that gender is determined by sex at birth. About half (48%) say they shouldn’t learn about gender identity in school.
For more on teens’ views about what they prefer to learn in school about each of these topics, read Chapter 3 of this report.
Should parents be able to opt their children out of learning about certain topics?
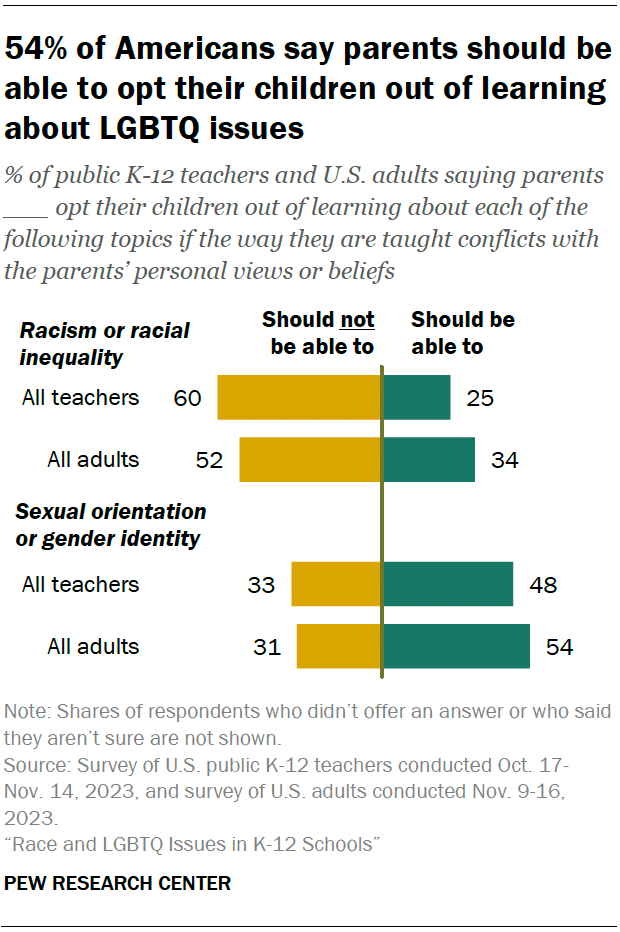
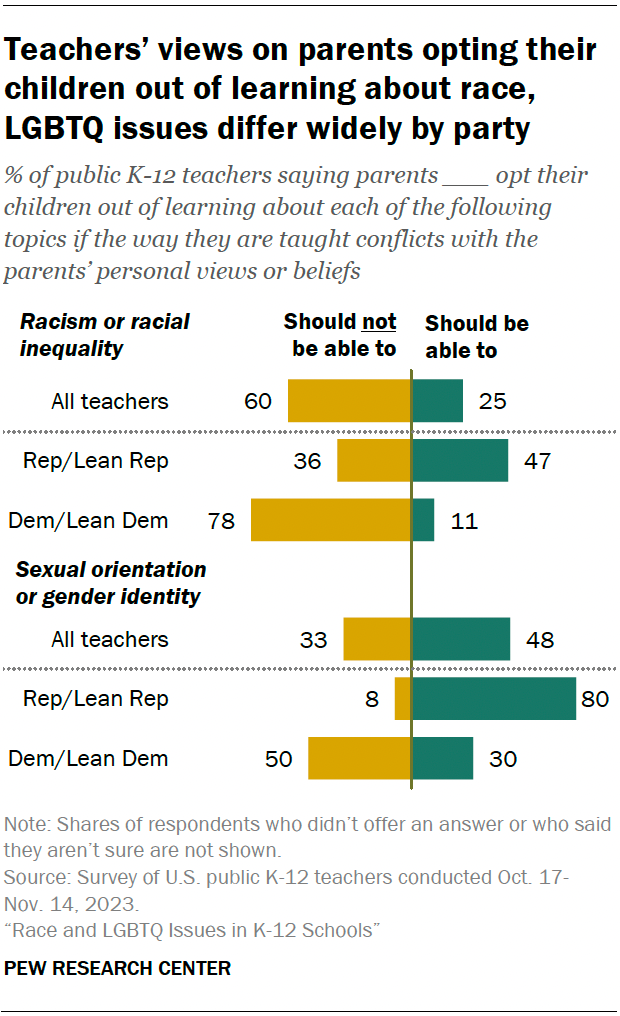
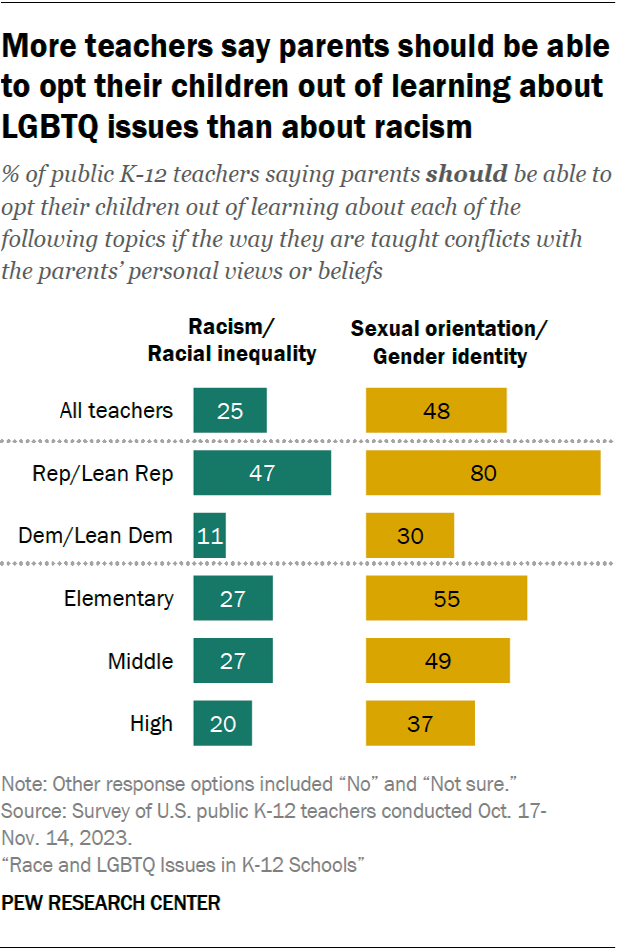
Most public K-12 teachers (60%) say parents shouldnot be able to opt their children out of learning about racism or racial inequality in school, even if the way these topics are taught conflicts with the parents’ beliefs. A quarter say parents should be able to opt their children out of learning about these topics.
In contrast, more say parents should be able to opt their children out of learning about sexual orientation or gender identity (48%) than say parents should not be able to do this (33%).
On topics related to both race and LGBTQ issues, elementary and middle school teachers are more likely than high school teachers to say parents should be able to opt their children out.
How teachers’ views compare with the public’s views
Like teachers, Americans overall are more likely to say parents should be able to opt their children out of learning about sexual orientation or gender identity (54%) than to say they should be able to opt their children out of learning about racism or racial inequality (34%).
Across both issues, Americans overall are somewhat more likely than teachers to say parents should be able to opt their children out.
For more on the public’s views, read Chapter 4 of this report.
How often do topics related to race and LGBTQ issues come up in the classroom?
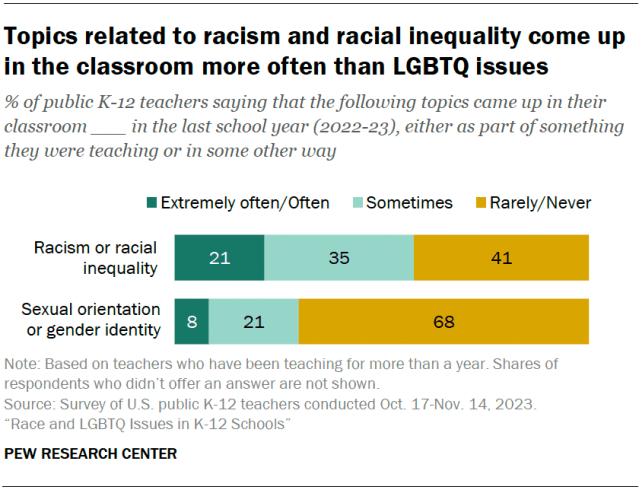
Most teachers who’ve been teaching for more than a year (68%) say the topics of sexual orientation and gender identity rarely or never came up in their classroom in the 2022-23 school year. About one-in-five (21%) say these topics came up sometimes, and 8% say they came up often or extremely often.
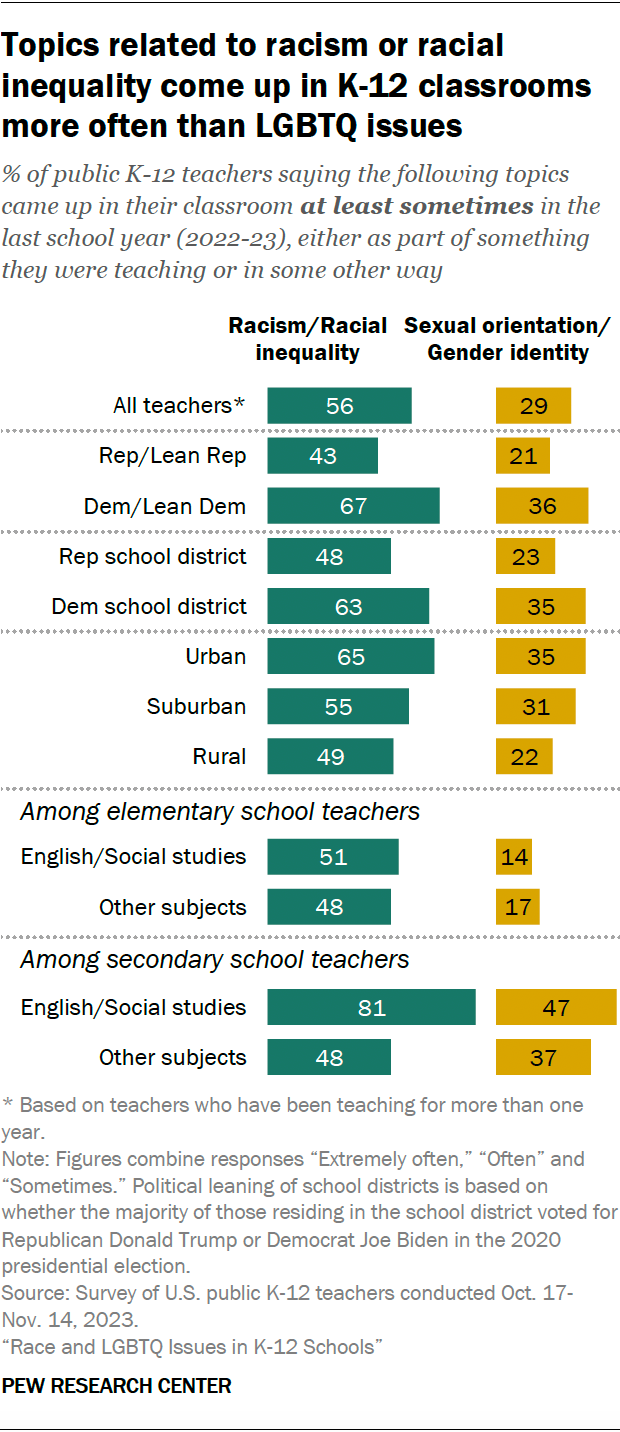
Topics related to racism or racial inequality come up more frequently. A majority of teachers (56%) say these topics came up at least sometimes in their classroom, with 21% saying they came up often or extremely often.
These topics are more likely to come up in secondary school than in elementary school classrooms.
How do teachers’ views differ by party?
As is the case among parents of K-12 students and the general public, teachers’ views on how topics related to race and LGBTQ issues should play out in the classroom differ by political affiliation.
What students should learn about slavery: 85% of Democratic and Democratic-leaning teachers say students should learn that the legacy of slavery still affects the position of Black people in American society today. This compares with 35% of Republican and Republican-leaning teachers who say the same.
What students should learn about gender identity: Democratic teachers are far more likely than Republican teachers to say students should learn that a person’s gender can be different from the sex they were assigned at birth (53% vs. 5%). Most Republican teachers (69%) say students shouldn’t learn about gender identity in school.
Parents opting their children out of learning about these topics: 80% of Republican teachers say parents should be able to opt their children out of learning about LGBTQ issues, compared with 30% of Democratic teachers. And while 47% of Republican teachers say parents should be able to opt their children out of learning about racism and racial inequality, just 11% of Democratic teachers say this.
To understand how conversations about race and LGBTQ issues are playing out in schools, we asked public K-12 teachers who have been teaching more than one year how often these topics came up in their classroom in the last school year (2022-23).
A majority of teachers (56%) say topics related to racism and racial inequality came up at least sometimes.
29% say the same about sexual orientation and gender identity.
By large margins, Democratic teachers are more likely than Republican teachers to say these topics came up at least sometimes in their classroom:
67% of Democratic and Democratic-leaning teachers versus 43% of Republican and Republican-leaning teachers say this about topics related to racism or racial inequality.
36% of Democratic teachers versus 21% of Republican teachers say this about sexual orientation and gender identity.
In addition, teachers in Democratic school districts (those where a majority of residents voted for Joe Biden in the 2020 election) are more likely than those in districts that voted for Donald Trump to say these topics came up in their classroom. Republican and Democratic teachers in Democratic school districts are more likely than their counterparts in Republican school districts to have these topics come up.
These topics are also more likely to come up in urban and suburban schools than rural schools, and in secondary schools than elementary schools. Secondary school teachers who teach English or social studies are the most likely to say these topics come up.
What teachers think students should learn about slavery and gender identity
The survey asked teachers what they think students should learn about slavery and gender identity in school. For these questions, we asked elementary, middle and high school teachers about elementary, middle and high school students, respectively.
The legacy of slavery
Most teachers (64%) say students should learn that the legacy of slavery still affects the position of Black people in American society today.
A much smaller share (23%) say students should learn that slavery is part of American history but does not affect the position of Black people in American society today.
Democratic teachers are much more likely than Republican teachers to say students should learn that slavery still affects the position of Black people today (85% vs 35%). Black teachers are more likely than White and Hispanic teachers to say this, and middle and high school teachers are more likely than elementary school teachers to say this.
Gender identity
A third of teachers say students should learn in school that whether someone is a boy or a girl can be different from the sex they were assigned at birth.
A smaller share (14%) say students should learn that whether someone is a boy or a girl is determined by the sex they were assigned at birth.
Half of teachers say students should not learn about gender identity in school at all.
By a large margin, Democratic teachers are more likely than Republican teachers to say students should learn that someone’s gender can be different from their sex at birth (53% vs 5%). Most Republican teachers (69%) say students should not learn about this topic in school at all.
The majority of elementary school teachers (62%) say elementary school students should not learn about gender identity in school. Some 45% of middle school teachers say the same about middle school students, while 35% of high school teachers say high school students shouldn’t learn about this in school.
Still, more elementary, middle and high school teachers say students should learn that gender can be different from sex at birth than say students should learn that gender is determined by sex at birth.
We asked parents of K-12 students in fall 2022 what they thought their children should learn in school about the legacy of slavery and gender identity. On both topics, parents’ views were more evenly split than the views of teachers.
For teens’ views on what they should learn about these topics, read Chapter 3 of this report.
Should parents be able to opt their children out of learning about race and LGBTQ issues?
When asked if parents should be able to opt their children out of learning about certain topics, if the way they are taught conflicts with parents’ personal views or beliefs:
48% of teachers say yes when it comes to sexual orientation or gender identity.
25% say yes when it comes to topics related to racism or racial inequality.
On both topics, Republican teachers are more than twice as likely as Democratic teachers to say that parents should be able to opt their children out of learning about these topics.
And elementary and middle school teachers are more likely than high school teachers to say that parents should be able to opt their children out.
For the general public’s views on parents opting children out of learning about race and LGBTQ issues, read Chapter 4 of this report.
2. Teachers’ views of current debates about what schools should be teaching
We asked teachers what type of impact current debates about how public schools should be teaching about topics like race and gender identity have had on their ability to do their job.
A sizeable share of public K-12 teachers (41%) say these debates have had a negative impact on their ability to do their job.
Just 4% say these debates have a positive impact, while 53% say the impact has been neither positive nor negative or that these debates have had no impact.
Similar shares of Democratic (44%) and Republican (40%) teachers say these debates have had a negative impact. But Republican teachers are more likely than Democratic teachers to say the impact has been neither positive nor negative or that there’s been no impact (58% vs. 51%).
Secondary school teachers are more likely than elementary school teachers to say the impact has been negative (45% vs. 36%). Among secondary school teachers, those teaching English or social studies are especially likely to say this compared with those teaching other subjects (55% vs. 38%).
Influence over curriculum
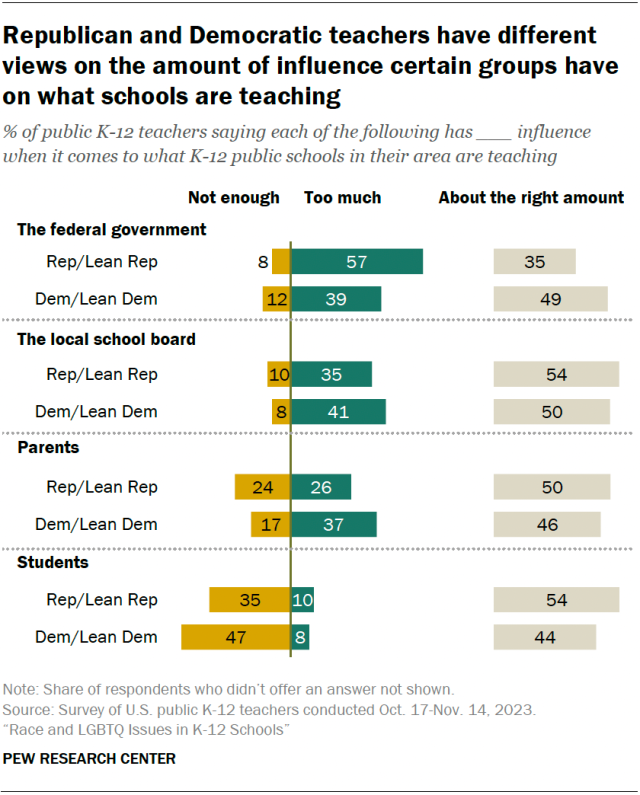
We asked teachers about the amount of influence different groups have over what K-12 public schools in their areas are teaching.
Most teachers (71%) say teachers themselves don’t have enough influence.
Teachers are also more likely to say students and principals don’t have enough influence than to say these groups have too much influence. Still, 61% say principals have about the right amount of influence, and about half say the same about students.
In turn, a majority of teachers (58%) say their state government has too much influence over what K-12 public schools in their area are teaching.
More also say the following groups have too much influence than say they don’t have enough influence:
The federal government (45% say too much, while 10% say not enough)
The local school board (38% vs. 9%)
Parents (32% vs. 19%)
When we asked parents of K-12 children a similar question in fall 2022, a far smaller share (30%) said teachers don’t have enough influence. Another 12% said they have too much and 42% said it’s about right. In the parents survey, we also offered a “not sure” option, which 15% of parents selected.
Partisan differences
As is the case among parents, teachers’ views on how much influence certain groups have on what schools are teaching vary by party.
Democratic teachers are more likely than Republican teachers to say each of the following has too much influence:
Their local school board (41% vs. 35%)
Parents (37% vs. 26%)
For their part, Republican teachers are more likely than Democratic teachers to say the federal government has too much influence (57% vs. 39%).
A larger share of Democratic teachers (47%) than Republican teachers (35%) say students don’t have enough influence on what schools are teaching.
3. What teens want to learn in school about race and LGBTQ issues
A separate survey of U.S. teens asked how they feel when topics related to racism or racial inequality and sexual orientation or gender identity come up in the classroom.
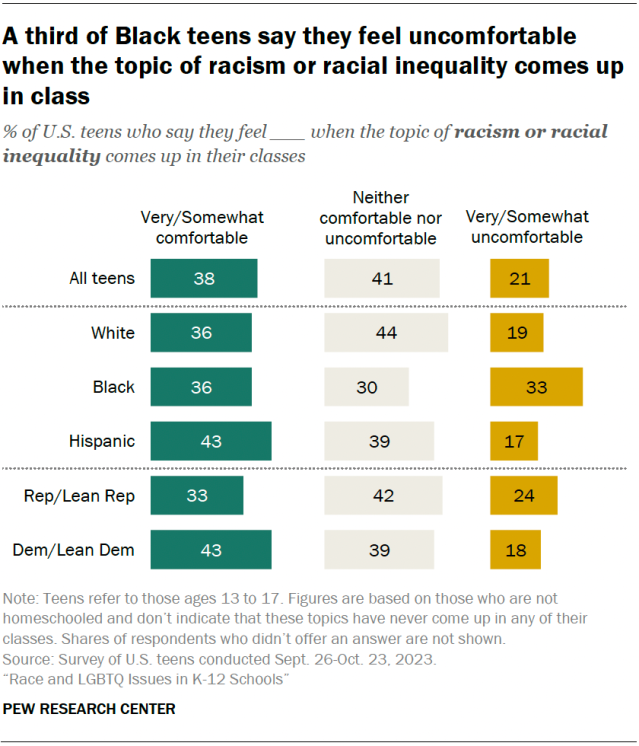
Among teens who are not homeschooled and who say topics related to racism or racial inequality have come up in their classes, more say they feel comfortable (38%) than say they feel uncomfortable (21%) when these topics come up.
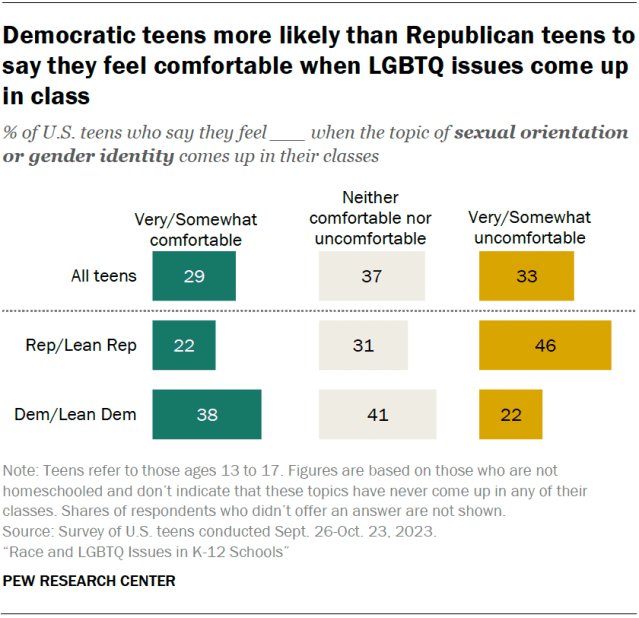
Views are more evenly split when it comes to sexual orientation or gender identity. Among teens who say these topics have come up in the classroom, similar shares say they feel comfortable (29%) and uncomfortable (33%) when they come up.
About one-in-ten teens (8%) say the topic of racism or racial inequality has never come up in any of their classes. Some 14% say the same about sexual orientation or gender identity.
Among those who say the topic of racism or racial inequality comes up in class, comfort levels differ by:
Race and ethnicity: Black teens (33%) are more likely than White (19%) or Hispanic (17%) teens to say they feel uncomfortable when this comes up in class.
Partisanship: Teens who identify with or lean toward the Democratic Party are more likely than Republican and Republican-leaning teens to say they feel comfortable when this comes up in class (43% vs. 33%). In turn, Republican teens are more likely than Democratic teens to say they feel uncomfortable (24% vs. 18%).
Among those who say sexual orientation or gender identity comes up in class, comfort levels differ by:
Partisanship: Democratic teens are more likely to say they feel comfortable (38%) than to say they feel uncomfortable (22%) when this comes up in class. Meanwhile, 46% of Republican teens say they feel uncomfortable, far more than the share who say they feel comfortable (22%).
What teens want to learn about slavery
When asked what they would prefer to learn in school about the legacy of slavery, 48% of teens say they’d rather learn that it still affects the position of Black people in American society today.
A smaller but substantive share (40%) would rather learn that slavery is part of American history but does not affect the position of Black people in American society today.
Just 11% say they shouldn’t learn about this topic at school.
Again, views differ by:
Race and ethnicity: 79% of Black teens say they would prefer to learn that the legacy of slavery still affects Black people today. This is much higher than the shares of White (41%) and Hispanic (45%) teens who say this.
Partisanship: 68% of Democratic teens would rather learn that the legacy of slavery still affects the position of Black people today. In turn, most Republican teens (60%) say they would prefer to learn that slavery does not affect the position of Black people today.
A sizeable share of teens (48%) say they should not learn about gender identity in school.
A quarter say they would rather learn that whether someone is a boy or a girl can be different from the sex they were assigned at birth.
A similar share (26%) say they would prefer to learn that whether someone is a boy or a girl is determined by the sex assigned at birth.
These views differ by partisanship. About four-in-ten Democratic teens (42%) say they would rather learn in school that a person’s gender can be different from their sex at birth. By comparison, 8% of Republican teens say this.
Republican teens are about twice as likely as Democratic teens to say they’d rather learn that a person’s gender is determined by their sex at birth (35% vs. 18%).
A majority of Republican teens (56%) don’t think they should learn about this topic in school.
4. Public views on parents opting their children out of learning about race and LGBTQ issues
In a separate survey, we asked Americans if parents should be able to opt their children out of learning about certain topics in school if the way they’re taught conflicts with the parents’ personal views or beliefs.
54% think parents should be able to opt their children out of learning about sexual orientation and gender identity.
34% say the same when it comes to learning about racism and racial inequality.
Republicans and Republican leaners are far more likely than Democrats and Democratic leaners to say that parents should be able to opt their children out of learning about these topics in school:
79% of Republicans say this about LGBTQ issues, compared with 32% of Democrats.
55% of Republicans say this about racism and racial inequality, compared with 16% of Democrats.
Views by race and ethnicity
Similar shares of White adults (36%) and Hispanic adults (34%) say parents should be able to opt their children out of learning about topics related to racism or racial inequality. Among Black and Asian adults, the shares are smaller (about a quarter each).
Views on whether parents should be able to opt their children out of learning about sexual orientation or gender identity don’t vary as much by race and ethnicity. But there are wide differences by race and ethnicity among Democrats.
Among Democrats
Black and Hispanic Democrats are more likely than White and Asian Democrats to say that parents should be able to opt their children out of learning about racial inequality and LGBTQ issues in school.
White Democrats are the most likely to say that parents shouldnot be able to opt their children out of learning about racism and racial inequality. About eight-in-ten White Democrats (81%) say this, compared with 70% of Asian Democrats, 65% of Black Democrats and 61% of Hispanic Democrats.
And White Democrats are more likely than Black and Hispanic Democrats to say parents should not be able to opt their children out of learning about sexual orientation and gender identity. Six-in-ten White Democrats say this, compared with 42% of Hispanic Democrats and 34% of Black Democrats. Some 53% of Asian Democrats say parents should not be able to opt their children out – this share it not statistically different from that of White Democrats.
Among Republicans
There are no differences between White and Hispanic Republicans on whether parents should be able to opt their children out from learning about these topics. The numbers of Black and Asian Republicans in the sample are too small to analyze separately.
Acknowledgments
This report is a collaborative effort based on the input and analysis of the following individuals.
Kim Parker, Director of Social Trends Research Juliana Horowitz, Associate Director, Research Luona Lin, Research Associate Rachel Minkin, Research Associate Isabel Goddard, Research Associate Kiley Hurst, Research Analyst Dana Braga, Research Assistant Shannon Greenwood, Digital Production Manager Beshay Sakla, Associate Digital Producer John Carlo Mandapat, Information Graphics Designer Anna Jackson, Editorial Assistant Julia O’Hanlon, Communications Manager Mithila Samak, Communications Associate
In addition, the project benefited greatly from the guidance of the Pew Research Center methodology team: Courtney Kennedy, Andrew Mercer, Ashley Amaya, Dorene Asare-Marfo, Dana Popky, Anna Brown and Arnold Lau.
Methodology
Teacher survey methodology
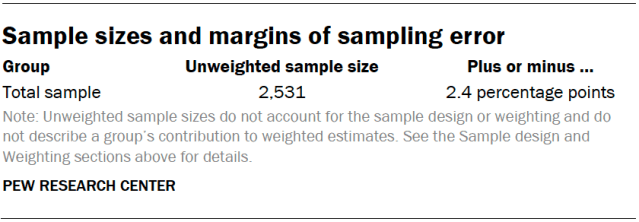
The data in this report comes from a self-administered web survey of K-12 public school teachers in the United States. It was conducted online in English from Oct. 17 to Nov. 14, 2023. Out of 6,357 teachers who were sampled, 191 were screened out as no longer eligible. A total of 2,531 completed the survey, for a completion rate of 41.0%. The margin of sampling error for the full sample of 2,531 teachers is plus or minus 2.4 percentage points. The survey was administered by RAND on its American Teacher Panel, a nationally representative panel of public K-12 teachers.
The American Teacher Panel is recruited through probability-based methods from a commercially available list of U.S. public school teachers. The sampling frame for recruiting teachers to the panel was acquired from MDR Education. It is intended to be as comprehensive as possible, yet likely underrepresents new teachers, or experienced teachers new to a school or district. The American Teacher Panel began in 2014 and currently includes more than 25,000 teachers. Teachers recruited to the American Teacher Panel have agreed to participate in online surveys several times per school year and receive incentives for completing surveys.
Teachers selected to join the American Teacher Panel are first sent an invitation packet via FedEx that includes a prepaid $10 gift card as an incentive. Reminder emails are sent to nonrespondents whose contact information includes an email address. The American Teacher Panel has an overall empanelment rate of 30%. Read additional details about the American Teacher Panel’s design and methodology.
Sample design
The target population for this survey was K-12 public school teachers in the United States. A total of 6,357 teachers were invited to participate in this survey. This includes an initial sample of 5,000 teachers and a supplementary sample of 1,361 teachers that was later drawn to achieve the targeted sample size of 2,500 completed interviews. Because teachers are invited to join the American Teacher Panel at varying rates, each teacher’s probability of selection for this survey was inversely proportional to their estimated probability of membership in the American Teacher Panel. This is done so that each teacher has approximately equal probabilities of having both joined the American Teacher Panel and been selected for this survey.
Data collection protocol
The field period for this survey was Oct. 17-Nov. 14, 2023. After an initial invitation email, nonresponding teachers in the initial sample received up to three reminder emails. Nonrespondents in the supplemental sample received up to two reminder emails.
Weighting
The data was weighted in a multistep process that accounts for multiple stages of sampling and nonresponse that occur at different points in the survey process. Every American Teacher Panel member begins with a design weight that accounts for their initial probability of selection for their recruitment survey. That weight is further calibrated so that the composition of the entire panel aligns with that of the national population of public school teachers based on data from the National Center for Education Statistics on a combination of school and teacher characteristics.
Weighting parameters for the following school-level characteristics are based on the 2021-2022 Common Core of Data (CCD):
School level
School percent free or reduced-price lunch
School percent minority
School size
School locale
Weighting parameters for the following teacher-level characteristics are based on the 2020-2021 National Teacher and Principal Survey (NTPS):
Teacher gender
Teacher race
Teacher experience
Among respondents, this weight is first adjusted to account for each teacher’s probability of selection for this wave. A second adjustment is then applied to account for each respondent’s probability of completing the survey after having been selected. This probability is estimated based on teacher and school characteristics using a model. In a third step, the nonresponse-adjusted weights are once again calibrated so that the composition of the sample aligns with that of the target population based on the weighting parameters listed above. Finally, the weights were trimmed at the 95th percentile to reduce the loss in precision stemming from variance in the weights.
The following table shows the unweighted sample sizes and the error attributable to sampling that would be expected at the 95% level of confidence for different groups in the survey.
Sample sizes and sampling errors for other subgroups are available upon request. In addition to sampling error, one should bear in mind that question wording and practical difficulties in conducting surveys can introduce error or bias into their findings.
School characteristics
The American Teacher Panel includes NCES school ID codes which allowed us to match the teachers surveyed to their school characteristics provided by NCES’s Common Core of Data. Data on the following school characteristics are based on those reported by the NCES: school level (elementary, middle or high), school size, location, poverty level (based on percentage students eligible for free or reduced-price lunch) and student demographics.
School district characteristics
Political leaning of school districts is based on whether the majority of those residing in the school district voted for Republican Donald Trump or Democrat Joe Biden in the 2020 presidential election. Vote shares for each school district from the 2020 general election are calculated using 2020 General Election Results Disaggregated to 2020 Census Blocks Datasets available at the Redistricting Data Hub. This block-level data was aggregated up to the school district level, using block-to-school district relation files from Missouri Census Data Center’s Geographic Correspondence Engine (Geocorr 2022).
Teen survey methodology
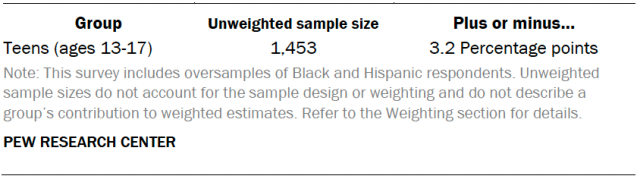
The analysis on teens’ views is based on a self-administered web survey conducted from Sept. 26 to Oct. 23, 2023, among a sample of 1,453 U.S. teens ages 13 to 17. The margin of sampling error for the full sample of 1,453 teens is plus or minus 3.2 percentage points. The survey was conducted by Ipsos Public Affairs in English and Spanish using KnowledgePanel, its nationally representative online research panel.
The research plan for this project was submitted to an external institutional review board (IRB), Advarra, which is an independent committee of experts that specializes in helping to protect the rights of research participants. The IRB thoroughly vetted this research before data collection began. Due to the risks associated with surveying minors, this research underwent a full board review and received approval (Approval ID Pro00073203).
KnowledgePanel members are recruited through probability sampling methods and include both those with internet access and those who did not have internet access at the time of their recruitment. KnowledgePanel provides internet access for those who do not have it and, if needed, a device to access the internet when they join the panel. KnowledgePanel’s recruitment process was originally based exclusively on a national random-digit-dialing (RDD) sampling methodology. In 2009, Ipsos migrated to an address-based sampling (ABS) recruitment methodology via the U.S. Postal Service’s Delivery Sequence File (DSF). The Delivery Sequence File has been estimated to cover as much as 98% of the population, although some studies suggest that the coverage could be in the low 90% range.2
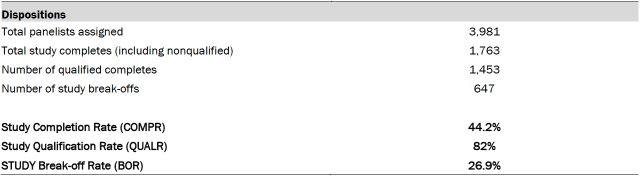
Panelists were eligible for participation in this survey if they indicated on an earlier profile survey that they were the parent of a teen ages 13 to 17. A random sample of 3,981 eligible panel members were invited to participate in the study. Responding parents were screened and considered qualified for the study if they reconfirmed that they were the parent of at least one child ages 13 to 17 and granted permission for their teen who was chosen to participate in the study. In households with more than one eligible teen, parents were asked to think about one randomly selected teen and that teen was instructed to complete the teen portion of the survey. A survey was considered complete if both the parent and selected teen completed their portions of the questionnaire, or if the parent did not qualify during the initial screening.
Of the sampled panelists, 1,763 (excluding break-offs) responded to the invitation and 1,453 qualified, completed the parent portion of the survey, and had their selected teen complete the teen portion of the survey, yielding a final stage completion rate of 44% and a qualification rate of 82%. The cumulative response rate accounting for nonresponse to the recruitment surveys and attrition is 2.2%. The break-off rate among those who logged on to the survey (regardless of whether they completed any items or qualified for the study) is 26.9%.
Upon completion, qualified respondents received a cash-equivalent incentive worth $10 for completing the survey. To encourage response from non-Hispanic Black panelists, the incentive was increased from $10 to $20 on Oct. 5, 2023. The incentive was increased again on Oct. 10, 2023, from $20 to $40; then to $50 on Oct. 17, 2023; and to $75 on Oct. 20, 2023. Reminders and notifications of the change in incentive were sent for each increase.
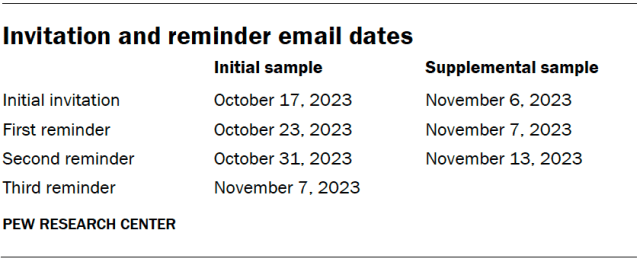
All panelists received email invitations and any non-responders received reminders, shown in the table. The field period was closed on Oct. 23, 2023.
Weighting
The analysis in this report was performed using separate weights for parents and teens. The parent weight was created in a multistep process that begins with a base design weight for the parent, which is computed to reflect their probability of selection for recruitment into the KnowledgePanel. These selection probabilities were then adjusted to account for the probability of selection for this survey which included oversamples of Black and Hispanic parents. Next, an iterative technique was used to align the parent design weights to population benchmarks for parents of teens ages 13 to 17 on the dimensions identified in the accompanying table, to account for any differential nonresponse that may have occurred.
To create the teen weight, an adjustment factor was applied to the final parent weight to reflect the selection of one teen per household. Finally, the teen weights were further raked to match the demographic distribution for teens ages 13 to 17 who live with parents. The teen weights were adjusted on the same teen dimensions as parent dimensions with the exception of teen education, which was not used in the teen weighting.
Sampling errors and tests of statistical significance take into account the effect of weighting. Interviews were conducted in both English and Spanish.
In addition to sampling error, one should bear in mind that question wording and practical difficulties in conducting surveys can introduce error or bias into the findings of opinion polls.
The following table shows the unweighted sample sizes and the error attributable to sampling that would be expected at the 95% level of confidence for different groups in the survey:
Sample sizes and sampling errors for subgroups are available upon request.
Dispositions and response rates
The tables below display dispositions used in the calculation of completion, qualification and cumulative response rates.3
Ipsos delivers affordable, statistically valid online research through KnowledgePanel®. KnowledgePanel is the first and largest online research panel that is representative of the entire U.S. population. Panel members are randomly recruited through probability-based sampling, and households are provided with access to the Internet and hardware if needed.
Ipsos recruits panel members using address-based sampling (ABS) methods to ensure full coverage of all households in the nation. Once household members are recruited for the panel and assigned to a study sample, they are notified by email for survey taking, or panelists can visit their online member page for survey taking (instead of being contacted by telephone or postal mail). This allows surveys to be fielded quickly and economically. In addition, this approach reduces the burden placed on respondents, since email notification is less intrusive than telephone calls and the self-administered mode minimizes social desirability bias and positivity effects that can be present with an interviewer. Many respondents find answering online questionnaires more interesting and engaging than being questioned by a telephone interviewer. Furthermore, respondents have the convenience to choose what day and time to complete their assigned survey.
KnowledgePanel provides probability-based samples with an “organic” representation of the study population for measurement of public opinions, attitudes and behaviors. The panel was first developed in 1999 by Knowledge Networks, an Ipsos company. Panel members are randomly selected so that survey results can properly represent the U.S. population with a measurable level of accuracy and a calculable response rate, features that are not obtainable from nonprobability or opt-in online panels.
KnowledgePanel’s recruitment process was originally based exclusively on a national random-digit dial (RDD) sampling methodology. In 2009, in light of the growing proportion of cellphone-only households, Ipsos migrated to an ABS recruitment methodology via the U.S. Postal Service’s Delivery Sequence File. ABS not only improves population coverage, but also provides a more effective means for recruiting hard-to-reach individuals, such as cellphone-only households, non-internet households, young adults and persons of color. Households without an internet connection are provided with a web-enabled device and free internet service.
After initially accepting the invitation to join the panel, participants are asked to complete a short demographic survey (the initial Core Profile Survey); answers to this survey allow efficient panel sampling and weighting for future surveys. Upon completing the Core Profile Survey, participants become active panel members. All panel members are provided privacy and confidentiality protections.
Adults from sampled households are invited to join KnowledgePanel through a series of mailings, including an initial invitation letter, a reminder postcard and a subsequent follow-up letter. Moreover, telephone refusal-conversion calls are made to nonresponding households for which a telephone number could be matched to a physical address. Invited households can join the panel by:
Completing and mailing back a paper form in a postage-paid envelope
Calling a toll-free hotline phone number maintained by Ipsos
Going to a designated Ipsos website and completing the recruitment form online
KnowledgePanel LatinoSM recruitment
In 2008, KnowledgePanel LatinoSM was developed to provide researchers with the capability to conduct representative online surveys with U.S. Hispanics, including both English- and Spanish-dominant Hispanics. With the advent of KnowledgePanel Latino, the first U.S. online panel representative of Hispanics was established to include those without internet access and those who only speak Spanish. Hispanic members recruited through KnowledgePanel’s traditional ABS sampling methodology described above are supplemented with recruitment using a custom dual-frame RDD sampling methodology targeting telephone exchanges associated with census blocks that have a 65% or greater Latino population density (this density level covers just over 50% of the U.S. Hispanic population). Moreover, cellular numbers from rates centers with high concentration of Hispanics are also used to improve the representation of samples. With this telephone recruitment, households are screened in the Spanish language to only recruit those homes where Spanish is spoken at least half the time.
Household member recruitment
During the initial recruitment survey, all household members are enumerated. Following enumeration, attempts are made to recruit every household member who is at least 13 years old to participate in KnowledgePanel surveys. For household members ages 13 to 17, consent is collected from the parents or the legal guardian during the initial recruitment interview. No direct communication with teenagers is attempted before obtaining parental consent.
Survey sampling from KnowledgePanel
Once panel members are recruited and profiled by completing KnowledgePanel’s Core Profile Survey, they become eligible for selection for client surveys. Typically, specific survey samples are based on an equal probability selection method (EPSEM) for general population surveys. Customized stratified random sampling based on “profile” data can also be implemented as required by the study design. Profile data can also be used when a survey calls for pre-screening – that is, members are drawn from a subsample of the panel, such as females, Republicans, grocery shoppers, etc. (This can reduce screening costs, particularly for lower incidence subgroups.) In such cases, Ipsos ensures that all subsequent survey samples drawn that week are selected in such a way as to result in a sample that remains representative of the population distributions.
As detailed above, significant resources and infrastructure are devoted to the recruitment process for KnowledgePanel so that its active panel members can properly represent the adult population of the United States. This representation is achieved not only with respect to a broad set of geodemographic indicators, but also for hard-to-reach adults (such as those without internet access or Spanish-language-dominant Hispanics) who are recruited in proper proportions. Consequently, the raw distribution of KnowledgePanel mirrors that of the U.S. adults fairly closely, barring occasional disparities that emerge for certain subgroups due to differential recruitment and attrition.
For selection of general population samples from KnowledgePanel, a patented methodology has been developed such that samples from the panel behave as EPSEM samples. Briefly, this methodology starts by weighting the pool of active members to the geodemographic benchmarks secured from a combination of the U.S. Census Bureau’s American Community Survey (ACS) and the latest March supplement of the Census Bureau’s Current Population Survey (CPS) along several dimensions. Typically, the geodemographic dimensions used for weighting the entire KnowledgePanel include the following dimensions, with additional nesting of dimensions as well:
Gender (male/female)
Age (18 to 29, 30 to 44, 45 to 59, and 60+)
Race/Hispanic ethnicity (White/non-Hispanic, Black/non-Hispanic, Other or 2+ races/non-Hispanic, Hispanic)
Education (less than high school, high school, some college, bachelor’s and beyond)
Census Region (Northeast, Midwest, South, West)
Household income (under $10,000, $10,000 to $24,999, $25,000 to $49,999, $50,000 to $74,000, $75,000 to $99,999, $100,000 to $149,999, and $150,000+)
Home ownership status (own, rent/other)
Household size (1, 2, 3, 4+)
Metropolitan area (yes, no)
Hispanic origin (Mexican, Puerto Rican, Cuban, other, non-Hispanic)
Language dominance (non-Hispanic and English dominant, bilingual, and Spanish dominant Hispanic) when survey is administered in both English and Spanish
Using the resulting weights as measures of size, a probability-proportional-to-size (PPS) procedure is used to select study specific samples. It is the application of this PPS methodology with the imposed size measures that produces demographically balanced and representative samples that behave as EPSEM. Moreover, in instances where a study design requires any form of oversampling of certain subgroups, such departures from an EPSEM design are accounted for by adjusting the design weights in reference to the census benchmarks for the population of interest.
Survey administration
Once assigned to a survey, members receive a notification email letting them know there is a new survey available for them to complete. This email notification contains a link that sends them to the survey. No login name or password is required. The field period depends on the client’s needs and can range anywhere from a few hours to several weeks.
Typically, after three days, automatic email reminders are sent to all nonresponding panel members in the sample. Additional email reminders are sent and custom reminder schedules are set up as needed. To assist panel members with their survey taking, each individual has a personalized member portal listing all assigned surveys that have yet to be completed.
Ipsos also operates an ongoing modest incentive program to encourage participation and create member loyalty. The incentive program includes special raffles and sweepstakes with both cash rewards and other prizes to be won. On average, panel members complete three to four surveys per month with durations of about 10 to 15 minutes per survey. An additional incentive is usually provided for longer surveys.
Response rates
As a member of the American Association of Public Opinion Research (AAPOR), Ipsos follows the AAPOR standards for response rate reporting. While the AAPOR standards were established for single survey administrations and not for multistage panel surveys, Ipsos uses the Callegaro-DiSogra (2008) algorithms for calculating KnowledgePanel survey response rates.
Omnibus survey completion rates
The field period and completion and qualification rates for this survey are presented below:
Data Processing to Ensure Data Quality
Respondents are unable to complete the survey more than once (after completing the survey one time, respondents no longer have access to the survey). All respondents were considered eligible. No interviews were dropped. Data were imputed for demographics used in weighting if the respondent declined to answer. Ipsos did not conduct any additional data imputation for this survey.
Survey Cooperation Enhancements
As standard with KnowledgePanel surveys, email reminders were sent to non-responders on Day 3 of the field period. Additional reminders were sent to any remaining non-responders on Days 5 and 7 of the field period.
Upon completion of the survey, qualified respondents received a cash-equivalent incentive based on their sample classification and when they completed the survey.
Limitations of the Design and Data Collection
All forms of public opinion research are subject to unmeasured error that cannot be eliminated. When a probability-based panel like KnowledgePanel is used, Ipsos employs the total survey error approach to identify and minimize error due to coverage error, sampling error, nonresponse error, measurement error, and data processing and editing error. Coverage error is addressed in KnowledgePanel recruitment strategies. Sampling error is addressed in recruitment and at the time of sample selection for each study. Nonresponse error is reduced in recruitment, study sampling, panel management strategies (including communication, incentive, and retention protocols), and weighting of the final data. These strategies support the computation of sampling error to estimate the extent to which the results from the sample might differ from population values. To reduce measurement error, Ipsos research staff evaluates questionnaires in terms of item flow, wording, and response formats to provide respondent-friendly surveys and elicit high-quality data. Additionally, Ipsos conducts a quality control review of data processing steps and any data cleaning to minimize errors.
Once all survey data have been collected and processed, design weights are adjusted to account for any differential nonresponse that may have occurred. Depending on the specific target population for a given study, geodemographic distributions for the corresponding population are obtained from the CPS, the U.S. Census Bureau’s American Community Survey (ACS), or in certain instances from the weighted KnowledgePanel profile data. For this purpose, an iterative proportional fitting (raking) procedure is used to produce the final weights. In the final step, calculated weights are examined to identify and, if necessary, trim outliers at the extreme upper and lower tails of the weight distribution. The resulting weights are then scaled to aggregate to the total sample size of all eligible respondents.
For this study, the following benchmark distributions of U.S. adults age 18 and over from the 2023 CPS were used for the raking adjustment of weights:
Gender (male, female) by Age (18 to 29, 30 to 44, 45 t0 59, and 60+)
Race/Hispanic ethnicity (White/non-Hispanic, Black/non-Hispanic, Other or 2+ Races/non-Hispanic, Hispanic)
Education (high school graduate or less, some college, bachelor’s and beyond)
Census region (Northeast, Midwest, South, West)
Metropolitan status (Metro, non-Metro)
Household income (Less than $24,999, $25,000 to $49,999, $50,000 to $74,999, $75,000 to $99,999, $100,000 to $149,999, $150,000+)
Race Ethnicity (White or Other, Black, Hispanic) by Gender (male, female)
Race Ethnicity (White or Other, Black, Hispanic) by Age (18-44, 45+)
Race Ethnicity (White or Other, Black, Hispanic) by Education (less than college, bachelor’s or higher)
Technically a margin of sampling error (MOSE) is survey- and estimate-specific. It is affected by the survey estimate (point estimate, proportion, mean, etc.), the number of cases, and the unequal weighting effect (often called a design effect). Here we provide the MOSE at the 95% confidence level for a point estimate equal to 50% (when the MOSE is at its widest) and when all respondents are accounted for.
weight: 1.10 design effect, 1.4% MOSE (95% level)
* Margin of error is inclusive of the design effect.