In a Growing Share of U.S. Marriages, Husbands and Wives Earn About the Same
Even when earnings are similar, husbands spend more time on paid work and leisure, while wives devote more time to caregiving and housework
Pew Research Center conducted this study to better understand the role women and men play as economic providers in opposite-sex marriages and how this relates to the way spouses divide their time between paid work, leisure, caregiving and housework. We also looked at public attitudes about gender roles in marriages today to put the findings in a broader context.
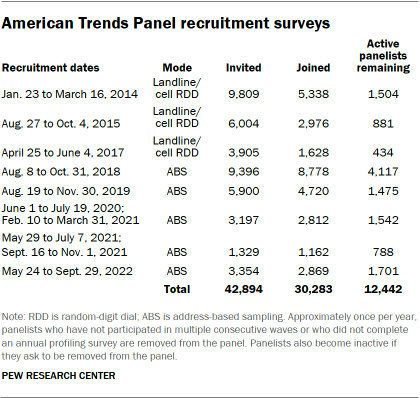
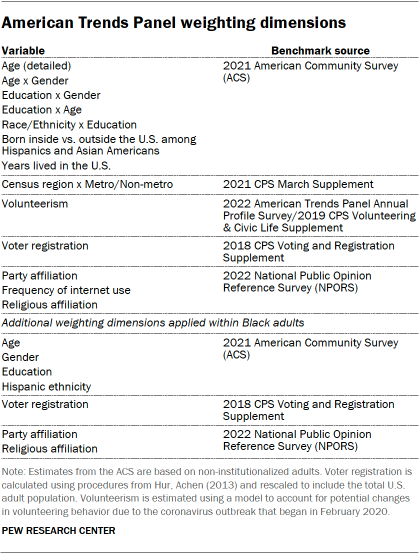
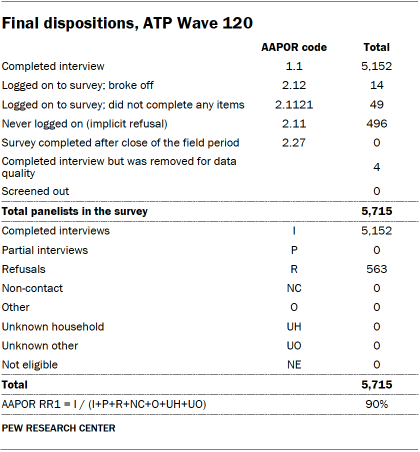
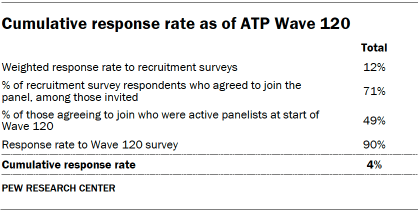
The analysis in this report is based on three separate data sources. The earnings data comes from the Annual Social and Economic Supplement of the U.S. Census Bureau’s Current Population Survey. The findings on hours devoted to paid work, household responsibilities and leisure are based on data from the American Time Use Survey. The data on public attitudes was collected as part of a larger Center survey of 5,152 U.S. adults conducted Jan. 18-24, 2023. Everyone who took part in the latter is a member of Pew Research Center’s American Trends Panel (ATP), an online survey panel that is recruited through national, random sampling of residential addresses. This way nearly all U.S. adults have a chance of selection. The survey is weighted to be representative of the U.S. adult population by gender, race, ethnicity, partisan affiliation, education and other categories. Read more about the ATP’s methodology.
Read more about the survey questions used for this report and the report’s methodology.
A wife sole breadwinner couple refers to a marriage in which the wife has positive earnings, and the husband has no earnings.
A wife primary breadwinner couple refers to a marriage in which the wife earns more than 60% of the couple’s combined earnings, and the husband has earnings.
In an “egalitarian marriage,” both the wife and husband earn between 40% and 60% of the couple’s combined earnings.
A husband primary breadwinner couple refers to a marriage in which the husband earns more than 60% of the couple’s combined earnings, and the wife has earnings.
A husband sole breadwinner couple refers to a marriage in which the husband has positive earnings, and the wife has no earnings.
A breadwinner wife marriage refers to a marriage with a wife who is the sole or primary provider.
A breadwinner husband marriage refers to a marriage with a husband who is the sole or primary provider.
References to White, Black and Asian Americans include only those who are not Hispanic and identify as only one race. Hispanics are of any race.
References to college graduates or people with a college degree comprise those with a bachelor’s degree or more. “Some college” includes those with an associate degree and those who attended college but did not obtain a degree.
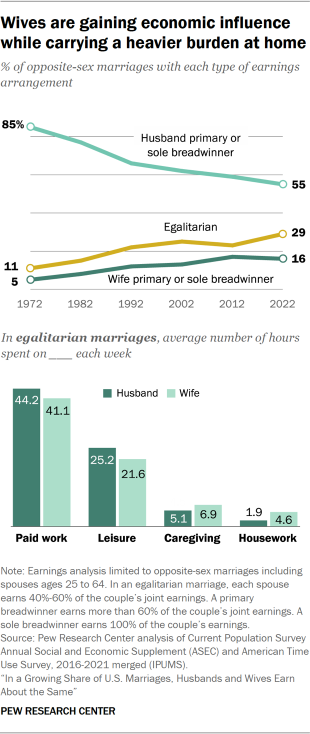
Among married couples in the United States, women’s financial contributions have grown steadily over the last half century. While men remain the main breadwinner in a majority of opposite-sex marriages, the share of women who earn as much as or significantly more than their husband has roughly tripled over the past 50 years.
In 29% of marriages today, both spouses earn about the same amount of money. Just over half (55%) of marriages today have a husband who is the primary or sole breadwinner and 16% have a breadwinner wife.
Even as financial contributions have become more equal in marriages, the way couples divide their time between paid work and home life remains unbalanced. Women pick up a heavier load when it comes to household chores and caregiving responsibilities, while men spend more time on work and leisure.
This is true in egalitarian marriages – where both spouses earn roughly the same amount of money – and in marriages where the wife is the primary earner. The only marriage type where husbands devote more time to caregiving than their wives is one in which the wife is the sole breadwinner. In those marriages, wives and husbands spend roughly the same amount of time per week on household chores.
The five basic marriage types:
- Wife is the sole breadwinner: The wife has positive earnings; husband has no earnings.
- Wife is the primary breadwinner: The wife earns more than 60% of the couple’s combined earnings (and the husband has earnings).
- Egalitarian marriage: Both the wife and husband earn between 40% and 60% of the couple’s combined earnings.
- Husband is the primary breadwinner: The husband earns more than 60% of the couple’s combined earnings (and the wife has earnings).
- Husband is the sole breadwinner: The husband has positive earnings; wife has no earnings.
As a backdrop to all of this, a majority of Americans say that society values men’s contributions at work more than their contributions at home. Only 7% say society values men’s contributions at home more than those at work, and 35% say these contributions are valued about equally. When it comes to women, about half of adults (49%) say the contributions women make at work and at home are valued about equally. Some 31% say women’s contributions at home are valued more than what they do at work, and 20% say just the opposite.
Jump to:
These findings come from a new Pew Research Center survey and analysis of government data. The nationally representative survey of 5,152 U.S. adults was conducted Jan. 18-24, 2023, using the Center’s American Trends Panel.1 The analysis of government data about opposite-sex married couples is based on data from the U.S. Census Bureau and the American Time Use Survey.2 Here are some of the key findings:
- Far fewer husbands are the sole breadwinner in their marriage these days. The share of marriages where the husband is the primary or sole breadwinner has fallen steadily in recent decades, driven mainly by the declining share of marriages where the husband is the sole provider – this was the arrangement in 49% of marriages in 1972, while today that share is 23%.
- Breadwinner wives are still in the minority. Relatively few marriages (6%) have a wife who is the sole breadwinner, and wives are the primary breadwinners in 10% of marriages today. The share of marriages where the wife is the sole or primary breadwinner has increased from 5% in 1972 to 16% today.
- Earnings arrangements within marriages differ by demographics. Among wives overall, Black women, those with a four-year college degree, those ages 55 to 64 and those with no children are among the most likely to be the breadwinner in their marriage.
- In egalitarian and breadwinner wife marriages, husbands spend considerably more time on leisure activities than wives. Husbands in egalitarian marriages spend about 3.5 hours more per week on leisure activities than wives do. Wives in these marriages spend roughly 2 hours more per week on caregiving than husbands do and about 2.5 hours more on housework. In marriages where wives are the primary earners, husbands’ leisure time increases significantly (compared with egalitarian marriages), while the time they spend on caregiving and housework stays about the same. When wives are the sole earners, the amount of time husbands spend on caregiving and housework does tick up somewhat.
- The public thinks married men and women have different ideas about which spouse should earn more money. About half of Americans (48%) say most men who are married to a woman would prefer that they earn more than their wife. Only 3% say most men want a wife who earns more than they do, and 13% say most men would prefer that they and their spouse earn about the same. The public has mixed views about what most women would prefer: 22% say most women want a husband who earns more than they do, 26% say most would want to earn about the same as their husband, and only 7% say most women want to earn more than their spouse.
- When it comes to what’s best for kids, most Americans think both parents should be equally focused on work and home. A 77% majority say that, when children are being raised by a mother and a father, they are better off if both parents focus equally on their job or career and on taking care of the children and the home. Some 19% say kids are better off if the mom focuses more on home and the dad focuses more on work; only 2% say a dad focused on home and a mom focused on work is ideal.
The earnings landscape of marriages today
Women are contributing an ever-greater share of married couples’ economic resources. In 2022, 16% of opposite-sex marriages had wives who were the sole or primary breadwinners, roughly triple the share from 50 years earlier (5%). Wives were the primary family provider, meaning they earned more than 60% of the couple’s combined earnings, in 10% of marriages in 2022, up from 3% of marriages in 1972. Wives were the sole earners in 6% of these marriages, compared with 2% 50 years earlier.
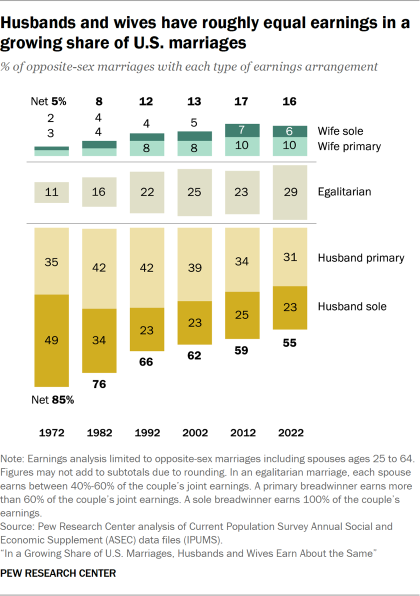
Marriages in which husbands and wives are roughly equal contributors, meaning they each make between 40% and 60% of the couple’s combined earnings, have also increased substantially. Today 29% of marriages are egalitarian, up from only 11% in 1972.
As women’s financial contributions have increased, the share of marriages in which the husband is the main breadwinner has declined. Today, 55% of marriages have a husband who is the primary or sole contributor to the couple’s earnings. Fifty years ago, husbands were the breadwinner in 85% of marriages.
From the 1970s to the 1990s, the decline in the share of marriages with breadwinner husbands was due entirely to the falling share of marriages in which the husband was the sole provider. From 1972 to 1992, this share fell from 49% to 23%, and it has remained at roughly the same level since then.
From the 1990s until today, the falloff in the share of marriages with a breadwinner husband has been driven by a decline in marriages where the husband is the primary provider (from 42% in 1992 to 31% in 2022).
The sharp drop in the share of marriages with a husband as the sole provider during the first two decades occurred as married women streamed into the labor force. Married women’s labor force participation peaked around 2000 and has since modestly declined.
Breadwinner status of husbands and wives differs by demographics
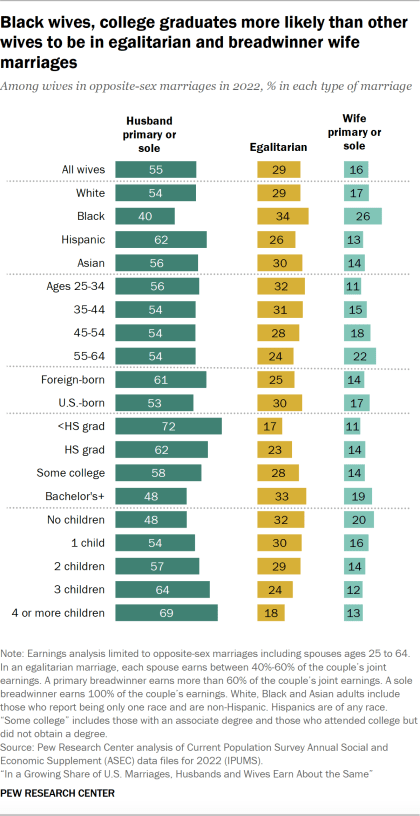
Overall, 16% of opposite-sex marriages have a breadwinner wife, but some wives are more likely than others to fall into this category. The likelihood varies by the wife’s education and race and ethnicity, as well as other characteristics.
Wives with more formal education are more likely to out-earn their husbands. Nearly one-in-five wives (19%) who have completed at least a bachelor’s degree are the sole or primary breadwinner in their marriage. In comparison, 11% of wives who have not completed a high school diploma are breadwinners. Some 72% of these wives are married to a breadwinner husband (versus 48% of wives with at least a bachelor’s degree).
Relatedly, a wife’s education compared with her husband’s education is correlated with breadwinner status. In 2022, the wife was the breadwinner in 25% of the marriages in which she had more education than her husband, compared with only 11% of marriages in which she had less education than her husband.
The growing share of marriages in which the wife has more education than her husband is likely contributing to the growth of breadwinner wife marriages. Today, 24% of marriages have a wife with more education than her husband, up from 19% in 1972.
Black wives are significantly more likely than wives from other racial or ethnic groups to be the breadwinner in their marriage. This was also the case in 1972. Today, roughly one-in-four Black wives (26%) out-earn their husbands.
Smaller shares of White (17%), Asian (14%) and Hispanic (13%) wives are the breadwinner in their marriage. Hispanic wives are more likely than wives from other racial and ethnic groups to be married to a breadwinner husband (62% have this earnings arrangement). Women who were born in the U.S. (17%) are more likely to out-earn their husbands than are foreign-born wives (14%).
There are also differences by age, with younger wives less likely than older wives to be the breadwinner, a pattern found in previous research. Among wives ages 25 to 34, 11% are the breadwinner in their marriage, whereas 22% of wives ages 55 to 64 out-earn their husbands. Younger wives may be more likely to have very young children, which can negatively impact their earnings. In addition, earnings tend to rise with age and labor market experience, and wives are much more likely to be the breadwinner in their marriage as their earnings increase. Among wives who earn less than $25,000 annually, just 5% are the breadwinner in the marriage. By contrast, 43% of wives who earn $100,000 or more are the breadwinner in their marriage.
Married mothers with children in the household are less likely to be the breadwinner than those without children: 20% of wives without children out-earn their husbands, compared with 15% of wives with one or more children at home. Among married couples with four or more children in the household, 13% have wives who out-earn their husbands while 69% have a husband who is the sole or primary provider.
Declining family size may be part of the explanation for the growing share of breadwinner wives from 1972 to 2002. The average number of children in married households fell from 1.9 in 1972 to 1.3 in 2002. Family size in households with opposite-sex married spouses has not declined since 2002. In 2022, the average married women had 1.4 children in her household.
The demographic patterns in egalitarian marriages are similar to those in breadwinner wife couples. Married Black women, wives with a bachelor’s degree or more education and those with fewer children at home are among the most likely to be in egalitarian marriages. The age patterns are different, however. Older wives are less likely than younger wives to be in an egalitarian marriage (while they are more likely than younger wives to be in a breadwinner wife marriage).
Median earnings vary across different types of marriages
Across all opposite-sex marriages in 2022, the median earnings for wives were $35,000 while husbands earned a median of $65,000.3
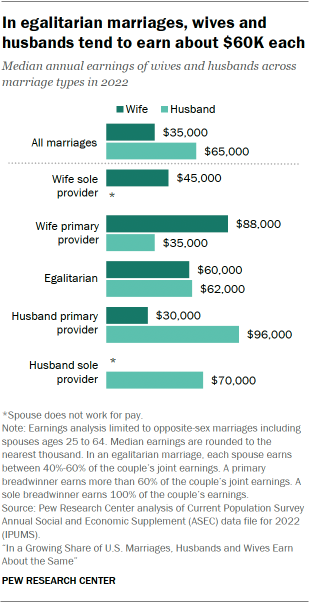
By definition, in egalitarian marriages, spouses’ earnings are similar to one another. Today, wives in egalitarian marriages earn $60,000 at the median, while husbands earn $62,000.
In marriages where the husband is the primary provider, wives earn a median of $30,000 annually. This translates into 31% of husbands’ median earnings of $96,000 in these marriages.
When the wife is the primary provider, her earnings are somewhat lower than when the husband is the primary provider – about $88,000 a year. In these marriages, the husband’s median earnings are roughly $35,000, around 40% of the wife’s earnings.
As the share of women in egalitarian and breadwinner wife marriages has increased substantially since 1972, wives’ relative earnings contributions within those types of marriages have also increased. For example, in 1972, wives in egalitarian marriages earned about 89% of the amount their husbands earned. Today their earnings are almost identical (97% of their husband’s earnings).

Dual-earner marriages have the highest income
Household economic well-being is often measured by household income and poverty. After adjusting for household size, marriages in which both spouses work tend to have much higher incomes than marriages with a sole provider. Marriages with either the wife or husband as the primary provider and those that are egalitarian had a median household income of roughly $135,000 to $145,000 in 2022.4 Marriages with a sole earner lagged far behind at around $75,000. Poverty rates paint a similar picture; they are much higher for sole-earner marriages compared with dual-earner marriages (7% and 9% for husband and wife sole-provider marriages, respectively, versus only 1% in dual-earner marriages).
Time allocation across marriage types
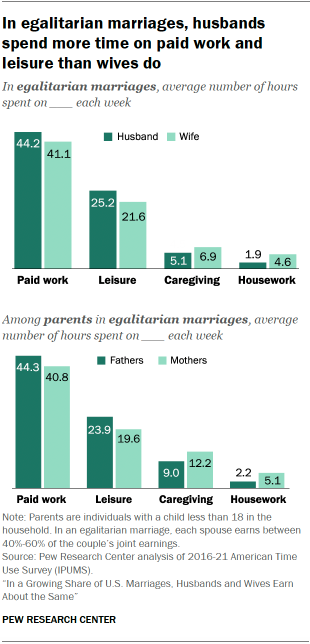
While wives’ financial contributions have grown significantly over the years, there remains an imbalance in the way leisure time, housework and caregiving are divided within couples – even in marriages that are considered egalitarian in terms of earnings. An analysis using the American Time Use Survey shows that husbands in egalitarian marriages spend more time on paid work per week than wives do (44.2 hours vs. 41.1, on average). They also spend more time in activities related to leisure, such as socializing or relaxing (25.2 hours vs. 21.6).
In contrast, wives in egalitarian marriages dedicate more hours to responsibilities at home than their husbands do. On average, these wives spend 6.9 hours taking care of individuals in the household and 4.6 hours doing housework per week, while husbands spend roughly 5 and 2 hours on these activities, respectively.
Time spent on caregiving is mainly driven by parents with children younger than 18 in the home. Among parents in egalitarian marriages, wives spend 12.2 hours on caregiving per week on average, compared with 9 hours for husbands. Husbands and wives who don’t have children at home spend less than an hour per week on caregiving.
Gender disparities in time use remain when wives are breadwinners
The gender imbalance in time spent on caregiving persists, even in marriages where wives are the breadwinners. Women who are the primary earner in their marriage spend slightly more time than husbands on paid work, and they have considerably less leisure time.

On average, wives in these marriages spend 42 hours per week on paid work, while husbands spend 40.4 hours per week. These wives spend only 21.1 hours a week on leisure activities. By comparison, husbands whose wives are the primary earner spend about 9 hours more per week on leisure (29.9 hours).
Husbands in these marriages spend 5 hours on caregiving each week, on average, compared with 6.4 hours spent by wives. These husbands also spend less time on housework than wives do (2.8 hours vs. 4.8).
Among parents in marriages where the wife is the primary earner, mothers spend about 13 hours on caregiving activities compared with an average of 8.9 spent by fathers.
In marriages where the wife is the sole breadwinner, wives spend about 40 hours per week on paid work. Husbands in these marriages have more leisure time than husbands in any other type of arrangement – spending 47.2 hours per week on leisure activities. There are no significant differences in time husbands and wives spend on housework, but husbands spend more time on caregiving. This is the only type of marriage where husbands spend more time than their wives caring for others in the household (6.1 hours vs. 4.1).
When there are children in the household, fathers in these marriages carry a much heavier caregiving load. They spend roughly 14 hours on caregiving, compared with 8.4 hours for mothers.
When husbands are the breadwinner, gender gap in time spent on caregiving and housework widens
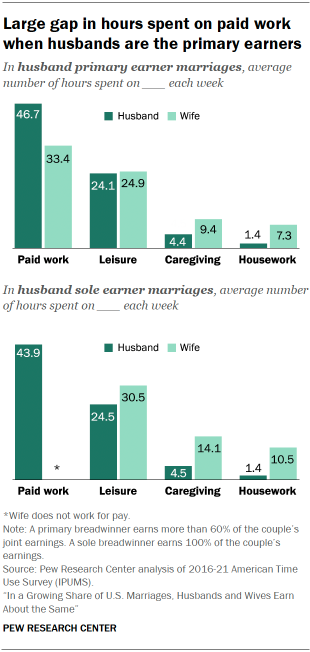
When husbands are the primary providers, they spend considerably more hours working for pay than wives do (46.7 hours per week, on average, compared with 33.4 for wives). Couples in these marriages spend roughly the same amount of time on leisure per week, but women do considerably more caregiving and housework. Wives spend an average of 9.4 hours per week on caregiving (compared with 4.4 hours for husbands), and they spend 7.3 hours on housework (vs. 1.4 hours for husbands).
In marriages where husbands are the sole breadwinner and wives are not contributing any earnings, the gap in time spent on caregiving and leisure is wider. Husbands in these marriages spend 43.9 hours per week, on average, working for pay. Wives spend more time on leisure activities in these marriages than husbands do (30.5 hours vs. 24.5). And wives also spend much more time on caregiving (14.1 vs. 4.5) and housework (10.5 vs. 1.4).
Among parents, when fathers are the primary earner, mothers spend 15.8 hours taking care of people at home, while fathers spend 7.4 hours on these activities. When fathers are the sole earner in the marriage, mothers dedicate roughly 20 hours to care activities versus 6.6 hours that fathers spend.
Public views on gender roles in marriages
Even as egalitarian marriages and marriages where a woman is the primary earner become more common, public views about what husbands and wives would prefer when it comes to their respective earnings paint a more nuanced picture. About half of Americans (48%) say most men in an opposite-sex marriage would prefer to earn more money than their wife. A quarter of Americans say they think most husbands would have no preference as to who earns more, and smaller shares say they think men would prefer to earn about the same as their wife (13%) or to have a wife who earns more (3%).

When it comes to what the public sees as women’s preferences, about a quarter of adults (26%) say they think most women would prefer that they and their husband earn about the same amount of money. A slightly smaller share (22%) say they think most wives would prefer that their husband earn more than they do. Only 7% say they think most women would prefer to make more money than their husband, and a third say they don’t think women would have any preference.
Men and women have somewhat different views on all of this. Women are more likely than men to say they think most husbands would want to earn more than their wives do – 52% of women say this, compared with 43% of men. And men are more likely than women to say they don’t think most husbands would have a preference (31% vs. 20%). With regard to wives’ preferences, a greater share of women than men say most wives would prefer to earn about the same as their husband does (30% vs. 21%).
Majority of adults say society values men’s contributions at work more than their contributions at home
More than half of U.S. women are in the labor force and an even higher share of mothers with children younger than 18 are working these days. When asked about how women’s contributions are valued by society, 49% of adults say society values what women do at work and at home equally. Roughly three-in-ten adults (31%) say society values the contributions women make at home more, which is larger than the share saying society places more value on their contributions at work (20% say this).

These views differ by gender. Women are more likely than men to say that their home contributions are valued more by society (35% vs. 26%), whereas men are more likely to say society values work and home contributions by women equally (55% of men say this vs. 44% of women).
When asked about the contributions men make to society, more than half of U.S. adults (57%) say what men do at work is valued more than the contributions they make at home (only 7% say this). About a third of adults (35%) say men’s contributions at work and at home are valued about equally.
For both questions, there are differences in viewpoint by age and political party. Younger Americans are the most likely to say the contributions women make at home are valued more – half of those younger than 30 say this, versus 35% of those ages 30 to 49 and 20% of those 50 and older. In turn, older Americans are more likely to say society values women’s contributions at home and work equally – 59% of adults ages 50 and older say this, compared with 45% of adults 30 to 49 and 31% of those younger than 30. Relatedly, younger adults are more likely to say men’s contributions at work are more valued by society than their contributions at home, and older adults are more likely to say men’s contributions are valued equally.
Republicans and those who lean towards the GOP are more likely than Democrats and Democratic leaners to say the contributions women make at home and at work are equally valued by society (54% vs. 43%), while Democrats are more likely than Republicans to say the contributions women make at home are valued more (39% vs. 22%).
Most adults say children are better off when their mother and father both focus equally on work and home life

The way working parents divide their time between work and family life has implications for their children. Most Americans (77%) say children are better off when their mother and father both focus equally on their job and taking care of the home.5 About one-in-five Americans (19%) say children are better off when the father focuses more on his job and the mother focuses more on the home and child care. Only 2% of Americans say children are better off when the mother concentrates more on her job while the father takes care of the home responsibilities.
There are slight differences in viewpoint on this question by gender. Men are more likely than women to say children are better off when fathers focus on their job and mothers focus more on the children and the home (23% vs. 16%). Still, majorities of men and women say children are better off when both mothers and fathers focus equally on their job and home responsibilities (73% of men say this vs. 80% of women).
Additionally, there are notable differences by political party. A large share of Democrats and Democratic leaners (85%) say it’s better if both the mother and father focus equally on their job and the home, while 68% of Republicans and GOP leaners say this. About three-in-ten Republicans (28%) say children are better off when the father focuses more on his career and the mother focuses more on child care and the home.