More Than Twice as Many Americans Support Than Oppose the #MeToo Movement
Most say that, compared with five years ago, those who commit sexual harassment or assault at work are more likely to be held responsible and those who report it are more likely to be believed
Pew Research Center conducted this study to better understand Americans’ views about the #MeToo movement and the impact they think the movement has had on the workplace five years after the hashtag went viral.
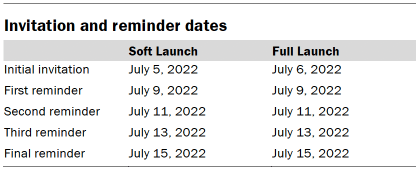
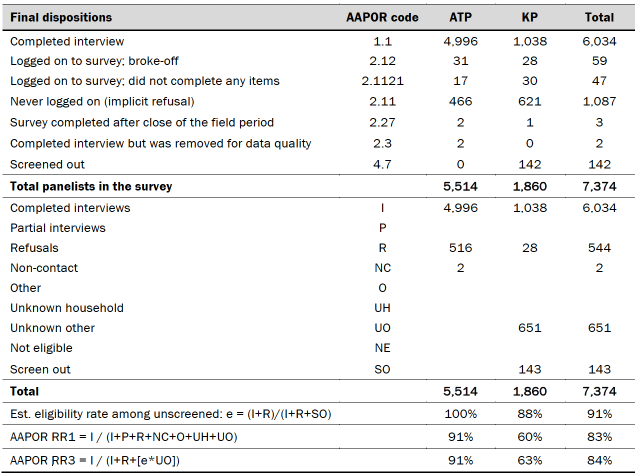
This analysis is based on a survey of 6,034 U.S. adults. The data was collected as a part of a larger survey conducted July 5-17, 2022. Everyone who took part is a member of the Center’s American Trends Panel (ATP), an online survey panel that is recruited through national, random sampling of residential addresses. This way, nearly all U.S. adults have a chance of selection. The survey is weighted to be representative of the U.S. adult population by gender, race, ethnicity, partisan affiliation, education and other categories. Read more about the ATP’s methodology. Here are the questions used for this report, and its methodology.
All references to party affiliation include those who lean toward that party. Republicans include those who identify as Republicans and those who say they lean toward the Republican Party. Democrats include those who identify as Democrats and those who say they lean toward the Democratic Party.
References to White and Black adults include only those who are not Hispanic and identify as only one race. Hispanics are of any race.
Five years after the “MeToo” hashtag went viral, about half of Americans who have heard of the movement express support for it, while 21% say they oppose it, according to a Pew Research Center survey conducted this summer. There are wide partisan gaps in these views, with Democrats roughly three times as likely as Republicans to support the #MeToo movement.
The movement was founded by activist Tarana Burke, who coined the term “MeToo” in 2006, but it gained widespread attention in 2017 when actress Alyssa Milano urged victims of sexual harassment and assault to share their stories on social media. Millions did so, and in the years that followed, hundreds of powerful men lost their jobs or roles after accusers alleged that they had been victims of harassment or assault by these men in the workplace.
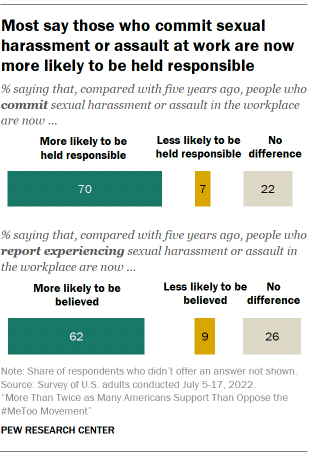
As the five-year anniversary of #MeToo approaches, Americans see some changes in how sexual harassment and assault are handled in the workplace. Seven-in-ten U.S. adults – including majorities across demographic groups and partisan lines – say that, compared with five years ago, people who commit sexual harassment or assault in the workplace are now more likely to be held responsible for their actions. And about six-in-ten say that those who report harassment or assault at work are now more likely to be believed. These views are echoed even by a majority of those who oppose the #MeToo movement overall.
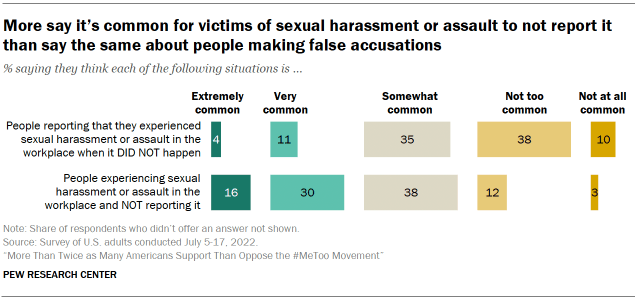
Overall, relatively few Americans say that false reporting of incidents of sexual harassment or assault in the workplace are common, but close to half (46%) say it’s extremely or very common for those who have had these types of experiences at work to not report them.
The public has mixed views on how the #MeToo movement has affected the ways in which men and women interact at work. More than four-in-ten (46%) say the increased focus on sexual harassment and assault in the last five years has made it harder for men to know how to interact with women in the workplace, while 21% say it’s made it easier and 32% say it hasn’t made much difference. In contrast, similar shares say it’s made it harder (26%) as say it’s made it easier (27%) for women to know how to interact with men in the workplace, and 46% say it hasn’t made much difference. These findings come from a nationally representative survey of 6,034 U.S. adults that was conducted July 5-17, 2022.
About half of the public who has heard of the #MeToo movement say they support it
On the whole, Americans who have heard of the #MeToo movement lean more toward supporting it than opposing it. About half of these adults (49%) say they support the #MeToo movement either strongly or somewhat, compared with 30% who say they neither support nor oppose it and 21% who say they strongly or somewhat oppose it.
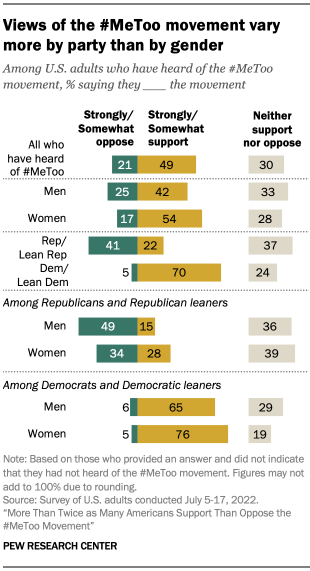
Women who have heard of the movement are more likely than men to say they support the #MeToo movement at least somewhat (54% vs. 42%), but this gap pales in comparison to the difference by political party. Democrats and those who lean toward the Democratic Party are roughly three times as likely as Republicans and GOP leaners to say they support the movement (70% vs. 22%). For their part, Republicans are far more likely than Democrats to express opposition, and to say they neither support nor oppose the #MeToo movement.
Republican and Democratic women who have heard of the #MeToo movement are more likely than their male counterparts to say they support it, though the share of Democratic women who say they favor it is far greater than that of Republican women (76% vs. 28%, respectively).
Young adults ages 18 to 29 who have heard of it are the most likely to support the #MeToo movement (64% say they do), compared with smaller shares of 30- to 49-year-olds (49%), 50- to 64-year-olds (42%) and those 65 and older (41%).
Women younger than 30 particularly stand out: 72% say they support the movement, compared with 52% of men of the same age. No other age group comes close to matching the level of support of women under 30. Some 53% of women ages 30 to 49 say they support the movement, which is not statistically different from the 47% of men that age who say the same. Some 48% of 50- to 64-year-old women say they support the #MeToo movement – greater than the 36% share of men in this age group who say the same. And about half of women 65 and older (49%) say they support the movement, compared with 32% of men ages 65 and older.
While White adults who have heard of the movement are more likely than Black and Hispanic adults to oppose #MeToo, this is tied to the fact that White adults are also more likely to be Republicans. White Democrats are actually more likely than Black and Hispanic Democrats to support the movement. (Data for Asian adults and other racial and ethnic groups is included in the total but not shown separately due to small sample sizes.)
About one-in-five adults overall (21%) say they have not heard of the #MeToo movement. This share is greater among Black and Hispanic adults, women, those with some college education or less, and Republicans than among their counterparts.
Top reason #MeToo movement supporters give is that women deserve respect or equality, and that the movement draws attention to the issues of sexual harassment and assault
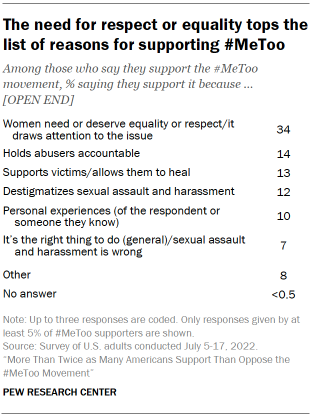
In an open-ended question, 34% of those who express support for the #MeToo movement give a response focused on women needing or deserving equality or respect or spreading awareness of the issues of sexual harassment and assault. Some other responses given are that it holds abusers accountable or can bring old stories to light (14%); that the movement helps to support victims and allows them to heal (13%); and that it destigmatizes sexual assault and harassment (12%). One-in-ten #MeToo supporters cite personal experiences with sexual harassment or assault – either their own or those of someone they know. An additional 7% say that supporting the movement is the right thing to do.
Among #MeToo supporters, men are more likely than women to cite reasons such as women deserve equality or respect, the movement holds abusers accountable, and that it’s the right thing to do. Meanwhile, women are more likely than men to say supporting victims and personal experiences are reasons they support the movement.
In their own words: Why do you support the #MeToo movement?
“Because we should all be free of sexual assault and harassment at work, and men in power should not be able to abuse those below them.” – Man, age 27
“It’s important to raise awareness of sexual assault and the treatment of women.” – Man, age 48
“I have been victim of sexual misconduct – it’s often not taken seriously by offender(s) and the system. It’s time for that to stop.” – Woman, age 59
“Sexual assault is wrong.” – Woman, age 26
“I support to a point. I believe women should be supported when they come forward, but also there needs to be investigation into the allegations.” – Man, age 43
“I feel it’s good for people to know they aren’t alone and there are a lot of people out there that have gone through the same things they may have.” – Woman, age 28
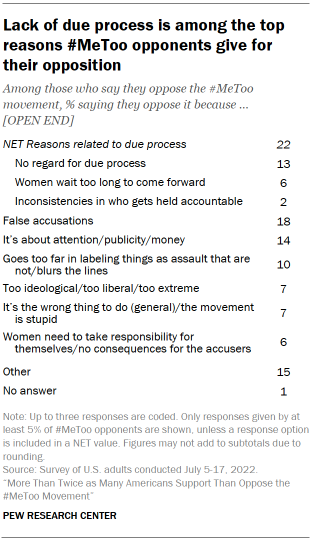
Among those who say they oppose the #MeToo movement, 22% give reasons related to due process, such as the idea that the movement does not take due process into account or that individuals should be considered innocent until proven guilty (13%); feeling as if many accusations are old and women are waiting too long to come forward (6%); and inconsistencies over who gets held accountable (2%). (Figures may not add to subtotals due to rounding and because respondents could offer more than one reason.)
An additional 18% cite the potential for false accusations and 14% say the movement is more about attention, publicity, money or other motivations rather than a genuine desire to bring perpetrators to justice. Other opponents give reasons such as the movement going too far in labeling things as assault when they really are not (10%); the movement is too ideological or liberal (7%); it’s just the wrong thing to do in general (7%); or that there are no consequences for accusers or that women need to take responsibility for themselves rather than blaming others (6%).
In their own words: Why do you oppose the #MeToo movement?
“Because I believe that women should come forward with their accusations within a reasonable period of time following any incident – not years or decades later, or only after other women spoke out about the alleged abuser. Some need to accept some personal responsibility for putting themselves in such situations (alone with men, drinking, etc.) for purposes of getting a job, a promotion, coaching, etc. from any man in a position of power. … The idea that accepting some of the responsibility constitutes ‘victim blaming’ is an overboard reaction, in my opinion.” – Woman, age 60
“I do not support the idea of ‘believe all women.’ This country was built on innocent until proven guilty.” – Man, age 26
“I believe it is laced with inherent prejudice and is biased toward women. I do believe that women have been violated and marginalized, but I don’t think this movement properly addresses the issues.” – Man, age 70
“I believe there are people falsely claiming ‘me too’ for their own financial gain, and potentially destroying the lives/reputations of the people they are accusing. Too many people are taking advantage of a serious situation because it’s trendy or they are greedy or just want attention.” – Man, age 35
“Women are being encouraged to label all acts of what they feel to be transgression as ‘assault.’ Women who have been looked at uncomfortably or even just catcalled are unfairly saying they’ve been raped or assaulted.” – Woman, age 38
“The #MeToo movement only cares about women when they believe a Republican has violated a Democrat. The members of #MeToo were disgustingly silent when the victims made allegations against liberal politicians. We went from every woman should be believed to attacking victims and shaming them. They offer no apologies for attacking the men who were wrongly accused. They have zero credibility.” – Woman, age 41
Most say that those who commit harassment or assault are now more likely to be held responsible and victims are more likely to be believed
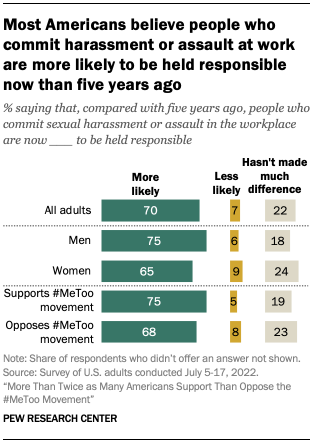
Most U.S. adults say that, compared with five years ago, people who commit sexual harassment or assault in the workplace are now more likely to be held responsible for their actions.
Majorities across demographic groups and political affiliations share this view, including three-quarters of those who support the movement and 68% of those who oppose it.
While three-quarters of men say they believe those who commit sexual harassment or assault at work are now more likely to be held responsible, women are somewhat more skeptical – 65% say this is the case, and 24% say there hasn’t been much of a difference (versus 18% of men). About one-in-ten women (9%) say people who commit harassment or assault are less likely to be held responsible now than they were five years ago.
There are also differences by age. About six-in-ten adults younger than 30 (62%) say people who commit sexual assault or harassment are more likely now to be held accountable. This compares with 69% among those ages 30 to 49, 71% of those 50 to 64 and 75% of those 65 and older.
Overall, Democrats and Republicans are equally likely to believe that, compared with five years ago, those who commit sexual harassment or assault are more likely to be held responsible. Greater shares of men than women in the Republican Party say those who commit sexual harassment or assault are more likely to be held responsible; the same is true of Democratic men compared with Democratic women.
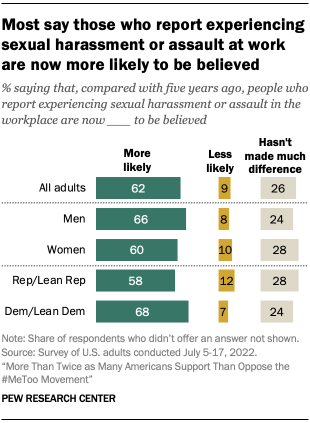
Most Americans (62%) also see a greater likelihood that people who report having experienced sexual harassment or assault in the workplace will be believed now compared with five years ago. About a quarter (26%) say there has been no difference and a small share (9%) say people who have these experiences are less likely than five years ago to be believed.
Here again, women are a bit more skeptical about changes over the last five years. Six-in-ten women (versus 66% of men) say that those who report these types of experiences are now more likely to be believed. Women are more likely than men to say there hasn’t been much of a difference (28% vs. 24%, respectively).
There’s a significant partisan gap on this question: 68% of Democrats versus 58% of Republicans say people who report experiencing sexual harassment or assault are more likely to be believed now. For their part, Republicans are more likely to say people are less likely to be believed or that there hasn’t been much change in recent years. Among Democrats, a greater share of men than women say people reporting these experiences are more likely to be believed now (72% vs. 64%), but there is no significant gender gap among Republicans.
There is also a sizable gap between those who support and oppose the #MeToo movement. About three-quarters of those who support the movement (74%) say people who say they have experienced sexual harassment or assault at work are more likely to be believed, compared with a much narrower majority of those who oppose the movement (56%).
Overall, Americans see false reporting of sexual harassment and assault in the workplace as relatively rare; many say people not reporting these experiences is more common
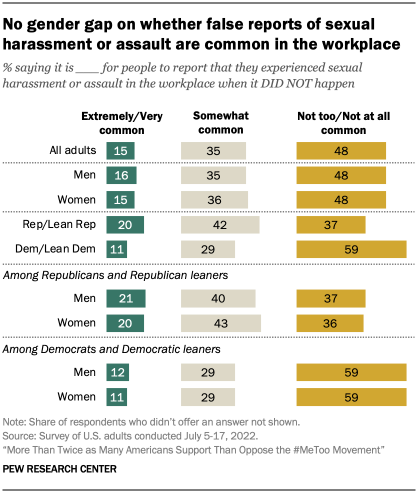
A relatively small share of U.S. adults say that it is extremely or very common for people to report that they experienced sexual harassment or assault in the workplace when it really did not happen (15%). Roughly a third (35%) say this is somewhat common and about half (48%) say it’s not too or not at all common.
Views are reversed when it comes to people experiencing harassment or assault at work and not reporting it. Some 46% say this is extremely or very common, 38% say it’s somewhat common and 15% say it’s not too or not at all common.
There is no gender gap in views of how common instances of false reporting are – 48% of both men and women say this is uncommon. Young adults ages 18 to 29 are the most likely to say it’s not common for people to report being harassed or assaulted at work when it didn’t happen.
Republicans and those who lean toward the Republican Party are about twice as likely as Democrats and Democratic leaners to say false reporting is extremely or very common (20% vs. 11%) and are also much more likely to say it is somewhat common (42% vs. 29%). A majority of Democrats (59%) say this is not too or not at all common, compared with 37% of Republicans. Within each party, men and women hold similar views on this topic.
Views of the #MeToo movement are also strongly correlated with how common people think false accusations are. Some 28% of those who oppose the movement say it’s at least very common for people to falsely report being sexually harassed or assaulted at work, compared with only 7% of those who support the movement. Meanwhile, most supporters of #MeToo say this is not too or not at all common, more than twice the share of opponents who say the same (68% vs. 29%).
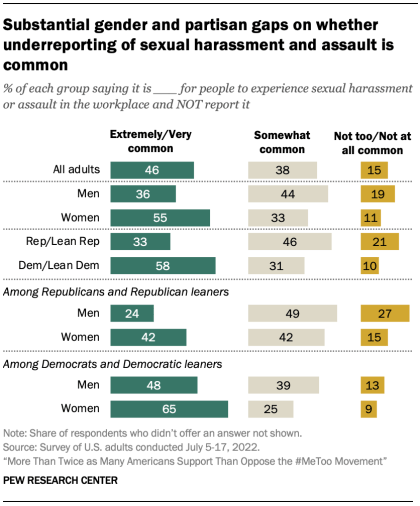
When it comes to how common it is for people to experience sexual harassment or assault at work and not report it, men and women do not see eye to eye. Women are much more likely than men to say this is at least very common (55% vs. 36%), while men are more likely than women to say it’s somewhat common, or that it’s not too or not at all common.
A majority of Democrats (58%) say that it’s at least very common for people not to report their experiences of sexual harassment or assault in the workplace, compared with 33% of Republicans. Republicans are more likely to say this is somewhat common (46% vs. 31%), or to say it’s not too or not at all common (21% vs. 10%). Within each party, much greater shares of women than men say that it’s extremely or very common for people to have these experiences and not report them.
#MeToo movement supporters are far more likely than opponents to say that this kind of underreporting occurs often – 61% of supporters say it’s extremely or very common, compared with 23% of opponents. Opponents are more likely than supporters to say it’s somewhat common (49% vs. 30%) or that it’s not too or not at all common (27% vs. 7%).
More say the increased focus on sexual harassment and assault has made it harder for men to know how to interact with women at work than say it’s made it harder for women to know how to interact with men
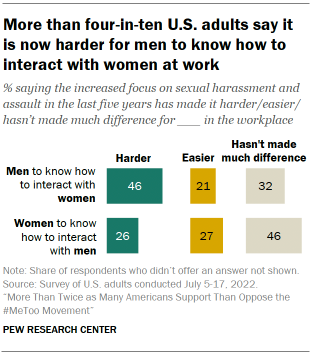
A plurality of U.S. adults (46%) say that the increased focus on sexual harassment and assault in the last five years has made it harder for men to know how to interact with women in the workplace, while smaller shares say it hasn’t made much difference (32%) or that it has made it easier for men (21%). By comparison, far fewer say that this increased focus has made it harder for women to know how to interact with men at work (26%). Some 46% of adults say it hasn’t made much difference for women and 27% say it has made it easier for them to know how to interact with men.
By a double-digit margin, men (53%) are more likely than women (39%) to say this focus has made it harder for men to know how to interact with women in the workplace. There is a far smaller gap in the shares of men and women who say this has made it harder for women to know how to interact with men in the workplace (28% vs. 24%).
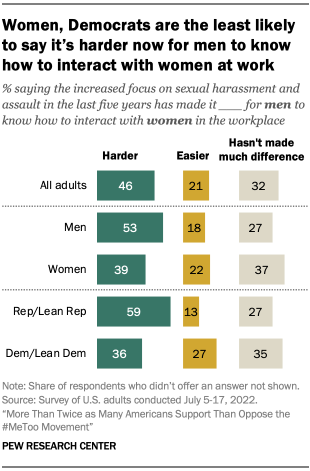
A 59% majority of Republicans and those who lean to the Republican Party say that the recent increased focus on sexual harassment and assault makes it harder for men to know how to interact in the workplace, far greater than the 36% of Democrats and Democratic leaners who say the same. While smaller shares of both groups say it’s harder now for women to know how to interact with men at work, the same pattern exists (34% of Republicans vs. 19% of Democrats say it’s harder for women).
Among both Republicans and Democrats, there is a gender gap of at least 10 percentage points, with men being more likely than women in their party to say an increased focus on harassment and assault has made it more difficult for men to know how to act at work. When it comes to women knowing how to interact with men in the workplace, a gender gap exists among Republicans (Republican men are more likely than Republican women to say it’s now harder for women) but not among Democrats.