
COVID-19 Pandemic Pinches Finances of America’s Lower- and Middle-Income Families
Nearly one-in-five middle-income families report receiving unemployment benefits in 2020
This report analyzes data from the Annual Social and Economic Supplements (ASEC) of the Current Population Survey (CPS) to study the effects of the coronavirus pandemic on the financial wellbeing of U.S. households in the middle class and in lower- and upper-income tiers. The latest available survey data, from March 2021, records the household income and work experience of adults in 2020, the first year of the pandemic.
The CPS is the U.S. government’s official source for monthly estimates of unemployment and the ASEC, conducted in March each year, is the official source for its estimates of income and poverty. In this report, the ASEC files were also matched from one year to the next to examine the annual movement of adults across income tiers over the period from 2000 to 2021.
The COVID-19 outbreak has affected data collection efforts by the U.S. government in its surveys, limiting in-person data collection and affecting the response rate. It is possible that some measures of economic outcomes and how they vary across demographic groups are affected by these changes in data collection. This report makes use of updated weights released by the Census Bureau to correct for nonresponse in 2019, 2020 and 2021.
“Middle-income” households are defined as those with an income that is two-thirds to double that of the U.S. median household income, after incomes have been adjusted for household size. For a three-person household, the middle-income range was about $52,000 to $156,000 annually in 2020 (in 2020 dollars). Lower-income households have incomes less than two-thirds of the median, and upper-income households have incomes that are more than double the median.
Unless otherwise noted, incomes are adjusted for household size and scaled to reflect a household size of three. Adults are placed into income tiers based on their household income in the calendar year prior to the survey year. Thus, the income data in the report refer to the 1970-2020 period, and the demographic data from the same surveys refer to the 1971-2021 period.
The terms “middle class” and “middle income” are used interchangeably in this report, as are the terms “households” and “families.” The estimates presented pertain to households and adults living in households.
White, Black and Asian adults include those who report being only one race and who are not Hispanic. Hispanics are of any race. Asians include Native Hawaiian and other Pacific Islanders. Other racial and ethnic groups are included in all totals but are not shown separately.
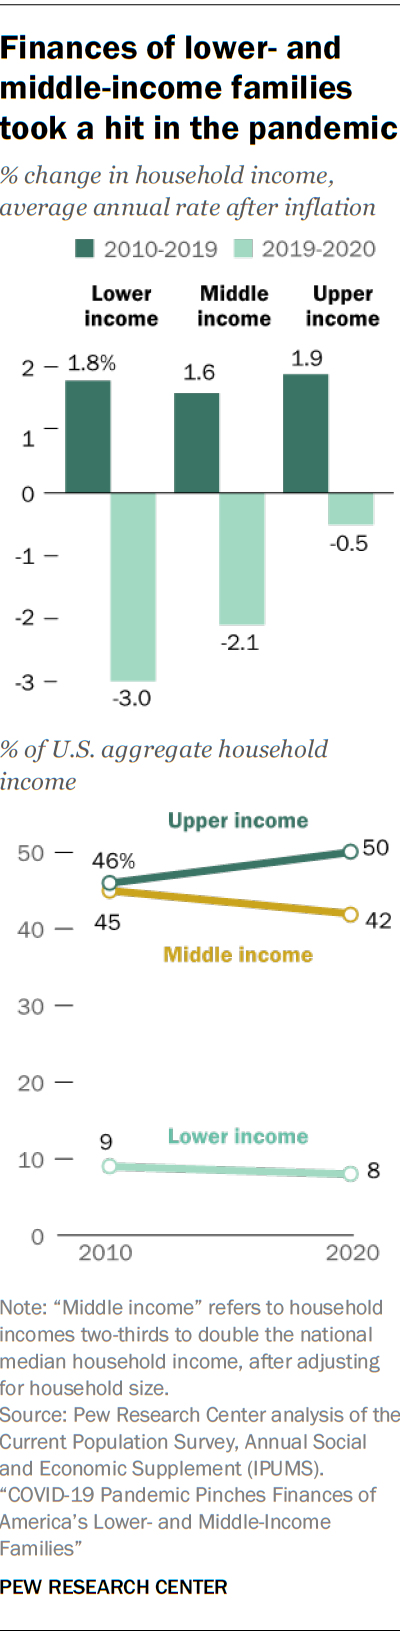
The financial hardships caused by the COVID-19 recession in the U.S. were endured mostly by lower- and middle-income families. From 2019 to 2020, the median income of lower-income households decreased by 3.0% and the median income of middle-income households fell by 2.1%. In contrast, the median income of upper-income households in 2020 was about the same as it was in 2019, according to a new Pew Research Center analysis of government data.
The setbacks to the finances of lower- and middle-income households during the pandemic mark a significant reversal from their recent experiences. From 2010 to 2019, following the end of the Great Recession, the median incomes of households in all income tiers had increased at about the same pace – an annual average rate of 1.8% for lower-income families, 1.6% for middle-income families and 1.9% for upper-income families, after adjusting for inflation.
The long-running shift in the distribution of U.S. household income towards upper-income families stayed on track during the coronavirus pandemic. The share of aggregate U.S. household income held by upper-income families reached 50% in 2020, up from 46% in 2010. The share held by middle-income families decreased from 45% to 42% over the same period. The share held by lower-income families also decreased, from 9% to 8%.
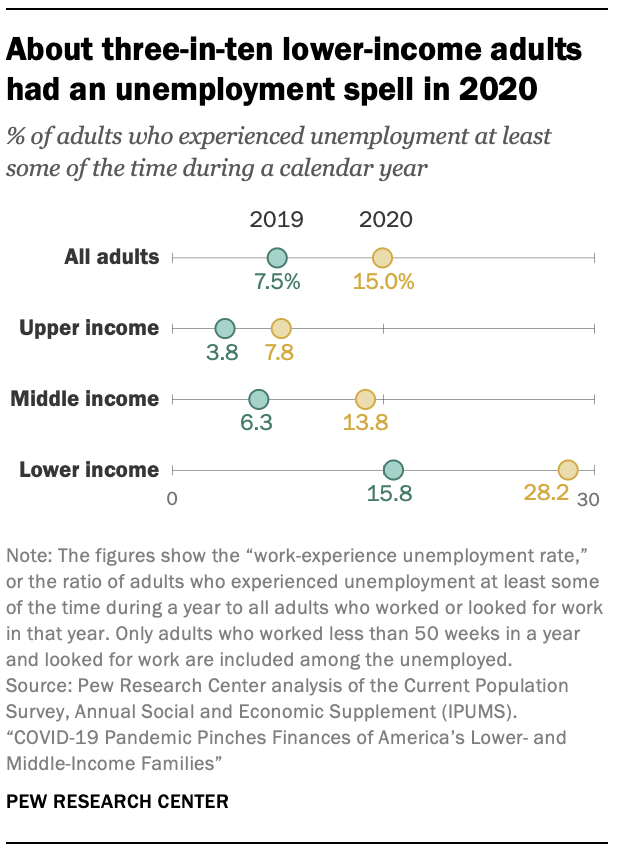
The trends in income reflect the varying degrees to which adults in lower-, middle- and upper-income households were vulnerable to labor market turmoil in the COVID-19 recession. In 2020, about three-in-ten lower-income adults (28.2%) experienced unemployment at least some of the time during the year. Likewise, 13.8% of middle-income adults and 7.8% of upper-income adults had at least a spell of unemployment in 2020. Among adults overall, the rate stood at 15.0%. This rate, known as the “work-experience unemployment rate,” is the number of adults who experienced unemployment at least some of the time during a year as a proportion of all adults who worked or looked for work in that year.1
In a Pew Research Center survey conducted in January 2021, about a third of lower-income adults (31%) said their family’s situation had worsened in the last year, compared with 18% of middle-income adults and 11% of upper-income adults. At the same time, about half of lower-income adults (49%) said they or someone in their household had experienced job or wage loss since the coronavirus outbreak began in February 2020, as did 45% of middle-income adults. The share among upper-income adults (33%) was also notable, but considerably less.
The COVID-19 recession, which lasted from February 2020 to April 2020, is the shortest in recorded history. But its effects were sharp. Unemployment soared to near-record highs and national output, as measured by the gross domestic product (GDP), shrank in 2020. Although employment and national output have recovered to a great extent since 2020, new concerns have emerged about inflation.
This report focuses on the impact of the pandemic on the financial wellbeing of households in the lower-, middle- and upper-income tiers, with comparisons to the Great Recession era. The analysis relies on the Annual Social and Economic Supplement (ASEC) of the Current Population Survey (CPS), conducted by the U.S. Census Bureau in March of each year. The latest available survey data, from March 2021, records the household income and work experience of adults in 2020, the first year of the pandemic. A related analysis examines changes in the economic status of the American middle class from a historical perspective, including how the distribution of different demographic groups across the three income tiers has changed from 1971 to 2021.
Who is middle income or middle class?
In this analysis, “middle-income” adults in 2021 are those with an annual household income that was two-thirds to double the national median income in 2020, about $52,000 to $156,000 annually in 2020 dollars for a household of three. “Lower-income” adults have household incomes less than $52,000 and “upper-income” adults have household incomes greater than $156,000.
The income it takes to be middle income varies by household size, with smaller households requiring less to support the same lifestyle as larger households. The boundaries of the income tiers also vary across years with changes in the national median income.

The terms “middle income” and “middle class” are used interchangeably in this report for the sake of exposition. But being middle class can refer to more than just income, be it level of education, the type of profession, economic security, home ownership, or one’s social and political values. Class also could simply be a matter of self-identification.
U.S. households entered the pandemic era on the heels of robust growth in their incomes
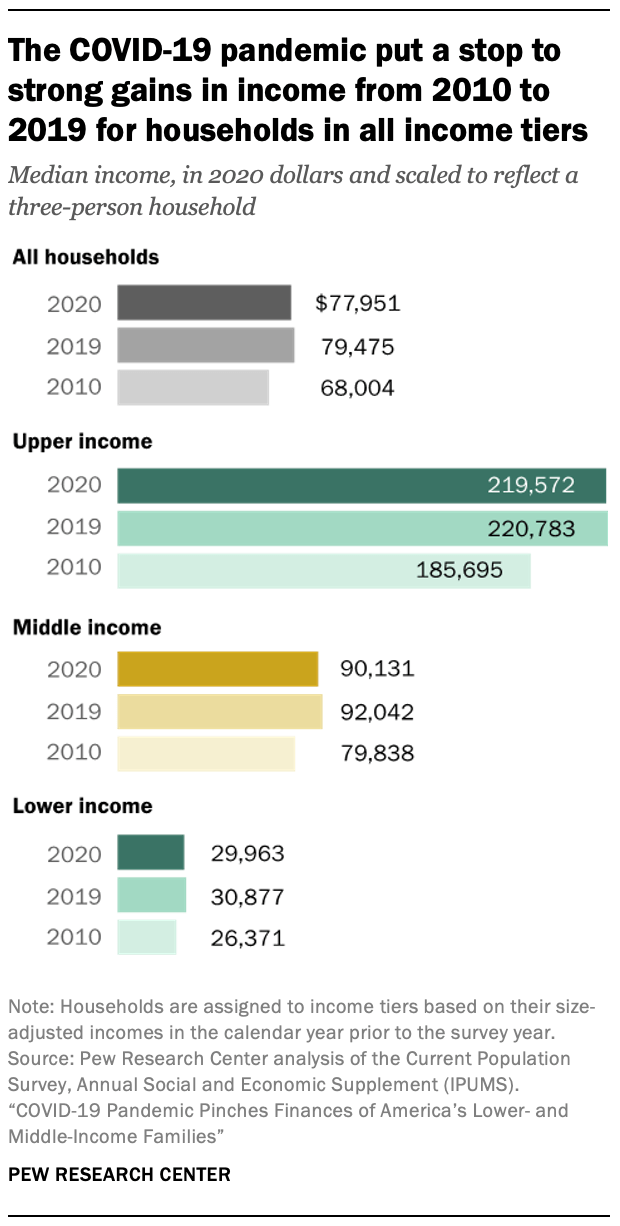
In 2019, just before the start of the pandemic, the incomes of U.S. households were substantially higher than what they were in 2010. Among households overall, the median income had increased from $68,004 in 2010 to $79,475 in 2019, a gain of 17%. It stood in sharp contrast to the reversal experienced from 2001 to 2010, a period encompassing the Great Recession, when incomes had decreased by 5%. The growth from 2010 to 2019 was also greater than the growth seen in any single decade since 1970. But the pandemic ate into some of the gains, causing the median income overall to fall to $77,951 in 2020, a one-year loss of 2%.
For middle-class households, the median income had increased by 15%, from $79,838 in 2010 to $92,042 in 2019. The onset of the pandemic sent the median down to $90,131 in 2020. Lower-income households had a similar experience, with their median income rising from $26,371 in 2010 to $30,877 in 2019, up 17%, and then falling to $29,963 in 2020.
The finances of upper-income households were left relatively unscathed in the first year of the pandemic. Their median income in 2020 ($219,572) was statistically no different than what it was in 2019 ($220,783), and it stood about 18% higher than in 2010.
As a result of these trends, the income gap between upper-income and other households stretched a bit wider from 2010 to 2020. The median income of upper-income households had been 7.0 times greater than the median income of lower-income households in 2010. This ratio increased to 7.3 in 2020. The ratio of the median income of upper-income households to the median income of middle-income households edged up from 2.3 in 2010 to 2.4 in 2020.
Unemployment insurance was a notable source of income for households with loss of work during the pandemic and the Great Recession
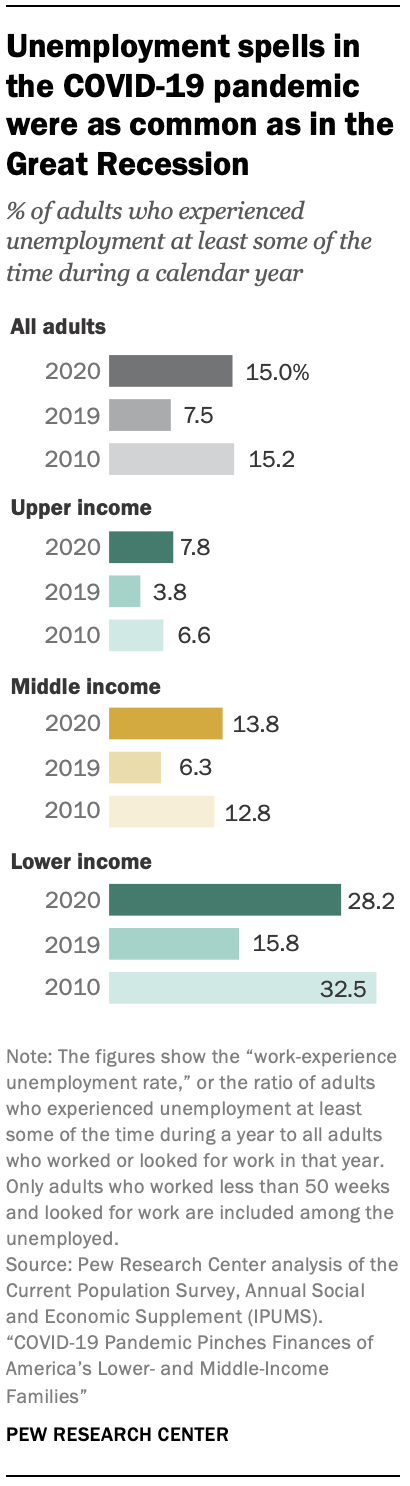
Despite the historic spike in unemployment during the COVID-19 recession, the unemployment experiences of workers during 2020 bore many similarities to their experiences in the Great Recession, which lasted from December 2007 to June 2009 but sent unemployment soaring through 2010.
Among adults overall, the work-experience unemployment rate in 2020 (15.0%) was about the same as in 2010 (15.2%), just following the end of the Great Recession. But encounters with unemployment varied across income tiers. The work-experience unemployment rate for lower-income adults in 2020 (28.2%) was somewhat less than in 2010 (32.5%). Meanwhile, middle-income adults (13.8%) and upper-income adults (7.8%) saw slightly higher work-experience unemployment rates in 2020 than in 2010, when they stood at 12.8% and 6.6%, respectively.
Despite the sense of déjà vu evoked by the work-experience unemployment rate, the share of households reporting receipt of unemployment insurance payments was much higher in 2020 (15.4%) than in 2010 (9.6%). A key reason for this was the extension of the eligibility for unemployment insurance benefits in the pandemic. Workers usually not eligible for these benefits, such as self-employed workers and independent contractors, were allowed to receive benefits in 2020.

The extension of unemployment insurance benefits helped households in all income tiers. Nearly one-in-five middle-class households (18.0%) reported the receipt of these benefits in 2020, compared with 13.0% of lower-income households and 13.1% of upper-income households. These rates were higher than in 2010 for households in all income tiers. For instance, only about one-in-ten middle-income households (10.7%) received unemployment benefits in 2010.
The relatively low share of lower-income households receiving unemployment benefits in 2020, despite a higher work-experience unemployment rate, partly reflects the fact that lower-income adults are less likely to be in the labor force. In March 2020, the labor force participation rate among lower-income adults was 42.4%, compared with 69.1% among middle-income adults and 78.8% among upper-income adults. Lower-income adults are also more likely to be foreign-born, which may affect eligibility, and evidence suggests that unemployment benefits may not be reaching all who are eligible.
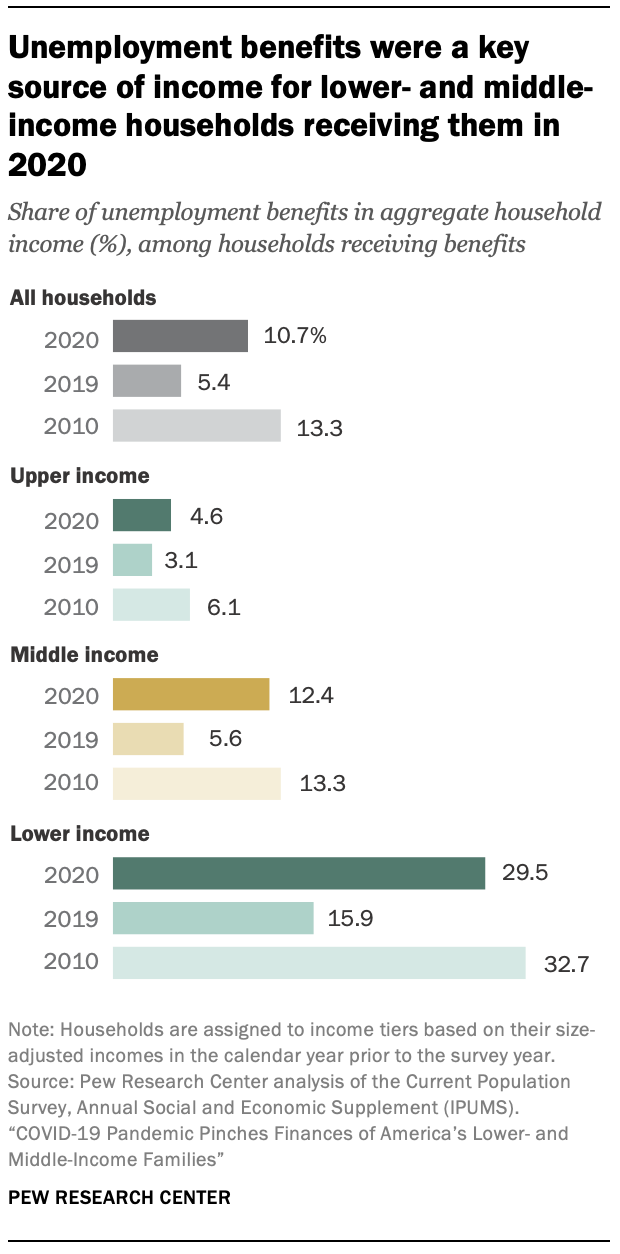
For adults who experienced at least some joblessness, unemployment insurance payments were a valuable source of financial assistance during both the pandemic and the Great Recession. In 2020, these payments accounted for 29.5% of the aggregate income of lower-income households who received the benefits, albeit less than in 2010. Unemployment insurance payments also accounted for 12.4% of the aggregate income of middle-income households, about the same as in 2010, and 4.6% of the aggregate income of upper-income households receiving the benefits, less than in 2010.
It should be noted that the reliance on unemployment insurance benefits may be underreported in the Current Population Survey, the source data for this analysis. Research based on personal earnings and benefits data from the IRS finds that unemployment insurance benefits replaced more of the lost personal earnings of low-income workers in 2020 than they did during the Great Recession. Regardless of the precise value of these benefits, it is evident that the estimated decline in the median incomes of lower- and middle-income households overall in 2020 may have been even greater in their absence.
Coronavirus economic impact payments to U.S. households in 2020
Unemployment insurance benefits were not the only source of financial relief available to U.S. households during the economic downturn in the COVID-19 pandemic. Among its many provisions, the CARES Act established two rounds of economic impact payments to U.S. households in 2020, both in the form of refundable tax credits. These tax credits, amounting to about $400 billion in direct financial assistance, are credited with a reduction in the U.S. poverty rate in 2020.
By design, the economic impact payments were directed towards lower- and middle-income families. In the 2021 CPS ASEC, some 97% of lower-income households, 100% of middle-income households and 53% of upper-income households reported that they received economic impact payments in 2020. Among households receiving the tax credits, the payments represented 13.9% of the aggregate income of lower-income households, 4.6% of the aggregate income of middle-income households, and 1.3% of the aggregate income of upper-income households.
The amount of payment received by each household in 2020, as recorded in the 2021 CPS ASEC, was estimated by the Census Bureau based on their tax model. The payments, disbursed as tax credits, boosted the disposable (after-tax) income of households, but they did not affect the gross (pre-tax) income of households, the income measure used in this report.
Americans moved across income tiers during the pandemic, but to about the same extent as in the past
Despite the economic headwinds from the COVID-19 recession, the shares of U.S. adults who were living in lower-, middle- and upper-income households were unchanged in the pandemic. In 2021, some 50% of adults lived in middle-income households, 29% in lower-income households and 21% in upper-income households. In 2020, 51% were middle class, 29% were lower-income and 21% were upper-income. (The population shares for 2020 and 2021 are based on household incomes in 2019 and 2020, respectively. Shares may not add to 100% due to rounding.)
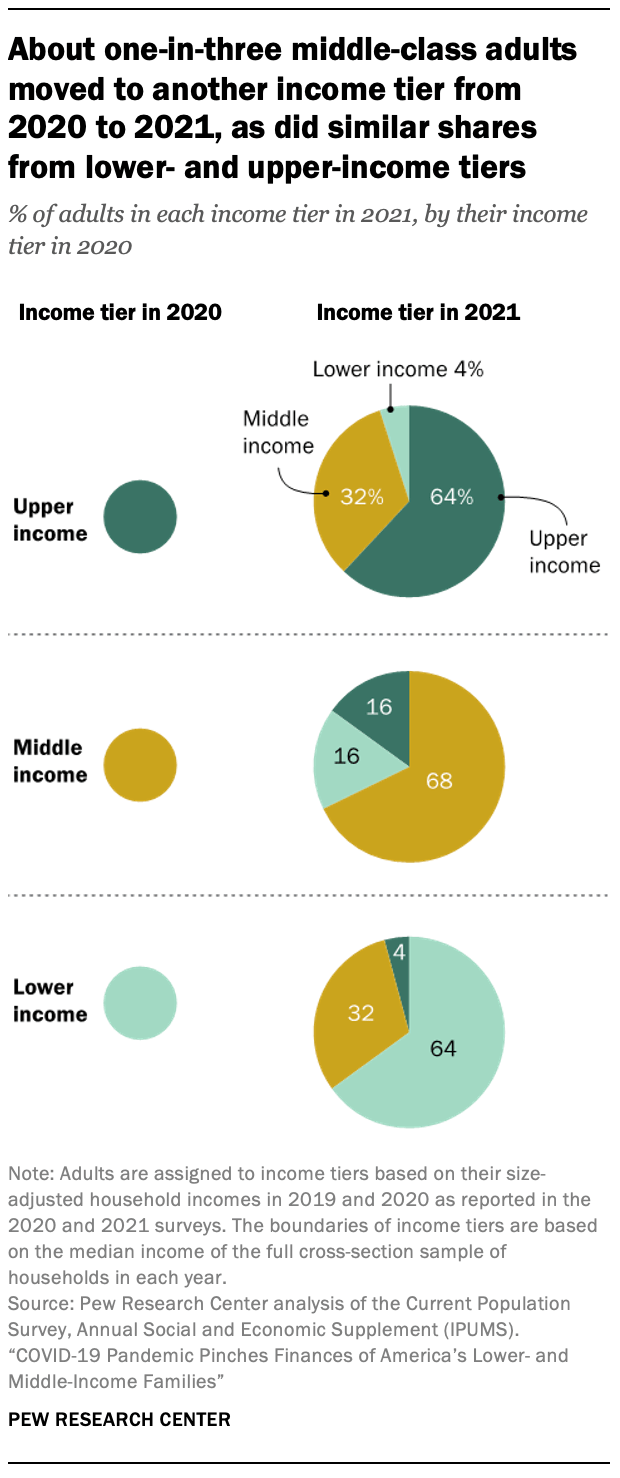
But the stability in the shares of American adults in the three income tiers conceals a fair degree of churn in who is lower-, middle- or upper income from one year to the next. Movements across income tiers are driven by changes in the earnings of households from one year to the next. These changes can be substantial, perhaps the result of a job lost or gained, or due to life cycle events, such as retirement, marriage, divorce, or a death in the family. On this score, the first year of the pandemic proved to be no different than in other years in the past two decades.
Among the adults who were in the middle class in 2020, some 68% remained in the middle class in 2021. Another 16% had moved into the upper-income tier in 2021 and 16% had slipped down to the lower-income tier. These shifts were similar in magnitude to those that have prevailed since 2000 (see more on this below).
Similarly, among adults who were in the upper-income tier in 2020, some 64% held that status in 2021. About one-third (32%) had retreated to the middle-income tier and 4% had fallen to the lower-income tier by 2021. Among adults who were in the lower-income tier in 2020, nearly a third (32%) had progressed into the middle class and 4% had leapfrogged into the upper-income tier.
Adults who moved from the middle class in 2020 to the upper-income tier in 2021 saw a gain of 68% in their household income at the median. On the other hand, middle-class adults who moved to the lower-income tier from 2020 to 2021 experienced a loss of 52% in their household income. Similarly large changes in income characterized the experiences of lower-income adults who moved up to the middle class and upper-income adults who moved down to the middle.
The magnitude of the changes in income experienced by adults transitioning across income tiers is not unlike what has been seen in the past. Other researchers have recently examined the issue of income volatility using data from the IRS. They find that, from 2004 to 2020, about 30% of workers experienced a decline in their incomes of more than 10% from one year to the next and another 30% of workers saw an increase of more than 10%. These shares varied little over the 16-year period. Indeed, this pattern in income volatility has prevailed for several decades.
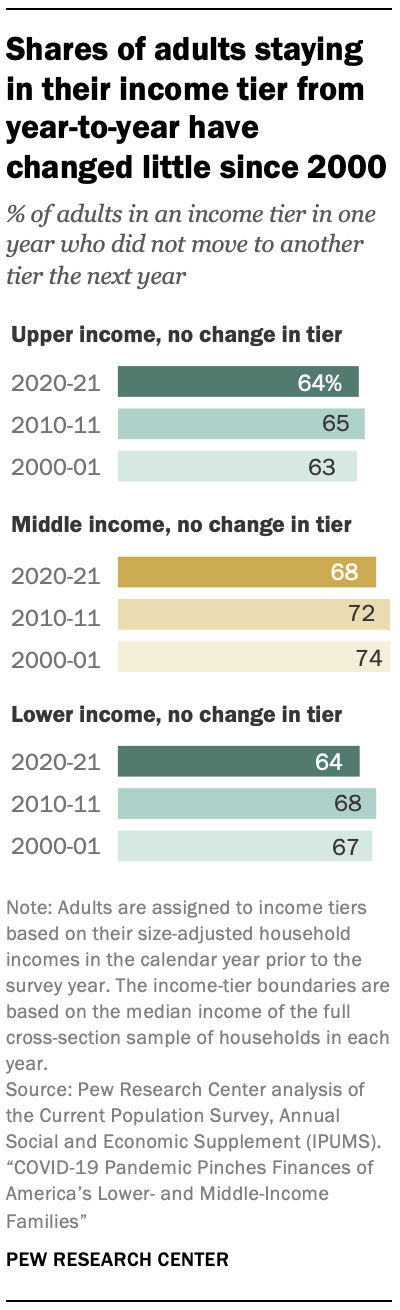
Consistent with the pattern of income volatility, the rate at which adults move across income tiers from one year to the next, or stay put, has changed only modestly since 2000, the earliest year examined in this analysis. About seven-in-ten adults (74%) who were in the middle class in 2000 were still in the middle class in 2001. Slightly lower shares of adults retained their place in the middle class following the Great Recession, some 72% from 2010 to 2011, and in the first year of the pandemic, some 68% from 2020 to 2021.
The shares of middle-income adults moving up to the upper-income tier inched up across these three pairs of years, from 12% during 2000 to 2001, to 13% from 2010 to 2011, and then to 16% from 2020 to 2021. The share of middle-income adults moving down to the lower-income tier also edged up, from 14% during 2000 to 2001 to 16% from 2020 to 2021.
Retention rates in the lower-income and upper-income tiers have also changed little since 2000. From 64% to 68% of lower-income adults remained in that tier from 2000 to 2001, 2010 to 2011 or 2020 to 2021, and from 63% to 65% of upper-income adults stayed put in these years. For both groups of adults, most of the movement was either one tier up, from lower- to middle-income, or one tier down, from upper- to middle-income.
The degree to which adults moved up or down the income ladder annually since 2000 varied across some demographic groups in some instances. Among those in the middle-income tier, White and Asian adults were more likely than Black and Hispanic adults to move to the upper-income tier the next year. Adults with higher levels of education were less likely to move down from the upper-income tier and more likely to move up from the middle-income tier from one year to the next.
The share of adults in the middle class is unchanged since the Great Recession
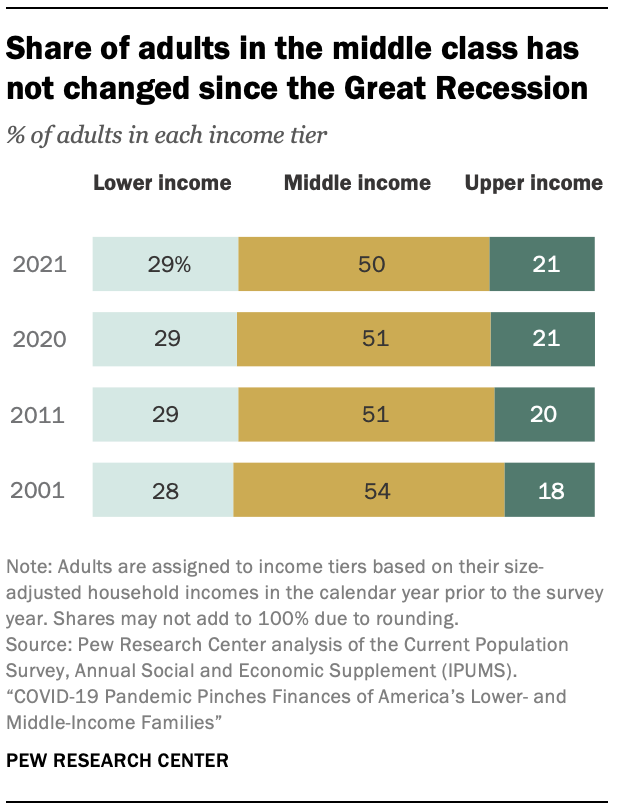
The share of American adults in the middle class – unchanged in the pandemic – has also not changed since the Great Recession, at about 50% in both 2011 and 2021. The shares in the lower- and upper-income tiers saw little change, at 29% and about 21%, respectively.2
However, the share in the middle class had fallen from 2001 to 2011, from 54% to 51%. Over the same period, the share in the upper-income tier had edged up from 18% to 20%. A companion report looks at this issue from a historical perspective, including how different demographic groups have shifted across the three income tiers from 1971 to 2021.