Pew Research Center

FOR RELEASE MARCH 24, 2022

Financial Issues Top the List of Reasons U.S. Adults Live in Multigenerational Homes

Nearly four-in-ten men ages 25 to 29 now live with older relatives<br>

BY D’Vera Cohn, Juliana Menasce Horowitz, Rachel Minkin, Richard Fry and Kiley Hurst

FOR MEDIA OR OTHER INQUIRIES:

Communications Department
202.419.4372
www.pewresearch.org

RECOMMENDED CITATION

Pew Research Center, March 2022, "Financial Issues Top the List of Reasons U.S. Adults Live in Multigenerational Homes"

About Pew Research Center

Pew Research Center is a nonpartisan, nonadvocacy fact tank that informs the public about the issues, attitudes and trends shaping the world. It does not take policy positions. The Center conducts public opinion polling, demographic research, computational social science research and other data-driven research. It studies politics and policy; news habits and media; the internet and technology; religion; race and ethnicity; international affairs; social, demographic and economic trends; science; research methodology and data science; and immigration and migration. Pew Research Center is a subsidiary of The Pew Charitable Trusts, its primary funder.

© Pew Research Center 2026

Table of contents

  • About Pew Research Center
  • Financial Issues Top the List of Reasons U.S. Adults Live in Multigenerational Homes
  • 1. The demographics of multigenerational households
  • 2. The experiences of adults in multigenerational households
  • Acknowledgments
  • Methodology

Financial Issues Top the List of Reasons U.S. Adults Live in Multigenerational Homes

Nearly four-in-ten men ages 25 to 29 now live with older relatives<br>

How we did this

Pew Research Center conducted this study to better understand the experiences of U.S. adults living in multigenerational households, as well as the overall number and share of Americans who live in this type of household. The analysis in this report is based on two separate data sources. The findings about the number and share of Americans in multigenerational households, featured in Chapter 1 of the report, are based on data from the Annual Social and Economic Supplement of the Census Bureau’s Current Population Survey. The findings about the experiences of adults in multigenerational households, featured in Chapter 2 of the report, are based on 1,548 U.S. adults ages 25 and older who live with a parent or grandparent or who live with an adult child or grandchild age 25 or older. The data was collected as a part of a larger survey of 9,676 U.S. adults conducted in October 2021. Everyone who took part is a member of Pew Research Center’s American Trends Panel (ATP), an online survey panel that is recruited through national, random sampling of residential addresses. This way nearly all U.S. adults have a chance of selection. The survey is weighted to be representative of the U.S. adult population by gender, race, ethnicity, partisan affiliation, education and other categories. Read more about the ATP’s methodology.

See here to read more about the questions used for this report and the report’s methodology.

Terminology

In the analysis of the Annual Social and Economic Supplement of the Census Bureau’s Current Population Survey, multigenerational households are those that include two or more adult generations (mainly ages 25 and older) or a “skipped generation,” which consists of grandparents and their grandchildren younger than 25. See Defining multigenerational households for more detail.

In the analysis of Pew Research Center survey data, adults in multigenerational households include those ages 25 and older who live with a parent or grandparent or who live with an adult child or grandchild age 25 or older.

References to White, Black and Asian Americans include only those who are not Hispanic and identify as only one race. Asian Americans include Pacific Islanders. Hispanics are of any race.

“Middle income” is defined here as two-thirds to double the median annual family income for panelists on the American Trends Panel. “Lower income” falls below that range; “upper income” falls above it. See the methodology for more details.

A chart showing that the U.S. population in multigenerational households quadrupled since 1971

Multigenerational living has grown sharply in the U.S. over the past five decades and shows no sign of peaking. When asked why they share their home with relatives, Americans often give practical reasons related to finances or family caregiving. But the experience also has an emotional component. About a quarter of adults in multigenerational homes say it is stressful all or most of the time, and more than twice that share say it is mostly or always rewarding.

These experiences with multigenerational living vary by demographic group, especially by age and income, according to a Pew Research Center survey conducted in October 2021. There also are generational differences, especially in terms of stress and money, between the views of adult children and parents who share a home.

According to an analysis of census data from 1971-2021, the number of people living in multigenerational family households quadrupled during that time period, reaching 59.7 million in March 2021. The share more than doubled as well, to 18% of the U.S. population. 

A chart showing that for many, multigenerational living has practical reasons and emotional results

This increase in multigenerational living has been fed by social forces that include rapid growth of the U.S. Asian and Hispanic populations who, along with Black Americans, each are more likely than White Americans to live with extended family, especially if they are immigrants. By age, the highest share in this living arrangement is among young adults, a group that compared with prior generations when they were young generally stays in school longer, postpones or forgoes marriage and delays forming their own households. Among young adults ages 25 to 29, nearly a third (31%) live in multigenerational households, often in their parents’ home. Nearly four-in-ten young men in this age group (37%) are in multigenerational households, as are 26% of similarly aged young women.

Living in a multigenerational household appears to confer a financial benefit by buffering residents against poverty, according to census data. Americans living in multigenerational households are less likely to be poor than those living in other types of households. This is especially true of some groups that are economically vulnerable, such as unemployed people.

Although majorities across income groups cite financial issues as a major or minor reason for residing in a multigenerational family household, lower-income adults are more likely to say the living arrangement helps them financially – 50% say it does at least a little, compared with 36% of middle-income adults and 24% of upper-income adults.

Parents living with adult children and adults living with parents are about equally likely to say finances are a major reason for their living arrangement. But among those living with parents, younger adults (ages 25 to 39) are much more likely than older ones (40 and older) to say this (57% to 31%). And while 53% of adult children who live with their parents say it helps them financially at least a little, a smaller share of parents living with an adult child (29%) say the same. Parents are more likely than their adult children to say that living with extended family hurts their finances at least a little.

Defining multigenerational households

In exploring the demographics and experiences of Americans in multigenerational households, this report relies on two separate data sources and two definitions of who lives in this type of household. 

In reporting the overall number and share of Americans who live in multigenerational households (and the demographic characteristics of these people), the analysis relies on data from the Annual Social and Economic Supplement of the Census Bureau’s Current Population Survey (IPUMS). For this part of the analysis, which is featured in Chapter 1 of the report, multigenerational households are defined as including two or more adult generations or a “skipped generation,” which consists of grandparents and their grandchildren younger than age 25. In this definition, adult children living in a parent’s home must be 25 or older (18- to 24-year-olds living in their parents’ home are not treated as an adult generation). However, 18- to 24-year-olds are treated as an adult generation if they are the householder and a parent or other relative from an older generation lives with them. This arrangement accounts for a relatively small share of multigenerational households. In other households as well, the householder could either be from the older or younger adult generation.

The analysis of census data includes all Americans – children and adults – living in multigenerational households, even if their presence doesn’t make it a multigenerational household. For example, a 7-year-old living with her parents and a grandparent or an 18-year-old living with a 25-year-old sibling and their parents in the parents’ home are each living in a multigenerational household. The trends and patterns here are similar to previous Pew Research Center reports based on the Census Bureau’s American Community Survey, although the Current Population Survey numbers tend to be lower. See Methodology for more detail.

In Chapter 2, we examine the experiences of adults in multigenerational households based on findings from a Pew Research Center survey conducted in October 2021. In this part of the analysis, adults in multigenerational households are defined as those ages 25 and older who live with a parent or grandparent or who live with an adult child or grandchild who is 25 or older (regardless of whether the respondent is or is not the householder).

The nationally representative survey of 9,676 U.S. adults, including 1,548 who live in multigenerational households, was conducted Oct. 18-24, 2021, using the Center’s American Trends Panel. The census figures are from the Annual Social and Economic Supplement of the Census Bureau’s Current Population Survey, which reports data for the civilian population other than those living in institutions such as prisons or mental hospitals.1

Among the other key findings:

A third of U.S. adults in multigenerational households say caregiving is a major reason for their living arrangement, including 25% who cite adult caregiving and 12% who cite child care. Among the other reasons given for living in a multigenerational household, 28% say it’s the arrangement they’ve always had, while smaller shares cite a change in relationship status (15%), or companionship (12%) as a major reason why they live with family members. About one-in-eight adults (13%) say the coronavirus pandemic is a factor in why they live with multiple generations under one roof.

A quarter of adults in multigenerational households say caregiving actually is occurring in their homes, either in the form of personal care for another adult in the household or care for a child younger than 18 who is not the caregiver’s own child. Those with lower (30%) and middle (24%) incomes are more likely than those with upper incomes (15%) to say caregiving is occurring in their household. Among adults living with a parent age 65 and older, 23% say they personally provide care for another adult in the household at least sometimes, compared with 8% of those living with a parent younger than 65. 

More adults living in multigenerational households say the experience has been very positive (30%) or somewhat positive (27%) than say it has been somewhat negative (14%) or very negative (3%). An additional 26% say it has been neither. About half or more of those living with adult relatives other than a spouse or partner say it is convenient (58%) or rewarding (54%) all or most of the time. About a quarter (23%) say it is stressful all or most of the time, 40% say it is stressful some of the time and 36% say it is rarely or never stressful.

Among adults younger than 40, men are more likely than women to live in multigenerational households. Among those ages 40 and older, women are more likely to do so. For the most part, the reasons for living in a multigenerational household do not vary between men and women.  Women are more likely than men to say a change in relationship status is a major reason. Among those living with a parent, men are more likely than women to say this is the arrangement they’ve always had.

Parents living with an adult child (60%) are more likely than adult children living with a parent (52%) to say their living situation is at least somewhat positive. Among adult children who live with parents, the younger group, ages 25 to 39 (43%), is less likely than those 40 and older (64%) to say the experience is at least somewhat positive. Adults living with parents (31%) are more likely than parents living with adult children (18%) to say their living situation is stressful all or most of the time. Similar shares of adults living with a parent and parents living with an adult child say living in a multigenerational household is convenient or rewarding all or most of the time.

Parents are more likely than adult children to pay the rent or mortgage when the two generations share a home. A majority of parents who live with an adult child (63%) say they pay more than half the rent or mortgage, including 51% who say they pay all. Meanwhile, 30% of adult children living with a parent say they pay nothing. Adult children are more likely to chip in for day-to-day costs; only 9% of those living with their parents say they pay nothing for groceries, utility bills or other household expenses. Still, 45% of parents living with adult children say they pay all such costs.

Upper-income adults are less likely than those with lower or middle incomes to cite caregiving as a reason for living in a multigenerational household. About a third of upper-income adults say that giving or getting adult care is a reason they live in a multigenerational household, compared with 45% of those with middle incomes and 51% of those with lower incomes who say so. Only 9% of upper-income adults identify giving or receiving child care as a reason for living with extended family, compared with 32% of lower-income adults and 20% of middle-income adults. 

Upper-income adults in multigenerational households are more likely than those in other income groups to see the arrangement as temporary. Some 47% say they think they are in a temporary situation, compared with 35% of those with middle incomes and 31% of those with lower incomes. Overall, 41% of adults in multigenerational households say their living arrangement is a long-term one, 34% say it is temporary and 24% do not know. Upper-income adults also are more likely to find multigenerational living to be a positive experience – 71% say so, compared with 59% of middle-income adults and 50% of lower-income adults in that situation. Lower-income adults are more likely to say there is not enough space in their home for everyone to live comfortably – 38% say so, compared with 21% of middle-income and just 9% of upper-income residents of multigenerational households. 

Among most major racial groups and Hispanics, the share of people in poverty is lower in multigenerational households than in other types of households. Overall poverty is lower in multigenerational homes (10% of those who live in them are poor) compared with other types of households (12%), according to census data. The apparent benefit of living in a multigenerational household extends to people who are unemployed – 11% in multigenerational households were poor in 2020, compared with 19% of those in other living arrangements. Those with a disability that limits or prevents them from working also are less likely to be poor if they live in a multigenerational household (16%) than another type of household (27%).

1. The demographics of multigenerational households

The number of Americans who live in multigenerational family households is about four times larger than it was in the 1970s, while the number in other types of homes grew by far less. The share of the U.S. population living in multigenerational homes more than doubled over the past five decades.

In March 2021, there were 59.7 million U.S. residents who lived with multiple generations under one roof, compared with 58.4 million in 2019, according to a Pew Research Center analysis of census data. The share of the U.S. population living in multigenerational households in 2021 was 18%.

After declining in earlier decades, multigenerational living has grown steadily in the U.S. since the 1970s. From 1971 to 2021, the number of people living in multigenerational households quadrupled, while the number in other types of living situations is less than double what it was. The share of the U.S. population in multigenerational homes has more than doubled, from 7% in 1971 to 18% in 2021.

Multigenerational living is growing in part because groups that account for most recent overall population growth in the U.S., including foreign-born, Asian2, Black and Hispanic Americans, are more likely to live with multiple generations under one roof. Thus, the rise in the multigenerational family household population is linked to the changing makeup of the overall U.S. population. However, multigenerational living also is rising among non-Hispanic White Americans, who accounted for a higher share of the multigenerational household population growth from 2000 to 2021 (28%) than of total population growth (9%).

Multigenerational households are defined as including two or more adult generations (with adults mainly ages 25 or older) or a “skipped generation,” which consists of grandparents and their grandchildren younger than 25. Most consist of at least two adult generations – for example, young adults living with their parents, parents residing in their adult children’s homes, or a grandparent, adult child and adult grandchild under one roof. About 5% of multigenerational households consist of grandparents and grandchildren younger than 25. 

The numbers for this analysis come from the Annual Social and Economic Supplement of the Census Bureau’s Current Population Survey, which reports data for the civilian population except those living in institutions such as prisons or mental hospitals. The trends and patterns here are similar to previous Pew Research Center reports based on the Census Bureau’s American Community Survey, although the Current Population Survey numbers tend to be lower. See Methodology for more detail.

Who lives in multigenerational households?

A chart showing that, among young adults,  men more likely than women to live in multigenerational homes

The likelihood of living in a multigenerational household varies notably by age, race, and nativity, and there are differences by geographic location as well. Among the greatest variations is gender disparity among young adults, the age group most likely to live in multigenerational homes.

Men and women overall are equally likely to live in multigenerational households, but men are more likely to do so among those younger than 40 and women are more likely to do so among those ages 40 and older. For example, among the 25- to 29-year-old group, young men (37%) are notably more likely to be in a multigenerational living arrangement than young women (26%). Among a broader age group of young adults than in this report – 18- to 34-year-olds – living with parents has been the dominant living arrangement for young men for more than a decade.

But among the oldest Americans – ages 65 and up – 20% of women live in multigenerational households, compared with 15% of men. Older Americans are less likely to live alone than they were several decades ago, a change linked to the growing share of older women who live with their spouse or children. 

By broad age group, Americans ages 25 to 39 and those ages 55 to 64 are about equally likely to live in multigenerational family households (each 22%). But within the younger group, those ages 25 to 29 (31%) are far more likely to live with multiple generations under one roof than those ages 30 to 34 (19%) or 35 to 39 (15%). Previous analysis has found that today’s young adults are more likely to be living in their parents’ home (and for longer stretches) than previous generations, and this is especially prevalent among those with a high school education compared with those with a bachelor’s degree or more education.

A chart showing that White Americans are the least likely to live in multigenerational households

Among major racial and ethnic groups, Americans who are Asian, Black or Hispanic are more likely than those who are White to live in a multigenerational family household. 

About a quarter of Asian (24%), Black (26%) and Hispanic (26%) Americans lived in multigenerational households in 2021, compared with 13% of those who are White. 

Immigrant status also is linked to the likelihood of multigenerational living. A higher share of foreign-born Americans (26%) than U.S.-born Americans (17%) live in a multigenerational family home. The greater propensity of immigrants to live in multigenerational households is true even after factoring in the racial and ethnic makeup of foreign-born Americans, who are less likely than the U.S. born to be non-Hispanic White.

Geography also factors into how likely people are to live in multigenerational homes. Americans living in Western states (21%) are more likely than those in the Midwest (14%), South (19%) or Northeast (19%) to reside with multiple generations under one roof. Those in the Midwest are less likely than those in other regions to be in multigenerational arrangements. Americans in metropolitan areas (19%) are somewhat more likely than those in rural communities (16%) to live in multigenerational family homes.

Drivers of growth in multigenerational households

Both the share and number of Americans living in multigenerational households have risen steadily since 1971, when this group numbered 14.5 million compared with 2021’s 59.7 million. Growth accelerated during the Great Recession of 2007-2009 and has continued at a slower pace since then, but there is no sign that the multigenerational household population total has peaked. 

The slackened growth of the multigenerational household population echoes broader sluggish trends. U.S. population growth from 2010-2020 was the smallest for any decade since the 1930s, and growth in the number of households was at the lowest pace in U.S. history. The number of new immigrants, already slowing in recent years, slumped during the pandemic.

Since 2000, the multigenerational household population has grown by 22.1 million people, but some groups played a larger role than others in driving that change. Americans younger than 40 accounted for almost half (49%) of the increase in the multigenerational household population but only 17% of overall population growth. In general, young adults are marrying later and staying in school longer than previous generations, which may contribute to their rising inclination to live with other family members under one roof.   

Americans in multigenerational households less likely to live in poverty

A chart showing residents of multigenerational households are less likely to be poor than those in other living situations

Multigenerational households can have financial advantages. Pooling financial resources means that family helps out in hard times. Some of these households have more earners than non-multigenerational arrangements, providing a safety net if one person loses a job. However, multigenerational households are larger than other types, so any money brought in may need to cover more people.

Living in a multigenerational household appears to offer protection against falling into poverty, according to census data. Poverty levels are lower for Americans living in multigenerational households (10%) than other types of households (12%). In 2021 data, the share of people in poverty during the previous year was lower in multigenerational households for White, Black and Hispanic Americans.

The sharpest difference was for adults ages 85 and older. Among this group, 8% in multigenerational households lived in poverty, compared with 13% of those in other types of homes. (The data source does not include elderly living in nursing homes.)

Groups that are more economically vulnerable had even more benefit from living in multigenerational households. For those who are Hispanic, 13% of those in multigenerational households lived in poverty, compared with 19% of those in other living situations. For Black Americans, the difference was 15% in multigenerational homes compared with 21% in other households. For those who are White, who as a group have higher median household incomes, the advantages were more modest.

A chart showing that unemployed and disabled workers less likely to be poor if they live in multigenerational households

Among the unemployed, 11% of those living in multigenerational households were below the poverty line, compared with 19% of those in other living arrangements. Unemployed Americans were more likely than others to live in multigenerational households (28% did in 2021 vs. 18% of those who are employed).

Those with a disability that limits or prevents them from working, another group of Americansat risk of poverty, also appear to benefit from being in a multigenerational household. This group is more likely to live in a multigenerational home than people without a work disability (24% compared with 19%). Those with a work disability who live in a multigenerational household are less likely to be poor (16%) than their counterparts who live in another type of home (27%). 

The current analysis did not include household income data, but a previous analysis found that median adjusted household income was slightly lower in multigenerational households than other types. However, the reverse was true for homes headed by Black, Hispanic, and foreign-born householders: Incomes were higher in multigenerational homes for those groups. Even multigenerational households with unemployed residents had higher adjusted median incomes than other types of households where unemployed residents lived.

2. The experiences of adults in multigenerational households

There are a variety of reasons why adults live in multigenerational households, but financial considerations top the list.3 Many also say that this is just the arrangement they’ve always had or that caring for an adult family member or receiving care is a reason for their living arrangement. Relatively few say the reasons they live in a multigenerational household are related to the COVID-19 pandemic. 

While a majority of adults in multigenerational households say caregiving, either for an adult or a child, is a reason for their living arrangement, a quarter say caregiving is, in fact, occurring in their household. Those with lower and middle incomes are more likely than upper-income adults in these households to say this is the case. 

For the most part, adults living in multigenerational households say this has been a positive experience, with at least half saying their arrangement is often convenient and rewarding. Still, about a quarter say living with other adult family members can be stressful all or most of the time, and this is particularly the case among adult children living with a parent. 

The experiences of adults in multigenerational households often vary by income; and, among adult children living with a parent, by age. For example, those with lower incomes are more likely than those with middle and upper incomes to say there’s not enough space to live comfortably. Younger adults (ages 25 to 39) who are living with a parent are much more likely than those ages 40 and older to see financial benefits in the arrangement and much less likely to say they contribute anything toward the mortgage or rent in their household. 

Four-in-ten adults in multigenerational households cite financial issues as a major reason for their living arrangement

A chart showing financial issues top the list of reasons why people live in multigenerational households

Four-in-ten adults in multigenerational households say financial issues are a major reason why they live with adult family members other than a spouse or partner; another 28% say this is a minor reason. Similar shares across racial, ethnic and income groups cite financial issues as a reason why they live in a multigenerational household.

About three-in-ten (28%) cite the fact that this is just the arrangement they’ve always had as a major reason for living in a multigenerational household, while a similar share (25%) say caring for an adult family member or receiving care themselves is a major reason. Smaller shares say each of the following is a major reason for their living arrangement: a change in their relationship status, such as the death of a partner or the end of a relationship (15%), for companionship (12%), or to provide or receive help with child care (12%). 

A chart showing those with upper incomes are the least likely to say caregiving is a reason for their living arrangement

The degree to which caregiving arrangements are tied to multigenerational living differs by income. Adults with lower and middle incomes are more likely than those with upper incomes to say caregiving is at least a minor reason why they live in a multigenerational household. About half of lower-income adults (51%) and 45% of those with middle incomes say caring for an adult family member or receiving care themselves is a reason, compared with 32% of those with upper incomes. And while 32% of those with lower incomes say providing or receiving help with child care is a reason why they live with other adult family members, 20% of those with middle incomes and an even smaller share of those with upper incomes (9%) say the same.  

Among adults who are living with a parent, reasons for living in a multigenerational household vary considerably by age. Some 57% of younger adults (those ages 25 to 39) who live with a parent say financial issues are a major reason why; 31% of those ages 40 or older say the same. In turn, half of adults ages 40 and older who live with a parent say caring for an adult family member or receiving care is a major reason, compared with only 19% of those in the younger group. Adults ages 40 and older who are living with a parent (23%) are also more likely than those younger than 40 (11%) to say a change in relationship status, such as the death of a partner or the end of a relationship, is a major reason for their living arrangement.  

For the most part, men and women who live with a parent give similar reasons for why they live in a multigenerational household, but men are more likely than women to say this is the arrangement they’ve always had (36% of men vs. 25% of women who live with a parent cite this as a major reason), while women are more likely than men to say a change in relationship status is a major reason (22% vs. 11%). 

About one-in-eight adults in multigenerational households cite the pandemic as a factor

Most adults in multigenerational households (86%) say none of the reasons why they live with adult family members other than a spouse or partner are related to the coronavirus outbreak, but 13% say the pandemic is a factor in their living arrangement. Among those with lower incomes, 16% say the coronavirus outbreak is a factor in why they live in a multigenerational household, compared with 9% of those with upper incomes; 12% of those with middle incomes say the same. 

When it comes to adults who are living with a parent, 17% of those ages 25 to 39 say at least one of the reasons why they live in a multigenerational household is related to the pandemic; just 9% of those 40 and older say the same. 

A majority of adults in multigenerational households say living with other adult family members has been a positive experience

Some 56% of adults in multigenerational households say living with adult family members (other than their spouse or partner) has been at least somewhat positive, with 30% saying it has been very positive; 17% say it has been negative, while 26% see it as neither positive nor negative. 

A chart showing adults with upper incomes are more likely than those with middle and lower incomes to say living in a multigenerational household has been positive

Assessments are particularly positive among those with upper incomes. About seven-in-ten upper-income adults in multigenerational households (71%) say their living arrangement has been at least somewhat positive, compared with 59% of those with middle incomes and 50% of those with lower incomes. About one-in-five lower-income adults in these households (21%) say their experience has been at least somewhat negative; smaller shares of those with middle and upper incomes say the same (15% and 9%, respectively). 

Parents who are living with an adult child (60%) are more likely than adults who are living with a parent (52%) to say their experience has been at least somewhat positive. Among adults living with a parent, younger adults (ages 25 to 39) are much less likely than those ages 40 and older to say living in a multigenerational household has been at least somewhat positive (43% vs. 64%, respectively). 

At least half find living in a multigenerational household convenient and rewarding, but some say it is stressful

A chart showing that about six-in-ten say living in a multigenerational household is convenient all or most of the time

About six-in-ten adults in multigenerational households (58%) say they find living with adult family members other than a spouse or partner to be convenient all or most of the time; 54% say it is rewarding. Still, roughly a quarter (23%) find living in a multigenerational household to be stressful all or most of the time. 

Similar shares of parents living with an adult child and adults living with a parent say living in a multigenerational household is convenient or rewarding, but adult children are more likely than parents to say their living situation is stressful all or most of the time. About three-in-ten adult children living with a parent (31%) say this, compared with 18% of parents living with an adult child. 

When it comes to the shares who find living in a multigenerational household to be convenient or rewarding, there are some differences by gender and age. Mothers who live with an adult child are more likely than fathers in this situation to say living in a multigenerational household is convenient (64% of mothers vs. 44% of fathers) and rewarding (60% vs. 47%) all or most of the time. While there are no similar gender differences among adults living with a parent, there are age differences in the shares saying their living situation is rewarding all or most of the time: 64% of those ages 40 and older say this, compared with 44% of those ages 25 to 39.

Half of lower-income adults in multigenerational households see financial benefits in their living arrangement

A chart showing three-in-ten adults living with a parent see living in a multigenerational household as very helpful financially

While financial issues are widely cited as a reason for living in a multigenerational household, adults with lower incomes are particularly likely to say this type of living arrangement is helpful to them financially. Half of lower-income adults in multigenerational households say living with adult family members other than a spouse or partner helps them financially at least a little, including 29% who say it helps a lot. Among those with middle incomes, 36% say living in a multigenerational household is helpful financially, while an even smaller share of those with upper incomes (24%) say the same. Overall, 22% of adults in multigenerational households say living with other adult family members helps their finances a lot and another 18% say it helps a little. 

Adults living with a parent are far more likely than parents living with an adult child to say being in a multigenerational household helps them financially. Some 53% of adults who live with a parent say this helps their personal financial situation at least a little, with 30% saying it helps a lot. Younger adults living with a parent are more likely than those ages 40 and older to say their living arrangement helps a lot (37% vs. 23%).

Among parents living with an adult child, just 29% say their living arrangement helps their personal finances, including 16% who say it helps a lot. About three-in-ten parents who live with an adult child (28%) say their living arrangement hurts their personal finances at least a little, compared with 17% of adults who live with a parent that say the same.  

Upper-income adults in multigenerational households are more likely than those with lower incomes to see their living situation as temporary

About half of adults younger than 40 living with a parent see their living situation as temporary

A plurality of adults in multigenerational households (41%) say their living arrangement is a long-term situation; 34% see it as temporary, and 24% say they don’t know. Upper-income adults in these types of households (47%) are more likely than those with middle (35%) and lower (31%) incomes to say this is temporary. Those with lower incomes express more uncertainty than those with middle or upper incomes: 28% of lower-income adults in multigenerational households say they don’t know if their living situation is temporary or long-term, compared with 21% of those with middle incomes and 17% of those with upper incomes. 

Among adults living with a parent, assessments vary widely by age. A majority of those ages 40 and older (66%) say living in a multigenerational household is a long-term situation, while just 15% say it’s temporary and 19% say they don’t know. By contrast, about half of 25- to 39-year-olds living with a parent (49%) say their living situation is temporary; 30% see it as long-term and 20% don’t know. Overall, 47% of adult children living with a parent say their arrangement is long-term, compared with 38% of parents living with an adult child. 

Most adults in multigenerational homes say there is plenty of space in their home

A chart showing about half of adults younger than 40 living with a parent see their living situation as temporary

About seven-in-ten adults who live with adult family members other than a spouse or partner (72%) say there is plenty of space to live comfortably in their home, but assessments vary considerably across income tiers. Nine-in-ten of those with upper incomes say there is plenty of space to live comfortably, compared with 79% of those with middle incomes and 62% of those with lower incomes. 

The survey also asked this question of adults ages 25 and older who do not live in a multigenerational household. An even larger share among this group (82%) say there is plenty of space in their home to live comfortably, while 17% say this is not the case (28% of adults in multigenerational households say there isn’t enough space to live comfortably).

Contributing to expenses, chores and caregiving in multigenerational households varies by household arrangement, age

A chart showing three-in-ten adults living with a parent don’t pay any of the rent or mortgage

Half of adults in multigenerational households say they pay more than half of the rent or mortgage where they live, including 39% who say they pay for all of it.4 In turn, 36% say they pay less than half of the rent or mortgage for their household, including 26% who say they don’t pay any of it. Some 14% say they pay half.

A majority of parents living with an adult child say they pay more than half of the rent or mortgage, including 51% who say they pay all of it. About a quarter (26%) say they pay some but less than half or don’t pay anything.5 In contrast, only about a third of adult children living with a parent say they pay more than half of the rent or mortgage, with 25% saying they pay all of it. Some 43% say they pay some but less than half (13%) or don’t pay anything (30%).

The extent to which adults living with a parent contribute to the rent or mortgage varies considerably by age. Among those ages 25 to 39, 37% say they don’t pay any of the rent or mortgage; about a quarter of those ages 40 and older (23%) say the same. In turn, about twice as many of those ages 40 and older say they pay all of the rent or mortgage compared with those ages 25 to 39 (35% vs. 16%). 

There are also income differences in reported contributions to the rent or mortgage. Three-in-ten adults with lower incomes say they don’t pay any of the rent or mortgage, compared with 23% of middle-income and 20% of upper-income adults. Upper-income adults (68%) are more likely to say they pay all of the rent or mortgage than those with middle (47%) or lower incomes (26%).

A chart showing contributing to household expenses varies by age for adults living with a parent

The survey also asked respondents about their contributions to household expenses such as groceries and utility bills. About six-in-ten adults in multigenerational households say they pay for more than half of the household expenses; this includes 37% who say they pay for all of these expenses. A quarter say they pay less than half, with 6% saying they don’t pay anything. Another 16% say they pay half of these expenses.

Most parents living with their adult children say they pay more than half (26%) or all of the household expenses (45%). The responses from adult children living with a parent demonstrate more of a range in contributions: 26% say they pay all of the household expenses, 21% say they pay more than half but not all, 21% say they pay half, and 23% say they pay for some but less than half of these expenses. About one-in-ten of these adults (9%) say they don’t pay any of these expenses. 

These contributions also vary by age: adults ages 40 and older living with a parent are more likely to say they pay all of the household expenses compared with those ages 25 to 39 (36% vs. 18%). Adults under 40 in these households are about twice as likely as those 40 and older to say they pay some but less than half or don’t pay any of the household expenses (42% vs. 20%). 

While similar shares of adults across income tiers say they don’t pay any of the household expenses, those with upper incomes (59%) are more likely than those with middle (44%) and lower incomes (26%) to say they pay for all of them.

Women more likely than men in multigenerational households to say they cover more than half of the household chores and responsibilities 

A chart showing women more likely than men to say they do all the chores in multigenerational households

Many people contribute to their multigenerational households beyond paying for expenses, with 61% of adults in these households saying they do more than half of the household chores and other responsibilities, including 27% who say they do all of them. About one-in-five (19%) say they do half, and a similar share say they do less than half (17%) or don’t do any (3%).

A majority of parents living with an adult child say they do more than half of the chores, including 31% who say they do all of them. This compares with 54% of adults living with a parent who say they do more than half of the chores, with about a quarter saying they do all of them. About one-in-five of those living with a parent (22%) say they do less than half or none of the chores. 

Again, these contributions vary by the age of the adult living with a parent. Those ages 40 and older (34%) are about twice as likely as their counterparts under age 40 (15%) to say they do all of the chores. And while about three-in-ten of those ages 25 to 39 (29%) say they do less than half or none of the chores, just 14% of those in the older group say the same about their contributions to household chores. 

Women in multigenerational households are more likely than their male counterparts to say they do more than half or all of the household chores and responsibilities. Two-thirds of women (66%) say this, compared with 56% of men. Men ages 25 to 49 are the least likely to say they do more than half or all of the chores (44% vs. 59% of women in the same age group and about seven-in-ten men and women ages 50 and older, 68% and 69%, respectively). 

A quarter of adults say caregiving occurs in their multigenerational household

Among the quarter of adults who say caregiving occurs, equal shares say it is for an adult or for a child

About one-in-ten adults in multigenerational households (11%) say an adult provides personal care for another adult in the household who is not the caregiver’s spouse or partner; the same share say an adult provides care for a child under age 18 in the household who is not their own.6 Some 3% of adults in multigenerational households say care occurs for both an adult and child in their household.  

The share who say caregiving occurs in their household varies by income. Adults with lower (30%) and middle incomes (24%) are more likely than those with upper incomes (15%) to say caregiving occurs in their household. When asked if they personally provide care for a child younger than 18 who is not their own in the household, lower- and middle-income adults are more likely than upper-income adults to say they do this at least sometimes (16% and 11% vs. 3%); similar shares across income groups say they personally provide adult care at least sometimes.

Men and women in multigenerational households are about equally likely to say they personally provide child care for a child in the household who’s not their own at least sometimes. Among men, 15% say they provide personal care for another adult in the household; 10% of women say they do this. 

About one-in-five adults living with a parent (18%) say they personally provide care for another adult who is not their spouse or partner in the household at least sometimes. This compares with 11% of parents living with an adult child who say they personally provide care for another adult at least sometimes. 

Adults living with a parent age 65 or older are especially likely to say they personally provide care for another adult in their household: about a quarter (23%) say they do this at least sometimes, compared with 8% of those living with a parent under 65.

Acknowledgments

This report is a collaborative effort based on the input and analysis of the following individuals. Find related reports online at pewresearch.org/topic/family-relationships

Kim Parker, Director, Social Trends Research                                 
Juliana Horowitz, Associate Director, Research                               
D’Vera Cohn, Senior Writer/Editor
Rachel Minkin, Research Associate   
Richard Fry, Senior Economist                              
Jeffrey S. Passel, Senior Demographer
Kiley Hurst, Research Assistant                                                        
Stella Sechopoulos, Research Assistant                               
Anna Brown, Research Associate      
Tanya Arditi, Communications Manager      
Gar Meng Leong, Communications Associate                                  
Julia O’Hanlon, Communications Associate                          
Michael Keegan, Senior Information Graphics Designer
Travis Mitchell, Copy Editor and Digital Producer  

In addition, the project benefited greatly from the guidance of the Pew Research Center methodology team: Courtney Kennedy, Andrew Mercer, Ashley Amaya, Nick Bertoni, Dorene Asare-Marfo, Nick Hatley and Arnold Lau.

Methodology

The American Trends Panel Methodology

Overview

The American Trends Panel (ATP), created by Pew Research Center, is a nationally representative panel of randomly selected U.S. adults. Panelists participate via self-administered web surveys. Panelists who do not have internet access at home are provided with a tablet and wireless internet connection. Interviews are conducted in both English and Spanish. The panel is being managed by Ipsos.

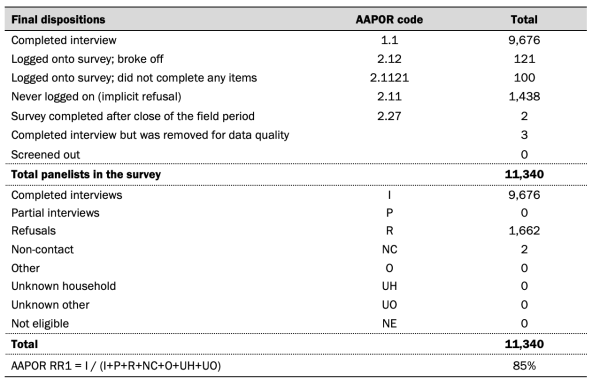
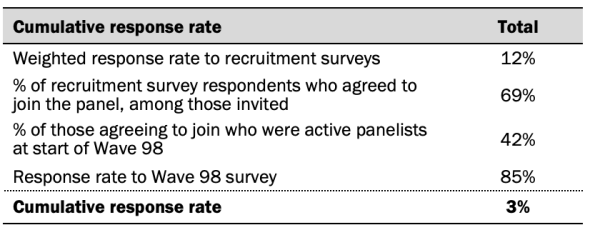
Data in this report is drawn from the panel wave conducted from Oct. 18 to Oct. 24, 2021.  A total of 9,676 panelists responded out of 11,340 who were sampled, for a response rate of 85%. The cumulative response rate accounting for nonresponse to the recruitment surveys and attrition is 3%. The break-off rate among panelists who logged on to the survey and completed at least one item is 1%. The margin of sampling error for the full sample of 9,676 respondents is plus or minus 1.6 percentage points. 

Panel recruitment

A chart showing American Trends Panel recruitment surveys

The ATP was created in 2014, with the first cohort of panelists invited to join the panel at the end of a large, national, landline and cellphone random-digit-dial survey that was conducted in both English and Spanish. Two additional recruitments were conducted using the same method in 2015 and 2017, respectively. Across these three surveys, a total of 19,718 adults were invited to join the ATP, of whom 9,942 (50%) agreed to participate.

In August 2018, the ATP switched from telephone to address-based recruitment. Invitations were sent to a stratified, random sample of households selected from the U.S. Postal Service’s Delivery Sequence File. Sampled households receive mailings asking a randomly selected adult to complete a survey online. A question at the end of the survey asks if the respondent is willing to join the ATP. Starting in 2020, another stage was added to the recruitment. Households that do not respond to the online survey are sent a paper version of the questionnaire, $5 and a postage-paid return envelope. A subset of the adults returning the paper version of the survey are invited to join the ATP. This subset of adults receive a follow-up mailing with a $10 pre-incentive and invitation to join the ATP.

Across the four address-based recruitments, a total of 19,578 adults were invited to join the ATP, of whom 17,257 agreed to join the panel and completed an initial profile survey.

In each household, the adult with the next birthday was asked to go online to complete a survey, at the end of which they were invited to join the panel. Of the 27,199 individuals who have ever joined the ATP, 11,498 remained active panelists and continued to receive survey invitations at the time this survey was conducted.The U.S. Postal Service’s Delivery Sequence File has been estimated to cover as much as 98% of the population, although some studies suggest that the coverage could be in the low 90% range.7 The American Trends Panel never uses breakout routers or chains that direct respondents to additional surveys.

Sample design                                                                                                  

The overall target population for this survey was non-institutionalized persons ages 18 and older, living in the U.S., including Alaska and Hawaii. 

This study featured a stratified random sample from the ATP. The sample was allocated according to the following strata, in order: tablet households, foreign-born Hispanics, U.S.-born Hispanics, not registered to vote, high school education or less, foreign-born Asian Americans, people ages 18 to 34, non-Hispanic Black Americans, people who use the internet weekly or less, nonvolunteers and all other categories not already falling into any of the above. Respondent weights are adjusted to account for differential probabilities of selection as described in the Weighting section below.

Questionnaire development and testing

The questionnaire was developed by Pew Research Center in consultation with Ipsos. The web program was rigorously tested on both PC and mobile devices by the Ipsos project management team and Pew Research Center researchers. The Ipsos project management team also populated test data that was analyzed in SPSS to ensure the logic and randomizations were working as intended before launching the survey. 

Incentives

All respondents were offered a post-paid incentive for their participation. Respondents could choose to receive the post-paid incentive in the form of a check or a gift code to Amazon.com or could choose to decline the incentive. Incentive amounts ranged from $5 to $20 depending on whether the respondent belongs to a part of the population that is harder or easier to reach. Differential incentive amounts were designed to increase panel survey participation among groups that traditionally have low survey response propensities.

Data collection protocol

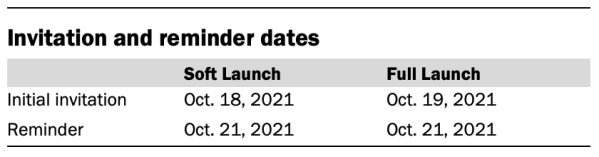
The data collection field period for this survey was Oct. 18 to Oct. 24, 2021. Postcard notifications were mailed to all ATP panelists with a known residential address on Oct. 18.  

Invitations were sent out in two separate launches: Soft Launch and Full Launch. Sixty panelists were included in the soft launch, which began with an initial invitation sent on Oct. 18, 2021. The ATP panelists chosen for the initial soft launch were known responders who had completed previous ATP surveys within one day of receiving their invitation. All remaining English- and Spanish-speaking panelists were included in the full launch and were sent an invitation on Oct. 19.

All panelists with an email address received an email invitation and up to one email reminder if they did not respond to the survey. All ATP panelists that consented to SMS messages received an SMS invitation and up to one SMS reminder. 

A chart showing invitation and reminder dates

Data quality checks

To ensure high-quality data, the Center’s researchers performed data quality checks to identify any respondents showing clear patterns of satisficing. This includes checking for very high rates of leaving questions blank, as well as always selecting the first or last answer presented. As a result of this checking, three ATP respondents were removed from the survey dataset prior to weighting and analysis. 

Weighting

A chart showing weighting dimensions

The ATP data is weighted in a multistep process that accounts for multiple stages of sampling and nonresponse that occur at different points in the survey process. First, each panelist begins with a base weight that reflects their probability of selection for their initial recruitment survey. The base weights for panelists recruited in different years are scaled to be proportionate to the effective sample size for all active panelists in their cohort and then calibrated to align with the population benchmarks in the accompanying table to correct for nonresponse to recruitment surveys and panel attrition. If only a subsample of panelists was invited to participate in the wave, this weight is adjusted to account for any differential probabilities of selection. 

Among the panelists who completed the survey, this weight is then calibrated again to align with the population benchmarks identified in the accompanying table and trimmed at the 1st and 99th percentiles to reduce the loss in precision stemming from variance in the weights. Sampling errors and tests of statistical significance take into account the effect of weighting.

Some of the population benchmarks used for weighting come from surveys conducted prior to the coronavirus outbreak that began in February 2020. However, the weighting variables for panelists recruited in 2021 were measured at the time they were recruited to the panel. Likewise, the profile variables for existing panelists were updated from panel surveys conducted in July or August 2021.

This does not pose a problem for most of the variables used in the weighting, which are quite stable at both the population and individual levels. However, volunteerism may have changed over the intervening period in ways that made their 2021 measurements incompatible with the available (pre-pandemic) benchmarks. To address this, volunteerism is weighted using the profile variables that were measured in 2020. For all other weighting dimensions, the more recent panelist measurements from 2021 are used. 

For panelists recruited in 2021, plausible values were imputed using the 2020 volunteerism values from existing panelists with similar characteristics. This ensures that any patterns of change that were observed in the existing panelists were also reflected in the new recruits when the weighting was performed.

The following table shows the unweighted sample sizes and the error attributable to sampling that would be expected at the 95% level of confidence for different groups in the survey. 8

A chart showing unweighted sample size and margin of error

Sample sizes and sampling errors for other subgroups are available upon request. In addition to sampling error, one should bear in mind that question wording and practical difficulties in conducting surveys can introduce error or bias into the findings of opinion polls.

Dispositions and response rates

A chart showing disposition and response rates
A chart showing dispositions and response rates

Adjusting income and defining income tiers

To create upper-, middle- and lower-income tiers, respondents’ 2020 family incomes were adjusted for differences in purchasing power by geographic region and household size. “Middle-income” adults live in families with annual incomes that are two-thirds to double the median family income in the panel (after incomes have been adjusted for the local cost of living and household size). The middle-income range for the American Trends Panel is about $42,000 to $125,900 annually for an average family of three. Lower-income families have incomes less than roughly $42,000, and upper-income families have incomes greater than roughly $125,900 (all figures expressed in 2020 dollars).

Based on these adjustments, 44% of respondents in multigenerational households are lower income, 42% are middle income and 7% fall into the upper-income tier. An additional 6% either didn’t offer a response to the income question or the household size question.

For more information about how the income tiers were determined, please see here.

Secondary data sources and Methodology

The analysis of the population living in multigenerational households is derived from the Annual Social and Economic Supplement (ASEC) of the Current Population Survey (CPS), which is conducted in March of every year. Administered jointly by the U.S. Census Bureau and the Bureau of Labor Statistics, the CPS is a monthly survey of approximately 70,000 households that typically interviews about 50,000 households. It is the source of the nation’s official statistics on unemployment. The ASEC survey in March typically features an expanded sample of about 95,000 households with about 70,000 interviews. However, response rates have decreased since the onset of the pandemic (discussed below). The ASEC collected in 2021 had about 63,000 households.

Prior Pew Research Center estimates of the size and share of the population residing in multigenerational households were based on the American Community Survey (ACS) and decennial census. The COVID-19 pandemic disrupted data collection for the 2020 ACS. The Census Bureau released the 2020 data with experimental weights and does not recommend comparing these data with earlier ACS estimates or the decennial census. Given this, and that more recent estimates are available based on the ASEC, this report utilizes the ASEC.

Estimates of size and share of the population living in a multigenerational household are lower using the ASEC than the ACS. That partly reflects the different populations covered in the two surveys. The upward trend in multigenerational living is however quite similar regardless of the survey used.

The onset of the COVID-19 pandemic impacted the data collection for the 2020 ASEC. The response rate for the March 2020 survey was about 10 percentage points lower than in preceding months. Using administrative data, Census Bureau researchers have shown that nonresponding households were less similar to respondents than in earlier years. They also generated entropy balance weights to account for this nonrandom nonresponse. The estimates published in this analysis for 2020 use these weights. The Census Bureau also produced entropy balance weights for 2021 but the estimates shown in this report use the regular weight for that year.

In this analysis, a multigenerational family household includes two or more adult generations or grandparents and grandchildren younger than 25. In households with two or more adult generations, “adult generation” is defined as either a person age 25 and older, or the householder. Householders mainly are 25 and older, but there are a relatively small number of two adult generation households with an 18- to 24- year-old householder and a parent or other member of an older generation who lives with them.

The Census Bureau uses a narrower definition of multigenerational households than we do. The major difference is that the bureau says multigenerational households must include at least three generations, where we require only two adult generations. Based on the Census Bureau’s definition, 3.8% of households were multigenerational in 2019. Using the definition employed in this analysis and the 2019 ASEC, 11.9% of households were multigenerational family households.

For more details about our methodology, see this explanation.