
Most Parents of K-12 Students Learning Online Worry About Them Falling Behind
Parents of children attending school in person are largely satisfied with steps to prevent coronavirus spread but still concerned about exposure
Pew Research Center conducted this study to understand how parents of children in K-12 schools in the United States assess the impact of the coronavirus outbreak on their children’s education amid changes in instruction this fall. The study also explores concerns among parents of K-12 students and younger children in light of the pandemic. This analysis is based on 2,561 U.S. parents of children younger than 18 who live in their household. The data was collected as a part of a larger survey conducted Oct. 13-19, 2020. Everyone who took part is a member of the Center’s American Trends Panel (ATP), an online survey panel that is recruited through national, random sampling of residential addresses. This way, nearly all U.S. adults have a chance of selection. The survey is weighted to be representative of the U.S. adult population by gender, race, ethnicity, partisan affiliation, education and other categories. Read more about the ATP’s methodology.
See here to read more about the questions used for this report and the report’s methodology.
“Parent” is defined here as the parent or guardian of a child under age 18 who lives in the household.
“Middle income” is defined here as two-thirds to double the median annual family income for panelists on the American Trends Panel. “Lower income” falls below that range; “upper income” falls above it. See the methodology for more details.
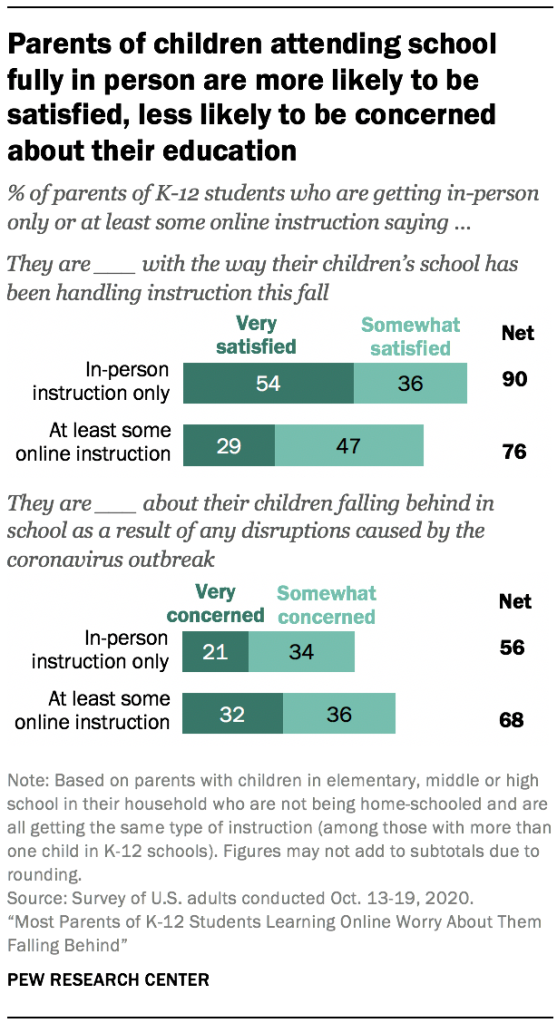
As school districts across the United States continue to grapple with the best way to provide instruction amid the coronavirus outbreak, most parents of students in K-12 schools express concern about their children falling behind in school because of disruptions caused by the pandemic. There are large divides between parents whose children are going to school fully in-person and those whose children are engaged in online learning when it comes to their assessments of and concerns about the education their kids are currently receiving, according to a new Pew Research Center survey.
Parents of K-12 students who are getting only in-person instruction are the most likely to say they are very satisfied with the way their children’s school is handling instruction amid the pandemic: 54% say this, compared with 30% of those whose children are getting online instruction only and 27% of parents whose children are getting a mix of in-person and online instruction.1 Still, large majorities of parents across these instruction types say they are at least somewhat satisfied with the way their children’s school is handling instruction.
Concerns about children falling behind in school are particularly common among parents of K-12 students who are getting at least some online instruction this fall; those whose children are getting a mix of in-person and online instruction are the most concerned. Seven-in-ten parents whose children are getting online instruction – either fully or in combination with in-person learning – say they or another adult in their household is providing at least some additional instruction or resources to their children beyond what is being provided by the school. This is significantly higher than the share among parents whose children are getting only in-person instruction (52%).
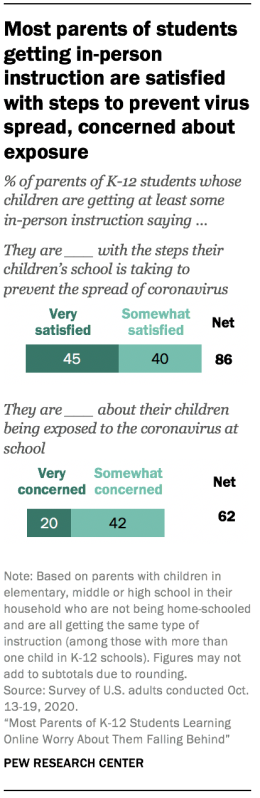
Among those whose children are attending school in person, 45% say they are very satisfied with the steps their children’s school is taking to prevent the spread of coronavirus, and this is especially so among parents whose children are receiving in-person instruction only (52% vs. 39% of those whose children are getting a mix of in-person and online instruction). Still, parents whose children are attending school in person express some concern about their children being exposed to coronavirus at school: 62% are at least somewhat concerned, with 20% saying they are very concerned.
The survey also finds some differences by income. For example, parents of K-12 students with lower incomes (72%) are more likely than middle-income (63%) and upper-income parents (55%) to say they are very or somewhat concerned about their children falling behind in school as a result of disruptions caused by the pandemic.2 And lower-income parents (72%) are more likely than those in the upper-income tier (58%) to say they or another adult in their household is providing at least some additional instruction or resources to their children beyond what is being provided by the school. In turn, upper-income parents are the most likely to say they have hired someone to provide additional instruction or resources (19% vs. 7% of middle-income and 8% of lower-income parents).
These are among the key findings of a Pew Research Center survey of 10,332 U.S. adults conducted Oct. 13-19, 2020, using the Center’s American Trends Panel.3 The survey, which includes 2,561 parents with children younger than 18 living in the household, also explores broader concerns of parents of children in K-12 schools and younger about the impact of the coronavirus outbreak on their children’s development and well-being.
Lower-income parents of K-12 students are more likely to say their children are getting online instruction only
With the fall semester underway, 46% of parents with children in elementary, middle or high school in their household report that their children are receiving online instruction only from their school; 20% say they’re getting only in-person instruction, and 23% say their children are getting a mix of online and in-person instruction (4% say they have different situations for different children).

The share of parents with children in K-12 education who say their children are being home-schooled has risen significantly since the spring: 7% this fall, compared with 3% in April. Lower- and middle-income parents are more likely than upper-income parents to say their children are being home-schooled (6% and 9% vs. 2%, respectively). In April, similar shares of parents across income levels said this.
Parents of K-12 students receiving only in-person instruction are more satisfied than those whose children are learning online

Among parents of K-12 students who are all getting the same type of instruction in school, 35% say they are very satisfied with the way their children’s school has been handling instruction; 44% are somewhat satisfied, while 21% are not too or not at all satisfied. Similar shares of parents across income levels say they are at least somewhat satisfied with the way their children’s school is handling instruction this fall.
Parents whose children are receiving in-person instruction only are, by far, the most satisfied with the way their children’s school has been handling instruction this fall: 54% of these parents say they are very satisfied, compared with 30% of parents whose children are getting online instruction only and 27% of those who say their children are getting a mix of in-person and online instruction. Still, three-quarters or more in each of the three groups say they are at least somewhat satisfied with the way their children’s school has been handling instruction.
Most parents of K-12 students are worried about their children falling behind in school because of pandemic-related disruptions

Amid disruptions caused by the coronavirus outbreak, a majority of parents of K-12 students (65%) express at least some concern about their children falling behind in school, with three-in-ten saying they are very concerned. Parents with lower incomes (72%) are more likely than middle-income (63%) and upper-income (55%) parents to say they are concerned about their children falling behind in school as a result of disruptions caused by the pandemic.
Parents whose children are getting a mix of in-person and online instruction are the most likely to be concerned about their children falling behind in school, and those whose children are getting in-person instruction only are the least likely to be concerned. About three-quarters of parents whose children are getting a mix of instruction (74%) say they are very or somewhat concerned about their children falling behind, compared with 65% of those whose children are getting online instruction only and 56% of those whose children are getting in-person instruction only.
Most parents of K-12 students say they or someone else in their household is providing additional instruction beyond what schools are providing

About two-thirds of parents of K-12 students (66%) say they or another adult in their household is providing additional instruction or resources to their children beyond what is being provided by the school. This is similar to the share who said this in April, when K-12 schools in all 50 states were closed because of the pandemic.
Parents whose children are receiving online instruction only (72%) or a mix of in-person and online instruction (66%) are more likely than those whose children are receiving in-person instruction only (52%) to say they or another adult in their household is providing at least some additional instruction or resources to their children. Among lower-income parents, 72% say they or another adult in their household is providing additional instruction or resources, compared with 58% of upper-income parents; 65% of middle-income parents say the same.

Upper-income parents of K-12 students are the most likely to say they have hired someone to provide additional instruction for their children
While many parents of K-12 students say they or another adult in their household is providing additional instruction or resources to their children beyond what is being provided by the school, a relatively small share (9%) say they have hired someone to do this. Parents whose children are getting a mix of in-person and online instruction are the most likely to say they have hired someone to do this (14% vs. 8% of those whose children are getting online instruction only and 6% of those whose children are getting in-person instruction only).
Among upper-income parents, 19% say they have hired someone to provide additional instruction or resources beyond what is being provided by their children’s school. Far smaller shares of those with lower (8%) or middle (7%) incomes say they have done this.
Most parents of K-12 students attending school in person are satisfied with steps to prevent virus spread, but majority are still concerned about children’s exposure

More than four-in-ten parents of K-12 students who are attending school in person (45%) say they are very satisfied with the steps their children’s school is taking to prevent the spread of the coronavirus; another 40% say they are somewhat satisfied. Parents whose children are getting in-person instruction only (52%) are far more likely than those whose children are getting a mix of in-person and online instruction (39%) to say they are very satisfied with the steps their children’s school is taking.
At the same time, 62% of parents of K-12 students who are getting at least some in-person instruction express concern about their children being exposed to the coronavirus at school; 20% say they are very concerned. Similar shares of those whose children are getting in-person instruction only and those whose children are getting a mix of in-person and online instruction say they are very or somewhat concerned about this.
Majorities of parents of K-12 students more concerned now than before pandemic about screen time, social connections, emotional well-being, access to extracurricular activities
Majorities of parents of K-12 students say that, compared with before the coronavirus outbreak, they are more concerned about each of the following for their children: having too much screen time (63% say they are more concerned about this now than before the outbreak), maintaining social connections and friendships (60%), their emotional well-being (59%) and having access to extracurricular activities (58%). About half (52%) say they are more worried about their children not getting enough exercise than they were before the coronavirus outbreak, while 31% say they are now more worried about their children spending too much time unsupervised.

Parents’ concerns vary considerably depending on the type of instruction children are getting from their K-12 school. In particular, on five of the six items, parents whose children are getting at least some online instruction are more likely than those whose children are getting in-person instruction only to say they are more concerned than they were before the coronavirus outbreak. For example, 64% of parents whose children are getting online instruction only and 60% of those whose children are getting a mix of online and in-person instruction say they are now more concerned about their children maintaining social connections and friendships; 49% of parents whose children are getting in-person instruction only say the same.
Upper-income parents of K-12 students are more likely than those with middle or lower incomes to say they are now more concerned than they were before the coronavirus outbreak about their children maintaining social connections and friendships and having access to extracurricular activities; and upper-income parents are more likely than lower-income parents to say they are now more concerned about their children having too much screen time and about their children’s emotional well-being.
Amid coronavirus disruptions, parents of young children express more concern about development of social skills than about language or physical skills

Parents of children who are not yet school age, much like parents of school-age children, have concerns about their children’s development as a result of disruptions caused by the coronavirus outbreak. Some 47% of parents of children who are preschool age or younger say they are more worried now than before the outbreak about their young children falling behind in developing social skills. Smaller shares say they are more concerned now than before about their young children falling behind in developing language skills (30%) and physical or motor skills (24%). Majorities of parents of children who are not yet school age say they are about as concerned as they were before the coronavirus outbreak about their children’s development when it comes to physical or motor skills (62%) and language skills (59%); 46% say the same about social skills.
Among parents with children in child care settings, 47% are very satisfied with the steps their day care or preschool is taking to prevent the spread of coronavirus; 34% are somewhat satisfied, while 17% are not too or not at all satisfied. Overall, 36% of parents with children who are preschool age or younger say their children currently regularly attend a day care or preschool, while 64% say their children do not.


