Pew Research Center

FOR RELEASE JANUARY 9, 2020

Most Americans Say There Is Too Much Economic Inequality in the U.S., but Fewer Than Half Call It a Top Priority

Democrats and Republicans differ on whether addressing economic inequality requires major changes to the economic system

BY Juliana Menasce Horowitz, Ruth Igielnik and Rakesh Kochhar

FOR MEDIA OR OTHER INQUIRIES:

Communications Department
202.419.4372
www.pewresearch.org

RECOMMENDED CITATION

Pew Research Center, January 2020, "Most Americans Say There Is Too Much Economic Inequality in the U.S., but Fewer Than Half Call It a Top Priority"

About Pew Research Center

Pew Research Center is a nonpartisan, nonadvocacy fact tank that informs the public about the issues, attitudes and trends shaping the world. It does not take policy positions. The Center conducts public opinion polling, demographic research, computational social science research and other data-driven research. It studies politics and policy; news habits and media; the internet and technology; religion; race and ethnicity; international affairs; social, demographic and economic trends; science; research methodology and data science; and immigration and migration. Pew Research Center is a subsidiary of The Pew Charitable Trusts, its primary funder.

© Pew Research Center 2026

Table of contents

  • About Pew Research Center
  • Most Americans Say There Is Too Much Economic Inequality in the U.S., but Fewer Than Half Call It a Top Priority
  • 1. Trends in income and wealth inequality
  • 2. Views of economic inequality
  • 3. What Americans see as contributors to economic inequality
  • 4. Views on reducing economic inequality
  • Acknowledgments
  • Methodology

Most Americans Say There Is Too Much Economic Inequality in the U.S., but Fewer Than Half Call It a Top Priority

Democrats and Republicans differ on whether addressing economic inequality requires major changes to the economic system

How we did this

Economic inequality has increasingly become a part of the U.S. national political conversation. We conducted this study to further understand how Americans feel about this issue and how those views differ by partisanship and by key demographic variables – particularly income.

For this report, we surveyed 6,878 U.S. adults in September 2019. The report also includes some findings from a separate survey conducted in early September. The adults who were surveyed are members of Pew Research Center’s American Trends Panel (ATP), an online survey panel that is recruited through national, random sampling of residential addresses. Recruiting our panelists by phone or mail ensures that nearly all U.S. adults have a chance of selection. This gives us confidence that any sample can represent the whole U.S. adult population (see our Methods 101 explainer on random sampling).

To further ensure that each ATP survey reflects a balanced cross-section of the nation, the data are weighted to match the U.S. adult population by gender, race, ethnicity, partisan affiliation, education and other categories. Read more about the ATP’s methodology and the methodology for this report.

To create the upper-, middle- and lower-income tiers used in this report, family incomes were adjusted for differences in purchasing power by geographic region and for household size. Respondents were then placed into income tiers using a similar methodology to the Center’s previous work on the American middle class: Middle income is defined as two-thirds to double the median annual income for the survey sample. Lower income falls below that range, and upper income falls above it. For more information about how the income tiers were created, see the methodology section of this report.

With about a month to go before the first caucuses and primaries, the issue of economic inequality and how to tackle it remains a focal point in the race for the Democratic presidential nomination, and it will likely continue to be a central issue in the general election. About six-in-ten U.S. adults say there’s too much economic inequality in the country these days, and among that group, most say addressing it requires significant changes to the country’s economic system, according to a new Pew Research Center survey.

A majority of Americans say there’s too much economic inequality in the U.S …

Still, relative to other issues, reducing economic inequality doesn’t rank high on the public’s list of priorities for the federal government to address. About four-in-ten say this should be a top priority, far smaller than the shares who say the same about making health care more affordable, dealing with terrorism or reducing gun violence.

Democrats and Democratic leaners are much more likely than Republicans and those who lean to the GOP to say reducing economic inequality should be a top priority for the government (61% vs. 20%).1 Similarly, Democrats are nearly twice as likely as Republicans to say there’s too much economic inequality in the U.S. these days (78% vs. 41%).

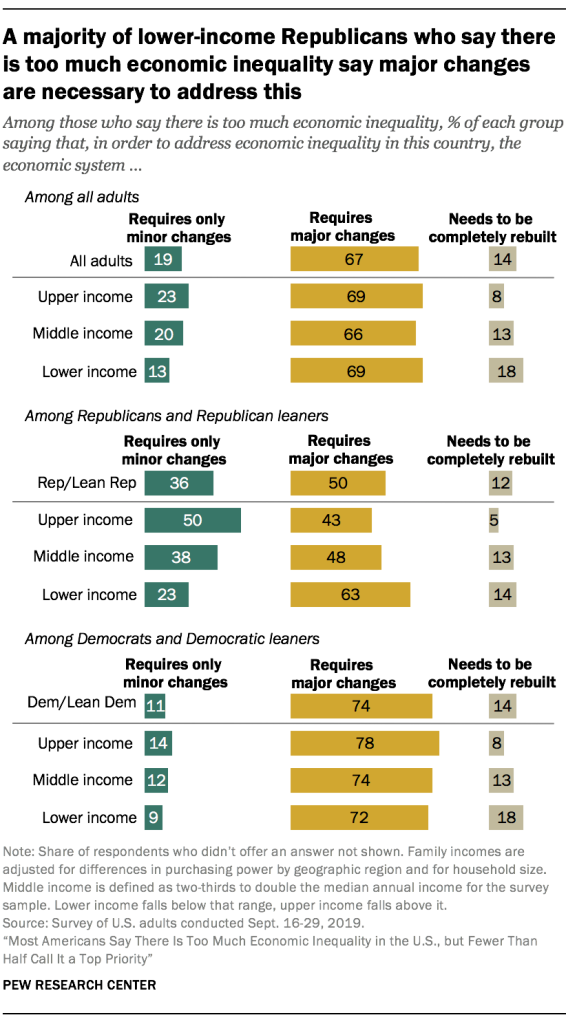
Among those who say there’s too much economic inequality, seven-in-ten think some amount of inequality is acceptable, and this is the case among majorities of Democrats (68%) and Republicans (77%). About three-quarters of Democrats who say there’s too much economic inequality (74%) say addressing it would require major changes to the economic system, and 14% say the system needs to be completely rebuilt. Half of their Republican counterparts say the system requires major changes, and 12% think it needs to be rebuilt.

About half of adults with lower incomes consider reducing economic inequality a top policy priority

In addition to partisan differences, the survey finds that views on economic inequality often vary across income levels. For example, about half of lower-income Americans (52%) say reducing economic inequality should be a top priority for the federal government to address; smaller shares of those with middle (39%) or upper incomes (36%) agree. And while somewhat similar shares across income groups say there’s too much inequality in the country these days, 85% of upper-income adults who say this think some amount of inequality is acceptable, compared with 72% of those with middle incomes and 59% of those with lower incomes.

Republicans are more likely than Democrats to point to personal factors as major contributors to inequality

Asked about what contributes to economic inequality in this country, Democrats are more likely than Republicans to point to structural factors, such as the tax system (56% of Democrats vs. 30% of Republicans say this contributes a great deal) and problems with the U.S. educational system (49% vs. 38%). In turn, Republicans are more likely than Democrats to say that the different life choices people make (60% of Republicans vs. 27% of Democrats) and some people working harder than others (48% vs. 22%) contribute a great deal to economic inequality.

These findings come as economic inequality in the U.S. continues to widen. In 2018, households near the top of the income ladder had incomes that were 12.6 times higher than those near the bottom. By comparison, in 1980, households near the top had incomes about nine times the incomes of households near the bottom.2 When it comes to wealth accumulation, only those families ranked in the top 20% in terms of net worth have gained back the wealth lost during the Great Recession. Today the median net worth of those families is 13% higher than it was in 2007, while the net worth of families in the 20th to the 40th percentiles of the wealth distribution is 39% lower than in 2007, according to Pew Research Center analysis of government data.3

The nationally representative survey of 6,878 U.S. adults was conducted online from Sept. 16-29, 2019, using Pew Research Center’s American Trends Panel.4 Among the other key findings:

Most Americans who say there’s too much economic inequality say the federal government and big corporations should have a lot of responsibility in reducing it

Of those who see too much economic inequality, parties differ on who is responsible for reducing it

About two-thirds of Americans who think there’s too much economic inequality in the country these days (66%) say the federal government should have a lot of responsibility in reducing it, and 62% say large businesses and corporations should have a lot of responsibility in this area. About half (52%) say state governments should have a lot of responsibility in reducing inequality, and 46% say the same about wealthy individuals.

By double-digit margins, Democrats who say there’s too much economic inequality in the country are more likely than their Republican counterparts to say the state or federal government, corporations, and wealthy individuals should have a lot of responsibility in reducing inequality. Fully three-quarters of Democrats who say there’s too much economic inequality say the federal government should have a lot of responsibility in reducing it, compared with 44% of Republicans who say there’s currently too much inequality.

More than half of Republicans and Democrats who say there’s too much economic inequality say ensuring workers have the right job skills would do a great deal to reduce it

Of those who see too much economic inequality, Republicans are less convinced than Democrats that several measures would reduce inequality

Most adults who say there’s too much economic inequality in the U.S. say ensuring workers have the skills they need for today’s jobs (62%) and increasing taxes on the wealthiest Americans (60%) would do a great deal to reduce inequality, regardless of whether or not they personally support these measures. More than four-in-ten say making college tuition free at public two- and four-year colleges and universities, expanding Medicare to cover Americans of all ages, increasing the federal minimum wage and eliminating college debt would do a great deal to reduce economic inequality.

Republicans and Democrats who say there’s too much economic inequality in the country have widely different views on the extent to which various measures would be effective in reducing inequality, although majorities in both groups say ensuring workers have the right job skills would do a great deal in this regard (56% of Republicans and 65% of Democrats say this). Among those who say there’s too much inequality, only one of ten measures tested – reducing illegal immigration – is seen by a larger share of Republicans (45%) than Democrats (8%) as something that would do a great deal to reduce it.

Across income groups, majorities say the government should raise taxes on the wealthiest Americans to deal with economic inequality, but few say their own taxes should be raised

Most Democrats and Republicans who see too much inequality say government should raise taxes on the wealthy

More than eight-in-ten adults who say there’s too much economic inequality (84%) – including similar shares across income groups – say the government should raise taxes on the wealthiest Americans in order to address inequality in this country. Democrats who say there’s too much inequality (91%) are more likely than Republicans (65%) who say the same to say the government should raise taxes on the wealthiest Americans in order to address economic inequality, but majorities of both groups share this view.

At the same time, 86% of Americans who say there’s too much economic inequality in the country these days say that the government should not raise taxes on people like them in order to address the issue. Just 12% say the government should raise taxes on people like them. Among Americans with the highest incomes – a subset of upper income adults who are in the top 7% of the sample’s adjusted income distribution – about a third (34%) of those who say there’s too much economic inequality say the government should raise taxes on people like them to deal with this, while 64% say this should not be done.

About eight-in-ten of those who say there’s currently too much inequality say the U.S. economic system needs major changes or to be completely rebuilt in order to address the issue

Most Americans who say there’s too much inequality say addressing it requires significant changes to the economic system

Two-thirds of Americans who say there’s too much economic inequality in the U.S. think addressing this inequality requires major changes to the economic system, and another 14% think the economic system needs to be completely rebuilt; 19% say the economic system requires only minor changes in order to address economic inequality.

Among those who think there’s too much economic inequality, Democrats are more likely than Republicans to say the economic system needs major changes to address inequality (74% vs. 50%). In turn, 36% of Republicans – vs. 11% of Democrats – say the economic system needs only minor changes.

Among Republicans who see too much economic inequality, those with lower incomes are particularly likely to say the U.S. economic system needs major changes in order to address this inequality: 63% say this, compared with 48% of middle-income and 43% of upper-income Republicans. Income differences are less pronounced among Democrats who say there’s too much economic inequality, although those with lower incomes (18%) are more likely than those with middle (13%) and upper (8%) incomes to say the economic system needs to be completely rebuilt in order to address economic inequality.

Most say the federal government has a responsibility to provide health insurance and adequate medical care for all Americans

Lower-income adults are more likely than those with middle and upper incomes to see a role for the federal government in providing support and services

Eight-in-ten Americans – including majorities of Democrats and Republicans – say the federal government has a responsibility to provide high-quality K-12 education to all Americans. More than six-in-ten also say the government has a responsibility to provide adequate medical care (73%) and health insurance (64%). Solid majorities of about nine-in-ten Democrats say the government has a responsibility in these areas, while about half or fewer among Republicans say the same.

Majorities of Democrats – but fewer than half of Republicans – also say the government has a responsibility to provide adequate income in retirement, an adequate standard of living and adequate housing to all Americans. Views on this also vary by income, with lower-income adults more likely than those with middle or upper incomes to say the government has a responsibility to provide each of the eight items asked about in the survey.

Defining income tiers

To create upper-, middle- and lower-income tiers, respondents’ 2018 family incomes were adjusted for differences in purchasing power by geographic region and for household size. “Middle-income” adults live in families with annual incomes that are two-thirds to double the median family income in our sample (after incomes have been adjusted for the local cost of living and for household size). The middle-income range for this analysis is about $40,100 to $120,400 annually for a three-person household. Lower-income families have incomes less than roughly $40,100, and upper-income families have incomes greater than roughly $120,400.

Based on these adjustments, among respondents who provided their income, 31% are lower income, 46% are middle income and 17% fall into the upper-income tier.

See the methodology for more information about how the income tiers were determined.

1. Trends in income and wealth inequality

Barely 10 years past the end of the Great Recession in 2009, the U.S. economy is doing well on several fronts. The labor market is on a job-creating streak that has rung up more than 110 months straight of employment growth, a record for the post-World War II era. The unemployment rate in November 2019 was 3.5%, a level not seen since the 1960s. Gains on the jobs front are also reflected in household incomes, which have rebounded in recent years.

But not all economic indicators appear promising. Household incomes have grown only modestly in this century, and household wealth has not returned to its pre-recession level. Economic inequality, whether measured through the gaps in income or wealth between richer and poorer households, continues to widen.

Household incomes are growing again after a lengthy period of stagnation

Household incomes have resumed growing following the Great Recession

With periodic interruptions due to business cycle peaks and troughs, the incomes of American households overall have trended up since 1970. In 2018, the median income of U.S. households stood at $74,600.5 This was 49% higher than its level in 1970, when the median income was $50,200.6 (Incomes are expressed in 2018 dollars.)

But the overall trend masks two distinct episodes in the evolution of household incomes (the first lasting from 1970 to 2000 and the second from 2000 to 2018) and in how the gains were distributed.

Most of the increase in household income was achieved in the period from 1970 to 2000. In these three decades, the median income increased by 41%, to $70,800, at an annual average rate of 1.2%. From 2000 to 2018, the growth in household income slowed to an annual average rate of only 0.3%. If there had been no such slowdown and incomes had continued to increase in this century at the same rate as from 1970 to 2000, the current median U.S. household income would be about $87,000, considerably higher than its actual level of $74,600.

The shortfall in household income is attributable in part to two recessions since 2000. The first recession, lasting from March 2001 to November 2001, was relatively short-lived.7 Yet household incomes were slow to recover from the 2001 recession and it was not until 2007 that the median income was restored to about its level in 2000.

But 2007 also marked the onset of the Great Recession, and that delivered another blow to household incomes. This time it took until 2015 for incomes to approach their pre-recession level. Indeed, the median household income in 2015 – $70,200 – was no higher than its level in 2000, marking a 15-year period of stagnation, an episode of unprecedented duration in the past five decades.8

More recent trends in household income suggest that the effects of the Great Recession may finally be in the past. From 2015 to 2018, the median U.S. household income increased from $70,200 to $74,600, at an annual average rate of 2.1%. This is substantially greater than the average rate of growth from 1970 to 2000 and more in line with the economic expansion in the 1980s and the dot-com bubble era of the late 1990s.

Why economic inequality matters

The rise in economic inequality in the U.S. is tied to several factors. These include, in no particular order, technological change, globalization, the decline of unions and the eroding value of the minimum wage. Whatever the causes, the uninterrupted increase in inequality since 1980 has caused concern among members of the public, researchers, policymakers and politicians.

One reason for the concern is that people in the lower rungs of the economic ladder may experience diminished economic opportunity and mobility in the face of rising inequality, a phenomenon referred to as The Great Gatsby Curve. Others have highlighted inequality’s negative impact on the political influence of the disadvantaged, on geographic segregation by income, and on economic growth itself. The matter may not be entirely settled, however, as an opposing viewpoint suggests that income inequality does not harm economic opportunity.

Alternative estimates of economic inequality

This report presents estimates of income inequality based on household income as estimated in the Current Population Survey (CPS), a survey of households conducted by the U.S. Census Bureau in partnership with the Bureau of Labor Statistics. These estimates refer to gross (pretax) income and encompass most sources of income. A key omission is the value of in-kind services received from government sources. Because income taxes are progressive and in-kind services also serve to boost the economic wellbeing of (poorer) recipients, not accounting for these two factors could overstate the true gap in the financial resources of poorer and richer households.

The Congressional Budget Office (CBO) offers an alternative estimate of income inequality that accounts for federal taxes and a more comprehensive array of cash transfers and in-kind services than is possible with Current Population Survey data. The CBO finds that the Gini coefficient in the U.S. in 2016 ranged from 0.595, before accounting for any forms of taxes and transfers, to 0.423, after a full accounting of taxes and transfers. These estimates bracket the Census Bureau’s estimate of 0.481 for the Gini coefficient in 2016. By either estimate, income inequality in the U.S. is found to have increased by about 20% from 1980 to 2016 (The Gini coefficient ranges from 0 to 1, or from perfect equality to complete inequality). Findings from other researchers show the same general rise in inequality over this period regardless of accounting for in-kind transfers.

Yet another alternative is to focus on inequality in consumption, which implicitly accounts for all forms and sources of incomes, taxes and transfers. Some estimates based on consumption show that inequality in the U.S. increased by less than implied by estimates based on income, but other estimates suggest the trends based on consumption and income are similar. Empirically, consumption can be harder to measure than income.

Upper-income households have seen more rapid growth in income in recent decades

The growth in income in recent decades has tilted to upper-income households. At the same time, the U.S. middle class, which once comprised the clear majority of Americans, is shrinking. Thus, a greater share of the nation’s aggregate income is now going to upper-income households and the share going to middle- and lower-income households is falling.9

The share of American adults who live in middle-income households has decreased from 61% in 1971 to 51% in 2019. This downsizing has proceeded slowly but surely since 1971, with each decade thereafter typically ending with a smaller share of adults living in middle-income households than at the beginning of the decade.

The decline in the middle-class share is not a total sign of regression. From 1971 to 2019, the share of adults in the upper-income tier increased from 14% to 20%. Meanwhile, the share in the lower-income tier increased from 25% to 29%. On balance, there was more movement up the income ladder than down the income ladder.

But middle-class incomes have not grown at the rate of upper-tier incomes. From 1970 to 2018, the median middle-class income increased from $58,100 to $86,600, a gain of 49%.10 This was considerably less than the 64% increase for upper-income households, whose median income increased from $126,100 in 1970 to $207,400 in 2018. Households in the lower-income tier experienced a gain of 43%, from $20,000 in 1970 to $28,700 in 2018. (Incomes are expressed in 2018 dollars.)

More tepid growth in the income of middle-class households and the reduction in the share of households in the middle-income tier led to a steep fall in the share of U.S. aggregate income held by the middle class. From 1970 to 2018, the share of aggregate income going to middle-class households fell from 62% to 43%. Over the same period, the share held by upper-income households increased from 29% to 48%. The share flowing to lower-income households inched down from 10% in 1970 to 9% in 2018.

These trends in income reflect the growth in economic inequality overall in the U.S. in the decades since 1980.

Income growth has been most rapid for the top 5% of families

Even among higher-income families, the growth in income has favored those at the top. Since 1980, incomes have increased faster for the most affluent families – those in the top 5% – than for families in the income strata below them. This disparity in outcomes is less pronounced in the wake of the Great Recession but shows no signs of reversing.

From 1981 to 1990, the change in mean family income ranged from a loss of 0.1% annually for families in the lowest quintile (the bottom 20% of earners) to a gain of 2.1% annually for families in the highest quintile (the top 20%). The top 5% of families, who are part of the highest quintile, fared even better – their income increased at the rate of 3.2% annually from 1981 to 1990. Thus, the 1980s marked the beginning of a long and steady rise in income inequality.

Since 1981, the incomes of the top 5% of earners have increased faster than the incomes of other families

A similar pattern prevailed in the 1990s, with even sharper growth in income at the top. From 1991 to 2000, the mean income of the top 5% of families grew at an annual average rate of 4.1%, compared with 2.7% for families in the highest quintile overall, and about 1% or barely more for other families.

The period from 2001 to 2010 is unique in the post-WWII era. Families in all strata experienced a loss in income in this decade, with those in the poorer strata experiencing more pronounced losses. The pattern in income growth from 2011 to 2018 is more balanced than the previous three decades, with gains more broadly shared across poorer and better-off families. Nonetheless, income growth remains tilted to the top, with families in the top 5% experiencing greater gains than other families since 2011.

The wealth of American families is currently no higher than its level two decades ago

The wealth of U.S. families is yet to recover from the Great Recession

Other than income, the wealth of a family is a key indicator of its financial security. Wealth, or net worth, is the value of assets owned by a family, such as a home or a savings account, minus outstanding debt, such as a mortgage or student loan. Accumulated over time, wealth is a source of retirement income, protects against short-term economic shocks, and provides security and social status for future generations.

The period from the mid-1990s to the mid-2000s was beneficial for the wealth portfolios of American families overall. Housing prices more than doubled in this period, and stock values tripled.11 As a result, the median net worth of American families climbed from $94,700 in 1995 to $146,600 in 2007, a gain of 55%.12 (Figures are expressed in 2018 dollars.)

But the run up in housing prices proved to be a bubble that burst in 2006. Home prices plunged starting in 2006, triggering the Great Recession in 2007 and dragging stock prices into a steep fall as well. Consequently, the median net worth of families fell to $87,800 by 2013, a loss of 40% from the peak in 2007. As of 2016, the latest year for which data are available, the typical American family had a net worth of $101,800, still less than what it held in 1998.

The wealth divide among upper-income families and middle- and lower-income families is sharp and rising

The wealth gap among upper-income families and middle- and lower-income families is sharper than the income gap and is growing more rapidly.

The period from 1983 to 2001 was relatively prosperous for families in all income tiers, but one of rising inequality. The median wealth of middle-income families increased from $102,000 in 1983 to $144,600 in 2001, a gain of 42%. The net worth of lower-income families increased from $12,3oo in 1983 to $20,600 in 2001, up 67%. Even so, the gains for both lower- and middle-income families were outdistanced by upper-income families, whose median wealth increased by 85% over the same period, from $344,100 in 1983 to $636,000 in 2001. (Figures are expressed in 2018 dollars.)

The gaps in wealth between upper-income and middle- and lower-income families are rising, and the share held by middle-income families is falling

The wealth gap between upper-income and lower- and middle-income families has grown wider this century. Upper-income families were the only income tier able to build on their wealth from 2001 to 2016, adding 33% at the median. On the other hand, middle-income families saw their median net worth shrink by 20% and lower-income families experienced a loss of 45%. As of 2016, upper-income families had 7.4 times as much wealth as middle-income families and 75 times as much wealth as lower-income families. These ratios are up from 3.4 and 28 in 1983, respectively.

The reason for this is that middle-income families are more dependent on home equity as a source of wealth than upper-income families, and the bursting of the housing bubble in 2006 had more of an impact on their net worth. Upper-income families, who derive a larger share of their wealth from financial market assets and business equity, were in a better position to benefit from a relatively quick recovery in the stock market once the recession ended.

As with the distribution of aggregate income, the share of U.S. aggregate wealth held by upper-income families is on the rise. From 1983 to 2016, the share of aggregate wealth going to upper-income families increased from 60% to 79%. Meanwhile, the share held by middle-income families has been cut nearly in half, falling from 32% to 17%. Lower-income families had only 4% of aggregate wealth in 2016, down from 7% in 1983.

The richest are getting richer faster

The richest families are the only group to have gained wealth since the Great Recession

The richest families in the U.S. have experienced greater gains in wealth than other families in recent decades, a trend that reinforces the growing concentration of financial resources at the top.

The tilt to the top was most acute in the period from 1998 to 2007. In that period, the median net worth of the richest 5% of U.S. families increased from $2.5 million to $4.6 million, a gain of 88%.

This was nearly double the 45% increase in the wealth of the top 20% of families overall, a group that includes the richest 5%. Meanwhile, the net worth of families in the second quintile, one tier above the poorest 20%, increased by only 16%, from $27,700 in 1998 to $32,100 in 2007. (Figures are expressed in 2018 dollars.)

The wealthiest families are also the only ones to have experienced gains in wealth in the years after the start of the Great Recession in 2007. From 2007 to 2016, the median net worth of the richest 20% increased 13%, to $1.2 million. For the top 5%, it increased by 4%, to $4.8 million. In contrast, the net worth of families in lower tiers of wealth decreased by at least 20% from 2007 to 2016. The greatest loss – 39% – was experienced by the families in the second quintile of wealth, whose wealth fell from $32,100 in 2007 to $19,500 in 2016.

As a result, the wealth gap between America’s richest and poorer families more than doubled from 1989 to 2016. In 1989, the richest 5% of families had 114 times as much wealth as families in the second quintile, $2.3 million compared with $20,300. By 2016, this ratio had increased to 248, a much sharper rise than the widening gap in income.13

Income inequality in the U.S has increased since 1980 and is greater than in peer countries

Income inequality in the U.S. is rising …

Income inequality may be measured in a number of ways, but no matter the measure, economic inequality in the U.S. is seen to be on the rise.

One widely used measure – the 90/10 ratio – takes the ratio of the income needed to rank among the top 10% of earners in the U.S. (the 90th percentile) to the income at the threshold of the bottom 10% of earners (the 10th percentile). In 1980, the 90/10 ratio in the U.S. stood at 9.1, meaning that households at the top had incomes about nine times the incomes of households at the bottom. The ratio increased in every decade since 1980, reaching 12.6 in 2018, an increase of 39%.14

Not only is income inequality rising in the U.S., it is higher than in other advanced economies. Comparisons of income inequality across countries are often based on the Gini coefficient, another commonly used measure of inequality.15 Ranging from 0 to 1, or from perfect equality to complete inequality, the Gini coefficient in the U.S. stood at 0.434 in 2017, according to the Organization for Economic Cooperation and Development (OECD).16 This was higher than in any other of the G-7 countries, in which the Gini ranged from 0.326 in France to 0.392 in the UK, and inching closer to the level of inequality observed in India (0.495). More globally, the Gini coefficient of inequality ranges from lows of about 0.25 in Eastern European countries to highs in the range of 0.5 to 0.6 in countries in southern Africa, according to World Bank estimates.

2. Views of economic inequality

Most Americans think there is too much economic inequality in the country these days, and about half say addressing inequality requires significant changes to the economic system. Even so, among those who see too much inequality, most (70%) say some amount is acceptable.

Most Americans say there’s too much inequality in the U.S.

Roughly four-in-ten Americans (42%) say reducing inequality should be a top priority for the federal government. Among this group, large majorities say the influence it gives to the wealthy and the limits it places on people’s opportunities are major reasons why inequality should be given priority status. Relative to other issues, though, the public does not rank inequality among the country’s biggest problems.

Views on economic inequality differ significantly by party and by household income. And they differ by income within party coalitions – particularly among Republicans.

About six-in-ten Americans say there is too much economic inequality in the country

Overall, 61% of Americans say there is too much economic inequality in the country today. Roughly a quarter (23%) say the country has about the right amount of inequality and 13% say there is too little inequality.

Across income groups, the public is about equally likely to say there is too much economic inequality. However, upper- (27%) and middle-income Americans (26%) are more likely than those with lower incomes (17%) to say that there is about the right amount of economic inequality. Lower-income adults are more likely than those with middle and upper incomes to say there’s too little inequality.

Democrats are nearly twice as likely as Republicans to say there’s too much economic inequality

Views on this differ substantially by party. About four-in-ten Republicans and those who lean toward the Republican Party (41%) say there is too much inequality, compared with roughly eight-in-ten Democrats and Democratic leaners (78%). Instead, Republicans (43%) are much more likely than Democrats (7%) to say there is about the right amount of economic inequality in the country these days.

There are also differences by income tier within each party. Lower-income Republicans are more likely than higher-income Republicans to say there’s too much inequality in the country today (48% vs. 34%). In turn, higher-income Republicans are more likely than those with lower incomes to say there is the right amount of inequality (54% vs. 28%).

Among Democrats, majorities in all income groups say there is too much economic inequality. But higher-income Democrats are more likely to express concern over this issue: 93% of upper-income Democrats say there’s too much economic inequality in the country today, compared with 84% of middle-income Democrats and 65% of lower-income Democrats.

Most who see inequality as a problem say the economic system needs significant changes

Most Americans who see too much inequality in the country say that major changes are needed in order to address the issue. About two-thirds (67%) say this, while 14% say the system needs to be completely rebuilt. Roughly one-in-five (19%) say that only minor changes are required in order to address inequality.

Among those who say there is too much inequality, lower-income Americans are the most likely to say the system needs to be completely rebuilt – 18% say this compared with 13% of middle-income adults and 8% of those in the upper-income tier. Across income groups, roughly equal shares say the system will require major changes.

A majority of lower-income Republicans who say there is too much economic inequality say major changes are necessary to address this

Again, there are differences by party. About a third of Republicans who say there is currently too much economic inequality (36%) say that only minor changes are required to fix the problem. Only 11% of Democrats who see too much inequality say the same. Instead, 74% of these Democrats think major changes are needed to fix the issue, compared with half of their Republican counterparts.

Republicans’ views about how much work is needed to address economic inequality differ by income. A majority of lower-income Republicans who see too much inequality (63%) say major changes are needed in order to address the issue. By comparison, only 43% of upper-income Republicans who see too much inequality say the same. About one-in-ten lower income Republicans (14%) say the system needs to be completely rebuilt in order to address inequality.

Among Democrats, there is generally more agreement across income groups. Upper- and lower-income Democrats who say there is too much inequality largely agree that the system requires major changes (78% among upper-income and 72% among lower-income). Even so, lower-income Democrats are more likely than middle- and upper-income Democrats to say the system needs to be completely rebuilt.

Most who see too much economic inequality say some amount of inequality is acceptable

Across income tiers, majorities who see too much inequality say some amount of inequality is acceptable

While most Americans say there is too much economic inequality in the country these days, many are willing to accept some level of it. Among those who say there is too much inequality, 70% say some amount is acceptable. About three-in-ten (29%) say no amount is acceptable.

Across all income groups, majorities of those who say there’s too much economic inequality say that some amount is acceptable. Still, upper-income Americans (85%) are more likely to say this than those with middle (72%) or lower incomes (59%). Among lower-income Americans who say there is too much inequality, 40% say that no amount of economic inequality is acceptable in the country.

Republicans and Democrats who say there is too much economic equality are largely in agreement on this point. Majorities from each group say some inequality is acceptable (77% among Republicans and 68% among Democrats).

Health care and drug addiction seen as more pressing problems than inequality

Fewer than half see economic inequality as a very big problem

When asked about 11 major issues facing the country today, concern about economic inequality ranks around the middle of the pack, with 44% saying this is a very big problem. By comparison, about two-thirds say the affordability of health care (66%) and drug addiction (64%) are very big problems.

The affordability of college, the federal budget deficit and climate change are also viewed as big problems by higher shares of adults. Inequality is roughly on par with concerns about illegal immigration and racism. And more view it as a very big problem than say the same about terrorism, sexism and job opportunities for all Americans.

Adults with lower incomes are more likely than those with middle or upper incomes to say that economic inequality is a very big problem in the country today. About half of lower-income adults (53%) say this, compared with 41% of middle-income Americans and 42% of those with higher incomes.17

Concern over economic inequality also varies by partisanship. Two-thirds of Democrats – compared with just 19% of Republicans – say inequality is a very big problem in the country today. Again, Republicans’ views on this differ significantly by income. Lower-income Republicans (35%) are much more likely than their middle-income (15%) and higher-income (8%) counterparts to say that economic inequality is a very big problem. Among Democrats, majorities of upper-, middle- and lower-income adults say economic inequality is a very big problem. Upper-income Democrats are somewhat more likely than lower-income Democrats to express this view (71% vs. 63%).

Lower-income Americans are more likely than other income groups to say reducing economic inequality should be a top priority for the federal government

Just as economic inequality doesn’t rise to the top of the list of “very big problems,” according to the American public, it’s not viewed as the most pressing policy priority for the federal government to address. About four-in-ten U.S. adults (42%) say that reducing economic inequality should be a top priority for the federal government, placing it lower on the list than making health care more affordable (72%), dealing with terrorism (65%), reducing gun violence (58%) and climate change (49%), and roughly equivalent to reducing illegal immigration (39%).

The degree to which Americans see reducing income inequality as a priority differs by income and by party. Adults with lower incomes are more likely than those with middle and upper incomes to say this should be a top priority. And, by a margin of roughly three-to-one, Democrats are more likely than Republicans to say the same (61% vs. 20%).

Among Republicans, differences by income tier persist. While few Republicans overall say economic inequality should be a top government priority, lower-income Republicans are far more likely than higher-income Republicans to say this (35% vs 9%). Democrats, on the other hand, are united across income tiers. About six-in-ten Democrats across income groups say that reducing economic inequality should be a top priority for the federal government.

For those who say reducing inequality should be a government priority, large majorities point to unfair access it affords the wealthy and limits it places on others

Some agreement on reasons for reducing economic inequality among those who see it as a top priority

When Americans who say reducing economic inequality should be a top priority for the federal government are asked why they believe that, 87% say inequality limits people’s opportunities. A similar share (86%) says a major reason why reducing inequality should be a priority is that inequality gives the wealthy too much political influence and access. About seven-in-ten (71%) point to the harmful effect inequality has on economic growth, while 55% say inequality goes against the country’s values.

Views on why reducing inequality should be a top priority for the federal government differ somewhat by party. For example, 89% of Democrats who say reducing inequality should be a top priority say the fact that inequality limits people’s opportunities is a major reason why it should be addressed, while 79% of Republicans say the same.

Majorities of Republicans and Democrats who say reducing inequality should be a top priority also point to inequality giving the wealthy too much political influence and access and being harmful to economic growth as major reasons why they think reducing inequality should be a priority.

3. What Americans see as contributors to economic inequality

More than four-in-ten Americans say the outsourcing of jobs to other countries, the tax system, and problems with the educational system contribute a great deal to economic inequality in the United States. But many also point to personal factors, such as the different life choices people make and some people working harder than others.

No consensus on major contributors to economic inequality

Republicans and Republican leaners are far more likely than Democrats and those who lean to the Democratic Party to point to personal factors as major contributors to economic inequality. Democrats, meanwhile, are more likely than Republicans to say structural barriers like racial and ethnic discrimination and lack of opportunity contribute a great deal to inequality.

More Americans cite outsourcing than automation as a contributor to economic inequality

The survey asked U.S. adults how much, if at all, several measures contribute to economic inequality in this country. Across all measures asked, there is no single measure where a majority of Americans say it contributes a great deal to inequality. Roughly equal shares point to a series of structural issues including the outsourcing of jobs to other countries (45%), the tax system (45%) and problems with the educational system (44%).

And about four-in-ten cite factors such as the different life choices people make (42%) and the fact that some people start out with more opportunities than others (40%).

When it comes to jobs, more Americans say outsourcing is a major contributor to economic inequality than automation (45% vs. 30%). And far more adults cite not enough regulation of major corporations than say too much regulation of major corporations contributes a great deal to inequality (37% vs. 15%).

Republicans are about twice as likely as Democrats to cite different life choices people make as contributing a great deal to economic inequality

Democrats are more likely than Republicans to point to structural factors as major reasons for inequality

Six-in-ten Republicans say that the different choices people make contribute a great deal to economic inequality. By contrast, just 27% of Democrats say this. Republicans are also more likely than Democrats to see some people working harder than others as a major contributor to inequality (48% vs. 22%).

Meanwhile, half of Democrats – compared with just 11% of Republicans – say discrimination against racial and ethnic minorities contributes a great deal to inequality in this country. By double-digit margins, Democrats are also more likely than Republicans to say the tax system, differences in opportunities and not enough regulation of major corporations contribute a great deal to economic inequality.

There are also divisions within the party coalitions. While a majority of Republicans overall (60%) say that people’s different choices in life contribute a great deal to economic inequality, lower-income Republicans (46%) are significantly less likely than Republicans with middle (63%) or higher (74%) incomes to say this.

Upper-income Republicans are much more likely than those with lower incomes to say people’s choices lead to economic inequality

Lower-income Republicans are more likely than those with higher incomes to point to structural concerns. About half of lower-income Republicans (52%) say problems with the educational system contribute a great deal to inequality, compared with 38% of upper-income Republicans and 33% of middle-income Republicans. There is a similar pattern among Republicans when it comes to the automation of jobs.

Overall, there is less division among Democrats. However, upper-income Democrats are less likely than those with middle and lower incomes to say discrimination against racial and ethnic minorities, automation and outsourcing are contributors to economic inequality. For example, 39% of lower-income Democrats and 32% of those with middle incomes say that the automation of jobs is contributing a great deal to economic inequality, compared with 25% of upper-income Democrats.

Six-in-ten Americans say most people can get ahead if they are willing to work hard

Lower-income Republicans are twice as likely as upper-income Republicans to say hard work does not guarantee success

Another recent Pew Research Center survey on Americans’ values finds that a majority of Americans (60%) say that most people who want to get ahead can make it if they’re willing to work hard, while 39% say hard work and determination are no guarantee of success for most people. A majority of Republicans (78%) say most people can get ahead if they work hard, while about one-quarter (22%) say hard work is no guarantee of success. A slim majority of Democrats say hard work does not guarantee success (54%), but a sizable share (45%) say most people who want to get ahead can make it if they work hard.18

Among Republicans, views differ by income, though majorities of all groups say that most people can get ahead if they work hard. Still, one-third of those with lower incomes (34%) say hard work and determination are no guarantee of success, compared with 21% of middle-income Republicans and just 14% of those with upper incomes. Lower-income Democrats are about evenly divided, while larger shares of middle-income and upper-income Democrats say hard work is not a determination of success.

Deep partisan divisions on whether poor people have it easy, hard

Americans are divided when it comes to whether poor people have it easy or hard these days. Half of Americans say poor people have hard lives because government benefits don’t go far enough to help them live decently and a similar share (47%) say poor people today have it easy because they can get government benefits without doing anything in return.19

Democrats and Republicans hold diametrically opposing opinions on this issue. About three-quarters of Democrats (72%) say that poor people today have hard lives. The same share of Republicans say that poor people today have it easy.

4. Views on reducing economic inequality

Most Americans who say there’s too much economic inequality in the country think the federal government and big business should play a role in reducing inequality. Smaller but sizable shares say state governments and wealthy individuals should have a lot of responsibility in this regard.

Most say federal government and large corporations should have a lot of responsibility in reducing inequality

Asked how much, if at all, a series of measures would do to reduce economic inequality, those who say there’s too much inequality see merit in a variety of approaches. But one stands out in particular: About nine-in-ten say ensuring workers have the skills they need for today’s jobs would do at least a fair amount to reduce inequality, with more than half of Democrats and Democratic leaners (65%) and Republicans and Republican leaners (56%) saying this would do a great deal to reduce it. Most adults who say there’s too much economic inequality (60%) also say increasing taxes on the wealthiest Americans would do a great deal to reduce inequality, but there’s less consensus among Democrats and Republicans on this and the other measures asked about in the survey.

About eight-in-ten adults who say there’s too much economic inequality say that, in order to reduce inequality, it would be better for the government to invest in education and job training programs for people who are poor. Just 15% say it would be better to give direct assistance to people who are poor in the form of cash payments or tax credits. And while 84% of those who say there’s too much economic inequality think the government should raise taxes on the wealthiest Americans in order to reduce inequality, only about one-in-ten – and about a third of those in the top 7% of the sample’s adjusted income distribution – say the government should raise taxes on people like them.

The survey also finds that more than half of all U.S. adults think the federal government has a responsibility to provide all Americans with high-quality K-12 education, adequate medical care, health insurance, adequate income in retirement and an adequate standard of living.

Across nearly all questions about reducing economic inequality, the views of Democrats and those who lean Democratic differ widely from those of Republicans and Republican leaners.

About two-thirds who say there’s too much economic inequality say the federal government should have a lot of responsibility in reducing it

Democrats more likely than Republicans to say government, corporations, wealthy individuals should have a lot of responsibility in reducing inequality

Among U.S. adults who think there’s too much economic inequality in the country these days, most say the federal government (66%) and large businesses and corporations (62%) should have a lot of responsibility in reducing economic inequality. About half (52%) say state governments should have a lot of responsibility in this area, and 46% say the same about wealthy individuals. Just 13% say churches and other religious organizations should have a lot of responsibility in reducing economic inequality.

Democrats are more likely than Republicans to say the federal government, state governments, large businesses and corporations, and wealthy individuals should have a lot of responsibility in reducing economic inequality. For example, among those who say there is too much inequality, majorities of Democrats say the federal (75%) and state (57%) governments should have a lot of responsibility in this area. Fewer than half of Republicans who see too much inequality say these groups should have a lot of responsibility for reducing it (44% say the federal government and 41% say state governments should have a lot of responsibility).

Republicans and Democrats largely disagree on how effective different measures would be at reducing economic inequality

Republicans are less convinced than Democrats that several measures would reduce economic inequality

The survey asked U.S. adults how much, if at all, several measures would do to reduce economic inequality in the U.S., regardless of whether they support them. Among those who say there’s currently too much economic inequality, 93% say ensuring workers have the skills they need for today’s jobs would do at least a fair amount to reduce it, with 62% saying this would do a great deal. In fact, this is the only measure that majorities of Democrats (65%) and Republicans (56%) who think there’s too much economic inequality say would do a great deal to reduce it.

Most adults who say there’s too much economic inequality in the country these days (60%) also say increasing taxes on the wealthiest Americans would do a great deal to reduce economic inequality. About half say the same about making college tuition free at public two-year colleges (52%), expanding Medicare so it covers Americans of all ages (50%), and increasing the federal minimum wage (48%).

With the exception of ensuring workers have the skills they need for today’s jobs, there is a double-digit gap in the shares of Democrats and Republicans who say each of the measures included in the survey would do a great deal to reduce economic inequality. For example, about seven-in-ten Democrats who say there’s too much economic inequality in the U.S. (69%) say increasing taxes on the wealthiest Americans would do a great deal to reduce inequality; 36% of their Republican counterparts say the same. Reducing illegal immigration is the only measure that a larger share of Republicans (45%) than Democrats (8%) see as potentially reducing economic inequality a great deal, among those who say there’s too much economic inequality in the country today.

For the most part, lower-income adults who say there’s too much economic inequality are more likely than those with middle and upper incomes to say the measures asked about in the survey would do a great deal to reduce economic inequality. There are a few exceptions. When it comes to breaking up large corporations and reducing illegal immigration, lower- and middle-income adults have similar views and are more likely than those with upper incomes to say each would do a great deal to reduce inequality. And on ensuring workers have the skills they need for today’s jobs, similar shares across income groups say this would do a great deal to reduce inequality.

About eight-in-ten U.S. adults who say there’s too much inequality see investment in education and job training for the poor as a better way to address it

Education and job training, rather than direct assistance to poor people, seen as better way to address inequality

When those who say there’s too much economic inequality in the U.S. are asked about the best approach for addressing it, most (83%) say it would be better for the government to invest in education and job training programs for people who are poor. Only 15% say a better way to address economic inequality would be for the government to give direct assistance to people who are poor in the form of cash payments or tax credits.

Democrats who say there’s too much economic inequality are more likely than their Republican counterparts to say it would be better for the government to give direct assistance to people who are poor, but relatively small shares of both groups say this (18% of Democrats vs. 10% of Republicans). Fully 89% of Republicans and 81% of Democrats who say there’s currently too much economic inequality in the country see investments in education and job training programs for people who are poor as a better way to address it.

Among lower-income adults who say there’s too much economic inequality, about one-in-five (22%) say giving direct assistance to the poor would be the better way for government to address economic inequality, compared with about one-in-ten of those with middle or upper incomes (12% each).

Most Democrats and Republicans who say there’s too much economic inequality say the government should raise taxes on the wealthy to address it

Most who say there’s too much inequality say the government should raise taxes on the wealthiest Americans

More than eight-in-ten U.S. adults who say there’s too much economic inequality in the country these days (84%) say the government should raise taxes on the wealthiest Americans in order to address economic inequality. This view is far more widespread among Democrats (91%) than among Republicans (65%), but majorities of both groups share this opinion.

Across income groups, large majorities of those who say there’s too much economic inequality in the U.S. these days say that, in order to address the issue, the government should raise taxes on the wealthiest Americans. At least eight-in-ten of those with upper (82%), middle (84%) and lower (84%) incomes say this.

Most across income levels say the government should not raise taxes on people like them in order to address economic inequality

Across income groups, large shares say the government shouldn’t raise taxes on people like them to deal with inequality

The vast majority of Americans who say there’s too much economic inequality in the country these days (86%) say the government should not raise taxes on people like them in order to address economic inequality; 12% say the government should raise their taxes in order to deal with inequality.

While upper-income adults who say there’s too much economic inequality (28%) are more likely than those with middle (11%) and lower (5%) incomes to say the government should raise taxes on people like them in order to address economic inequality, large shares across income groups say the government should not raise their taxes. In fact, among those with the highest incomes – a subset of upper-income adults who are in the top 7% of the sample’s adjusted income distribution – about two-thirds (64%) say the government should not raise taxes on people like them, while 34% say the government should do this to deal with economic inequality.

Most U.S. adults say the federal government has a responsibility to provide health insurance and adequate medical care for all Americans

Nearly all Democrats, but only about half of Republicans, say the government has a responsibility to provide adequate medical care for all Americans

Asked more generally about the federal government’s role in providing support and services, eight-in-ten U.S. adults say the federal government has a responsibility to provide high-quality K-12 education for all Americans. Majorities also say the federal government has a responsibility to provide adequate medical care (73%), health insurance (64%), adequate income in retirement (59%) and an adequate standard of living (56%). About half or fewer say the federal government has a responsibility to provide adequate housing (49%), a college education (36%) and access to high-speed internet (28%) for all Americans.

Large shares of Democrats see the federal government having a responsibility to provide most of these to all Americans. About two-thirds of Democrats or more say the federal government should provide high-quality K-12 education (92%), adequate medical care (92%), health insurance (88%), adequate retirement income (73%), an adequate standard of living (74%) and adequate housing (66%) for all Americans. In contrast, with the exception of high-quality K-12 education, about half or fewer of Republicans say the federal government has a responsibility to provide each of these to all Americans.

Half of Democrats – vs. just 17% of Republicans – think the federal government has a responsibility to provide a college education to all Americans. And while the share of Democrats (38%) who say the federal government should provide access to high-speed internet is lower than it is for any other of the eight items in the survey, the share of Republicans who hold this view is far lower, at 15%.

Lower-income Republicans are more likely than those with higher incomes to say the federal government has a responsibility to provide certain things

Overall, lower-income adults are more likely than those with middle or upper incomes to say the government has a responsibility to provide each of the eight items tested in the survey. There are wide income differences among Republicans on all items. Income differences are also present, although less consistent, among Democrats.

By double-digits, larger shares of lower- than middle- or upper-income Republicans say the federal government has a responsibility to provide adequate medical care, health insurance, adequate income in retirement, an adequate standard of living, adequate housing, a college education and access to high-speed internet to all Americans. On each of these items except for access to high-speed internet, middle-income Republicans are more likely than those with upper incomes to see a responsibility for the federal government in providing for all Americans.

Most lower-income Democrats, but fewer than half with middle or upper incomes, say the government has a responsibility to provide a college education to all

Among Democrats, about two-thirds of those with lower incomes (65%) say the federal government has a responsibility to provide a college education to all Americans, compared with 44% of middle-income and 32% of upper-income Democrats. Lower-income Democrats are more likely than those with middle and upper incomes to say the federal government has a responsibility to provide adequate income in retirement, an adequate standard of living and adequate housing. Across income levels, majorities of Democrats (about six-in-ten or more) say the federal government has a responsibility to provide each of these.

Similarly large shares of Democrats across income levels (roughly nine-in-ten) say the federal government has a responsibility to provide high-quality K-12 education, adequate medical care and health insurance. About four-in-ten Democrats with lower, middle and upper incomes say the federal government has a responsibility to provide access to high-speed internet.


Acknowledgments

Pew Research Center received invaluable advice in developing the questionnaire from Richard Reeves, Senior Fellow, Brookings Institution and Karlyn Bowman, Senior Fellow, American Enterprise Institute.

This report is a collaborative effort based on the input and analysis of the following individuals. Find related reports online at pewresearch.org/pewresearch-org/social-trends

Kim Parker, Director, Social Trends Research Juliana Horowitz, Associate Director, Research Ruth Igielnik, Senior Researcher Rick Fry, Senior Economist Rakesh Kochhar, Senior Researcher Anna Brown, Research Associate Nikki Graff, Former Research Associate Deja Thomas, Research Assistant Jesse Bennett, Research Assistant Tanya Arditi, Communications Manager Michael Keegan, Information Graphics Designer Travis Mitchell, Copy Editor, Digital Producer

In addition, the project benefited greatly from the guidance of Carroll Doherty and Jocelyn Kiley as well as the Pew Research Center methodology team: Courtney Kennedy, Andrew Mercer, Nick Bertoni, Joshua Ferno, Nick Hatley and Arnold Lau.


Methodology

The American Trends Panel survey methodology

The American Trends Panel (ATP), created by Pew Research Center, is a nationally representative panel of randomly selected U.S. adults. Panelists participate via self-administered web surveys. Panelists who do not have internet access at home are provided with a tablet and wireless internet connection. The panel is managed by Ipsos.

American Trends Panel recruitment surveys

Data in this report are drawn from the panel wave conducted Sept. 16 to Sept. 29, 2019. A total of 6,878 panelists responded out of 7,347 who were sampled, for a response rate of 93.6%. This does not include one panelist who was removed from the data due to an extremely high rate of refusal. The cumulative response rate accounting for nonresponse to the recruitment surveys and attrition is 6.2%. The break-off rate among panelists who logged onto the survey and completed at least one item is 0.8%. The margin of sampling error for the full sample of 6,878 respondents is plus or minus 1.6 percentage points.

The sample consisted of all existing panelists who had completed the annual profile survey as of Sept. 9, 2019. Panelists who had not yet completed the profile survey were ineligible. A subsample from the ATP was selected by grouping panelists into five strata so demographic groups that are underrepresented in the panel had a higher probability of selection than overrepresented groups:

  • Stratum A consists of panelists who are non-internet users. They were sampled at a rate of 100%.
  • Stratum B consists of panelists with a high school education or less. They were sampled at a rate of 100%.
  • Stratum C consists of panelists that are Hispanic, unregistered to vote, or non-volunteers. They were sampled at a rate of 91.4%.
  • Stratum D consists of panelists that are black or 18-34 years old. They were sampled at a rate of 45.1%.
  • Stratum E consists of the remaining panelists. They were sampled at a rate of 32.9%.

The ATP was created in 2014, with the first cohort of panelists invited to join the panel at the end of a large, national, landline and cellphone random-digit-dial survey that was conducted in both English and Spanish. Two additional recruitments were conducted using the same method in 2015 and 2017, respectively. Across these three surveys, a total of 19,718 adults were invited to join the ATP, of which 9,942 agreed to participate.

In August 2018, the ATP switched from telephone to address-based recruitment. Invitations were sent to a random, address-based sample (ABS) of households selected from the U.S. Postal Service’s Delivery Sequence File. In each household, the adult with the next birthday was asked to go online to complete a survey, at the end of which they were invited to join the panel. For a random half-sample of invitations, households without internet access were instructed to return a postcard. These households were contacted by telephone and sent a tablet if they agreed to participate. A total of 9,396 were invited to join the panel, and 8,778 agreed to join the panel and completed an initial profile survey. Of the 18,720 individuals who have ever joined the ATP, 10,588 remained active panelists and continued to receive survey invitations at the time this survey was conducted.

The U.S. Postal Service’s Delivery Sequence File has been estimated to cover as much as 98% of the population, although some studies suggest that the coverage could be in the low 90% range.20

Weighting

Weighting dimensions

The ATP data were weighted in a multistep process that begins with a base weight incorporating the respondents’ original survey selection probability and the fact that in 2014 and 2017 some respondents were subsampled for invitation to the panel. The next step in the weighting uses an iterative technique that aligns the sample to population benchmarks on the dimensions listed in the accompanying table.

Sampling errors and test of statistical significance take into account the effect of weighting. Interviews are conducted in both English and Spanish, but the American Trends Panel’s Hispanic sample is predominantly U.S. born and English speaking.

In addition to sampling error, one should bear in mind that question wording and practical difficulties in conducting surveys can introduce error or bias into the findings of opinion polls.

The following table shows the unweighted sample sizes and the error attributable to sampling that would be expected at the 95% level of confidence for different groups in the survey:

Sample sizes and sampling errors for other subgroups are available upon request.

Adjusting income and defining income tiers

Family income data reported in this study is adjusted for household size and cost-of-living differences by geography using a similar methodology to Pew Research Center’s previous work on the American middle class. The income tiers used in this analysis are also created following methodology previously used in the Center’s work on the middle class.

Prior to these adjustments, American Trends Panel members were assigned to the midpoint of the income range they selected during the survey to provide an exact income figure for adjustment.

The metropolitan area cost-of-living adjustment is based on price indexes published by the U.S. Bureau of Economic Analysis. These indexes, known as Regional Price Parities (RPP), compare the prices of goods and services across 383 metropolitan statistical areas as well as non-metro areas with the national average prices for the same goods and services. The most recent available data is from 2017.

The national estimates presented in the analysis encompass the U.S. adult population. Those who fall outside of the 371 metropolitan statistical areas found in Wave 54 of the ATP are assigned the RPP for their state’s non-metropolitan area.

Family incomes are then adjusted for the number of people in a household using the methodology from Pew Research Center’s previous work on the American middle class. That is done because a four-person household with an income of, say, $50,000 faces a tighter budget constraint than a two-person household with the same income.

Middle-income adults are in families with annual incomes that are two-thirds to double the median family income in this ATP sample, after incomes have been adjusted for household size and the local cost of living. The median family income for this sample is about $34,749. Using this median income, the middle-income range is about $40,100 to $120,400 annually for a three-person household. Lower-income families have incomes less than roughly $40,100 and upper-income families have incomes greater than roughly $120,400 (all figures expressed in 2018 dollars).

Two examples of how a given area’s cost-of-living adjustment was calculated are as follows: Jackson, Tennessee, is a relatively inexpensive area, with a price level that is 17.9% less than the national average. The Hawaii metropolitan area known as Urban Honolulu is one of the most expensive areas, with a price level that is 24.4% higher than the national average. Income in the sample is adjusted to make up for this difference. As a result, a family with an income of $45,000 in the Jackson area is equivalent to a family with an income of $68,200 in Urban Honolulu.

In Chapter 1 of the study, the classification of adults into lower-, middle- and upper-income tiers is based on the same principles used in the remainder of the analysis. However, the income ranges that define the boundaries of each income tier are based on incomes as reported in the Current Population Survey – for the analysis of income inequality – and the Survey of Consumer of Finances – for the analysis of wealth inequality.

In the Current Population Survey, the national median household income in 2018 was $74,600, for a household of three and after incomes had been adjusted for household size. Based on the national median income, middle-income households had incomes in the range of about $49,700 to $149,200, for a household of three (incomes in 2018 dollars). For these national estimates, incomes are not adjusted for the local cost of living.

Secondary data methodology

Data sources

The income data in Chapter 1 of this report are derived from the Current Population Survey, Annual Social and Economic Supplements (ASEC), which is conducted in March of every year. The specific files used in this report are from March 1971 to March 2019. Conducted jointly by the U.S. Census Bureau and the Bureau of Labor Statistics, the CPS is a monthly survey of approximately 55,000 households and is the source of the nation’s official statistics on unemployment. The ASEC survey in March typically features a larger sample size. Data on income and poverty from the ASEC survey serve as the basis for the well-known Census Bureau report on income and poverty in the United States. The ASEC surveys collect data on the income of a household in the preceding calendar year. Thus, the 1971 to 2019 files used in this report contain data on income from 1970 to 2018.

The 2015 ASEC utilized a redesigned set of income questions, so the household income figures reported for calendar year 2014 to 2018 may not be fully comparable to earlier years. The 2014 ASEC tested the new redesigned income questions by offering five-eighths of the sample the traditional income questions and three-eighths of the sample the redesigned questions. Median household income for calendar year 2013 was $53,585 (in 2013 dollars) based on the redesigned income questions compared with an estimated $51,939 using the traditional income questions. The difference reflects both the different questionnaire and the different sampled households responding to the questionnaires.

Methodological revisions in the CPS may also have an impact on the trends in household income. In particular, the 1993 revisions have an impact on the comparability of income data before and after that date.

The CPS microdata used in this report are the Integrated Public Use Microdata Series (IPUMS) provided by the University of Minnesota. The IPUMS assigns uniform codes, to the extent possible, to data collected in the CPS over the years. More information about the IPUMS, including variable definition and sampling error, is available at http://cps.ipums.org/cps/documentation.shtml.

The wealth analysis is based on the Survey of Consumer Finances (SCF) that is sponsored by the Federal Reserve Board of Governors and the Department of Treasury. It has been conducted every three years since 1983 and is designed to provide detailed information on the finances of U.S. families. The SCF sample typically consists of approximately 4,500 families, but surveys for 2013 and 2016 survey included about 6,000 families. Unlike the CPS, the sampling unit in the SCF is the “primary economic unit” (PEU), not the household. As stated by the Federal Reserve Board, “the PEU is intended to be the economically dominant single person or couple (whether married or living together as partners) and all other persons in the household who are financially interdependent with that economically dominant person or couple.”

There are notable differences between the SCF data the Federal Reserve Board releases for public use and the data it uses to publish estimates of family income and wealth. One difference is that estimates published by the Federal Reserve Board are often based on preliminary data, while the public-use files represent edited versions of the data. Also, prior to public release, the Federal Reserve Board alters the data using statistical procedures that may affect the estimates, albeit not significantly. That is done for reasons of confidentiality.

Income and wealth

Household income is the sum of incomes earned by all members of the household in the calendar year preceding the date of the survey. The CPS collects data on money income received on a regular basis (exclusive of certain money receipts such as capital gains and lump-sum payments) before payments for personal income taxes, Social Security and Medicare taxes, union dues, etc. It includes income received from wages, salary, commissions, bonuses, and tips; self-employment income from own nonfarm or farm businesses, including proprietorships and partnerships; interest, dividends, net rental income, royalty income, or income from estates and trusts; Social Security or Railroad Retirement income; Supplemental Security Income (SSI); any cash public assistance or welfare payments from the state or local welfare office; retirement, survivor, or disability benefits; and any other sources of income received regularly such as Veterans’ (VA) payments, unemployment and/or worker’s compensation, child support, and alimony. It should be noted that income data in the CPS public-use microdata files are top-coded to prevent the identification of a few individuals who might report very high levels of income.

The Census Bureau’s current definition of income is broader than in the past. Data for all years include income received from wages or salary before taxes and deductions, net earnings from own businesses or farms, income from Social Security or Railroad Retirement, other forms of public assistance or welfare, and other sources of income regularly received. Investment income (including dividend payments and net rental income) was added starting with the 1980 sample. Retirement income other than Social Security was added starting in the 1990 sample. Supplemental Security Income (SSI) was added starting in the 2000 sample.

Wealth, or net worth, is the difference between the value of assets owned by households and the value of the liabilities (or debt) held by the household. Assets include items such as the value of an owned home, value of a business, accounts in financial institutions, stocks and bonds, 401(k) and thrift accounts, individual retirement accounts and Keogh accounts, rental properties, motor vehicles and other personal property. Liabilities include home mortgages, credit card debt, student loans, vehicle loans and business debt. The SCF does not account for the discounted values of Social Security benefits or defined benefit pension plans.

The data on income and wealth are adjusted for inflation with the Consumer Price Index Research Series (CPI-U-RS) of the Bureau of Labor Statistics (BLS) as published in the Census Bureau’s income and poverty report. This is the price index series used by the U.S. Census Bureau to deflate the data it publishes on household income. Since 1978, this is the CPI-U-RS index as published by the BLS. For years prior to 1978, the Census Bureau made its own adjustment to the CPI-U to approximate the trend in the CPI-U-RS.

Households in census data

The Census Bureau defines a household as the entire group of persons who live in a single dwelling unit. A household may consist of several persons living together or one person living alone. It includes the household head and all of his or her relatives living in the dwelling unit and also any lodgers, live-in housekeepers, nannies and other residents not related to the head of the household.

© Pew Research Center, 2020