Pew Research Center

FOR RELEASE JUNE 27, 2016

On Views of Race and Inequality, Blacks and Whites Are Worlds Apart

About four-in-ten blacks are doubtful that the U.S. will ever achieve racial equality

FOR MEDIA OR OTHER INQUIRIES:

Communications Department
202.419.4372
www.pewresearch.org

RECOMMENDED CITATION

Pew Research Center, June 2016, "On Views of Race and Inequality, Blacks and Whites Are Worlds Apart"

About Pew Research Center

Pew Research Center is a nonpartisan, nonadvocacy fact tank that informs the public about the issues, attitudes and trends shaping the world. It does not take policy positions. The Center conducts public opinion polling, demographic research, computational social science research and other data-driven research. It studies politics and policy; news habits and media; the internet and technology; religion; race and ethnicity; international affairs; social, demographic and economic trends; science; research methodology and data science; and immigration and migration. Pew Research Center is a subsidiary of The Pew Charitable Trusts, its primary funder.

© Pew Research Center 2026

Table of contents

  • About Pew Research Center
  • On Views of Race and Inequality, Blacks and Whites Are Worlds Apart
  • 1. Demographic trends and economic well-being
  • 2. Views of race relations
  • 3. Discrimination and racial inequality
  • 4. Achieving racial equality
  • 5. Personal experiences with discrimination
  • 6. Views of community, family life and personal finances
  • Acknowledgments
  • Methodology

On Views of Race and Inequality, Blacks and Whites Are Worlds Apart

About four-in-ten blacks are doubtful that the U.S. will ever achieve racial equality

Almost eight years after Barack Obama’s election as the nation’s first black president –an event that engendered a sense of optimism among many Americans about the future of race relations1 – a series of flashpoints around the U.S. has exposed deep racial divides and reignited a national conversation about race. A new Pew Research Center survey finds profound differences between black and white adults in their views on racial discrimination, barriers to black progress and the prospects for change. Blacks, far more than whites, say black people are treated unfairly across different realms of life, from dealing with the police to applying for a loan or mortgage. And, for many blacks, racial equality remains an elusive goal.
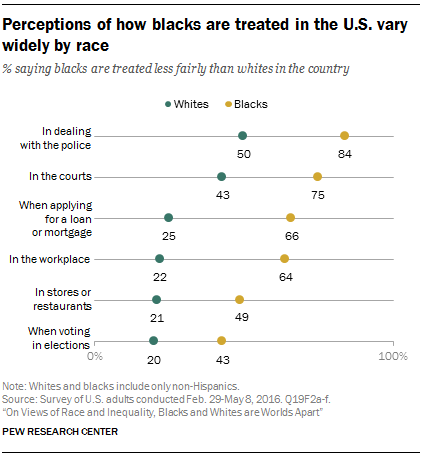
Perceptions of how blacks are treated in the U.S. vary widely by race

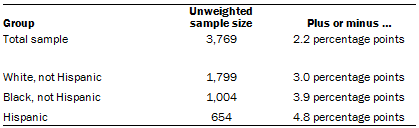
These findings are based on a national survey by Pew Research Center conducted Feb. 29-May 8, 2016, among 3,769 adults (including 1,799 whites, 1,004 blacks and 654 Hispanics).2 The survey – and the analysis of the survey findings – is centered primarily around the divide between blacks and whites and on the treatment of black people in the U.S. today. In recent years, this centuries-old divide has garnered renewed attention following the deaths of unarmed black Americans during encounters with the police, as well as a racially motivated shooting that killed nine black parishioners at a church in Charleston, South Carolina, in 2015.

The survey finds that black and white adults have widely different perceptions about what life is like for blacks in the U.S. For example, by large margins, blacks are more likely than whites to say black people are treated less fairly in the workplace (a difference of 42 percentage points), when applying for a loan or mortgage (41 points), in dealing with the police (34 points), in the courts (32 points), in stores or restaurants (28 points), and when voting in elections (23 points). By a margin of at least 20 percentage points, blacks are also more likely than whites to say racial discrimination (70% vs. 36%), lower quality schools (75% vs. 53%) and lack of jobs (66% vs. 45%) are major reasons that blacks may have a harder time getting ahead than whites.

Blacks and whites also differ in their opinions about the best approach for improving race relations: Among whites, more than twice as many say that in order to improve race relations, it’s more important to focus on what different racial and ethnic groups have in common (57%) as say the focus should be on what makes each group unique (26%). Among blacks, similar shares say the focus should be on commonalities (45%) as say it should be on differences (44%).
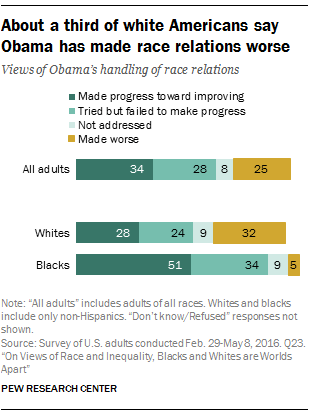
About a third of white Americans say Obama has made race relations worse

When asked specifically about the impact President Barack Obama has had on race relations in the U.S., a majority of Americans give the president credit for at least trying to make things better, but a quarter say he has made race relations worse. Blacks and whites differ significantly in their assessments. Some 51% of blacks say Obama has made progress toward improving race relations, and an additional 34% say he has tried but failed to make progress. Relatively few blacks (5%) say Obama has made race relations worse, while 9% say he hasn’t addressed the issue at all.

When asked about their views of Black Lives Matter, the activist movement that first came to national prominence following the 2014 shooting death of an unarmed black 18-year-old by a white police officer in Ferguson, Missouri, roughly two-thirds (65%) of blacks express support, including 41% who strongly support it. Among whites, four-in-ten say they support the Black Lives Movement at least somewhat, and this is particularly the case among white Democrats and those younger than 30.
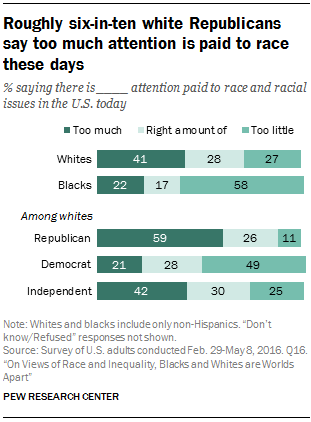
Roughly six-in-ten white Republicans say too much attention is paid to race these days

And while about eight-in-ten (78%) white Democrats say the country needs to continue making changes to achieve racial equality between whites and blacks, just 36% of white Republicans agree; 54% of white Republicans believe the country has already made the changes necessary for blacks to have equal rights with whites.
How blacks and whites view the state of race in America

There are large gaps between blacks and whites in their views of race relations and racial inequality in the United States. Explore how the opinions of blacks and whites vary by age, education, gender and party identification in key questions from our report.

The economic realities of black and white households
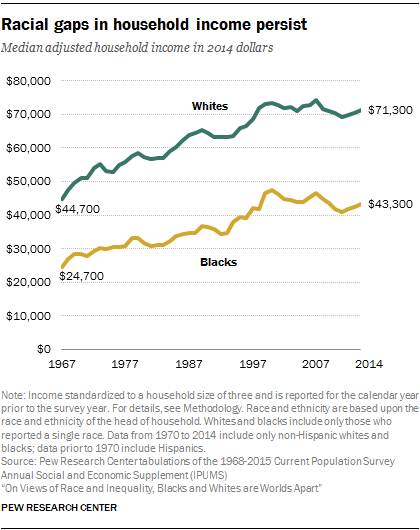
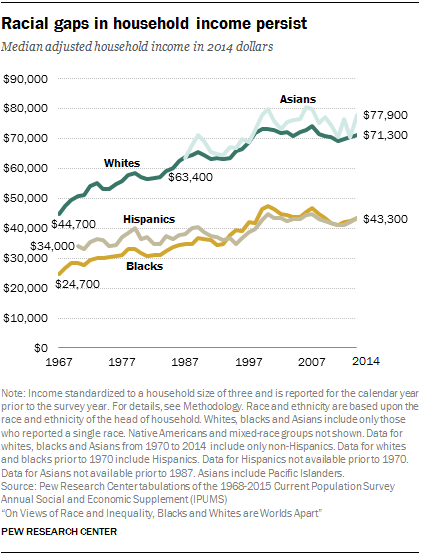
Racial gaps in household income persist

Trends in key economic and demographic indicators provide some context for the experiences and outlook of blacks today. While there has been clear progress in closing the white-black gap in some areas – particularly when it comes to high school completion rates – decades-old black-white gaps in economic well-being persist and have even widened in some cases.

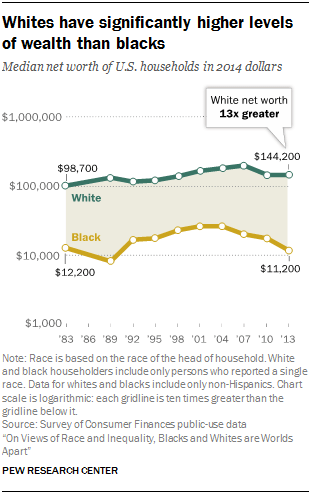
The racial gap extends to household wealth – a measure where the gap has widened since the Great Recession. In 2013, the most recent year available, the median net worth of households headed by whites was roughly 13 times that of black households ($144,200 for whites compared with $11,200 for blacks).

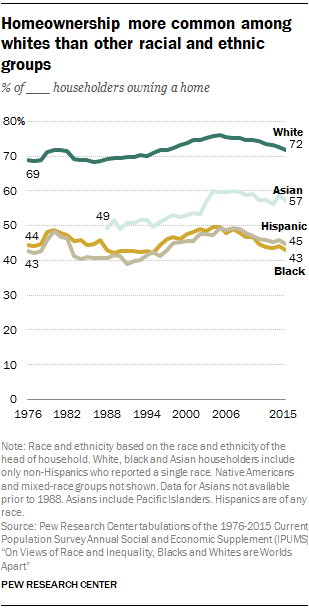
For most Americans, household wealth is closely tied to home equity, and there are sharp and persistent gaps in homeownership between blacks and whites. In 2015, 72% of white household heads owned a home, compared with 43% of black household heads.

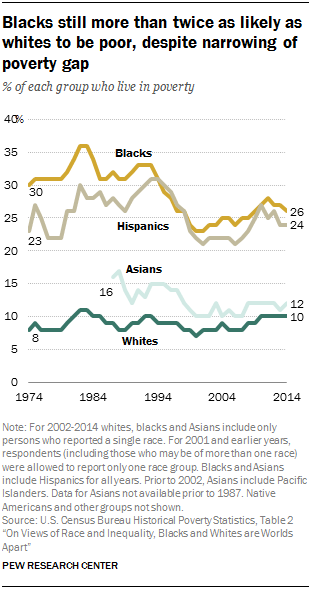
And on the flipside of wealth – poverty – racial gaps persist, even though the poverty rate for blacks has come down significantly since the mid-1980s. Blacks are still more than twice as likely as whites to be living in poverty (26% compared with 10% in 2014).

Blacks and whites are divided on reasons that blacks may be struggling to get ahead

Despite these economic realities, when asked about the financial situation of blacks compared with whites today, about four-in-ten blacks either say that both groups are about equally well off (30%) or that blacks are better off than whites financially (8%). Still, about six-in-ten (58%) blacks say that, as a group, they are worse off than whites.

Among whites, a plurality (47%) say blacks are worse off financially, while 37% say blacks are about as well off as whites and 5% say blacks are doing better than whites.

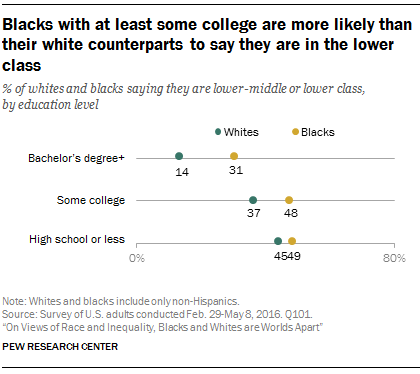
Blacks and whites with a bachelor’s degree are more likely than those with less education to say blacks are worse off financially than whites these days. Roughly eight-in-ten (81%) blacks with a four-year college degree say this, compared with 61% of blacks with only some college education and 46% of blacks with a high school diploma or less. In a similar pattern, about two-thirds (66%) of white college graduates say blacks are worse off financially than whites, while fewer among those who attended college but did not receive a degree (47%) and those who did not attend college (29%) say the same.
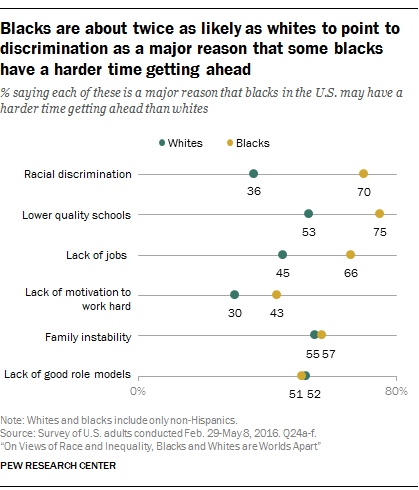
Blacks are about twice as likely as whites to point to discrimination as a major reason that some blacks have a harder time getting ahead

When asked about the underlying reasons that blacks may be having a harder time getting ahead than whites, large majorities of black adults point to societal factors. Two-thirds or more blacks say failing schools (75%), racial discrimination (70%) and a lack of jobs (66%) are major reasons that black people may have a harder time getting ahead these days.

On each of these items, the views of blacks differ significantly from those of whites. But, by far, the biggest gap comes on racial discrimination, where only 36% of whites say this is a major reason that blacks may be struggling to get ahead, 34 percentage points lower than the share of blacks who say the same.

The views of blacks and whites are more closely aligned when it comes to the impact that family instability (57% and 55%, respectively) and a lack of good role models (51% and 52%) has on black progress. However, the relative ranking of these items varies among blacks and whites. While whites rank family instability and a lack of good role models above or on a par with societal factors as major reasons that blacks may have a harder time getting ahead than whites, fewer blacks say these items are major reasons than say the same about lower quality schools, discrimination, and lack of jobs.

Blacks are more likely than whites to say a lack of motivation to work hard may be holding blacks back: 43% of black adults and 30% of whites say this is a major reason blacks are having a harder time getting ahead than whites. 3

More whites and blacks say individual discrimination is a bigger problem than institutional racism
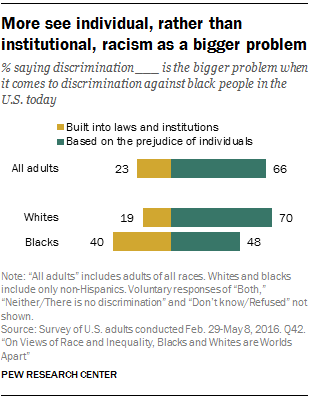
More see individual, rather than institutional, racism as a bigger problem

On balance, the public thinks that when it comes to discrimination against black people in the U.S. today, discrimination that is based on the prejudice of individual people is a bigger problem than discrimination that is built into the nation’s laws and institutions. This is the case among both blacks and whites, but while whites offer this opinion by a large margin (70% to 19%), blacks are more evenly divided (48% to 40%).

Still, large majorities of black adults say that blacks in this country are treated unfairly in a range of institutional settings – from the criminal justice system, to the workplace to banks and financial institutions.

Roughly two-thirds of black adults say that blacks are treated less fairly than whites when applying for a loan or mortgage (66%) and in the workplace (64%). Somewhat smaller shares – though still upwards of four-in-ten – see unfair treatment for blacks in stores and restaurants (49%) and when voting in elections (43%).

Across all of these realms, whites are much less likely than blacks to perceive unequal treatment – with differences ranging from 23 to 42 percentage points.

Personal experiences with discrimination

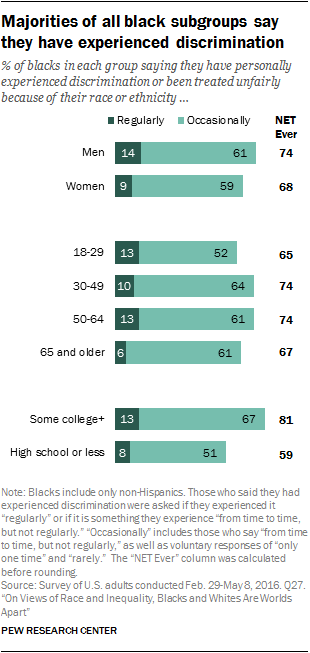
A majority of blacks (71%) say that they have experienced discrimination or been treated unfairly because of their race or ethnicity. Roughly one-in-ten (11%) say this happens to them on a regular basis, while 60% say they have experienced this rarely or from time to time.

Among blacks, men and women are equally likely to report having personally experienced racial discrimination, and there are no large gaps by age. There is an educational divide, however: Blacks with at least some college experience (81%) are much more likely than blacks who never attended college (59%) to say they have been discriminated against because of their race.

Experiences with racial discrimination are far less common among whites, but a sizable minority (30%) of white adults report that they have been discriminated against or treated unfairly because of their race or ethnicity. Only 2% say this happens to them regularly and 28% say it occurs less frequently. Whites who say they have a lot of contact with blacks are more likely to say they’ve been discriminated against because of their race than are whites who have less contact with blacks.
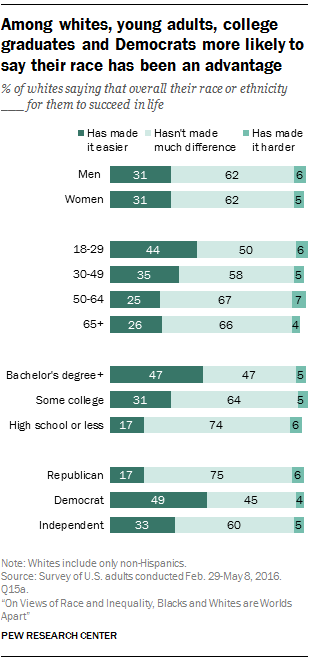
Among whites, young adults, college graduates and Democrats more likely to say their race has been an advantage

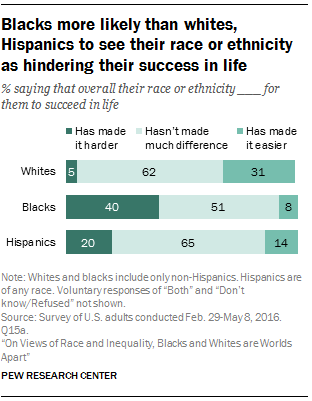
While some whites report being treated unfairly at times because of their race, the overall impact is relatively minor. Only 5% of whites say their race or ethnicity has made it harder for them to succeed in life. A majority of whites (62%) say their race hasn’t made much of difference in their ability to succeed, and 31% say their race has made things easier for them.

There is a sharp educational divide among blacks on the overall impact their race has had on their ability to succeed. Fully 55% of blacks with a four-year college degree say their race has made it harder for them to succeed in life. Some 45% of blacks who attended college but did not receive a bachelor’s degree say the same. Among blacks with a high school education or less, a far lower share (29%) say their race has made it harder for them to succeed. A majority of this group (60%) say their race hasn’t made a difference.

About half of blacks say people have acted like they were suspicious of them
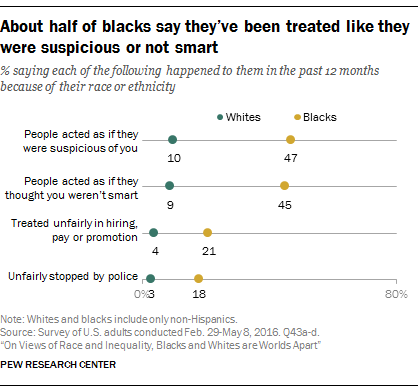
About half of blacks say they’ve been treated like they were suspicious or not smart

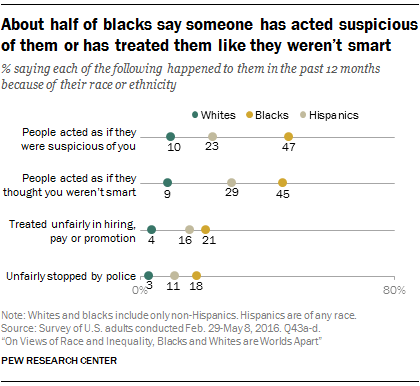
Unfair treatment can come in different forms. Roughly half of blacks (47%) say that in the past 12 months someone has acted as if they were suspicious of them because of their race or ethnicity. Many blacks also report feeling like others have questioned their intelligence. Some 45% say that in the past 12 months people have treated them as if they were not smart because of their race or ethnicity.

Roughly one-in-five blacks (21%) say they have been treated unfairly by an employer in the past year because of their race or ethnicity, and a similar share (18%) report having been unfairly stopped by the police during this period.

Black men are more likely than black women to say that people have treated them with suspicion (52% vs. 44%). And they are more likely to say they have been unfairly stopped by the police (22% vs. 15%).

Being treated with suspicion and being treated as if they are not intelligent are more common experiences for black adults who attended college than for those who did not. For example, 52% of those with at least some college education say that, in the past 12 months, someone has treated them as if they thought they weren’t smart because of their race or ethnicity, compared with 37% of those with a high school diploma or less.

Among blacks, widespread support for the Black Lives Matter movement
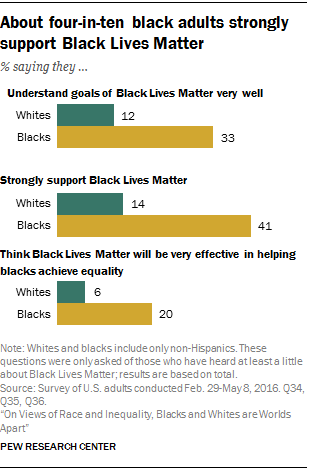
About four-in-ten black adults strongly support Black Lives Matter

Blacks with a bachelor’s degree or more are among the most skeptical that the Black Lives Matter movement will ultimately help bring about racial equality. About three-in-ten (31%) of those with a bachelor’s degree or more education say that, in the long run, the movement won’t be too effective or won’t be effective at all, compared with about two-in-ten adults with less education.

Granted, many blacks are skeptical overall that the country will eventually make the changes needed to bring about racial equality. But even among those who think change will eventually come, only 23% say Black Lives Matter will be very effective in helping bring about equality.

For their part, whites have mixed views of the Black Lives Matter movement. Four-in-ten whites say they support the movement (14% strongly support and 26% somewhat support). And about a third (34%) of whites say, in the long run, the Black Lives Matter movement will be at least somewhat effective in helping blacks achieve equality.
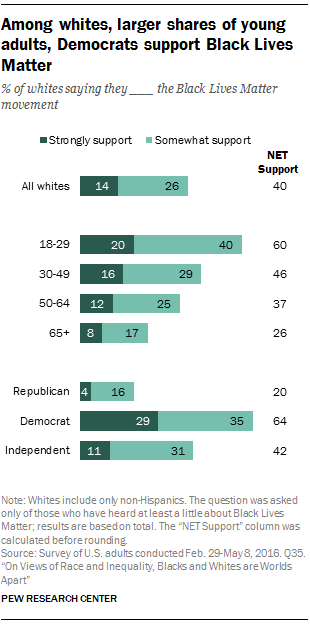
Among whites, larger shares of young adults, Democrats support Black Lives Matter

Young white adults are more enthusiastic about Black Lives Matter than middle-aged and older whites. Six-in-ten of those ages 18 to 29 say they support it, compared with 46% of whites ages 30 to 49, 37% of whites ages 50 to 64, and 26% of whites 65 and older. Young whites are also somewhat more likely than their older counterparts to say that the Black Lives Matter movement will be at least somewhat effective in the long run (47% vs. 37%, 32% and 26%, respectively).

Whites’ views on Black Lives Matter also differ significantly by party identification. Some 64% of white Democrats support the movement, including 29% who do so strongly. One-in-five white Republicans and 42% of white independents say they support the Black Lives Matter movement (4% of Republicans and 11% of independents strongly support it). White Democrats are also much more likely than Republicans and independents to say that the movement will ultimately be at least somewhat effective in bringing about racial equality (53% vs. 20% and 34%, respectively).

When asked how well they feel they understand the goals of the Black Lives Matter movement, blacks are much more likely than whites to say they understand it very or fairly well. Even so, about one-in-five blacks (19%) say they don’t have a good understanding of its goals, compared with 29% of whites. But general awareness of Black Lives Matter is widespread among whites and blacks: Overall, 81% of blacks and 76% of whites have heard at least a little about the movement, including about half or more of each group (56% and 48%, respectively), who say they have heard a lot.

Many blacks and whites say community engagement is key to bringing about racial equality
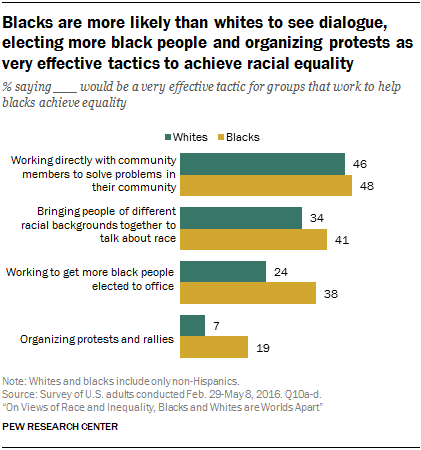
Blacks are more likely than whites to see dialogue, electing more black people and organizing protests as very effective tactics to achieve racial equality

More than four-in-ten blacks (48%) and whites (46%) say that working with community members to solve problems in their community would be a very effective tactic for groups striving to help blacks achieve equality. But the two groups disagree about the effectiveness of some other tactics.

The remainder of this report examines in greater detail the public’s views of the state of race relations and racial inequality in the U.S. Chapter 1 looks at some key demographic and economic indicators where blacks have made progress or lag behind other racial and ethnic groups. Chapter 2 focuses on views about the current state of race relations and its trajectory, as well as the job Obama has done on this issue. Chapter 3 examines the extent to which Americans think the country has made – or will eventually make – the changes necessary for blacks to achieve equal rights with whites. It also looks at perceptions about the way blacks and whites are treated across many realms of American life. Chapter 4 focuses on what the public sees as effective strategies for groups and organizations working to promote racial equality and explores attitudes toward the Black Lives Matter movement and other organizations that strive to bring about equality for black Americans. Chapter 5 looks at personal experiences with discrimination as well as perceptions about the impact race and gender have had in one’s life. Chapter 6 describes the outlook and experiences of blacks, whites and Hispanics, particularly as they relate to personal finances.

Other key findings

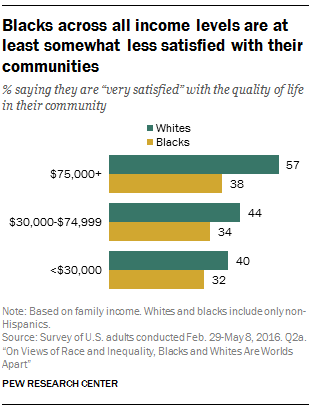
  • About half (48%) of whites say they are very satisfied with the quality of life in their community, compared with about a third (34%) of blacks. This gap persists after controlling for income. For example, 57% of whites with an annual family income of $75,000 or more report that they are very satisfied with the quality of life in their community; just 38% of blacks in the same income group say the same.
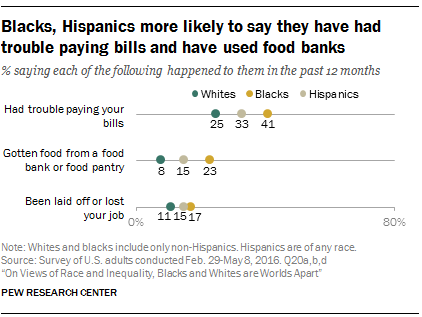
  • Blacks are far more likely than whites to say they have experienced financial hardship in the past 12 months. About four-in-ten (41%) blacks say they have had trouble paying their bills, and about a quarter (23%) say they have gotten food from a food bank or food pantry during this period. Among whites, 25% say they have struggled to pay their bills, and 8% report having sought out food from a food bank in the past 12 months.
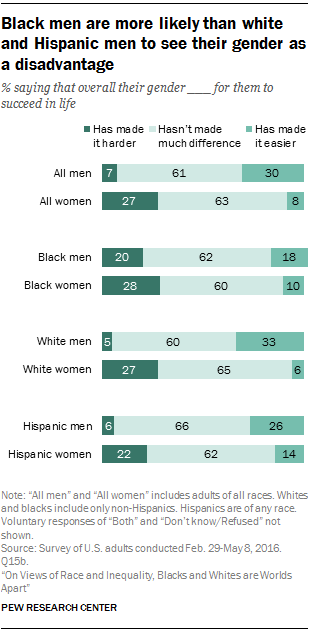
  • Black men are far more likely than white men to say their gender has made it harder for them to get ahead in life (20% vs. 5%, respectively). Among women, similar shares of blacks (28%) and whites (27%) say their gender has set them back.
  • About eight-in-ten (81%) blacks say they feel at least somewhat connected to a broader black community in the U.S., including 36% who feel very connected. Blacks who feel a strong sense of connection to a broader black community are more likely than those who don’t to say that in the past 12 months they have made a financial contribution to, attended an event sponsored by, or volunteered their time to a group or organization working specifically to improve the lives of black Americans.
  • Majorities of blacks say the NAACP (77%), the National Urban League (66%) and the Congressional Black Caucus (63%) have been at least somewhat effective in helping blacks achieve equality in this country. Only about three-in-ten or fewer say each of these groups has been very effective, likely reflecting, at least in part, the widespread view among blacks that the country has work to do for blacks to achieve equal rights with whites.


Terminology

References to whites, blacks and Asians include only those who are non-Hispanic, unless otherwise noted, and identify themselves as only one race. Hispanics are of any race. In Chapter 1, references to whites and blacks for survey years prior to 1971 include Hispanics.

Throughout this report, references to college graduates or people with a college degree comprise those with a bachelor’s degree or more. “Some college” refers to those with a two-year degree or those who attended college but did not obtain a degree. “High school” refers to those who have attained a high school diploma or its equivalent, such as a General Education Development (GED) certificate.
1. Demographic trends and economic well-being

In many ways, America remains two societies – one black and one white – as measured by key demographic indicators of social and economic well-being. 5 At the same time, it’s important to note that on some measures, gaps across racial and ethnic groups have diminished.

Analyses of federal government data by the Pew Research Center find that blacks on average are at least twice as likely as whites to be poor or to be unemployed. Households headed by a black person earn on average little more than half of what the average white households earns. And in terms of their median net worth, white households are about 13 times as wealthy as black households – a gap that has grown wider since the Great Recession.

Racial differences in family structure have persisted as well. While marriage rates are falling among all racial groups, the decline has been most dramatic among blacks. Non-marital births are more than twice as common among black mothers as white mothers, and black children are almost three times as likely as white children to be living with a single parent.

To be sure, some economic and educational differences between blacks and whites have narrowed over time. While blacks are more than twice as likely as whites to be living in poverty, this actually reflects a marked improvement since the mid-1970s when blacks were almost four times as likely as whites to be poor. And the white-black gap in high school completion rates has almost disappeared since the 1960s, though blacks are still significantly less likely than whites to graduate from college.

While education is widely viewed as the key to upward mobility for all races, the Pew Research Center analysis finds that the benefits of schooling often flow in unequal measure to blacks relative to whites. For example, among those with a bachelor’s degree, blacks earn significantly less than whites ($82,300 for black householders vs. $106,600 for whites). In fact, the income of blacks at all levels of educational attainment lags behind that of their white counterparts.

Similar racial disparities across educational levels occur across measures of social well-being and family structure. For example, about nine-in-ten (92%) white women with a bachelor’s degree who recently gave birth were married, a proportion that drops to 60% among new black mothers with a similar level of education.

Taken together, these findings suggest that educational differences alone cannot fully explain the black-white gaps in economic outcomes or family structure.

The remainder of this chapter explores major differences in social and economic well-being across racial and ethnic groups, with particular focus on the persistence in the disparities between blacks and whites in recent decades. The first section examines in greater depth racial differences in educational attainment. Later sections explore various economic outcomes, including measures of family income, wealth and homeownership, poverty and unemployment. The chapter concludes with sections on racial differences in family structure, including non-marital birth rates, child living arrangements and marriage rates.

Blacks still trail whites in college completion

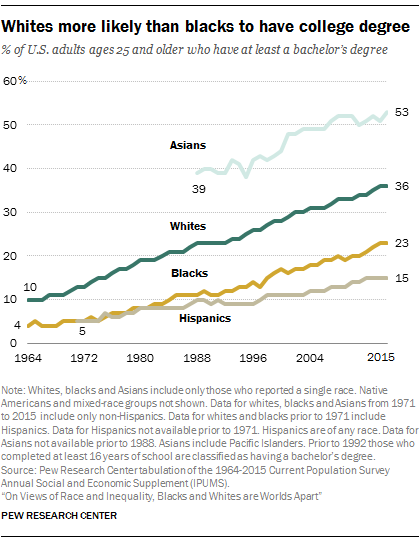
Whites more likely than blacks to have college degree

Increasingly, a college degree is the key to financial well-being, while the value of a high school diploma has diminished markedly over time. Since the 1960s, rates of college graduation have increased significantly for all major racial and ethnic groups, though large gaps persist. 6 Whites are far more likely to hold a bachelor’s degree than blacks. More than a third (36%) of whites ages 25 and older do, compared with 23% of blacks, according to analyses of the Current Population Survey.

As college completion rates have been on the rise, the white-black gap in college completion has narrowed somewhat – while in 1995, whites were almost twice as likely as blacks to have a bachelor’s degree, whites today are about 1.5 times as likely as blacks to have one.

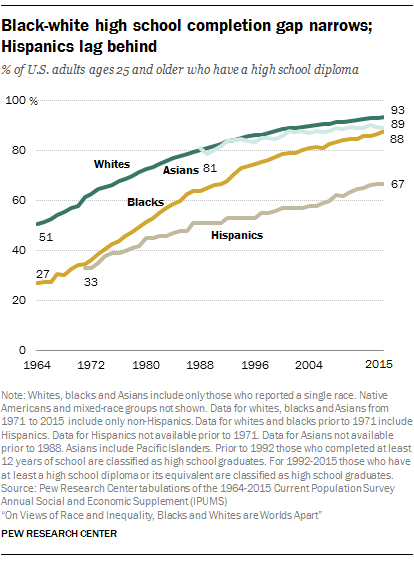
Black-white high school completion gap narrows; Hispanics lag behind

Whites are also slightly more likely than blacks to have completed high school. However, the black-white gap in high school completion has narrowed substantially over the past half century, driven in part by dramatic increases in high school completion for blacks. 7 In 1964, just 27% of blacks ages 25 and older had a high school diploma, while today the share is 88%. By comparison, 51% of whites in 1964 had a diploma, versus 93% today.

Among Hispanics, the share with a bachelor’s degree has tripled since 1971, when data for this group first became available. Now about 15% are college graduates. Even so, the Hispanic-white gap in college completion has persisted; whites today are more than twice as likely as Hispanics to have a college degree, as was the case in the early 1970s.

Hispanic high school completion rates have roughly doubled since the early 1970s, yet a white-Hispanic gap persists in this measure, too. Today, two-thirds of Hispanics have a high school diploma, compared with about nine-in-ten whites (93%).

The story is very different for Asians in the U.S. They have consistently been more likely than other racial and ethnic groups to have a bachelor’s degree. Today, just over half (53%) do, compared with about 36% of whites. And when it comes to high school completion, Asian rates have more or less been on par with whites since 1988, when data on Asians first became available.

Black-white income gap remains large

Racial gaps in household income persist

The income of households headed by blacks has persistently lagged behind that of white households since the U.S. Census Bureau began collecting these data in the late 1960s. In 2014, median black household income was about $43,300, while white household income was about $71,300. 8 By comparison, 20 years prior, black household income was about $37,800 compared with $63,600 among white households. And in 1967, the first year for which data are available, median black household income was $24,700, compared with $44,700 among white households. 9

Household heads with higher levels of formal education tend to have higher household incomes. However, the black-white gap in income occurs across all educational levels. For example, the median adjusted household income among black householders with at least a bachelor’s degree was $82,300 in 2014, while the income of college-educated white householders was $106,600.

The median adjusted income for households headed by Hispanics in 2014 was about the same as that of households headed by blacks – $43,300. The income gap between Hispanics and whites has also persisted over the past four decades; Hispanic median household income ($34,000) was 67% that of whites in 1970, the first year that data were available for Hispanics. 10 By 2014, it was 61% of white household income. Conversely, the gap between Hispanics and blacks has narrowed. In 1970, Hispanic household income was about 20% higher than that of blacks, but that gap has more or less disappeared over the past two decades.

As with white incomes, the incomes of households headed by Asians exceeded $70,000 annually in 2014. Asian income has been on a par with or has exceeded white income since 1987 when comparable data for Asians became available.

Blacks more than twice as likely as whites to be poor

Blacks still more than twice as likely as whites to be poor, despite narrowing of poverty gap

Blacks are more than twice as likely as whites to live in poverty. 11 In 2014, about a quarter (26%) of blacks were poor, compared with 10% of whites. The black-white poverty gap has narrowed somewhat since the mid-1970s, when 30% of blacks were living below the poverty line – a proportion nearly four times the share of whites living in poverty (8%).

Hispanics, too, were more than twice as likely as whites to be living in poverty in 2014 – 24% were. While Hispanic poverty has fluctuated over the years, today’s rate is similar to what it was in 1974 (23%).

In 2014, the Asian poverty rate (12%) was just slightly higher than that of whites. This marks a narrowing of the white-Asian gap, driven primarily by the declining share of Asians who are poor. In 1987 (the first year that poverty data regarding Asians are available), 16% of Asians were living in poverty, compared with 9% of whites.

A growing wealth gap between blacks and whites

Whites have significantly higher levels of wealth than blacks

Households headed by whites have considerably higher median net worth – a measure of the value of what a household owns minus what it owes – than those headed by blacks. 12 In 2013, the net worth of white households was $144,200, roughly 13 times that of black households, according to Pew Research Center analysis of data from the Federal Reserve’s Survey of Consumer Finances. 13

The wealth gap between black and white households has widened since 1983, when the median wealth of white households ($98,700) was eight times that of the wealth of black households ($12,200). The gap narrowed in the 1990s and early 2000s but increased in the years following the Great Recession.

While median net worth tends to increase as levels of educational attainment rise, the white-black gap in wealth persists even controlling for educational differences. For example, the median net worth of black households headed by someone with at least a bachelor’s degree was $26,300 in 2013, while for households headed by white college degree holders that net worth was $301,300 – 11 times that of blacks.

The wealth gap between white and Hispanic households has been consistently large. In 2013, the net worth of white households was roughly 10 times that of households headed by a Hispanic ($14,000). In comparison, in 1983, the wealth of white households was about 11 times that of Hispanic households ($9,000).

Blacks significantly less likely than whites to be homeowners

Homeownership more common among whites than other racial and ethnic groups

The racial and ethnic differences in median net worth are driven in part by differences in homeownership. White householders have consistently higher rates of homeownership than racial and ethnic minorities. For instance, 72% of white householders own their own home, compared with 43% of black householders. As is the case with household wealth, the white-black gap in homeownership is also widening somewhat; in 1976, the homeownership rate among blacks was 44% vs. 69% for whites.

Homeownership rates generally rise for blacks and whites who have higher incomes and more education, but the differences between black and white households persist. The homeownership rate of upper-income blacks (68%) is significantly lower than the rate of upper-income whites (84%). 14 The same is true among the highly educated – 58% of black householders with a college degree own their home, compared with 76% of whites.

The Hispanic-white gap in homeownership has fluctuated since 1976, with the widest gaps occurring in 1991 when the Hispanic rate was 39% and the white rate was 70%. Today, 45% of Hispanic householders are homeowners.

While Asians still trail whites in terms of homeownership, that gap has been narrowing. Today 57% of Asian householders are homeowners, while in 1988, when data on Asians first became available, the Asian homeownership rate was 49% vs. 69% among white householders.

Blacks twice as likely as whites to be unemployed

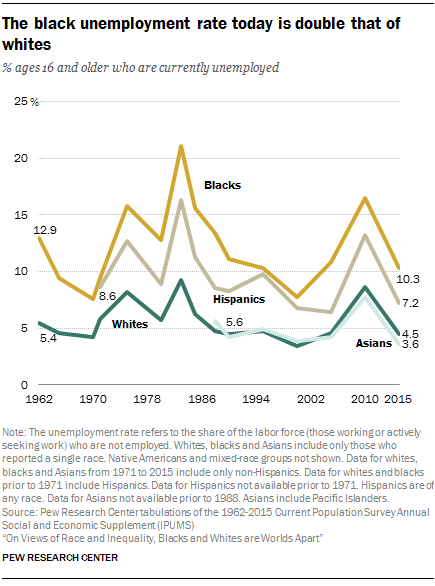
The black unemployment rate today is double that of whites

The unemployment rate has steadily fallen for all major racial and ethnic groups since 2010, but black unemployment has been at least twice as high as white unemployment in 47 of the past 54 years for which data are available, according to Current Population Survey data. 15

The unemployment rate for whites was 4.5% in 2015 and among blacks that share was 10.3%. As unemployment rose in the early 1980s due to an economic downturn, the jobless rate for all blacks rose to 21.1% in 1983 – its highest point in more than 50 years – while the white rate peaked at 9.3%.

Black men have particularly high unemployment rates. Some 11.6% are unemployed. By comparison, the rate among white men stands at 5.1%. And 9.3% of black women are unemployed, while just 3.8% of white women are.

Among Hispanics, unemployment stands at 7.2%, and the Hispanic-white unemployment gap today is similar to what it was in 1971 when data about Hispanics first became available. Then, 8.6% of Hispanics were unemployed – 1.5 times the rate of whites. In 2015, unemployment for Hispanics was 1.6 times that of whites.

Just 3.6% of Asians are unemployed today. Asian unemployment has mostly been on par with whites since 1988 when comparable data for Asians was first available. Today Asians are slightly less likely than whites to be unemployed.

Non-marital births more than twice as common among blacks as whites

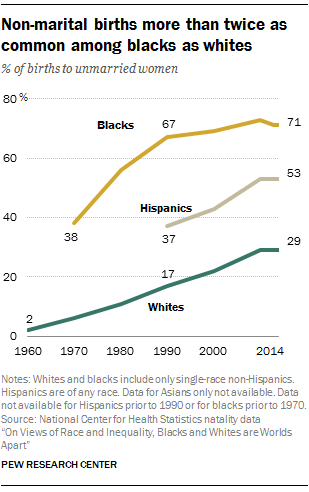
Non-marital births more than twice as common among blacks as whites

Non-marital births are far more common among blacks than whites. In 2014, roughly seven-in-ten (71%) births to black women occurred outside of marriage, compared with 29% of births to white women. This gap in non-marital childbearing is a longstanding one. In 1970, fully 38% of all births to black women occurred outside of marriage, compared with just 6% among white women. By 1990, 67% of births to black women were non-marital, versus 17% among white women.

Educational differences explain some – but not all – of the racial and ethnic differences in non-marital births; even within educational categories, the racial differences in non-marital births persist. For example, among whites who recently gave birth, 92% of those with a college degree were married in 2014. By comparison, the share among blacks was 60%.

Non-marital births have been on the rise for decades in the U.S. While just 5% of all births were to unmarried women in 1960, by 1990 more than one-in-four (28%) of all births were to unmarried women. The number peaked at 41% between 2008 and 2013 and by 2014 it ticked down to 40%.

In 2014, just over half (53%) of births to Hispanic women were non-marital births. This marks a significant rise since 1990, the first year for which data regarding Hispanics is available, when 37% of births to Hispanics occurred outside of marriage.

Just over half of black children live with a single parent

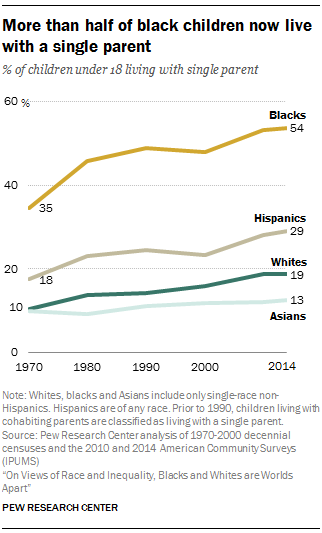
More than half of black children now live with a single parent

Black children are more than twice as likely as white children to be living with just one parent. More than half (54%) of black children did so in 2014, compared with 19% of whites. This 35-percentage point difference marks a widening of the racial gap in children’s living arrangements. In 1970, 35% of black children were living with only one parent, compared with 10% of white children.

Throughout the decades, Hispanic children have been more likely than whites, but less likely than blacks, to be living with a single parent. In 1970, 18% did, and by 2014 the share was 29%.

While the likelihood of living with a single parent has increased markedly since 1970 for whites, blacks and Hispanics, that is not the case for Asian children. In 1970, one-in-ten were living with only a single parent, and by 2014 that share increased slightly to 13%.

Marriage rate decline particularly steep among blacks

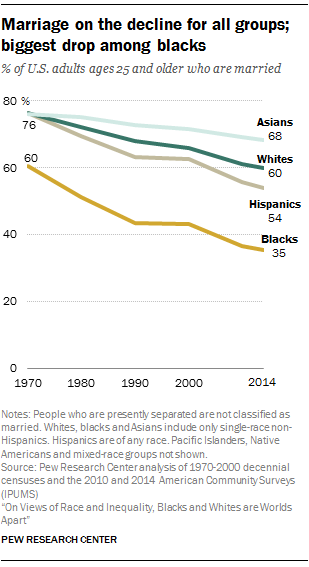
Marriage on the decline for all groups; biggest drop among blacks

The marriage rate has declined across racial and ethnic groups, but the drop has been particularly dramatic among blacks. In 2014, some 35% of black adults ages 25 and older were married, compared with 60% of whites. In 1970, this gap was considerably smaller: Fully 60% of blacks and 76% of whites were married at that time.

Across all groups, the declines in marriage have been driven largely by increasing shares of people who have never married. This is especially common among blacks; more than one-third of those ages 25 and older have never married, compared with just 17% of whites ages 25 and older.

Divorce, too, contributes to racial and ethnic differences in the likelihood of being married. Marriages involving black women tend to be less stable than those of whites, Hispanics or Asians. About 56% of first marriages of black women will last until their tenth anniversary, compared with 68% among marriages of white women.

Typically more education is linked to higher marriage rates, and the relatively low educational attainment of blacks is one factor underlying the low prevalence of marriage in this group. However, even controlling for education, racial differences persist. For instance, among college graduates, less than half (46%) of blacks were married in 2014, compared with 67% of whites.

By comparison, in 2014 some 68% of all Asians ages 25 and older were married, as were just over half (54%) of Hispanics. In 1970, the marriage rates of these groups were similar to that of whites – about three-fourths were married. And these racial and ethnic differences in marriage also are apparent even when looking only at people with college degrees – among those with a four-year college degree, 59% of Hispanics were married, as were 72% of Asians in 2014.

Overall, some 27% of Hispanics have never married, as is the case for 19% of Asians. Women from both of these groups experience first marriages that are more likely to endure than those of white women. Among Hispanic women, some 73% of marriages will last until the tenth anniversary, as will 83% of those involving Asian women.

2. Views of race relations

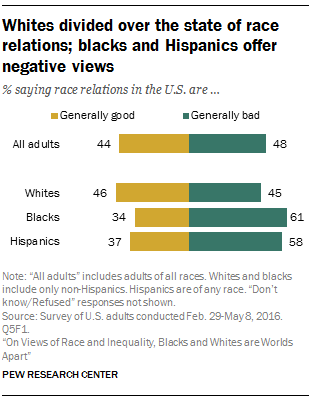
There’s no consensus among American adults about the state of race relations in the U.S.: 48% say race relations are generally bad, and 44% say they are generally good. Similarly, when asked about the amount of attention paid to race and racial issues in the country these days, about as many say there is too much (36%) as say there is too little (35%) attention, while 26% say there is about the right amount of attention paid to these issues.

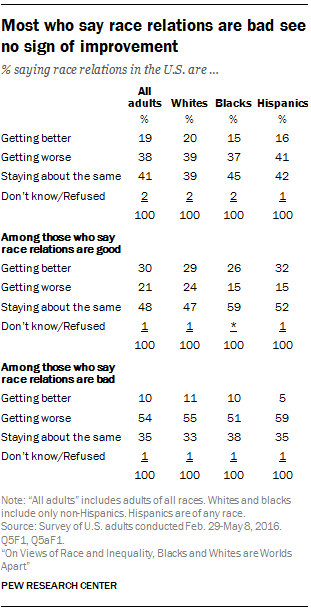
Overall, relatively few Americans think race relations are headed in a positive direction. Only 19% say race relations are improving, while about four-in-ten say they are getting worse (38%), and a similar share say things are staying about the same (41%). Those who already think race relations are bad are particularly likely to say things are getting even worse.

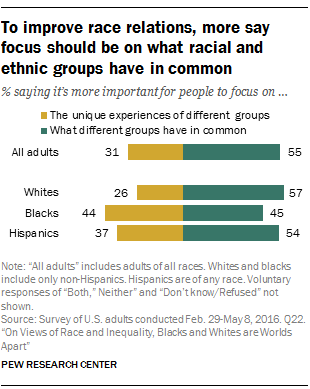
And there is no widespread agreement on how to make things better. When asked about the best approach to improving race relations, 55% of Americans say it’s more important for people to focus on what different racial and ethnic groups have in common, while fewer (31%) say the focus should be on what makes each group unique.

Opinions on these fundamental questions about race relations– where we are, how they can be improved, and how much attention the issue warrants – are sharply divided along racial lines. Blacks and whites are also divided in their views of Obama’s handling of race relations. Among whites, about as many say the president has made progress toward improving race relations (28%) as say he has made things worse (32%). In contrast, 51% of blacks say Obama has made progress on this issue; just 5% believe he has made race relations worse.

Blacks and Hispanics more likely to say race relations are bad

Whites divided over the state of race relations; blacks and Hispanics offer negative views

Views about the current state of race relations vary considerably across racial and ethnic lines. While whites are about equally likely to say race relations are good (46%) as to say they are bad (45%), the assessments of blacks and Hispanics are decidedly negative. About six-in-ten (61%) blacks say race relations in this country are bad, while 34% say they are good. Similarly, far more Hispanics say race relations are bad (58%) than say they are good (37%).

Roughly half or more of black adults across demographic groups express negative views about the current state of race relations. Among whites, views are also fairly consistent across gender, age, education and income groups, but opinions divide along political lines. About six-in-ten (59%) white Democrats say race relations in the U.S. are generally bad, while about a third (34%) say they’re good. In contrast, white Republicans are about evenly divided between those who say race relations are bad (46%) and those who say they’re good (48%). Among white independents, 49% offer positive assessments, while 39% say race relations are bad.

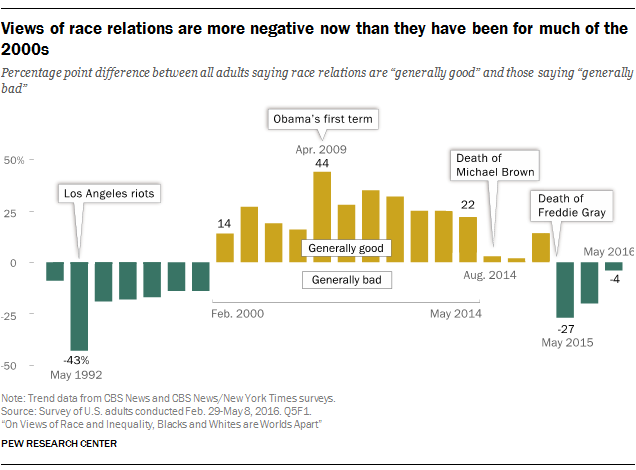
Overall, views of race relations are more positive now than they were a year ago. In May 2015, following unrest in Baltimore over the death of Freddie Gray, a black man who died while in police custody, far more Americans said race relations were bad (61%) than said they were good (34%), according to a CBS News/New York Times poll. At that time, whites (62%) were about as likely as blacks (65%) to say race relations were generally bad.

Even so, the public’s views of race relations are more negative now than they have been for much of the 2000s. Between February 2000 and May 2014, by double-digit margins, more said race relations were good than said they were bad. By August 2014, after the death of Michael Brown, an unarmed black 18-year-old shot and killed by a white police officer in Ferguson, Missouri, opinions had changed significantly: 47% described race relations in the U.S. as generally good and44% as generally bad.

Views of the state of race relations were particularly negative after the Los Angeles riots in 1992. In May 1992, about seven-in-ten (68%) Americans, including 67% of whites and 75% of blacks, said race relations were generally bad.

Views of race relations are more negative now than they have been for much of the 2000s

Few say race relations are improving

Most who say race relations are bad see no sign of improvement

About one-in-five (19%) Americans say race relations in the U.S. are getting better, while about four-in-ten (38%) say they are getting worse and about as many (41%) say they are staying about the same.

Those who say race relations are currently bad are particularly pessimistic: 54% say race relations are getting even worse, and 35% don’t see much change. Only one-in-ten of those who say race relations are bad believe they are improving. These views are shared about equally by whites, blacks and Hispanics who offer negative assessments of the current state of race relations.

Among those who say race relations are good, three-in-ten say they are getting better and roughly half (48%) say they are staying about the same; 21% say race relations are getting worse. Whites who say race relations are currently good offer a somewhat more negative assessment of where the country is headed on this issue than do blacks and Hispanics who say race relations are good. About a quarter (24%) of whites who say race relations are good believe they are getting worse, compared with 15% of blacks and Hispanics who feel that way.

More say focus should be on what different groups have in common

To improve race relations, more say focus should be on what racial and ethnic groups have in common

Far more Americans say that when it comes to improving race relations, it’s more important for people to focus on what different racial and ethnic groups have in common (55%) than say it’s more important to focus on the unique experiences of different racial and ethnic groups (31%).

This is particularly the case among whites, who are about twice as likely to say the focus should be on what different groups have in common (57%) rather than what makes different groups unique (26%). Hispanics also share this view by a margin of 54% to 37%.

Blacks are more evenly divided: 44% say it’s more important for people to focus on what makes different racial and ethnic groups unique, while roughly the same share (45%) say the focus should be on what different groups have in common.

For the most part, the views of blacks and whites about the best approach to improving race relations do not vary considerably across demographic groups. For example, across educational groups – from those with a high school diploma or less to those with a bachelor’s degree – blacks divide in roughly the same way on this question, and the same is true across educational groupings for whites.

Younger adults more likely to say that, to improve race relations, focus should be on what makes racial and ethnic groups unique

There are significant age gaps, however, when it comes to opinions about focusing on differences vs. similarities. Among white adults, those younger than 30 are more likely than older whites to say that, when it comes to improving race relations, it’s more important for people to focus on the unique characteristics of each group; about four-in-ten (41%) whites ages 18 to 29 say this, compared with 27% of whites ages 30 to 49 and about one-in-five of those ages 50 and older (21%).

Age is also linked to black adults’ views about the best approach to improving race relations, although, among this group, the divide is between those younger than 50 and those who are 50 or older. Among blacks ages 18 to 49, more say the focus should be on what makes each racial and ethnic group unique (54% among those ages 18 to 29 and 50% among those ages 30 to 49). Among older blacks, particularly those ages 65 and older, more say the focus should be on what different racial and ethnic groups have in common.

Blacks and whites differ over the amount of attention paid to race and racial issues

For whites, too much attention paid to race; for blacks and Hispanics, not enough

When asked if they think the amount of attention paid to race and racial issues in our country today is too much, too little or about right, Americans are divided: 36% say there is too much and about as many (35%) say there is too little. Roughly a quarter (26%) say the amount of attention paid to these issues is about right.

Blacks’ and whites’ views on this issue are in sharp contrast. Blacks are about twice as likely as whites to say too little attention is paid to race and racial issues (58% vs. 27%). And while only 22% of blacks say there is too much focus on race, 41% of whites say this is the case. Among Hispanics, half think too little attention is paid to race and racial issues, while 25% say too much attention is paid to those issues and 23% say it is about the right amount.

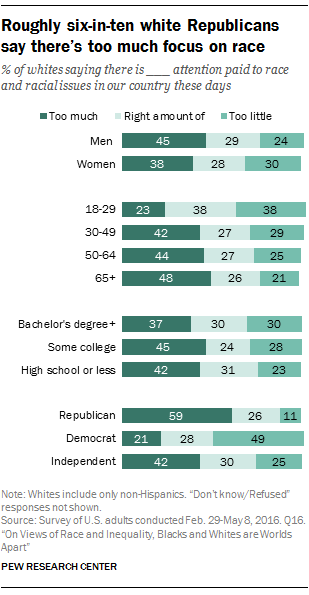
Roughly six-in-ten white Republicans say there’s too much focus on race

For whites, views about the amount of attention given to race and racial issues are strongly linked to partisanship. About six-in-ten (59%) white Republicans say too much attention is paid to these issues these days; just 11% say there is too little attention, and 26% say the amount of attention is about right. In contrast, about half of white Democrats (49%) say not enough attention is being paid to race and racial issues, while 21% say the amount is too much and 28% say it is about right. Still, white Democrats are far less likely than black Democrats (62%) to say too little attention is being paid to these issues.

Whites’ opinions about how much focus there is on race and racial issues in the country today are also linked to age. Whites who are younger than 30 are far less likely than older whites to say there is too much focus on race; about a quarter (23%) of whites ages 18 to 29 say this, compared with at least four-in-ten whites ages 30 to 49 (42%), 50 to 64 (44%) and 65 or older (48%). There are no significant demographic differences among blacks on this question.

Most say Obama at least tried to improve race relations

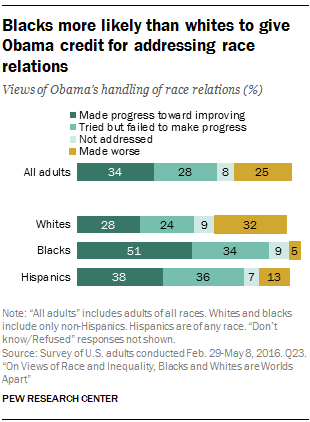
Blacks more likely than whites to give Obama credit for addressing race relations

In the days following Barack Obama’s election in 2008, voters were somewhat optimistic that the election of the nation’s first black president would lead to better race relations. Today, as Obama finishes his second term, about a third (34%) of Americans say Obama has made progress toward improving race relations, and about three-in-ten (28%) say the president has tried but failed to make progress in this area. A sizable share (25%) say he has made race relations worse, while 8% say Obama has not addressed race relations.

Assessments of Obama’s performance on race relations vary considerably along racial and ethnic lines. About half (51%) of black Americans think the president has made progress toward improving race relations; 34% say he tried but failed to make progress. Very few blacks say Obama made race relations worse (5%) or that he didn’t address the issue (9%).

Among whites, however, about a third (32%) say the president has made things worse when it comes to race relations; 28% say Obama has made progress toward improving race relations and 24% say he tried but failed. Hispanics’ assessments of Obama’s performance on race relations are not as negative as those of whites, but are also not as positive as those offered by blacks. Roughly four-in-ten (38%) Hispanics say the president made progress toward improving race relations, and about as many (36%) say he has tried but failed to make progress; 13% of Hispanics say he has made things worse. About one-in-ten (9%) blacks and 7% of Hispanics say Obama has not addressed race relations.

Among blacks, opinions about Obama’s handling of race relations vary primarily along educational lines. While about half of black Americans with some college (52%) or with a high school education or less (54%) say the president has made progress toward improving race relations, fewer among those with a bachelor’s degree (40%) say Obama has had success in this area. Still, at least eight-in-ten black Americans across educational attainment say the president has at least tried to make progress toward improving race relations, even if he hasn’t necessarily succeeded.

About seven-in-ten conservative white Republicans say Obama has made race relations worse

Assessments of Obama among whites are strongly linked to partisanship and ideology. About six-in-ten (63%) white Republicans say the president has made race relations worse, a view that is shared far more widely by white Republicans who describe their political views as conservative (71%) than among Republicans who say they are politically moderate or liberal (44%). In contrast, about half (52%) of white – and black (55%) – Democrats, including somewhat similar shares of those who are liberal and moderate or conservative, say the president has made progress toward improving race relations.

Far more blacks than whites say they talk about race-related topics with family, friends

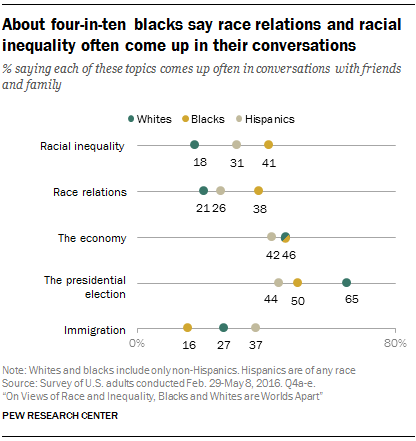
About four-in-ten blacks say race relations and racial inequality often come up in their conversations

For blacks, far more than for whites, conversations about race are fairly commonplace. Overall, about a quarter of Americans say they often talk about race relations or racial inequality with friends and family, far less than the share saying they talk about the presidential election campaign (59%) or the economy (45%) with the same frequency. 16 About a quarter (27%) say immigration is often a topic of conversation with friends and family.

Blacks are about twice as likely as whites to say the topics of racial inequality and race relations often come up in conversations with friends and family. About four-in-ten black adults say racial inequality (41%) and race relations (38%) are frequent topics of conversation, compared with about one-in-five whites. Among Hispanics, about three-in-ten (31%) say they often talk about racial inequality and about a quarter (26%) say they often talk about race relations.

In contrast, about the same shares of whites (46%), blacks (46%) and Hispanics (42%) say they often talk to friends and family about the economy, while Hispanics are more likely than the other two groups to say immigration is a frequent topic of conversation for them (37% vs. 27% of whites and 16% of blacks).

Blacks and whites offer different assessments of their interactions with people of the other race

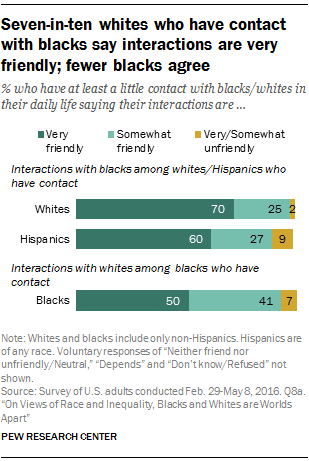
Seven-in-ten whites who have contact with blacks say interactions are very friendly; fewer blacks agree

Most whites who have some daily contact with people who are black describe their interactions as mainly positive. Blacks give a somewhat less positive assessment of their contact with whites. Fully 70% of whites who have a least a little bit of contact with blacks characterize their interactions as very friendly. Black adults are 20 percentage points less likely to describe interactions with whites that way: half of those who have at least a little contact with whites in their daily life describe these interactions as very friendly, while about four-in-ten (41%) would call them “somewhat friendly.” Relatively few in either group would go so far as to call their interactions “unfriendly” (2% among whites and 7% among blacks).

The survey also asked Hispanics about their interactions with people who are black. Among the 86% of Hispanics who have any amount of contact with blacks, 60% say these interactions are generally very friendly; 27% say they are somewhat friendly, and 9% describe their interactions with blacks as unfriendly. About one-in-eight (13%) Hispanics say they have no contact with people who are black. Hispanics who have a lot of contact with blacks are far more likely than those who have some or only a little contact to say these interactions are very friendly; about three-quarters (73%) of Hispanics who have a lot of contact with blacks say this is the case, compared with 58% of those who have some contact and 45% of those who have only a little contact with people who are black.

Overall, 66% of blacks say they have a lot of contact with whites, while 20% have some contact, and 12% have a little contact; just 2% of blacks say they have no contact at all with people who are white. Not surprising, since blacks are a far smaller share of the population, far fewer whites (38%) say they have a lot of contact with people who are black, while 35% say they have some contact and 20% say they have only a little contact; 6% of whites say they have no contact with blacks. Southern whites (50%) are far more likely than whites in the Northeast (36%), Midwest (33%) and West (29%) to say they have a lot of contact with people who are black.

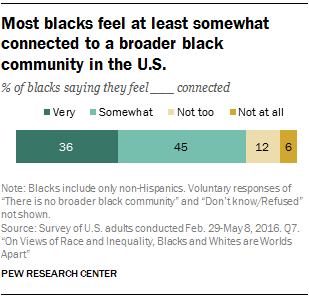
Roughly a third of blacks say they feel very connected to a broader black community

Most blacks feel at least somewhat connected to a broader black community in the U.S.

About eight-in-ten (81%) black adults say they feel at least somewhat connected to a broader black community in the U.S., including 36% who feel very connected. About one-in-five say they don’t feel too (12%) or at all (6%) connected to a broader black community in the U.S.

Blacks across demographic groups, including men and women, young and old, and across education and income levels, are about equally likely to say they feel very connected to a broader black community. However, those with less education and lower incomes are more likely than those with a bachelor’s degree and annual family incomes of at least $30,000 to say they don’t feel too or at all connected. About one-in-five blacks with only some college (18%) or with a high school education or less (20%) feel disconnected from a broader black community, compared with 11% of black college graduates. And while 22% of blacks with family incomes below $30,000 say they don’t feel too or at all connected to a broader black community, fewer among those with incomes between $30,000 and $74,999 (13%) or higher (12%) say the same.

About six-in-ten black worshipers attend services where all or most congregants are black

Blacks who say they regularly attend predominantly black churches are among the most likely to feel connected to a broader black community. Among those who attend religious services at least once a month and who say all or most of the congregants are black, 48% say they feel very connected. By comparison, 35% of black churchgoers who say some or only a few of the people with whom they attend services are black feel the same sense of connectedness.

Overall, 58% of black adults say they attend religious services at least monthly, including 39% who do so at least once a week and 19% who attend once or twice a month; an additional 17% of black adults say they attend a few times a year, while about a quarter say they do so only seldom (13%) or never (11%). By this measure, blacks are significantly more likely than whites to attend religious services regularly; 44% of whites say they attend at least monthly, while 17% say they do so a few times a year and 39% say they seldom or never attend religious services. 17

About six-in-ten (58%) black adults who say they attend church at least monthly report that all or most of the other people attending are black. Three-in-ten say some are black and 11% say only a few or none are black.

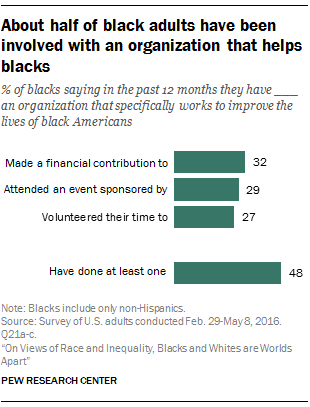
About half of blacks have made a financial contribution, attended an event, or volunteered their time to an organization working to improve the lives of black Americans

About half of black adults have been involved with an organization that helps blacks

Blacks who have a strong sense of connection to a broader black community are more likely than those who don’t feel strongly connected to say they are actively involved with groups or organizations that specifically work to improve the lives of black Americans. Overall, about three-in-ten blacks say they have made a financial contribution to (32%), attended an event sponsored by (29%), or volunteered their time to (27%) such a group in the past 12 months. Roughly half (48%) of black Americans say they have done at least one of these activities.

Among blacks who say they feel very connected to a broader black community, about six-in-ten (58%) say they have done at least one of these activities, compared with 45% of those who say they feel somewhat connected and 35% of those who say they feel not too connected or not at all connected to a broader black community.

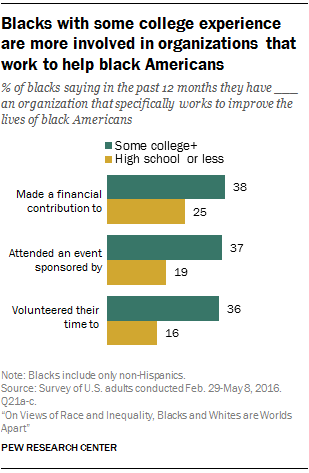
Blacks with some college experience are more involved in organizations that work to help black Americans

Looking at each activity, roughly four-in-ten (43%) blacks who feel very connected to a broader black community report having made a financial contribution to a group or organization that works to improve the lives of black Americans in the past 12 months, compared with 28% of those who feel somewhat connected and 22% who don’t feel too or at all connected to a broader black community. Similarly, those who feel very connected are more likely than those who feel somewhat or even less connected to say they have attended an event sponsored by this type of group (38% vs. 27% and 16%, respectively) or have volunteered their time (33% vs. 25% and 19%).

For the most part, involvement with organizations that specifically work to improve the life of black Americans doesn’t vary significantly across demographic groups. But blacks with at least some college experience are more likely than those with a high school diploma or less to say they have made a financial contribution (38% vs. 25%), attended an event (37% vs. 19%) or volunteered their time (36% vs. 16%) to this type of organization in the past 12 months.

3. Discrimination and racial inequality

About six-in-ten Americans say more changes needed to achieve racial equality

Most Americans say, as a country, we have yet to achieve racial equality. Roughly six-in-ten (61%) say that our country needs to continue making changes for blacks to have equal rights with whites, while 30% say we have made the changes needed to bring about equality. Blacks and Hispanics are particularly likely to say more work is needed to achieve racial equality, although more whites also say this is the case than say enough changes have been made.

Looking ahead, about four-in-ten (43%) blacks are skeptical that the country will ever make the changes needed for blacks to achieve equal rights with whites. Far lower shares among whites (11%) and Hispanics (17%) are doubtful that these changes will eventually take place.

Blacks and whites also offer different perspectives about the challenges black people face in the U.S. For example, whites are more likely to point to individual prejudice rather than institutional racism as the bigger problem when it comes to discrimination against black people today (70% citing individual prejudice vs. 19% saying institutional racism). Blacks are more evenly divided: 48% say individual prejudice is the bigger problem, while 40% point to discrimination that is built into the country’s laws and institutions.

Whites are also far less likely than blacks to say black people in the country as a whole and in their communities are treated less fairly than whites in dealing with the police, in the courts, when voting, in the workplace, when applying for a loan or mortgage, and in stores or restaurants. And while majorities of blacks say racial discrimination, lower quality schools and lack of jobs are major reasons blacks in the U.S. may have a harder time getting ahead than whites, far smaller shares of whites hold those views.

Most Americans say more changes needed to achieve racial equality

Views of country’s progress on racial equality differ by race and ethnicity

Roughly six-in-ten (61%) Americans say the country needs to continue making changes for blacks to have equal rights with whites; 30% say the country has already made enough changes. The share saying more changes are needed is virtually unchanged since the question was last asked in July 2015, but it is considerably higher than it was two years ago, before events such as the shooting death of an unarmed black 18-year-old by a white police officer in Ferguson, Missouri, and the racially motivated killing of nine black Americans in a Charleston, South Carolina, church. In early 2014, about as many adults said more changes were needed (46%) as said the country had already made all the changes necessary (49%) for blacks to have equal rights with whites.

Roughly nine-in-ten (88%) black Americans, including solid majorities across all demographic groups, say more needs to be done to achieve racial equality. A majority (70%) of Hispanics share this view. Among whites, more also say further changes are needed (53%) than say the country has already made the changes necessary for blacks to have equal rights (38%), but far larger shares of whites than blacks or Hispanics think the country has made the changes needed to achieve racial equality.

White Republicans and Democrats differ widely on how far country has come on racial equality

White Americans’ opinions about how far the country has come on racial equality vary drastically across party lines. White Democrats are more than four times as likely to say more changes are needed for blacks to have equal rights with whites (78%) than they are to say the country has made the necessary changes (17%). White Republicans, however, are more likely to say the country has already made the changes needed to ensure that blacks have the same rights as whites by a 54% to 36% margin. White independents are more evenly split.

Many blacks are skeptical that the country will make the changes needed for blacks to achieve equal rights with whites

About four-in-ten blacks are skeptical that the country will ever achieve racial equality

Of the 61% of Americans who say more changes are needed for blacks to have equal rights with whites, far more say these changes will eventually happen (42%) than say the country will not make the necessary changes (16%). Blacks are far more skeptical than whites and Hispanics about the prospect for racial equality.

Blacks are about twice as likely as whites to point to discrimination as a major reason that some blacks have a harder time getting ahead

About four-in-ten (43%) black Americans believe the country will never make the changes needed for blacks to have equal rights with whites, while about the same share (42%) believe these changes will eventually be made. These views are shared about equally among blacks across demographic groups.

Whites and Hispanics are far less doubtful: just 11% and 17%, respectively, say the country will not make the changes needed for blacks to have the same rights as whites. Put differently, at least seven-in-ten whites (75%) and Hispanics (71%) who say the country still has work to do to achieve racial equality are optimistic that these changes will eventually take place.

Blacks and whites disagree on major factors holding black people back

When asked about reasons that black people in the U.S. may have a harder time getting ahead than whites, about six-in-ten Americans point to family instability (58%) and lower quality schools (58%) as major factors. About half (53%) say a lack of good role models or a lack of jobs (48%) are major reasons, and 45% point to racial discrimination. Fewer (35%) say lack of motivation to work hard is a major factor holding black people back. Majorities say each of these is at least a minor reason that blacks may have a harder time getting ahead than whites.

There is vast disagreement between blacks and whites about the extent to which racial discrimination may be contributing to a lack of progress for blacks. Fully seven-in-ten blacks say discrimination is a major reason blacks may have a harder time getting ahead than whites; 36% of whites share this view. White Democrats are far more likely than white Republicans and independents to see discrimination as a major factor holding black people back (56% vs. 18% and 36%, respectively).

By at least 20 percentage points, blacks are also more likely than whites to say lower quality schools (75% vs. 53%) and lack of jobs (66% vs. 45%) are major factors holding black people back. Blacks are also more likely than whites to say blacks may have a harder time getting ahead because they lack motivation to work hard; 43% of blacks say this is a major reason, compared with 30% of whites. 18

Among blacks, those with a high school education or less are more likely than those with some college education and those with a bachelor’s degree to say lack of motivation is a major explanation for why blacks may have a harder time getting ahead (51% vs. 40% and 31%, respectively). Education is also linked to white views on this. Roughly four-in-ten ( 37%) whites with a high school education or less and 33% of those with some college say lack of motivation is a major reason why blacks may have a harder time getting ahead, compared with 19% of whites with a college degree.

When it comes to family instability and lack of good role models, blacks and whites offer similar views. Roughly six-in-ten (57%) blacks and 55% of whites say family instability is a major reason that blacks may have a harder time getting ahead than whites. And about half of each group say the same about a lack of good role models.

Black and white adults who are married are about as likely as those who are not married to say family instability is a major factor holding black people back.

Most Americans say individual, rather than institutional, racism is the bigger problem for blacks

Most Americans say individual, not institutional, racism is the bigger problem; blacks are divided

On balance, many more Americans say that, when it comes to discrimination against blacks in the U.S. today, individual prejudice is a bigger problem than discrimination that is built into our laws and institutions (66% vs. 23%).

Seven-in-ten whites and a similar share of Hispanics (67%) see individual racism as the bigger problem when it comes to discrimination against people who are black. Blacks, however, are more divided, although slightly more point to the prejudice of individuals (48%) than to discrimination that’s built into laws and institutions (40%).

Opinions about the type of discrimination that poses the biggest problem for black people don’t vary significantly across demographic groups, either for blacks or for whites.

Blacks more likely than whites to see unfair treatment in the country and where they live

Perceptions of how blacks are treated in the U.S. vary widely across race and ethnicity

Across many realms of American life – including in dealing with the police, in the courts, when voting, in the workplace, when applying for a loan or mortgage, and in stores or restaurants – black adults are consistently more likely than whites to say blacks are treated less fairly, both in the communities where they live and in the country as a whole.

About eight-in-ten (84%) black Americans say blacks in this country are treated less fairly than whites in dealing with the police, and majorities also say blacks are treated less fairly in the courts (75%), when applying for a loan or mortgage (66%), and in the workplace (64%). Smaller but sizable shares of blacks say black people in this country are treated less fairly than whites in stores or restaurants (49%) and when voting in elections (43%).

Blacks are more likely than whites and Hispanics to perceive unfair treatment of blacks in their communities

In contrast, half or fewer among whites say blacks in this country are treated less fairly than whites in dealing with the police (50%) and in the courts (43%), and a quarter or less see unfair treatment towards blacks when applying for a loan or mortgage (25%), in the workplace (22%), in stores or restaurants (21%) or when voting in elections (20%). At least half of whites say both groups are treated about equally in stores or restaurants, in the workplace, when applying for a loan or mortgage and when voting in elections; and about four-in-ten say this about the treatment of blacks and whites in dealing with the police or in the courts. Virtually no white adults say whites are treated less fairly than blacks in each of these realms.

By large margins, white Democrats are more likely than white Republicans and independents to say blacks are treated less fairly than whites in the U.S. across all of the items asked about in the survey. For example, about three-quarters (74%) of white Democrats say blacks are treated less fairly when dealing with the police, compared with 30% of white Republicans and 48% of white independents. And while at least half across partisan groups say blacks and whites in the U.S. are treated about equally when it comes to voting in elections, more white Democrats than white Republicans and independents say blacks are treated less fairly than whites (40% vs. 5% and 18%, respectively).

Blacks and whites also offer widely different views when asked to assess the way each group is treated in their own communities. For example, majorities of black adults say blacks in their community are treated less fairly than whites in dealing with the police (74%), in the courts (69%), and when applying for a loan or mortgage (60%). In contrast, about a third or fewer whites say blacks are treated less fairly in each of these situations (35%, 27%, and 15%, respectively).

However, across many measures, blacks and whites are more likely to say blacks are treated less fairly than whites in the country than they are to say this is the case in their own community.

4. Achieving racial equality

Working with community members to solve problems seen as the most effective tactic to help blacks achieve equality

While most Americans agree that the country needs to do more to achieve racial equality, some tactics for achieving this goal are seen as more effective than others. For example, about half of Americans say it would be very effective for groups working to help blacks achieve equality to work directly with community members to solve problems in their communities (49%), while fewer say bringing people of different racial backgrounds together to talk about race (38%), working to get more black people elected to office (28%), or organizing protest and rallies (11%) would be very effective.

Blacks are generally more likely than whites to say most of these tactics would be effective for groups working to promote racial equality, but at least seven-in-ten among each group say working directly with community members, bringing people of different backgrounds together for dialogue, and working to get more black people elected to office would be at least somewhat effective. Blacks and whites differ most widely in their views of protests and rallies: 63% of black Americans say organizing these types of events would be at least somewhat effective, compared with 39% of whites.

The survey also finds that about two-thirds of black Americans support the Black Lives Matter movement, including 41% who strongly support it. Far fewer (40%) whites express at least some support for the Black Lives Matter movement, and only 14% say they strongly support it. Among Hispanics, about a third say they strongly (15%) or somewhat (18%) support the Black Lives Matter movement.

When asked about the Black Lives Matter movement’s effectiveness in helping blacks achieve equality, roughly six-in-ten (59%) blacks say it will be at least somewhat effective in the long run. Smaller shares of whites (34%) and Hispanics (31%) say the movement will be effective.

A majority of black adults also say that that the NAACP (77%), National Urban League (66%) and the Congressional Black Caucus (63%) have been at least somewhat effective in helping blacks achieve equality.

Working with community members seen as most effective tactic to increase equality

Roughly half across race and ethnic groups see working together at the community level as a very effective tactic for helping blacks achieve equality

Groups whose goals include helping blacks achieve equality in the U.S. may use a variety of tactics to reach this aim. The survey tested four approaches to bringing about change: working with community members, bringing people of different racial backgrounds together to talk about race, working to elect more black people to office, and organizing protest and rallies. Of these tactics, working directly with community members to solve problems in the community is seen as particularly effective. Roughly half of whites (46%), blacks (48%) and Hispanics (53%) say this would be very effective for organizations working toward racial equality.

When it comes to bringing people of different racial backgrounds together to talk about race, at least four-in-ten blacks (41%) and Hispanics (45%) see this as a very effective tactic for groups that work to help blacks achieve equality, compared with about one-third of whites (34%). Blacks and Hispanics are also more likely than whites to say working to elect more black people to office would be a very effective tactic (38% and 36% vs. 24%, respectively).

Across racial and ethnic groups, fewer say protests would be very effective than say this about the other tactics tested. Still, blacks (19%) and Hispanics (20%) are nearly three times as likely as whites (7%) to say that organizing protests and rallies would be a very effective tactic for helping blacks achieves equality. And when those who say this tactic would be at least somewhat effective are considered, the opinions of blacks and whites are nearly mirror opposites of each other. About six-in-ten (63%) black adults say organizing protests would be at least somewhat effective; 58% of whites say this tactic would not be particularly effective, including 33% who say it wouldn’t be effective at all.

White adults younger than 30 are more likely than older whites to see protests as at least a somewhat effective tool for groups working to achieve racial equality. About half (52%) of younger whites say this, compared with 36% of whites ages 30 to 49, 42% of those ages 50 to 64, and 30% of those ages 65 and older. Blacks across demographic groups share similar views about the effectiveness of protests and the other tactics asked about in the survey.

Most blacks say organizations aimed at helping blacks achieve equality have been effective

Blacks largely view organizations that aim to help blacks achieve equality as effective

A majority of blacks say that the NAACP, the National Urban League and the Congressional Black Caucus have been at least somewhat effective in helping blacks achieve equality in this country. However – and perhaps not surprising considering the large share of blacks who say the country has work to do for blacks to achieve equal rights with whites – only about three-in-ten or fewer say each organization has been very effective.

About three-quarters of black Americans say the NAACP has been very (29%) or somewhat (47%) effective in helping blacks achieve equality, while about two-thirds say the same about the National Urban League (18% very effective and 48% somewhat effective). Most blacks (63%) also say the Congressional Black Caucus has been at least somewhat effective, including 15% who say it has been very effective.

Blacks across demographic groups largely share the same views on the effectiveness of these organizations. Yet, awareness of these groups isn’t necessarily uniform. While virtually all blacks have heard of the NAACP, 7% say they have not heard of the National Urban League and 6% say they haven’t heard of the Congressional Black Caucus. Young black adults ages 18 to 29 are considerably more likely than older blacks to volunteer that they have never heard of the National Urban League or the Congressional Black Caucus. About one-in-five (18%) young black adults say they have never heard of the National Urban League, compared with 7% of those ages 30 to 49 and 2% of adults in older age groups. And 12% of blacks younger than 30 say they have never heard of the Congressional Black Caucus, compared with 5% of those ages 30 to 49, 2% of those ages 50 to 64, and 3% of blacks ages 65 or older.

Most Americans have heard at least a little about the Black Lives Matter movement

Widespread awareness of the Black Lives Matter movement among blacks, whites

Roughly three-quarters (73%) of the nation has heard at least a little about the Black Lives Matter movement, including roughly half of Americans (46%) who say they have heard a lot about it. But familiarity with the movement varies greatly across different segments of the population, with awareness particularly high among younger blacks.

Blacks are somewhat more likely than whites, and considerably more likely than Hispanics, to say they have heard a lot about Black Lives Matter. Some 56% of blacks say this, compared with 48% of whites and 29% of Hispanics. Fully half of Hispanics say they haven’t heard anything at all about the Black Lives Matter movement.

Among blacks, those ages 18 to 29 are more likely than older adults to say they have heard a lot about the Black Lives Matter movement. Roughly three-quarters (74%) of young black adults say this, compared with 62% of those ages 30 to 49, 43% of those ages 50 to 64 and 38% of blacks 65 or older.

Among whites, however, similar shares of those younger than 30 (51%), those ages 30 to 49 (51%) and those ages 50 to 64 (50%) say they have heard a lot about the Black Lives Matter movement. Fewer whites ages 65 or older (39%) say this.

Among blacks and whites, those with higher levels of education are more likely to say they have heard a lot about the Black Lives Matter movement. Among blacks, 71% of those with a bachelor’s degree or more and 63% of those with some college education say this, compared with 45% of black adults with a high school diploma or less. Among whites, 59% of those with a college degree say they have heard a lot about the movement, while 47% of those with some college education and 37% of those with a high school diploma or less say the same.

Blacks considerably more likely than whites, Hispanics to say they understand the goals of the Black Lives Matter movement

In addition to reporting that they have heard a lot about the Black Lives Matter movement, most blacks (62%) say they understand the group’s goals at least fairly well, including a third who say they understand its goals very well. Roughly half (46%) of whites and 28% of Hispanics say they understand the goals of the Black Lives Matter movement at least fairly well, including just 12% in each group who say they understand the goals very well.

Blacks express strong support for the Black Lives Matter movement

Looking at those who have heard at least a little about the Black Lives Matter movement, larger shares among all racial and ethnic groups say they understand its goals. Fully 76% of blacks who have heard of Black Lives Matter say they understand the goals of the group, including 42% who say they understand them very well.

Roughly six-in-ten whites (61%) and Hispanics (59%) who have heard at least a little about Black Lives Matter say they understand its goals at least fairly well.

About four-in-ten Americans express support for Black Lives Matter

Large partisan divide on support for the Black Lives Matter movement among whites

Some 43% of U.S. adults say they strongly (18%) or somewhat (25%) support the Black Lives Matter movement. About two-thirds (65%) of blacks say they at least somewhat support the movement, including 41% who offer strong support. By comparison, 40% of whites and 32% of Hispanics express support for the Black Lives Matter movement (14% of whites and 15% of Hispanics say they strongly support it).

White adults younger than 30 are far more likely than older whites to say they at least somewhat support the Black Lives Matter movement. Six-in-ten young white adults say this, compared with 46% of whites ages 30 to 49, 37% of those ages 50 to 64, and 26% of white adults ages 65 or older.

White Democrats are also far more likely than white Republicans and independents to express support for the Black Lives Matter movement. Some 64% of white Democrats say they at least somewhat support it, similar to the share of black Democrats (65%) who say the same. By comparison, 20% of white Republicans and 42% of white independents say they support the Black Lives Matter movement at least somewhat.

A narrow majority of blacks think Black Lives Matter will be effective in helping achieve racial equality

Among blacks, support for the Black Lives Matter movement is particularly widespread among those younger than 50; and those in this group are also more likely to express strong support. About half of blacks ages 18 to 29 (52%) and ages 30 to 49 (47%) say they strongly support the Black Lives Matter movement. By comparison, a third of blacks ages 50 to 64 (32%) and 26% of those ages 65 and older say the same. While older blacks are less likely to have heard about the movement, this age gap remains when looking only at those who say have heard at least a little about it.

Blacks more likely than whites and Hispanics to say the Black Lives Matter movement will be effective

Roughly four-in-ten (38%) Americans say they think that, in the long run, the Black Lives Matter movement will be at least somewhat effective in helping blacks achieve equality, including 8% who say it will be very effective. A third of Americans say the movement will not be too effective or won’t be effective at all.

Most blacks (59%) believe the Black Lives Matter movement will be at least somewhat effective in helping blacks achieve equality. This includes one-in-five blacks who think the movement will be very effective. By comparison, 34% of whites and 31% of Hispanics say the Black Lives Matter will be at least somewhat effective; just 6% and 7%, respectively, expect it to be very effective.

As with other questions related to Black Lives Matter, whites’ assessments of how effective the movement will be in the long run are split along party lines. White Democrats are considerably more likely than their Republican and independent counterparts to say Black Lives Matter will be at least somewhat effective in helping blacks achieve equality (53% vs. 20% and 34%, respectively).

5. Personal experiences with discrimination

Roughly seven-in-ten black Americans (71%) say they have personally experienced discrimination or been treated unfairly because of their race or ethnicity, including 11% who say this is something they experience regularly. Far lower shares of whites (30%) and Hispanics (52%) report experiencing discrimination because of their race or ethnicity.

Overall, four-in-ten black Americans say their race or ethnicity has made it harder for them to succeed in life, while about half (51%) say it hasn’t made much difference, and just 8% say it has made it easier for them to succeed. One-in-five Hispanics say their race or ethnicity has made it harder to succeed in life, while just 5% of white adults say the same; 31% of whites say their race or ethnicity has made it easier for them to succeed.

When asked about specific kinds of discrimination that people may face, about half of black adults said that in the past year someone has acted as if they were suspicious of them (47%) or as if they thought they weren’t smart (45%). About two-in-ten blacks say they were treated unfairly in hiring, pay or promotion over the past year (21%) and a similar share (18%) say they have been unfairly stopped by the police over the same period. In each of these cases, blacks are more likely than both whites and Hispanics to say they have experienced these things in the past year.

Majorities of all demographic subgroups of blacks have experienced racial discrimination

Majorities of all black subgroups say they have experienced discrimination

Large majorities of blacks across all major demographic groups say – at some point in their lifetime – they have experienced discrimination or been treated unfairly because of their race or ethnicity, including similar shares of men and women, young and old, and those with higher and lower incomes.

Reports of discrimination are more common among blacks with at least some college education; 81% say they have experienced this at least occasionally, including 13% who say it happens regularly, compared with 59% and 8%, respectively, among blacks with a high school diploma or less.

Among blacks who say they have personally experienced discrimination, equal shares say discrimination built into our laws and institutions is the bigger problem for black people today as say the bigger problem is the prejudice of individual people (44% each). Blacks who say they have never experienced discrimination are more likely to see individual discrimination rather than institutional discrimination as the bigger problem (59% vs. 32%).

Among Hispanics, higher shares of those who are younger than 50 (58% vs. 35% of older Hispanics), have at least some college education (61% vs. 45% with no college experience) and are U.S. born (62% vs. 41% of foreign born) report having ever experienced discrimination.

The share of whites who say they have ever faced discrimination or been treated unfairly because of their race or ethnicity is much lower than that of blacks or Hispanics. Still, three-in-ten white adults say they have experienced discrimination.

About half of blacks say someone has treated them with suspicion or like they weren’t smart

About half of blacks say someone has acted suspicious of them or has treated them like they weren’t smart

When asked about some things people may have experienced because of their race or ethnicity, roughly half 0f black Americans say that, in the past 12 months, someone has acted like they were suspicious of them (47%) or like they didn’t think they were smart (45%). About half as many say they have been treated unfairly by an employer in hiring, pay or promotion (21%) or that they have been unfairly stopped by police (18%) because of their race or ethnicity over the same period.

Whites are far less likely than blacks to say they have had these experiences. In fact, only about one-in-ten whites say that, in the past 12 months, someone has acted like they were suspicious of them (10%) or like they didn’t think they were smart (9%) because of their race or ethnicity, and even fewer say they have been treated unfairly by an employer (4%) or have been unfairly stopped by police (3%).

Among Hispanics, about three-in-ten (29%) say someone has acted like they thought they weren’t smart and about a quarter (23%) say someone has acted as if they were suspicious of them in the past 12 months; 16% of Hispanics say they have been treated unfairly by an employer and 11% say they have been unfairly stopped by police because of their race or ethnicity.

Black men are more likely than black women to say they have been seen as suspicious (52% vs. 44%) and that they have been unfairly stopped by police (22% vs. 15%) in the past 12 months. There is no significant difference in the share of black men and women who say someone has acted as if they thought they weren’t smart and who say they have been treated unfairly by an employer.

Blacks with at least some college education are more likely than those with a high school diploma or less to report having been treated as if they were not smart in the past year because of their race or ethnicity (52% vs. 37%). Blacks with at least some college education are also more likely than blacks with no college experience to say someone has acted like they were suspicious of them (55% vs. 38%).

With the exception of being unfairly stopped by police, perceptions of unfair treatment among blacks don’t differ significantly by family income. One-in-five blacks with annual family incomes under $30,000 or with incomes between $30,000 and $74,999 say they have been unfairly stopped by police in the past year, compared with 12% of blacks with incomes of $75,000 or more.

Among Hispanics, those younger than 30 are more likely than those in older age groups to say they have been treated unfairly by an employer or that people have been suspicious of them or have acted as if they didn’t think they were smart because of their race or ethnicity. Nativity is also linked to these types of experiences. U.S.-born Hispanics are more likely than the foreign born to report being treated as if they were unintelligent (35% vs. 24%) or suspicious (32% vs. 14%) and to say they were treated unfairly by an employer in hiring, pay or promotion (20% vs. 12%).

Four-in-ten blacks say their race has made it harder for them to succeed in life

Blacks more likely than whites, Hispanics to see their race or ethnicity as hindering their success in life

When asked whether their race or ethnicity has affected their ability to succeed in life, 40% of black adults say it has made it harder to succeed, while 51% say it has not made much difference and just 8% say it has made it easier. The share of blacks saying their race or ethnicity has made it harder to succeed is twice the share of Hispanics (20%) and eight times the share of whites (5%) who say this.

For their part, a majority of whites (62%) and Hispanics (65%) say their race or ethnicity hasn’t made a difference in their success. But whites are about twice as likely as Hispanics to say their race or ethnicity has made it easier to succeed in life (31% vs. 14%).

Black Americans younger than 50, as well as those with more education and higher incomes, are particularly likely to say their race or ethnicity has made it harder for them to succeed in life. About four-in-ten (43%) blacks ages 18 to 49 say this, compared with 35% of older blacks.

Among blacks with a bachelor’s degree or more, 55% say their race has been a disadvantage, while 45% of those with some college and 29% of those with a high school diploma or less say the same. Additionally, blacks with family incomes of $75,000 or more are more likely than those with family incomes between $30,000 and $74,999 and those with family incomes below $30,000 to say their race has held them back (54% vs. 43% and 32%, respectively).

For Hispanics, the share saying their race or ethnicity has made it harder to succeed is higher among women (24% vs. 15% of men) and among those younger than 50 (23% vs. 11% of older Hispanics). There are no differences by education level or nativity.

Among whites, education, income, age and partisanship linked to views of impact of race

While most whites say their race or ethnicity has neither helped nor hurt their ability to succeed in life, a substantial share (31%) say their race or ethnicity has made things easier, a view that is more common among whites with at least a bachelor’s degree and with higher incomes, as well as among those who are younger than 50 and who identify with the Democratic Party.

About half of white college graduates (47%) say their race or ethnicity has been an advantage for them, compared with 31% of whites with some college education and an even lower share of whites with a high school diploma or less education (17%). Similarly, whites with family incomes of $75,000 or more (42%) are more likely than those with family incomes below $30,000 (23%) to say their race or ethnicity has made things easier for them. And while about four-in-ten (38%) whites who are younger than 50 say their race has been an advantage, 26% of older whites say the same.

White Democrats are also far more likely than white Republicans and independents to say their race or ethnicity has made it easier for them to succeed in life. About half (49%) of white Democrats say this, compared with a third of white independents (33%) and even fewer (17%) white Republicans.

Blacks are more likely than whites to say their gender has made it harder to succeed

Black men are more likely than white and Hispanic men to see their gender as a disadvantage

In addition to seeing their race as a disadvantage to their lifetime success, blacks are more likely than whites or Hispanics to see their gender as being a disadvantage, a difference that is due in large part to the views of black men, who are more likely than white and Hispanic men to say their gender has made it harder for them to succeed in life.

Among all Americans, women (27%) are more likely to say their gender has been a disadvantage in their lives than men (7%). On the flip side, 30% of men say their gender has made it easier for them to succeed in life, compared with 8% of women. Still, majorities of both men (61%) and women (63%) say their gender hasn’t made much difference in their success.

Across each of the major racial and ethnic groups, women are more likely than men to see their gender as a disadvantage for their success. This gap is particularly pronounced among whites (27% of women vs. 5% of men), and Hispanics (22% vs. 6%). Among blacks, the gap between women and men is much narrower; 28% of black women and 20% of black men say their gender has made it harder for them to succeed. But black men are more likely than black women to say their gender has made things easier for them (18% vs. 10%), as is the case to a greater extent for white men (33% vs. 6% of white women) and Hispanic men (26% vs. 14% of Hispanic women).

By and large, the perceptions women have of how their gender has shaped their chances of success do not differ across race and ethnicities. Black, Hispanic and white women are equally likely to say their gender has made it harder for them to succeed.

6. Views of community, family life and personal finances

The outlook and experiences of black and white adults, particular as they relate to personal finances, differ widely. Blacks are more likely than whites to express dissatisfaction with their financial situation, and to say they have struggled to pay the bills and borrowed money from – or loaned it to – friends and family in the past 12 months. Blacks are also less satisfied than whites with the quality of life in their communities and, though to a lesser extent, with their family life.

But blacks and whites don’t differ just in the way they describe their personal experiences. Blacks are also significantly more likely than whites to say that blacks, as a group, are worse off than whites today in terms of their income and overall financial situation; about six-in-ten (58%) black adults say this, compared with about half (47%) of whites. Still, more whites say blacks are worse off than say they are doing about as well (37%) as whites financially. Few of either group say blacks are better off than whites financially.

Whites and blacks have different outlooks on some key aspects of life

Blacks across all income levels are at least somewhat less satisfied with their communities

Across three measures – satisfaction with the quality of life in their community, personal finances, and family life – whites are more likely than blacks to say they are very satisfied. Differences in outlook are particularly pronounced in regards to one’s community; about half (48%) of whites say they are very satisfied with the quality of life in their community, compared with about a third (34%) of blacks. By a margin of 32% to 22%, a larger share of whites than blacks say they are very satisfied with their personal financial situation. And while majorities of both groups express high levels of satisfaction with their family life, whites are more likely to do so (73% vs. 66% of blacks).

For whites, satisfaction in these three areas is tied to income. The link between outlook and income is less consistent among blacks – higher-income blacks are more likely than those with lower incomes to say they are very satisfied with their personal finances and family life, but they are not necessarily more likely to be satisfied with the quality of life in their community.

Roughly six-in-ten (57%) whites with annual family incomes of at least $75,000 say they are very satisfied with the quality of life in their community, compared with 44% of whites with incomes of $30,000 to $74,999 and 40% of those with incomes of less than $30,000. Among blacks, however, similar shares across income groups say they are very satisfied with this aspect of their life (38%, 34% and 32%, respectively). In each income group, blacks are at least somewhat less likely than their white counterparts to express high levels of satisfaction in the quality of life in their community, and this gap is particularly pronounced between blacks and whites with higher incomes (19 percentage points).

One possible reason for this gap: Researchers at Stanford University found that even among blacks and whites with similar incomes, blacks live in poorer quality neighborhoods in terms of characteristics like schools, child care, recreational spaces and transportation. Furthermore, they found that middle-income black families typically live in neighborhoods with lower average incomes than that of the typical low-income white family. 19

Perhaps not surprisingly, high levels of satisfaction with one’s finances are also tied to income; among blacks and whites, those with higher annual family incomes are more likely than those with lower incomes to say they are very satisfied. Among whites, satisfaction with personal finances is also linked to higher levels of educational attainment, but the same is not the case for blacks.

Whites with at least some college are more highly satisfied with their finances than similarly educated blacks

Whites with at least some college experience are more likely than their black counterparts to express high levels of satisfaction with their personal financial situation. There is a 13 percentage point gap in the share of white and black college graduates who say they are very satisfied with their finances (40% vs. 27%) and a 16 percentage point gap in the share of whites and blacks with some college (31% vs. 15%) who say the same. The experiences of whites and blacks with only a high school diploma or less are more similar (27% and 25% are very satisfied, respectively), though whites are more likely than blacks in this group to be at least somewhat satisfied with their financial situation.

Blacks and Hispanics face more financial hardship than whites

Blacks, Hispanics more likely to say they have had trouble paying bills and have used food banks

Blacks and Hispanics are more likely than whites to report that they have experienced financial hardship over the past year. For example, some 41% of black adults and 33% of Hispanics say they have had trouble paying their bills, compared with 25% of whites. And blacks (23%) and Hispanics (15%) are much more likely than whites (8%) to have sought out food from a food bank over the past year.

The gap between whites and blacks is somewhat narrower on recent job losses. Whites are slightly less likely than blacks (11% vs. 17%) to say they have been laid off or have lost their job over the past year. Some 15% of Hispanics say this happened to them.

Black Americans are particularly likely to have loaned – and borrowed – money

Blacks more likely to borrow money from and loan money to family and friends

Exchanges of money between family and friends are particularly common among black Americans. Some 57% of black adults say they have loaned money to family or friends over the past year, and 35% say they have borrowed money. By comparison, just 39% of white adults say they loaned money to family or friends and 16% say they borrowed money in the past year.

Blacks, Hispanics more likely to say they are lower or lower-middle class

Blacks across all income levels are substantially more likely than whites in the same income bracket to say they have loaned money to or borrowed it from family or friends. For example, among those with family incomes upwards of $75,000, blacks are 25 percentage points more likely than whites to say they have loaned money (61% vs. 36%) and 13 percentage points more likely to say they have borrowed money (20% vs. 7%). And among those with family incomes of less than $30,000, blacks are 16 percentage points more likely than whites to have loaned money (56% vs. 40%) and 17 percentage points more likely to have borrowed it (45% vs. 28%).

Blacks less likely than whites to consider themselves “middle class”

Views of personal finances are also reflected in the social class in which Americans place themselves. Overall, about half of Americans describe themselves as being in the middle class (48%), while 36% say they are in the lower-middle or lower class and 15% place themselves in the upper-middle or upper class. Similar shares of white (17%) and black (14%) adults identify as upper class, but a larger share of whites than blacks say they are middle class (49% vs. 39%). And a far lower share of whites than blacks place themselves in the lower class (32% vs. 45%). Among Hispanics, 8% say they are in the upper class, 45% say they are middle class, and about half (47%) describe themselves as part of the lower class.

Blacks with at least some college are more likely than their white counterparts to say they are in the lower class

To some extent, differences in the way blacks and whites describe their social class can be attributed to differences in educational attainment across the two groups. Whites are more likely than blacks to have college degrees (see Chapter 1), and those with college degrees are more likely than those with less education to say they are middle or upper class. For example, among all U.S. adults with a bachelor’s degree, 28% say they are in the upper class, 54% say they are middle class, and 17% describe themselves as lower class, compared with 10%, 49%, and 39%, respectively, of those with some college and 10%, 41%, and 48%, respectively, of those with a high school education or less.

Still, racial differences in social class identification persist even after controlling for levels of education – except among those with a high school diploma or less education. Black college graduates, as well as those who attended college but did not receive a bachelor’s degree, are more likely than whites with similar levels of education to say they are in the lower class. About three-in-ten (31%) blacks with a college degree describe themselves as lower class, twice the share of white college graduates (14%) who do the same. And while about half (48%) of blacks with some college say they are in the lower class, a smaller share (37%) of whites with comparable levels of education say this.

About half of U.S. adults say blacks are worse off financially than whites

Blacks are more likely than other groups to say blacks are doing worse than whites financially

Racial gaps in financial satisfaction and reported financial hardship reflect decades-old gaps in financial well-being between blacks and whites (see Chapter 1 for an analysis of data from the U.S. Census Bureau). Still, many Americans – including at least three-in-ten whites (37%), blacks (30%), and Hispanics (36%) – believe blacks are about as well off as whites financially.

Blacks are more likely than whites and Hispanics to say the average black person is worse off than the average white person in terms of income and overall financial situation; about six-in-ten (58%) black adults say this, compared with about half of whites (47%) and Hispanics (49%). Few adults in each group say blacks are doing better than whites.

College-educated adults are more likely than those with less education to see financial inequality, and this is true for both black and white adults. Among blacks, 81% of those with a bachelor’s degree or more and 61% of those with some college education say the average black person is worse off financially than the average white person, compared with just 46% of blacks with a high school education or less.

For whites, the educational pattern is similar: 66% of whites with at least a bachelor’s degree and 47% with some college say blacks are worse off financially, compared with 29% of whites with at most a high school diploma. The pattern by family income largely mirrors that by educational attainment.

Acknowledgments

This report is a collaborative effort based on the input and analysis of the individuals listed below. In addition, Pew Research Center received invaluable advice on the development of the questionnaire from Jennifer Richeson, professor of psychology at Yale University, and Christopher Whitt, associate professor of political science and Africana studies at Augustana College. We also benefited from conversations with Donald Kinder, professor of political science and psychology at the University of Michigan, and Kris Marsh, associate professor of sociology at the University of Maryland.

Kim Parker, Director, Social Trends ResearchJuliana Horowitz, Associate Director, Research Eileen Patten, Research Analyst Renee Stepler, Research AssistantGretchen Livingston, Senior Researcher Richard Fry, Senior EconomistMonica Anderson, Research AnalystRich Morin, Senior EditorAnna Brown, Research AssistantClaudia Deane, Vice President, Research Michael Keegan, Information Graphics Designer Yolanda Martinez, Digital Producer Ben Wormald, Web Developer Kelly Browning, User Experience Designer Molly Rohal, Communications Manager Brian Mahl, Communications Assistant Marcia Kramer, Kramer Editing Services

Methodology

Survey methodology

Most of the analysis in this report is based on telephone interviews conducted Feb. 29 to May 8, 2016, among a national sample of 3,769 adults, 18 years of age or older, living in all 50 U.S. states and the District of Columbia (977 respondents were interviewed on a landline telephone, and 2,792 were interviewed on a cellphone, including 1,676 who had no landline telephone). The survey was conducted by interviewers at Princeton Data Source under the direction of Princeton Survey Research Associates International (PSRAI). Interviews were conducted in English and Spanish. For detailed information about our survey methodology, see https://alpha.pewresearch.org/pewresearch-org/methodology/u-s-survey-research/

Four separate samples were used for data collection to obtain a representative sample that included an oversample of black and Hispanic respondents. The first sample was a disproportionately stratified random-digit dialing (RDD) landline sample drawn using standard list-assisted methods. A total of 822 interviews were completed using this RDD landline sample. The second sample was a disproportionally stratified RDD cell sample to oversample blacks and Hispanics. A total of 2,440 interviews were completed using this RDD cell sample. Respondents in the landline sample were selected by randomly asking for the youngest adult male or female who is now at home. Interviews in the cell sample were conducted with the person who answered the phone, if that person was an adult 18 years of age or older.

The landline and cell callback samples were drawn from recent Pew Research Center surveys conducted by PSRAI and included people who identified themselves as black at the time of the initial interview. All surveys used to produce the callback samples employed RDD sampling methodologies.

The weighting was accomplished in multiple stages to account for the disproportionately stratified samples, the overlapping landline and cell sample frames and household composition, the oversampling of blacks through callback interviews, and differential non-response associated with sample demographics.

The first stage of weighting corrected for different probabilities of selection associated with the number of adults in each household and each respondent’s telephone usage patterns. 20 This weighting also adjusts for the overlapping landline and cell sample frames and the relative sizes of each frame and each sample. Since we employed a disproportionately stratified sample design, the first-stage weight was computed separately for each stratum in each sample frame. The callback sample segments were assigned a first-stage weight equal to their first-stage weight from their original interview. After the first-stage weighting an adjustment was made to account for the callback oversamples, landline and cell, of blacks.

The next step in weighting was demographic raking. The data was first divided into three groups – black, Hispanic and white/other. Each group was raked separately to population parameters for sex by age, sex by education, age by education and census region. The white/other group was also raked on a two-category race variable – white vs. not white. The Hispanic group was also raked on nativity – U.S. born vs. foreign born. The combined dataset was raked to parameters for race/ethnicity, population density and household telephone usage. The telephone usage parameter was derived from an analysis of the most recently available National Health Interview Survey data. [21.Blumberg, Stephen J., and Julian V. Luke. 2015. “Wireless Substitution: Early Release of Estimates From the National Health Interview Survey, January-June 2015.” National Center for Health Statistics. December.] The population density parameter was derived from Census 2010 data at the county level. All other weighting parameters were derived from an analysis of the 2014 American Community Survey 1-year PUMS file.

The margins of error reported and statistical tests of significance are adjusted to account for the survey’s design effect, a measure of how much efficiency is lost from the weighting procedures.

The following table shows the unweighted sample sizes and the error attributable to sampling that would be expected at the 95% level of confidence for different groups in the survey:

Unweighted sample sizes

Sample sizes and sampling errors for other subgroups are available upon request.

In addition to sampling error, one should bear in mind that question wording and practical difficulties in conducting surveys can introduce error or bias into the findings of opinion polls.

Pew Research Center undertakes all polling activity, including calls to mobile telephone numbers, in compliance with the Telephone Consumer Protection Act and other applicable laws.

Analyses of secondary data

In Chapter 1, the analyses of education, household income, homeownership, poverty and unemployment are all based upon the Current Population Survey, Annual Social and Economic Supplement (ASEC), which is conducted in March of every year. The specific files used in this report are from March 1962 to March 2015. Conducted jointly by the U.S. Census Bureau and the Bureau of Labor Statistics, the CPS is a monthly survey of approximately 55,000 households and is the source of the nation’s official statistics on unemployment. The ASEC survey in March typically features a larger sample size.

The ASEC surveys collect data on the income of a household in the preceding calendar year. Thus, the 1968 to 2015 files used to analyze income and poverty in this report refer to 1967 to 2014. Data regarding education, homeownership and unemployment are based upon the time of the survey.

The 2015 ASEC utilized a redesigned set of income questions, so the household income figures reported for calendar year 2014 may not be fully comparable to earlier years. Further details on this redesign and its impacts can be found here. Methodological revisions in the CPS may also have an impact on the trends in household income. In particular, the 1993 revisions have an impact on the comparability of income data before and after that date. 21

Household income and household wealth figures were converted to 2014 dollars using the research series of the consumer price index (CPI-U-RS).

The income data are also adjusted for the number of people in a household. That is done because a four-person household with an income of, say, $50,000 faces a tighter budget constraint than a two-person household with the same income. In addition to comparisons across households at a given point in time, this adjustment is useful for measuring changes in the income of households over time. That is because average household size in the United States decreased from 3.2 persons in 1970 to 2.5 persons in 2015, a drop of 21%. Ignoring this demographic change would mean ignoring a commensurate loosening of the household budget constraint. Further detail on the manner in which the Pew Research Center adjusts household income for the size of the household can be found here. The adjusted household income figures are presented for a household size of 3.0.

Data regarding children’s living arrangements, as well as the marital status of adults, are derived from the decennial census (for 1960, 1970, 1980, 1990 and 2000) and the American Community Survey for all other years. Both produce datasets that are nationally representative.

The decennial census, American Community Survey, and CPS microdata used in this report are all derived from the Integrated Public Use Microdata Series (IPUMS) provided by the University of Minnesota. The IPUMS assigns uniform codes, to the extent possible, to data collected over the years. More information about the IPUMS, including variable definition and sampling error, is available at https://www.ipums.org/

The poverty rate figures are derived from the CPS but were not tabulated from microdata. Historical poverty figures are published by the U.S. Census Bureau.

Wealth analyses are derived from the Survey of Consumer Finances (SCF). The SCF is sponsored by the Board of Governors of the Federal Reserve System in cooperation with the U.S. Department of the Treasury and has been collected every three years since its inception in 1983. The interviews are conducted roughly between May and December. The most recent SCF available is for 2013. The tabulations presented are based on the public use version of the SCF available on the Federal Reserve’s website: http://www.federalreserve.gov/econresdata/scf/scfindex.htm. The SCF sample typically consists of approximately 4,500 households

The definition of a “household” in the SCF differs from that used in Census Bureau studies. The sampling unit in the SCF is the “primary economic unit” (PEU), not the household. As stated by the Federal Reserve Board, “the PEU consists of an economically dominant single individual or couple (married or living as partners) in a household and all other individuals in the household who are financially interdependent with that individual or couple.” Federal Reserve Board publications refer to the PEU as a “family,” but readers may infer that this necessitates the presence of two related persons, though a PEU can consist of a person living alone. In this document, a PEU is referred to as a “household.”

Data regarding non-marital births are obtained from the National Center for Health Statistics (NCHS). These vital statistics data reflect information extracted from completed birth certificates for live births, which include the mother’s characteristics at the time of the birth. The tabulations are based upon births occurring in the 50 states and the District of Columbia to people living in the United States in a given calendar year.

Pew Research Center is a nonprofit, tax-exempt 501(c)(3) organization and a subsidiary of The Pew Charitable Trusts, its primary funder.