Pew Research Center

FOR RELEASE MAY 24, 2016

For First Time in Modern Era, Living With Parents Edges Out Other Living Arrangements for 18- to 34-Year-Olds

Share living with spouse or partner continues to fall

BY Richard Fry

FOR MEDIA OR OTHER INQUIRIES:

Communications Department
202.419.4372
www.pewresearch.org

RECOMMENDED CITATION

Pew Research Center, May 2016, "For First Time in Modern Era, Living With Parents Edges Out Other Living Arrangements for 18- to 34-Year-Olds"

About Pew Research Center

Pew Research Center is a nonpartisan, nonadvocacy fact tank that informs the public about the issues, attitudes and trends shaping the world. It does not take policy positions. The Center conducts public opinion polling, demographic research, computational social science research and other data-driven research. It studies politics and policy; news habits and media; the internet and technology; religion; race and ethnicity; international affairs; social, demographic and economic trends; science; research methodology and data science; and immigration and migration. Pew Research Center is a subsidiary of The Pew Charitable Trusts, its primary funder.

© Pew Research Center 2026

Table of contents

  • About Pew Research Center
  • For First Time in Modern Era, Living With Parents Edges Out Other Living Arrangements for 18- to 34-Year-Olds
  • 1. The evolving landscape of young adult living arrangements
  • 2. Living with mom and/or dad: More common for sons than daughters
  • 3. Shifting roles, responsibilities and relationships
  • 4. The job market and young adult living arrangements
  • Acknowledgments
  • Methodology
  • Appendix A: References

For First Time in Modern Era, Living With Parents Edges Out Other Living Arrangements for 18- to 34-Year-Olds

Share living with spouse or partner continues to fall

Broad demographic shifts in marital status, educational attainment and employment have transformed the way young adults in the U.S. are living, and a new Pew Research Center analysis of census data highlights the implications of these changes for the most basic element of their lives – where they call home. In 2014, for the first time in more than 130 years, adults ages 18 to 34 were slightly more likely to be living in their parents’ home than they were to be living with a spouse or partner in their own household. 1

This turn of events is fueled primarily by the dramatic drop in the share of young Americans who are choosing to settle down romantically before age 35. Dating back to 1880, the most common living arrangement among young adults has been living with a romantic partner, whether a spouse or a significant other. This type of arrangement peaked around 1960, when 62% of the nation’s 18- to 34-year-olds were living with a spouse or partner in their own household, and only one-in-five were living with their parents. 2

By 2014, 31.6% of young adults were living with a spouse or partner in their own household, below the share living in the home of their parent(s) (32.1%). Some 14% of young adults were heading up a household in which they lived alone, were a single parent or lived with one or more roommates. The remaining 22% lived in the home of another family member (such as a grandparent, in-law or sibling), a non-relative, or in group quarters (college dormitories fall into this category).
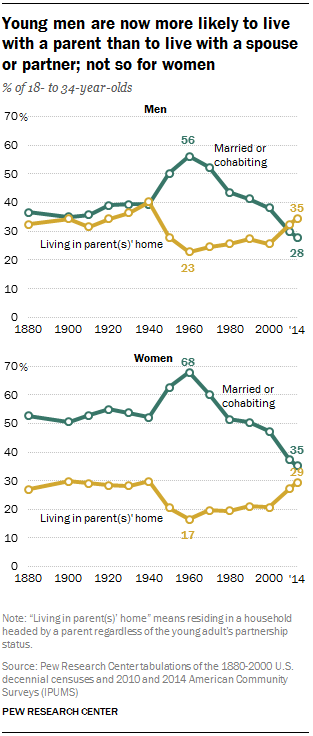
Young men are now more likely to live with a parent than to live with a spouse or partner; not so for women

It’s worth noting that the overall share of young adults living with their parents was not at a record high in 2014. This arrangement peaked around 1940, when about 35% of the nation’s 18- to 34-year-olds lived with mom and/or dad (compared with 32% in 2014). What has changed, instead, is the relative share adopting different ways of living in early adulthood, with the decline of romantic coupling pushing living at home to the top of a much less uniform list of living arrangements.

In 2014, more young women (16%) than young men (13%) were heading up a household without a spouse or partner. This is mainly because women are more likely than men to be single parents living with their children. For their part, young men (25%) are more likely than young women (19%) to be living in the home of another family member, a non-relative or in some type of group quarters.

A variety of factors contribute to the long-run increase in the share of young adults living with their parents. The first is the postponement of, if not retreat from, marriage. The median age of first marriage has risen steadily for decades. In addition, a growing share of young adults may be eschewing marriage altogether. A previous Pew Research Center analysis projected that as many as one-in-four of today’s young adults may never marry. While cohabitation has been on the rise, the overall share of young adults either married or living with an unmarried partner has substantially fallen since 1990.

Economic factors seem to explain less of why young adult women are increasingly likely to live at home. Generally, young women have had growing success in the paid labor market since 1960 and hence might increasingly be expected to be able to afford to live independently of their parents. For women, delayed marriage—which is related, in part, to labor market outcomes for men—may explain more of the increase in their living in the family home.

The Great Recession (and modest recovery) has also been associated with an increase in young adults living at home. Initially in the wake of the recession, college enrollments expanded, boosting the ranks of young adults living at home. And given the weak job opportunities facing young adults, living at home was part of the private safety net helping young adults to weather the economic storm.

Educational attainment, race and ethnicity linked to young adult living arrangements
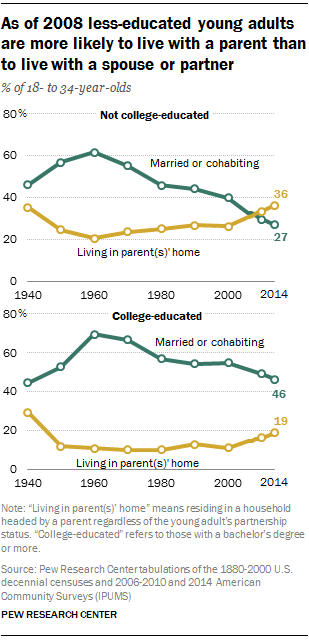
As of 2008 less-educated young adults are more likely to live with a parent than to live with a spouse or partner
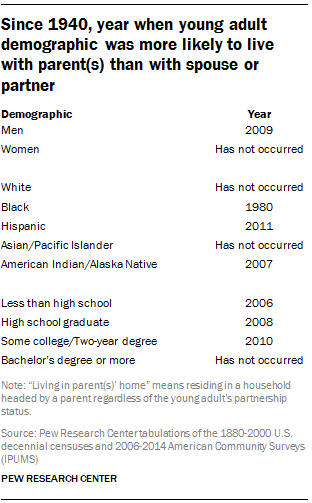
Since 1940, year when young adult demographic was more likely to live in parent(s)’ home than with spouse or partner

For black young adults, living with mom and/or dad is now the most common arrangement, as only 17% were living with a spouse or romantic partner in 2014. For Hispanic young adults living with parent(s) is also the dominant arrangement as 30% were living with a spouse or significant other in 2014. Generally, young adult blacks and Hispanics lag behind young whites both in terms of educational attainment and employment status.

This report presents the historical trends in the share of young adults who live with their parent(s). The first section presents a simple classification of living arrangements. The second section examines trends in living with parents by demographic and geographic groups. The third section explores the shift away from living with a romantic partner and toward living with parents. The final section examines the relationship between living with parents and trends in the labor market opportunities of young adults.

Other key findings: • The growing tendency of young adults to live with parents predates the Great Recession. In 1960, 20% of 18- to 34-year-olds lived with mom and/or dad. In 2007, before the recession, 28% lived in their parental home. • In 2014, 40% of 18- to 34-year-olds who had not completed high school lived with parent(s), the highest rate observed since the 1940 Census when information on educational attainment was first collected. • Young adults in states in the South Atlantic, West South Central and Pacific United States have recently experienced the highest rates on record of living with parent(s). • With few exceptions, since 1880 young men across all races and ethnicities have been more likely than young women to live in the home of their parent(s). • The changing demographic characteristics of young adults—age, racial and ethnic diversity, rising college enrollment—explain little of the increase in living with parent(s).

Terminology

A “young adult” is an adult ages 18 to 34.

An adult is “living with parent(s),” “living at home,” or “living in parent(s)’ home” if the adult is the child of the household head.The household head could be the mother or father.

“Cohabiting adults” refers to household heads with an unmarried partner and the unmarried partners of the household head. An unmarried partner of the household head, also known as a domestic partner, is a person who shares a close personal relationship with the household head. Cohabiting young adults in which the couple does not include the household head are not identified as cohabiting and are categorized in other living arrangement categories.

An adult is “living with a spouse or partner” or “married or cohabiting in own household” if one member of the couple is the head of the household.

An adult is “college-educated” if the adult’s highest education is a bachelor’s degree or more. A “not college-educated” adult refers to an adult whose highest education is less than a bachelor’s degree.

References to white, black, Asian and American Indian young adults include only those who are non-Hispanic. Hispanics are of any race. Asians include Pacific Islanders. American Indians include Alaskan Natives.

The New England census division comprises Connecticut, Maine, Massachusetts, New Hampshire, Rhode Island and Vermont. The Middle Atlantic division: New Jersey, New York and Pennsylvania. The East North Central division: Illinois, Indiana, Michigan, Ohio and Wisconsin. The West North Central division: Iowa, Kansas, Minnesota, Missouri, Nebraska, North Dakota and South Dakota. The South Atlantic division: Delaware, District of Columbia, Florida, Georgia, Maryland, North Carolina, South Carolina, Virginia and West Virginia. The East South Central division: Alabama, Kentucky, Mississippi and Tennessee. The West South Central division: Arkansas, Louisiana, Oklahoma/Indian Territory and Texas. The Mountain division: Arizona, Colorado, Idaho, Montana, Nevada, New Mexico, Utah and Wyoming. The Pacific division: Alaska, California, Hawaii, Oregon and Washington.

1. The evolving landscape of young adult living arrangements

The year 2014 appears to be a milestone in the unfolding living arrangements of the nation’s young adults. For the first time since 1880, young adults are more likely to be living with a parent than they are to be living with a romantic partner in their own household. 4 In 2014, 32.1% of 18- to 34-year-olds lived in their parents’ home, 5 eclipsing the 31.6% of young adults who were married or cohabiting and living in their own separate dwelling. 6 Prior to 2014 the most common living arrangement for young adults was to be in a romantic coupling (either married or cohabiting) living in their own household.

This living arrangement classification is solely based on the young adult’s relationship to the head of the household.

Living with a parent is the most common young adult living arrangement for the first time on record

The overall share of young adults living in their parents’ home was not at a record high in 2014. This arrangement peaked around 1940 when roughly 35% of the nation’s 18- to 34-year-olds lived with mom and/or dad, compared with 32% in 2014. The share of young adults living in the home of their parent(s) hit a record low (20%) around 1960. Living with parents increased between 1960 and 1990, dipped in the 1990s, and has risen sharply in the new millennium.

Until recently, married or cohabiting young adults in their own separate household has been the most prevalent young adult living arrangement through recorded history, and it reached its zenith around 1960. The nuclear family was in its heyday around 1960, 7 and among young adults 62% were either married or cohabiting and living in their own household according to the 1960 Census. In 2014 about half that share are married or cohabiting and running their own household (32%). The rise and decline of married and cohabiting young adult households partly reflects changes in the age at first marriage. Young adults never married as young as they did around 1960 and they have not married as young since. 8 According to Census Bureau figures, the median age at first marriage reached a record low in 1956 at 20.1 years for women and 22.5 years for men. Age at first marriage was 22 and 26.1 years for women and men, respectively, in 1890. Today the typical age at first marriage is 27.1 years for women and 29.2 years for men. 9

The third category refers to young adults living alone, single parents running their own household, or unpartnered young adults who are the household head and living with others. 10 The share of young adults in this category peaked in 2006 at 16% and had fallen to 14% by 2014.

The fourth category – “other living arrangement” – refers to young adults who are not a head of household, the spouse or partner of the head, or the child of the head. Included in this category are the grandchild, niece/nephew or child-in-law of the head. This category also includes young adults unrelated to the head such as housemates, roommates, boarders or lodgers, as well as those living in group quarters (such as college dorms and correctional facilities).

2. Living with mom and/or dad: More common for sons than daughters

The rise in the share of young adults living with their parents since 1960 has occurred for both men and women and across all major racial and ethnic groups.

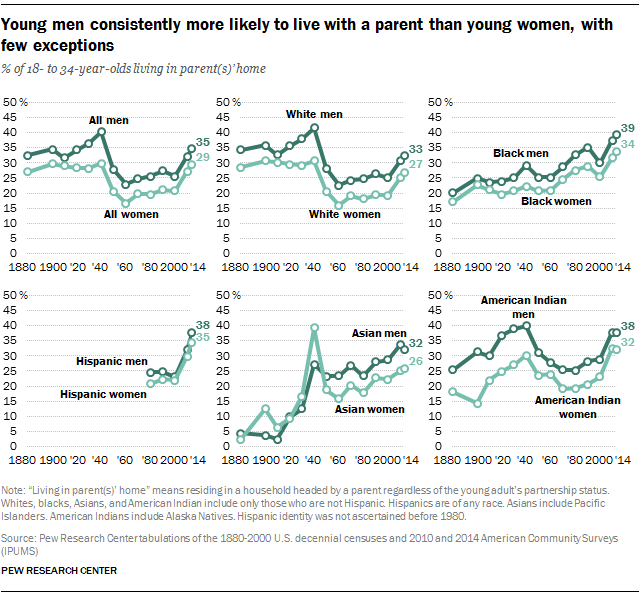
Generally, throughout the past 135 years young men have been more likely than young women to be living in the home of their parent(s). For both genders living with parent(s) was at its nadir around 1960. Since then the gap between men and women has narrowed somewhat. 11

Young men consistently more likely to live with a parent than young women, with few exceptions

The gender gap in young adult living arrangements cuts across racial and ethnic groups. Among whites, blacks, Hispanics, Asians and American Indians, men have consistently been more likely than women to live in their parents’ home in early adulthood. 12

Living with parents is at a record high for some young adult populations

A record share of black, Hispanic and American Indian young adults live with a parent

The share of young adults living with their parents peaked for the group as a whole in 1940 at 35%. However, for some demographic groups, including those whose distinct measurement began later, it is 2014 that represented a high-water mark in this type of living arrangement.

Along racial lines the Census Bureau has collected reasonably consistent information on racial identity since 1880. A record high 36% of black 18- to 34-year-olds lived in the home of their parent(s) in 2014. In 2014 about 35% of American Indian young adults lived at home. This was a slight decline from the record high of 38% of these young adults living with their parent(s) in 2012.

The Census Bureau did not begin to uniformly collect information on Hispanic origin until 1980. The share of Hispanic young adults living with their parent(s) in 2014 (36%) was the highest in recorded history.

Among young adults without a high school diploma, the share living at home in 2014 was 40% – another record high since the Census Bureau began collecting data on educational attainment in 1940.

Since 1990 the general pattern has been that better-educated young adults are less likely to live with their parent(s). Young adults with at least a bachelor’s degree have consistently been the educational group least likely to do so.

Geographically, throughout much of the southern and Pacific United States, the share of younger adults living with a parent reached record high levels in 2014. On the basis of the nine Census Bureau geographic divisions, young adults in the South Atlantic, West South Central and Pacific states are living with their parent(s) at historically unprecedented levels. 13 The states in the East South Central region were the exception to the general pattern of Southern states having record levels of young adults living with their parent(s).

In the South Atlantic, West South Central, and Pacific states a record share of young adults live with a parent

3. Shifting roles, responsibilities and relationships

The census data point to a slowly developing but large shift in the roles, responsibilities and focuses of young adults that has led to significant changes in living arrangements. Many groups of young adults have already crossed a tipping point in which they are less likely to be pursuing committed relationships than to be living in the home of their parent(s).

For example, young men are now more likely to be living with mom and/or dad (35%) than to be living with a spouse or partner in their own household (28%). The year that the young adult males “crossed over” was 2009.

Young women have not reached the tipping point yet. In 2014, 35% of young women were living with a spouse or unmarried partner while 29% lived in the home of their parent(s).

Trends in living arrangements for specific groups of young adults indicate that the crossover is being driven by the experiences of more economically disadvantaged young adults, specifically, less-educated young adults and some racial and ethnic minorities.

By 1980 it was already apparent that black young adults were more likely to live at home (30%) than to be living with a spouse or an unmarried partner in their own residence (29%). The crossover point for American Indian young adults occurred in 2007. Hispanic young adults reached the tipping point in 2011 and by 2014 36% lived at home and 30% lived with a spouse or unmarried partner in their own household. As of 2014, white and Asian young adults remain more likely to be married or cohabiting than living with their parent.

Since 1940, year when young adult demographic was more likely to live in parent(s)’ home than with spouse or partner

Looking at educational attainment, young adults with at least a bachelor’s degree remain the only group more likely to be married or cohabiting than to be living at home. By 2006 it was already the case that young adults who had not completed high school were more likely to live at home than with a partner. Young adults who finished their education at high school were more likely to live in the home of their parent(s) than with a partner in their own household as of 2008. Young adults with “some college,” but not a bachelor’s degree, crossed over in 2010.

The movement away from living with a spouse or significant other reflects more than simply the well-documented retreat from marriage. 14 It partly reflects the large increase in parental living arrangements that has occurred among young adults since 1960. It also reflects the fact that, in terms of prevalence, cohabitation has not become a substitute for marriage. Young adults are not simply less likely to be married; they are forgoing partners altogether, whether spouses or cohabiting partners. In 1960 more than 60% of young adults were married or cohabiting and residing in their own household. In 2014, only 32% of young adults were living with a spouse or partner. 15

The changing composition of young adults and its impact on the ‘living at home’ phenomenon

Since 1960 there have been significant changes in the demographic characteristics of young adults. Young adults are less white, better-educated and less likely to be married.

In general, non-Hispanic white young adults have traditionally been less likely than their black and Hispanic counterparts to live in their parental home. But the growing share of non-whites in the young adult population does not explain the increased prevalence of living at home. The share of white young adults living with their parent(s) increased from 19% in 1960 to 30% in 2014, nearly as sizable an increase as for all young adults. Even in the absence of the racial and ethnic diversification that has occurred, a much greater share of young adults would now be living with mom and/or dad.

Young adults today are slightly younger than young adults in 1960, in that a smaller share of them are in the 30- to 34-year-old age group. But this shift in age composition has only a very modest impact on the trend in living with parents.

Better-educated young adults are less likely to live with their parents, so the improvements in educational attainment tend to decrease living at home.

Declining marriage certainly plays a role and, in some interpretations, can account for the entire increase in living with parents since 1960. Consistently since 1880 the vast majority of married young adults have not lived with their parents; typically 5% or less have done so. Single young adults are many times more likely to live with mom and/or dad. So the shift away from marriage can account for the entire increase in living with parents since 1960.

This does not imply, however, that the shift away from marriage has “caused” the increase in living with parents, because other social and economic factors may have reduced the attractiveness of marriage for young adults and, at the same time, made living independently of parents more difficult.

4. The job market and young adult living arrangements

This section examines the labor market fortunes of young adult men and women and the role the job market may play in understanding the trends in living with parents.

Among young men, those with jobs have been less likely to live with their parent(s)

The decennial census has consistently inquired about employment status since 1930, and for 18- to 34-year-old men there is a clear-cut pattern between their labor market fortunes and their likelihood of living at home. Employed young men are much less likely to live at home than young men without jobs.

Wages and salaries provide a more fine-grained measure of labor market success. The decennial census has collected wage and salary information since 1940 and, again, consistently for young men wages are negatively associated with living in the home of their parent(s). 16 The more a young man earns the less likely he is to live at home. 17

For male 18- to 34-year-olds, wages peaked around 1970 and the share living with parent(s) started its ascent

The decades immediately after World War II have been described as the “golden age of wage labor for young men.” The share of young men with jobs peaked around the 1960 Census. The median yearly wages of young men rose steadily from 1940 ($6,600) until 1970 ($27,300). This enabled young men to marry earlier in life, stoked a marriage boom 18 and resulted in record low rates of young men living with their parents.

The fortunes of young men in the U.S. labor market have been trending downward since the 1960s. 19 In the wake of the Great Recession, only 67% of 18- to 34-year-old men were employed in 2011, a shadow of the 84% employed in 1960. The typical wages of young men were about $15,000 in 2014. The fall in young men’s employment and earnings since 1970 has likely made living independently more difficult for them, which in turn helps account for the rise in the share of young adults living with their parent(s).

Until recently young women with jobs have been more likely to live with their parent(s)

When it comes to young women, trends in the labor market do not provide a ready explanation for the increase in living at home.

Until recently, employed young women were more likely than those who were not employed to live with their parent(s). This partly reflects the strong ties between marriage and employment status among young women during much of the 1900s. Married young women did not live in the home of their parent(s) and they were often barred or strongly discouraged from paid employment. 20 Even so, looking at the relationship between employment and living with parents among unmarried young women does not show a strong link between holding a job and living arrangements.

In addition, unlike young men, young women are doing significantly better in the labor market since 1960. Their employment has steadily risen from 1930 (32% employed) until the Great Recession (67% in 2008). Median wage and salary income rose from $0 in 1940 to a peak of $13,800 in 2000. 21

So the period since 1960 has been a period of rising paid employment and wages for young women, while a greater share of them are living at home.

Acknowledgments

The author thanks Dr. Steve Ruggles of the University of Minnesota for guidance on the historical comparability of household relationship information in the decennial censuses.

This report is a collaborative effort based on the contributions and analysis of the following individuals:

Richard Fry, Senior Economist Kim Parker, Director, Social Trends Research Claudia Deane, Vice President of Research Renee Stepler, Research Assistant Eileen Patten, Research Analyst Michael Keegan, Information Graphics Designer Marcia Kramer, Kramer Editing Services

Find related reports online at www.pewresearch.org/pewresearch-org/social-trends.

Methodology

The analysis is based on the 1880 to 2000 decennial censuses and the 2006 to 2014 American Community Survey (ACS). The Census Bureau began collecting the ACS in 2001 and in 2006 expanded its coverage to the entire residential population, thus making it comparable to the earlier censuses. The ACS was designed to collect detailed information matching that obtained in the long-form decennial census questionnaire (which was last collected in the 2000 Census). The decennial census and ACS microdata files developed by the University of Minnesota population center, or IPUMS files, were utilized. Documentation on the IPUMS version of the microdata files is at https://usa.ipums.org/usa/.

The ACS has three advantages over other data sources on the living arrangements of young adults. College students living in dormitories are classified as residing in group quarters and thus not considered to be residing in the home of their parent(s). The ACS does not overestimate the share of young adults living at home due to dormitory living.

18- to 34-Year-Olds Analyzed

Young adult living arrangements are based on the young adult’s relationship to the head of the household. The decennial census and ACS have collected information on the respondent’s relationship to the head in consistent fashion since the 1880 Census. Some of the detailed relationships to the head were not identified in early censuses, but the child of the head has always been identified. The share of young adults living in the home of their parent can be estimated consistently since 1880.

The sample census files made available to the public are large samples. At minimum the file is a 1% sample of the nation’s young adults. The smallest sample is the 1910 Census sample, a 1% sample file of the population. In spite of the total population being much smaller in 1910, the 1910 file has about 280,000 18- to 34-year-old unweighted respondents. The unweighted number of young adults analyzed is in the table to the right.

Young adults “living with a parent” are those who are the child of the head of the household.

In this report the four living arrangements are mutually exclusive. Young adults who are the child of the household head are assigned to the living with parent(s) category whether or not they have a partner. If they are married but living in the home of their parent(s), they are classified as living with parents. Young adults with a spouse or partner who establish their own household constitute the married/cohabiting head or partner category. Some married young adults reside in the home of a family member other than a parent (perhaps a sibling or aunt/uncle) or an unrelated person. In this instance both spouses are in the “other arrangements” category.

The census has consistently inquired as to marital status since 1880.

Information on cohabiting relationships is available only since 1990. Furthermore, the census and ACS do not capture all cohabiting relationships. Beginning with the 1990 Census, the responses on the relationship to the head of the household question distinguished unmarried partners from “housemate or roommate.” Only cohabiting relationships in which one of the partners is the head of the household can be identified. 22 The share of young adults who are married or cohabiting will be underestimated before 1990 because cohabiting relationships cannot easily be identified before 1990. The size of the underestimation before 1990 is uncertain because the prevalence of cohabitation before 1990 is not known. 23

The racial and ethnic categories reported are not consistent over time due to changes in the collection of racial and ethnic information since 1880. For example, information on Hispanic identity or origin was not collected from all respondents until 1980. Until 1910 the responses on the race question pertaining to Asian identity included only Chinese and Japanese. This report’s racial and ethnic categories used the IPUMS variable RACE and thus there is a break in the racial categories at 2000 due to the introduction of multiple race identification in the 2000 Census and ACS. 24

Appendix A: References

Autor, David and Melanie Wasserman. 2013. Wayward Sons: The Emerging Gender Gap in Labor Markets and Education. Third Way. March. http://economics.mit.edu/files/8754

Bailey, Martha J., Melanie E. Guldi, and Brad J. Hershbein. 2013. “Is There a Case for a ‘Second Demographic Transition’? Three Distinctive Features of the Post-1960 U.S. Fertility Decline.” Cambridge, MA: National Bureau of Economic Research, October. http://www.nber.org/papers/w19599.pdf

Bitler, Marianne and Hilary Hoynes. 2015. “Living Arrangements, Doubling Up, and the Great Recession: Was This Time Different?” American Economic Review 105(5): 166-70.

Cherlin, Andrew J. 2009. The Marriage-Go-Round: The State of Marriage and the Family in America Today. New York, NY: Vintage Books.

Fitch, Catherine, Ron Goeken, and Steven Ruggles, 2005. “The Rise of Cohabitation in the United States: New Historical Estimates.” Paper prepared for the 2005 Population Association of America meeting, March. http://www.hist.umn.edu/~ruggles/cohab-revised2.pdf

Fry, Richard. 2015. “More Millennials Living With Family Despite Improved Job Market.” Washington, D.C.: Pew Research Center, July. https://alpha.pewresearch.org/pewresearch-org/social-trends/2015/07/29/more-millennials-living-with-family-despite-improved-job-market/

Goldin, Claudia. 1988. “Marriage Bars: Discrimination Against Married Women Workers, the 1920s to 1950s.” Cambridge, MA: National Bureau of Economic Research, October. http://www.nber.org/papers/w2747

Hill, Carolyn J. and Harry J. Holzer. 2007. “Labor Market Experiences and the Transition to Adulthood,” in The Price of Independence: The Economics of Early Adulthood, Sheldon Danziger and Cecilia Rouse, eds. New York: Russell Sage Foundation. http://transitions.s410.sureserver.com/wp-content/uploads/2011/08/Hill-Holzer-05-01-06.pdf

Livingston, Gretchen. 2014. “Tying the knot again? Chances are, there’s a bigger age gap than the first time around.” Washington, D.C.: Pew Research Center, December. https://alpha.pewresearch.org/pewresearch-org/short-reads/2014/12/04/tying-the-knot-again-chances-are-theres-a-bigger-age-gap-than-the-first-time-around/

Lundberg, Shelly and Robert A. Pollak. 2015. “The Evolving Role of Marriage: 1950-2010.” The Future of Children 25(2): 29-50. http://www.futureofchildren.org/futureofchildren/publications/docs/EvolvingRole.pdf

Pew Research Center. 2013. “On Pay Gap, Millennial Women Near Parity—For Now.” Washington D.C., December. https://alpha.pewresearch.org/pewresearch-org/social-trends/2013/12/11/on-pay-gap-millennial-women-near-parity-for-now/

Pew Research Center. 2014. “The Rising Cost of Not Going to College.” Washington, D.C., February. https://alpha.pewresearch.org/pewresearch-org/social-trends/2014/02/11/the-rising-cost-of-not-going-to-college/

Pew Research Center. 2015. “Multiracial in America: Proud, diverse and growing in numbers.” Washington D.C., June. https://alpha.pewresearch.org/pewresearch-org/wp-content/uploads/sites/3/2015/06/2015-06-11_multiracial-in-america_final-updated.pdf

Payne, Krista K. 2012. “Young Adults in the Parental Home, 1940-2010.” National Center for Family and Marriage Research, Family Profile FP-12-22. http://www.bgsu.edu/content/dam/BGSU/college-of-arts-and-sciences/NCFMR/documents/FP/FP-12-22.pdf

Ruggles, Steven. 2015. “Patriarchy, Power, and Pay: The Transformation of American Families, 1800–2015.” University of Minnesota Population Center Working Paper No. 2015-2. September. http://www.pop.umn.edu/sites/www.pop.umn.edu/files/2.WorkingPaper15_2.pdf

[Machine-readable database]

Stevenson, Betsey, and Justin Wolfers. 2007. “Marriage and Divorce: Changes and their Driving Forces.” Journal of Economic Perspectives 21(2): 27-52. http://pubs.aeaweb.org/doi/pdfplus/10.1257/jep.21.2.27

Taylor, Paul. 2014. The Next America. New York, NY: Public Affairs. https://alpha.pewresearch.org/pewresearch-org/the-next-america-book/

Wang, Wendy and Kim Parker. 2014. “Record Share of Americans Have Never Married: As Values, Economics and Gender Patterns Change.” Washington, D.C.: Pew Research Center, September. https://alpha.pewresearch.org/pewresearch-org/social-trends/2014/09/24/record-share-of-americans-have-never-married/