Pew Research Center

FOR RELEASE FEBRUARY 11, 2014

The Rising Cost of Not Going to College

For those who question the value of college in this era of soaring student debt and high unemployment, the attitudes and experiences of today’s young adults—members of the so-called Millennial generation—provide a compelling answer.

FOR MEDIA OR OTHER INQUIRIES:

Communications Department
202.419.4372
www.pewresearch.org

RECOMMENDED CITATION

Pew Research Center, February 2014, "The Rising Cost of Not Going to College"

About Pew Research Center

Pew Research Center is a nonpartisan, nonadvocacy fact tank that informs the public about the issues, attitudes and trends shaping the world. It does not take policy positions. The Center conducts public opinion polling, demographic research, computational social science research and other data-driven research. It studies politics and policy; news habits and media; the internet and technology; religion; race and ethnicity; international affairs; social, demographic and economic trends; science; research methodology and data science; and immigration and migration. Pew Research Center is a subsidiary of The Pew Charitable Trusts, its primary funder.

© Pew Research Center 2026

Table of contents

  • About Pew Research Center
  • The Rising Cost of Not Going to College
  • Chapter 1: Education and Economic Outcomes Among the Young
  • Chapter 2: Public Views on the Value of Education
  • Appendix A: Additional Charts on the Labor Market
  • Appendix B: Data Sources
  • Appendix C: Young Adult Living Arrangements and Household Incomes
  • References

The Rising Cost of Not Going to College

For those who question the value of college in this era of soaring student debt and high unemployment, the attitudes and experiences of today’s young adults—members of the so-called Millennial generation—provide a compelling answer.

For those who question the value of college in this era of soaring student debt and high unemployment, the attitudes and experiences of today’s young adults—members of the so-called Millennial generation—provide a compelling answer. On virtually every measure of economic well-being and career attainment—from personal earnings to job satisfaction to the share employed full time—young college graduates are outperforming their peers with less education. And when today’s young adults are compared with previous generations, the disparity in economic outcomes between college graduates and those with a high school diploma or less formal schooling has never been greater in the modern era.

These assessments are based on findings from a new nationally representative Pew Research Center survey of 2,002 adults supplemented by a Pew Research analysis of economic data from the U.S. Census Bureau.

The economic analysis finds that Millennial college graduates ages 25 to 321 who are working full time earn more annually—about $17,500 more—than employed young adults holding only a high school diploma. The pay gap was significantly smaller in previous generations.2 College-educated Millennials also are more likely to be employed full time than their less-educated counterparts (89% vs. 82%) and significantly less likely to be unemployed (3.8% vs. 12.2%).
Education and Views About Work

[them]

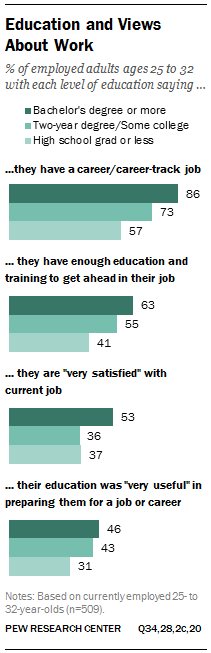
The survey also finds that among employed Millennials, college graduates are significantly more likely than those without any college experience to say that their education has been “very useful” in preparing them for work and a career (46% vs. 31%). And these better educated young adults are more likely to say they have the necessary education and training to advance in their careers (63% vs. 41%).

But do these benefits outweigh the financial burden imposed by four or more years of college? Among Millennials ages 25 to 32, the answer is clearly yes: About nine-in-ten with at least a bachelor’s degree say college has already paid off (72%) or will pay off in the future (17%). Even among the two-thirds of college-educated Millennials who borrowed money to pay for their schooling, about nine-in-ten (86%) say their degrees have been worth it or expect that they will be in the future.

Of course, the economic and career benefits of a college degree are not limited to Millennials. Overall, the survey and economic analysis consistently find that college graduates regardless of generation are doing better than those with less education.3
Rising Earnings Disparity Between Young Adults with And Without a College Degree

But the Pew Research study also finds that on some key measures, the largest and most striking disparities between college graduates and those with less education surface in the Millennial generation.

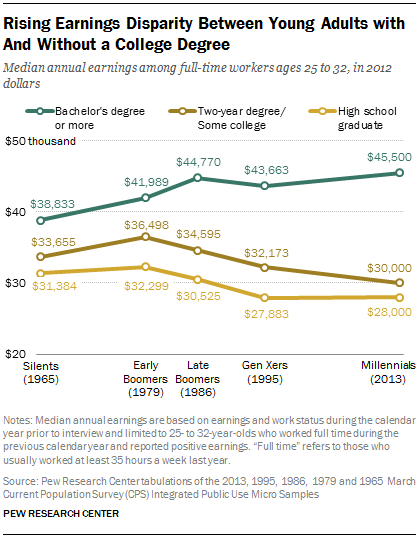
For example, in 1979 when the first wave of Baby Boomers were the same age that Millennials are today, the typical high school graduate earned about three-quarters (77%) of what a college graduate made. Today, Millennials with only a high school diploma earn 62% of what the typical college graduate earns.

To be sure, the Great Recession and the subsequent slow recovery hit the Millennial generation particularly hard.4 Neither college graduates nor those with less education were spared. On some key measures such as the percentage who are unemployed or the share living in poverty, this generation of college-educated adults is faring worse than Gen Xers, Baby Boomers or members of the Silent generation when they were in their mid-20s and early 30s.

But today’s high school graduates are doing even worse, both in comparison to their college-educated peers and when measured against other generations of high school graduates at a similar point in their lives.
Percentage of Generation in Poverty, by Educational Attainment

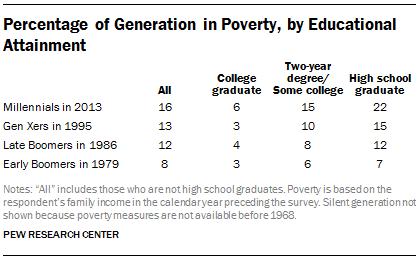
For example, among those ages 25 to 32, fully 22% with only a high school diploma are living in poverty, compared with 6% of today’s college-educated young adults. In contrast, only 7% of Baby Boomers who had only a high school diploma were in poverty in 1979 when they were in their late 20s and early 30s.
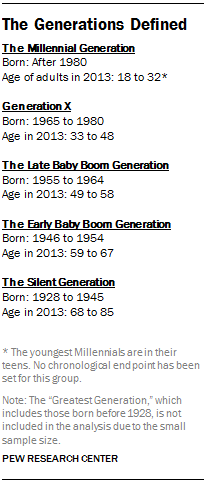
The Generations Defined

To examine the value of education in today’s job market, the Pew Research Center drew from two complementary data sources. The first is a nationally representative survey conducted Oct. 7-27, 2013, of 2,002 adults, including 630 Millennials ages 25-32, the age at which most of these young adults will have completed their formal education and started their working lives. This survey captured the views of today’s adults toward their education, their job and their experiences in the workforce.

To measure how the economic outcomes of older Millennials compare with those of other generations at a comparable age, the Pew Research demographic analysis drew from data collected in the government’s Current Population Survey. The CPS is a large-sample survey that has been conducted monthly by the U.S. Census Bureau for more than six decades.

Specifically, Pew analysts examined CPS data collected last year among 25- to 32-year-olds and then examined data among 25- to 32-year-olds in four earlier years: Silents in 1965 (ages 68 to 85 at the time of the Pew Research survey and Current Population Survey); the first or “early” wave of Baby Boomers in 1979 (ages 59 to 67 in 2013), the younger or “late” wave of Baby Boomers in 1986 (ages 49 to 58 in 2013) and Gen Xers in 1995 (ages 33 to 48 in 2013).

The Rise of the College Graduate
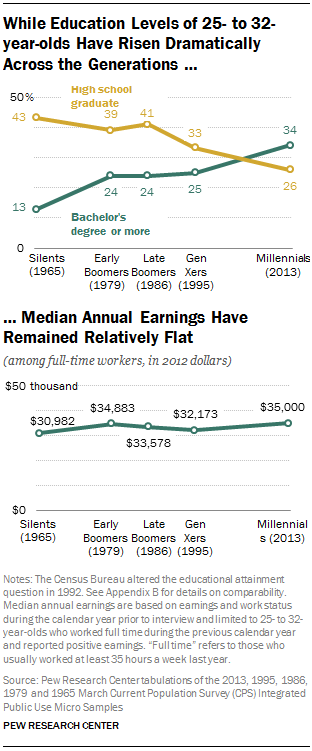
While Education Levels of 25- to 32-year-olds Have Risen Dramatically Across the Generations …

Today’s Millennials are the best-educated generation in history; fully a third (34%) have at least a bachelor’s degree. In contrast, only 13% of 25- to 32-year-olds in 1965—the Silent generation—had a college degree, a proportion that increased to 24% in the late 1970s and 1980s when Boomers were young adults. In contrast, the proportion with a high school diploma has declined from 43% in 1965 to barely a quarter (26%) today.

At the same time the share of college graduates has grown, the value of their degrees has increased. Between 1965 and last year, the median annual earnings of 25- to 32-year-olds with a college degree grew from $38,833 to $45,500 in 2012 dollars, nearly a $7,000 increase.

Taken together, these two facts—the growing economic return to a college degree and the larger share of college graduates in the Millennial generation—might suggest that the Millennial generation should be earning more than earlier generations of young adults.

But they’re not. The overall median earnings of today’s Millennials ($35,000) aren’t much different than the earnings of early Boomers ($34,883) or Gen Xers ($32,173) and only somewhat higher than Silents ($30,982) at comparable ages.

The Declining Value of a High School Diploma
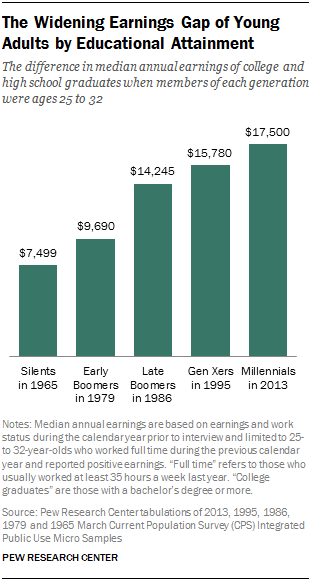
The Widening Earnings Gap of Young Adults by Educational Attainment

The explanation for this puzzling finding lies in another major economic trend reshaping the economic landscape: The dramatic decline in the value of a high school education. While earnings of those with a college degree rose, the typical high school graduate’s earnings fell by more than $3,000, from $31,384 in 1965 to $28,000 in 2013. This decline, the Pew Research analysis found, has been large enough to nearly offset the gains of college graduates.

The steadily widening earnings gap by educational attainment is further highlighted when the analysis shifts to track the difference over time in median earnings of college graduates versus those with a high school diploma.

In 1965, young college graduates earned $7,499 more than those with a high school diploma. But the earnings gap by educational attainment has steadily widened since then, and today it has more than doubled to $17,500 among Millennials ages 25 to 32.

Other Labor Market Outcomes

To be sure, the Great Recession and painfully slow recovery have taken their toll on the Millennial generation, including the college-educated.

Young college graduates are having more difficulty landing work than earlier cohorts. They are more likely to be unemployed and have to search longer for a job than earlier generations of young adults.

But the picture is consistently bleaker for less-educated workers: On a range of measures, they not only fare worse than the college-educated, but they are doing worse than earlier generations at a similar age.

For example, the unemployment rate for Millennials with a college degree is more than double the rate for college-educated Silents in 1965 (3.8% vs. 1.4%). But the unemployment rate for Millennials with only a high school diploma is even higher: 12.2%, or more than 8 percentage points more than for college graduates and almost triple the unemployment rate of Silents with a high school diploma in 1965.

The same pattern resurfaces when the measure shifts to the length of time the typical job seeker spends looking for work. In 2013 the average unemployed college-educated Millennial had been looking for work for 27 weeks—more than double the time it took an unemployed college-educated 25- to 32-year-old in 1979 to get a job (12 weeks). Again, today’s young high school graduates fare worse on this measure than the college-educated or their peers in earlier generations. According to the analysis, Millennial high school graduates spend, on average, four weeks longer looking for work than college graduates (31 weeks vs. 27 weeks) and more than twice as long as similarly educated early Boomers did in 1979 (12 weeks).

Similarly, in terms of hours worked, likelihood of full-time employment and overall wealth, today’s young college graduates fare worse than their peers in earlier generations. But again, Millennials without a college degree fare worse, not only in comparison to their college-educated contemporaries but also when compared with similarly educated young adults in earlier generations.

The Value of a College Major

As the previous sections show, having a college degree is helpful in today’s job market. But depending on their major field of study, some are more relevant on the job than others, the Pew Research survey finds.

To measure the value of their college studies, all college graduates were asked their major or, if they held a graduate or professional degree, their field of study. Overall, 37% say they were social science, liberal arts or education majors, a third (33%) say they studied a branch of science or engineering and a quarter (26%) majored in business. The remainder said they were studying or training for a vocational occupation.
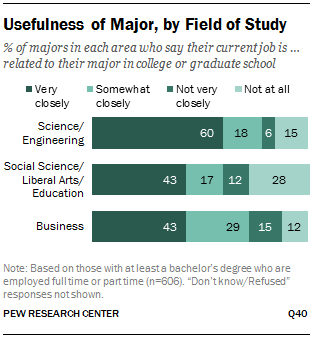
Usefulness of Major, by Field of Study

Overall, those who studied science or engineering are the most likely to say that their current job is “very closely” related to their college or graduate field of study (60% vs. 43% for both social science, liberal arts or education majors and business majors).

At the same time, those who majored in science or engineering are less likely than social science, liberal arts or education majors to say in response to another survey question that they should have chosen a different major as an undergraduate to better prepare them for the job they wanted.

According to the survey, only about a quarter of science and engineering majors regretted their decision (24%), compared with 33% of those whose degree is in social science, liberal arts or education. Some 28% of business majors say they would have been better prepared for the job they wanted if they had chosen a different major. (Overall, the survey found that 29% say they should have chosen a different major to better prepare them for their ideal job.)

Major Regrets
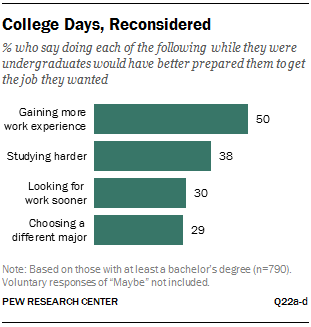
College Days, Reconsidered

In addition to selecting a different major, the Pew Research survey asked college graduates whether, while still in school, they could have better prepared for the type of job they wanted by gaining more work experience, studying harder or beginning their job search earlier.

About three-quarters of all college graduates say taking at least one of those four steps would have enhanced their chances to land their ideal job. Leading the should-have-done list: getting more work experience while still in school. Half say taking this step would have put them in a better position to get the kind of job they wanted. About four-in-ten (38%) regret not studying harder, while three-in-ten say they should have started looking for a job sooner (30%) or picked a different major (29%).

When analyzed together, the survey suggests that, among these items tested, only about a quarter (26%) of all college graduates have no regrets, while 21% say they should have done at least three or all four things differently while in college to enhance their chances for a job they wanted.

The survey also found that Millennials are more likely than Boomers to have multiple regrets about their college days. Three-in-ten (31%) of all Millennials and 17% of Boomers say they should have done three or all four things differently in order to prepare themselves for the job they wanted. Some 22% of Gen Xers say the same.

The remainder of this report is organized in the following way. The first chapter uses Census Bureau data to compare how Millennials ages 25 to 32 with varying levels of education are faring economically. It also examines how economic outcomes by level of education have changed over time by comparing the economic fortunes of Millennials with those of similarly educated Gen Xers, Baby Boomers and Silents at comparable ages.

The second chapter is based exclusively on data from a recent Pew Research Center survey. It examines how all adults assess the value of their education in preparing them for the workforce and specifically how these views differ by levels of education.

About the Data

Findings in this report are based mainly on data from: (1) The Current Population Survey and (2) A new Pew Research Center survey conducted in October 2013.

Data on Labor Market and Economic Outcomes: The labor market and economic data are derived from the Current Population Survey (CPS). Conducted jointly by the U.S. Census Bureau and the Bureau of Labor Statistics, the CPS is a monthly survey of approximately 55,000 households and is the source of the nation’s official statistics on unemployment. The CPS is nationally representative of the civilian noninstitutionalized population. This analysis uses the Annual Social and Economic Supplement collected in March of each year. The March CPS features an expanded sample size (about 75,000 households in 2013) and is the basis for the widely noted Census Bureau’s annual Income, Poverty, and Health Insurance Coverage estimates reported each fall (DeNavas-Walt, Proctor and Smith ,2013). The data analysis used the University of Minnesota Population Center’s integrated version of the March CPS (King, Ruggles, Alexander, Flood, Genadek, Schroeder, Trampe, and Vick ,2010).

Survey Data: The Pew Research survey was conducted October 7-27, 2013, with a nationally representative sample of 2,002 adults age 18 and older, including 982 adults ages 18 to 34. A total of 479 interviews were completed with respondents contacted by landline telephone and 1,523 with those contacted on their cellular phones. In order to increase the number of 25- to 34-year-old respondents in the sample, additional interviews were conducted with that cohort. Data are weighted to produce a final sample that is representative of the general population of adults in the United States. Survey interviews were conducted in English and Spanish under the direction of Princeton Survey Research Associates International. Margin of sampling error is plus or minus 2.7 percentage points for results based on the total sample at the 95% confidence level.

Chapter 1: Education and Economic Outcomes Among the Young

As college costs have increased in recent decades, so, too, have many of the economic rewards for getting a four-year degree as well as the penalties for not doing so, according to a new Pew Research Center analysis of U.S. Census Bureau data.

The analysis, which focuses on young adults in the first phase of their working lives, finds that the earnings gap by education level among 25- to 32-year-olds has widened significantly over the past half century. Those with a bachelor’s degree or higher are earning more in inflation-adjusted dollars than their similarly educated counterparts from prior generations did at the same age, while those with a high school diploma or some college are earning less.

As a result of these shifts, young adults today have more unequal earnings between education levels than their same-aged peers did in earlier times—mirroring the broader increase in income inequality that has become one of the defining features of American life. This Pew Research analysis focuses primarily on earnings, but it also tracks other key measures of economic well-being, including employment characteristics, unemployment rates, duration of unemployment, poverty, wealth, personal income and household income. With some minor variations, the overall story is the same across all of these measures: the gap in economic well-being by education level has grown over time.

The analysis produces a mixed picture, however, when it compares the overall economic well-being of all of today’s young adults with that of their same-aged counterparts in earlier times. While today’s young adults are doing better on some measures (earnings, adjusted median household income), they are doing worse on others (unemployment, poverty, wealth and median personal income).

This overall lack of economic progress from one generation of young adults to the next is notable in view of the fact that today’s young adults are the best-educated generation in history: Some 34% of 25- to 32-year-old Millennials have a bachelor’s degree or more, compared with 25% of Gen Xers, 24% of Baby Boomers and 13% of the Silent generation when they were the same age as today’s Millennials.

The remainder of this chapter provides a comprehensive examination of the labor market and economic outcomes associated with attainment of a bachelor’s degree among today’s Millennial adults. First it compares outcomes for Millennials who have at least a bachelor’s degree to those of Millennials with some college education (but not a bachelor’s degree) and Millennials with a high school diploma but no further formal education. It also compares the economic outcomes of today’s young adults with those of earlier generations when they were the same age that Millennials are now.

Definitions and Methods

Throughout the chapter, “young adults” refers to those ages 25 to 32 (inclusive). Unless noted, all figures refer to 25- to 32-year-olds.

Consistent with earlier Pew Research definitions, Millennials were born after 1980. Gen Xers were born from 1965 to 1980, Baby Boomers from 1946 to 1964 and Silents from 1928 to 1945.

Labor market and economic outcomes are examined in 2013, 1995, 1986, 1979 and 1965 (when available). Young adults in 2013 were Millennials. Most young adults in 1995 were Gen Xers. Young adults in 1986, 1979, and 1965 capture late Boomers, early Boomers and the Silents, respectively.

The 2013 data were collected in March of 2013 and (according to the official National Bureau of Economic Research business cycle dating) captures economic outcomes four years into the economic recovery. The Great Recession officially ended in June 2009.

The 1995, 1986, 1979 and 1965 time points are comparable to 2013 in that they also represent a point in time four years into an economic recovery. NBER designates bottoms of economic recessions occurring in March 1991, November 1982, March 1975, and February 1961, respectively.

Observing 25- to 32-year-olds in National Economic Context

Though the five time points examined mark years that were four years into an economic recovery, national macroeconomic conditions were not identical in the five years. Prominent macroeconomic indicators suggest that the aggregate economy was less vigorous in 2013 than the earlier comparison points.

Common wisdom also suggests 2013 marks a distinct period. After all, the Great Recession is coined the Great Recession.

Though aggregate economic conditions may be weaker in 2013 than earlier years, this does not necessarily imply that Millennials are worse off than earlier generations. That depends on how they are faring in the labor market and their particular circumstances, the subject of this chapter.

College Graduates in the Labor Market

Most young adults have few income sources beyond what they can earn on the job. And a basic motive for pursuing college is to enhance one’s skills and fortunes in the job market. This section focuses on what young workers are paid, the ease of finding work, and some characteristics of their jobs (such as pension coverage and unionization).

On the one hand, it is clear that young, college-educated workers are having more difficulty landing work compared with earlier cohorts of young adults. They are more likely to be unemployed, and it takes them longer, on average, to find a job. On the other hand, once they’re employed, their earnings are higher than those received by earlier cohorts of young, college-educated adults. For less-educated young workers, there is no upside: They are more likely to be unemployed and they are spending more time searching for a job compared with less-educated young workers who came before them. And their earnings are significantly below those received by less-educated young workers in earlier generations (with the exception of high school-educated Gen Xers).

Annual Earnings

Median Annual Earnings of 25- to 32-year-olds, by Educational Attainment

One dimension where Millennial college graduates are faring better than prior generations is in annual earnings. The Census Bureau collects detailed information on earnings and hours worked for the calendar year before the Current Population Survey is collected. Among Millennials who usually worked full time during 2012, the typical college graduate earned about $45,500. This is significantly higher than the earnings of Gen X college graduates in 1995 ($43,663, in 2012 dollars). The earnings of college-educated Millennials also tend to be above their late Boomer ($44,770), early Boomer ($41,989), and Silent generation ($38,883) counterparts.

Earnings for Millennials without a bachelor’s degree are significantly lower than for similarly educated young adults from previous generations. Earnings for young, full-time workers without a bachelor’s degree were at their highest level in the late 1970s. Among young adults in 1979, those with a high school diploma had median annual earnings of $32,299. By comparison, the average Millennial with only a high school education made $28,000 in 2012.

Share of 25- to 32-year-olds with at Least a Bachelor’s Degree

While the earnings of less-educated Millennials are sinking in comparison with earlier less-educated young adults, the earnings of all Millennials have remained relatively flat. In 2013, the earnings of all Millennials employed full time were about $35,000. That compares with about $34,900 for all early Boomers in 1979. Two factors are supporting the earnings of Millennials: College-educated Millennials tend to earn more than college-educated young adults used to, and there has been a compositional shift among this age group. More Millennials are college-educated than was the case for earlier cohorts.

These earnings figures utilize the median earnings of college graduates working full time in the prior year. The median refers to the amount earned by the full-time college graduate in the middle, or earning more than exactly half of full-time college graduates. Although the middle full-time college graduate might be earning more than prior generations, it is possible that earnings outcomes are now more variable and that more Millennials are experiencing low earnings compared to earlier generations. The table below compares the earnings level of the bottom one-fifth of college graduates to that of the median college graduate. The distribution is for all college graduates who had positive earnings, not just those working full time the prior year. At least at the 20th percentile, earnings do not appear to be more variable for Millennials than earlier generations. Some Millennial college graduates did earn low amounts during 2012, but no more so than earlier cohorts.

Annual Earnings Variability of Workers with at Least a Bachelor’s Degree

Unemployment

Unemployment Rate of 25- to 32-year-olds with at Least a Bachelor’s Degree

Today’s recent college graduates have had more difficulty finding employment than earlier generations. Among Millennial college graduates, 3.8% were unemployed in 2013.5 By comparison, only 2.5% of early Boomer college graduates were unable to find work in March 1979.

In 2013, better-educated Millennials experienced much lower unemployment rates than their less-educated peers (see chart in Appendix A). For example, 12.2% of Millennials with only a high school education were looking for work in 2013, 8 percentage points higher than the rate among college-educated Millennials.

College-educated young adults in each generation had less difficulty finding work than their less-educated counterparts. In 2013, college-educated Millennials were a third less likely to be unemployed than were Millennials with only a high school education. In 1995, 2.8% of college-educated Gen Xers were unemployed, compared with 6.9% of Gen Xers whose formal education did not go beyond high school. Similarly, back in 1979, college-educated early Baby Boomers were more than half as likely to be unemployed (2.5%) as those with only a high school education (6.1%).

Across generations, those with some college experience (but not a bachelor’s degree) have fared somewhat better than those with no college experience. In 2013, Millennials with a bachelor’s degree were about half as likely to be unemployed as Millennials with some college (3.8% vs. 8.1%). The unemployment differential between Gen Xers with some college (4.7%) and their peers who had finished college (2.8%) was a bit narrower in 1995. The unemployment differential was similar in 1979: 2.5% for early Boomer college graduates vs. 4.7% for early Boomers with some college.

Average Weeks of Unemployment of Unemployed 25- to 32-year-olds with at Least a Bachelor’s Degree

Weeks unemployed. The typical unemployed college-educated Millennial has spent much longer searching for work than earlier generations of college graduates. In 2013, the average unemployed college-educated Millennial had been looking for work for 27 weeks. By comparison, college-educated 25- to 32-year-olds who were unemployed in 1979 spent on average only 12 weeks looking for a job. And in 1995, unemployed Gen Xers with a bachelor’s degree spent on average 17 weeks looking.

Typical unemployed college-educated Millennials have not been looking for work as long as their less-educated counterparts (see chart in Appendix A). In 2013, unemployed Millennials without a college degree had been looking for work on average 31 weeks. And there is some evidence that the advantage that the college-educated have in regard to shorter unemployment length may have widened over time. In 1979 there was little difference in the average length of unemployment between college graduates and less-educated young adults.

Hours of Work

Likelihood of Full-time Employment among 25- to 32-year-olds, by Educational Attainment

Full-time employment. College-educated Millennials are no less likely than earlier generations of young adults to land full-time work. In 2013, 89% of employed college-educated Millennials worked full time (usually working at least 35 hours per week in the job they held in the week prior to the interview). This is only slightly below the share of young-adult college graduates who were employed full time in 1979 (90%).

Less-educated Millennials were significantly less likely than their college-educated peers to land full-time work in 2013. For example, only 82% of high school-educated Millennials with jobs worked full time.

The disparity in working full time between the more-educated and less-educated has widened over time. For example, among young adults in 1979, college graduates were only slightly more likely than those with a high school education to be working full time (90% vs. 87%). In 2013, the disparity between college graduates (89%) and those with a high school education (82%) had widened to 7 percentage points.

Average Hours Worked of 25- to 32-year-olds, by Educational Attainment

Average hours worked. The length of the average workweek has declined somewhat among college-educated young adults. In 2013, college-educated Millennials worked on average 41 hours per week. In 1965, college-educated young adults (members of the Silent generation) worked an average of 43 hours a week.

However, college-educated Millennials tend to have longer workweeks than their less-educated counterparts. In 2013, the average Millennial with some college education worked 38 hours (compared with 41 for the average college graduate).

Job Characteristics

Though complete information is not available on the earlier cohorts of young adults, the Census Bureau has queried respondents on several employment dimensions.

Union coverage. Some 14% of college-educated Millennials were employed in a unionized workplace in 2013. Among Gen X college graduates in 1995, a similar share (13%) worked in unionized settings. An educational gap in union coverage is apparent among Millennials in 2013. Among Gen Xers in 1995, those with no formal education beyond high school were slightly more likely than college graduates to have a unionized employer. However, in 2013, Millennials with a high school education (6%) are substantially less likely than college-educated Millennials (14%) to be employed in a unionized setting.

Employment Characteristics of 25- to 32-year-olds

Retirement plan or pension coverage. Fewer college-educated Millennials worked for employers offering a pension or other retirement plan (other than Social Security, i.e., defined contribution plans) compared with earlier generations. In 2013, 61% of college-educated Millennials worked for an employer with a retirement plan. By comparison, 66% of college-educated late Baby Boomers had pension coverage in 1986; the share rose to 70% for college-educated Gen Xers in 1995. However, pension coverage has declined for all young adults, and the decline has been more pronounced among the less-educated than for the college-educated. For example, only 36% of high school-educated Millennials labored for an employer with a pension plan in 2013, a decline of 11 percentage points from the incidence of pension coverage among high school-educated late Baby Boomers in 1986 and a decline of 13 points from the high school-educated Gen Xers in 1995.

Monetary Terms

The analysis presents several monetary measures to assess young adult outcomes:

Earnings of full-time workers: the young adult’s pretax wage and salary income received during the previous calendar year. It does not include the value of fringe benefits. It is reported for employees who usually worked at least 35 hours a week during the prior calendar year.

Household income: the sum of the total income during the previous calendar year of all household members ages 15 and older. It includes wage and salary income, rents, dividends and interest income, as well as cash income transfers. The specific measure presented performs the common adjustment of adjusting for the number of persons in the household.

Personal income: the total income of the young adult during the previous calendar year. It includes wage and salary income, rents, dividends and interest income, as well as cash income transfers.

Household wealth: the value of the assets of all household members (in households headed by a young adult) minus the value of all liabilities of all household members (in households headed by a young adult).

All dollar figures are adjusted for inflation and expressed in 2012 dollars.

Hourly pay. In March 2013, one-third of college-educated Millennial workers were paid by the hour. By comparison, 30% of Gen X college graduates were paid by the hour in 1995, when they were a comparable age. Among young adults, those with some college or only a high school education were much more likely than their college-educated counterparts to be hourly workers, and the increased incidence of hourly pay among Millennial workers compared with Gen X workers was at least as great among the less-educated as among the college-educated.

The Broader Economic Arrangements of College Graduates

This section examines the larger economic context of young adults by education. These outcomes reflect more than just someone’s success in the labor market. Well-being reflects the young adult’s household arrangements and thus depends on the size of the person’s household, whether the person has a spouse or unmarried partner, as well as whether there are children present and parental decisions on how much to work.

The measures together present a mixed picture. Considering the outcomes in absolute fashion, college-educated young adults today are faring better than earlier generations on some measures, and worse on others. But consistently, the gaps in outcomes between the college-educated and their less-educated counterparts have grown. Since the 1970s, education increasingly tends to demarcate the more economically successful from the less economically successful.

Household Income

Median Adjusted Household Income of Households Headed by 25- to 32-year-olds with at Least a Bachelor’s Degree

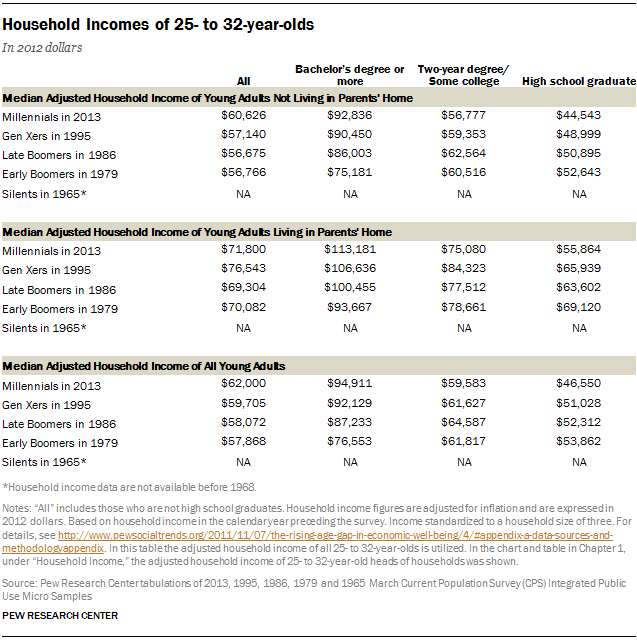
The incomes of households headed by college-educated 25- to 32-year-olds have markedly increased since the 1970s. The median (size-adjusted) income of households headed by a college-educated Millennial was $89,079 in 2013.6 By contrast, the median income of households headed by a college-educated young adult in 1979 was only $71,916.7

At least three factors likely contribute to the rising household incomes of the young and college-educated. First, as shown in the last section, the earnings of college graduates have been increasing, and that directly contributes to rising household income. Second, as young adults increasingly delay marriage and childbearing, it follows that college-educated households headed by Millennials likely have fewer children than college-educated households in earlier generations. Since size-adjusted household income takes account of household size, Millennials’ smaller households will be reflected in a boost to this measure of household income. Third, with fewer children in the household, less time can be devoted by the parent(s) to child care and more time can be devoted to market work, again indirectly boosting household income.8

Economic Well-being of 25- to 32-year-olds

The household incomes of young adults with less education tend to be substantially lower than their college-educated counterparts, and they have been falling since the 1980s. For example, the median income of households headed by a Millennial with a high school education was $39,842 in 2013, about $50,000 below that of college-educated counterparts ($89,079). And the gap in the typical household income of young household heads with and without a college degree has increased substantially over time. In 1979, college-educated young adults had household incomes about $22,000 above those of households headed by young adults with only a high school education. That gap has widened to $50,000 among Millennials.

For details on median personal income, see Appendix C.

Poverty and Wealth

Though household income figures indicate that the typical college-educated Millennial household is better off than in previous generations, poverty figures indicate that a segment of the college-educated are faring worse. In 2013, 6% of college-educated 25- to 32-year-olds were living in poverty, double the poverty rate of college-educated young adults in 1979 (3%).9

Poverty has been on the rise among all young adults, and the increase has been greatest among lesser educated 25- to 32-year-olds. Poverty has tripled among 25- to 32-year-olds with only a high school education. In 1979, 7% of young adults with only a high school education were living below the poverty line. Among high school-educated Millennials in 2013, fully 22% were poor.

Median Net Worth of Households Headed by 25- to 32-year-olds

Another common measure of economic well-being is wealth or net worth. Income and poverty are based on the resources obtained by the household over the prior calendar year. Wealth is the household’s nest egg or what it has been able to save out of income over the years. Wealth is what the household has or the value of what it owns (assets) minus what it owes (debts). Wealth is advantageous for a number of reasons, including that it is a storehouse of value that can be accessed during spells of unemployment and other adverse events.

The Census Bureau measures income and poverty every year, but it captures household wealth less regularly. In 2011, the wealth of the typical household headed by a 25- to 32-year-old with at least a bachelor’s degree was $26,058.10 In 1984, the median wealth of households headed by a 25- to 32-year-old with a bachelor’s degree was $29,521, so typical wealth levels have declined 12% for the young and college-educated. Declines in wealth have been even greater for less-educated households. In 2011, the median wealth level of households headed by a 25- to 32-year-old with a high school education was $3,137. This represents a 73% decline in the typical wealth of similar households in 1984 ($11,455).

Living Arrangements

Living Arrangements of 25- to 32-year-olds

Are Millennials earning enough to live independently? The answer depends on which Millennials you focus on. For young adults without a bachelor’s degree, the passage to financial independence may be taking longer. But college graduates are not substantially delaying their departure from the parental nest, a reflection in part of their superior fortunes in the labor market.11

College-educated Millennials are much less likely to be married than their counterparts in earlier generations. In 1965, of college-educated young adults (members of the Silent generation), nearly eight-in-ten (78%) were married. In 2013, less than half of college-educated Millennials (45%) were married. The decline in marriage among 25- to 32-year-olds has been even greater among less-educated young adults. In 1965, 86% of high school-educated Silents were married. In 2013, only 40% of their Millennial counterparts were married.

The decline in marriage among the young and college-educated does not imply that college-educated Millennials are not forming their own households and living independently of their parents. Though college-educated Millennials may not have a spouse, many of them have unmarried partners.12

Some 12% of college-educated 25- to 32-year-old Millennials were living in a parent’s home in 2013. By comparison, 10% of college-educated young adults lived with their parent(s) in 1965. So the tendency to live at home has increased among the college-educated, but it seems to be a measured increase among young adults with at least a bachelor’s degree. By contrast, the likelihood of living at home has markedly increased among less-educated young adults. For example, 9% of Silents with a high school education lived at home in 1965. In 2013, 18% of high school-educated Millennials were living at home, twice the rate of Silents.

Chapter 2: Public Views on the Value of Education

For today’s young workers, the surest path to a good job and satisfying career runs through college. A recent survey by the Pew Research Center finds that college graduates outpace those with less education on virtually every measure of job satisfaction and career success.

Education and Work

While most workers say their education has been at least somewhat helpful on the job, fully 47% of college graduates13 ages 25 to 32 report that their schooling has been “very useful” in getting them ready for a job or career.

In contrast, only about a third (34%) of young adults with a high school education or less say their education has been as helpful to them, the survey found.

When it comes to their current jobs, about half (53%) of all employed college graduates in their mid-20s and early 30s say they are “very satisfied” at work. In contrast, only 37% of comparably aged Millennials with a high school diploma or less are as satisfied with their job, according to the Pew Research survey.

[them]

When they look ahead, about six-in-ten (63%) Millennial college graduates in their late 20s and early 30s are confident that they have enough training and education to get ahead in their current job or career. In contrast, about four-in-ten (41%) of comparably aged high school graduates feel they have enough education to advance on the job.

Even though the current Millennials ages 25 to 32 are better educated than the generations of young adults who preceded them,14 the survey found only one significant generational difference in the overall perceived value of their education in preparing them for a job and career—some 41% of Millennials ages 25 to 32, 45% of Gen Xers and 47% of Baby Boomers say their schooling was “very useful” in getting them ready to enter the labor force. A somewhat larger share of Silents than Millennials say their education prepared them very well (50% vs. 41%).

The Value of a College Degree

Most Graduates Say College Has Paid Off

Turning to college graduates, the survey finds that, regardless of their generation, adults with college degrees recognize the benefit of their undergraduate education.

About nine-in-ten adults with a bachelor’s degree or more education (91%) say that considering what they and their family paid for their undergraduate education, it has paid off for them or they expect  it will pay off in the future. The sentiment is shared by an even higher proportion (96%) of those with a graduate or professional diploma.

About seven-in-ten college graduates (69%) also say their undergraduate or graduate major is at least somewhat related to their current work. And few express serious regrets about their choice of college major: Only 29% say that selecting a different field of study would have better prepared them to get the kind of job they wanted.

But these views vary significantly by major, the survey found. A third (33%) of all liberal arts, social science and education majors say they should have selected another field of study to better prepare them for their ideal job. In contrast, only about a quarter (24%) of science and engineering majors express a similar regret.

As a group, those with a graduate or professional degree are the most likely to say their education was “very useful” in preparing them for the working world (69% vs. 47% for all respondents).

These highly educated adults also are more likely to be very satisfied with their current job (66% vs. 52% for all) or to say they have sufficient education and training to advance in their job or career (84% vs. 59%).

Turning to demographics, Millennial college graduates are significantly less likely than older generations to currently have a job “very closely” related to their major (36% for Millennials vs. 54% for older adults).15

Many alumni look back on their college days fondly—but also with regrets. When it comes to better preparing themselves for the labor force, half of all college graduates say gaining more work experience while they were undergraduates would have helped their chances to get the job they wanted. Men (55%) are more likely than women (45%) to say this. About four-in-ten (38%) say that studying harder also would have improved their employment prospects—a view shared by some 47% of men but only 31% of women college graduates. As a generation, Millennials have struggled to find work during and in the aftermath of the Great Recession16—one likely reason that they are more likely than older adults to say more work experience in college (65% vs. 45% for older graduates) and looking for work sooner (43% vs. 26%) would have enhanced their job prospects.

The remainder of this chapter explores of these findings in greater detail. The first section examines how those with different levels of education assess the value of their schooling in preparing them for a job and career. The next section examines whether college graduates believe their degrees were worth the money they or their families spent to send them to college. The final section explores the value of individual college degrees in the job market as well as reports what college graduates say they should have done while in school to better ready themselves for the working world.

Education and Work

College Graduates More Likely to Say Education Prepared Them for Work

The Pew Research Center survey confirms what generations of parents have told their children: To get a good job, get a good education. At the same time, the findings suggest that the definition of a good education has changed in recent decades, with the rewards of education disproportionately concentrated among better educated adults while those with less education are lagging far behind.

Overall about eight-in-ten adults say their education has been “very useful” (47%) or “somewhat useful” (34%) in preparing them for a job or career. Only 16% find that their education has done little or nothing to prepare them for work, the survey found.

But just beneath the overall numbers lies this striking pattern: As educational attainment increases, so do favorable judgments about the usefulness of their education in getting them ready for the labor force. In fact, these positive views rise in virtual stair-step fashion as education levels rise.

According to the survey, about seven-in-ten adults with a graduate or professional degree say their education  was very useful preparing them for work, about 15 percentage points higher than those who had completed a bachelor’s degree (69% vs. 55%).

The increase is nearly as large as you move up from the lower rungs of the education ladder. Some 40% of those with a high school education or less find their education very useful on the job, a proportion that increases to 49% among those with a two-year college degree.

Millennial Women More Likely than Men to See Education Useful

With one notable exception, few demographic differences exist on this question. Nearly half of all whites (45%), blacks (48%) and Hispanics (48%) say their education was “very useful” in preparing them for a job or career. Similar shares of Millennials (46%), Gen Xers (45%) and Baby Boomers (47%) agree.

At the same time, Millennial women are more likely than either Millennial men or older men to say their education was “very useful.” Among Millennials, only about four-in-ten men (39%) but 53% of women have found their education to be very beneficial in preparing them for the workforce. About half of older women (49%) and nearly as many non-Millennial men (45%) share this view.

Career and College

Better Educated More Likely to Be in a Career-track Job

College is the most direct route to a good job and career. The higher their level of education, the more likely an individual is to say that his or her current job is a career or a steppingstone toward a career, a relationship that also crosses generational boundaries.

[them]

But this profile shifts dramatically by levels of education. About eight-in-ten (79%) of those with graduate or professional degrees say their current job is their career. Some 56% of those with bachelor’s degrees and about an equal share (54%) of those with two-year college degrees also say they currently have a career-level position.

In contrast, only four-in-ten adults who have not graduated from college report that their current job is their career, and 15% say they are on the path to a career. The remaining 44% say their current job is just something to get them by, roughly ten times the proportion of those with a graduate degree who offer the same view.

Other Demographic Differences

Who Has a Career?

The education divide is not the only significant demographic difference separating those with a career and those who are not yet there. In fact, it’s not even the largest.

Large differences emerge when the focus shifts to race and ethnicity. Non-Hispanic whites (59%) are about twice as likely as blacks (29%) or Hispanics (22%) to say their current job is their career.

At the same time, Hispanics are about twice as likely as whites to say they their current job is just something to get them by (56% vs. 26%), a disparity that in part reflects educational differences between Hispanics and whites. For much the same reason, blacks also are significantly more likely than whites to be off the career path (44% vs. 26%).

More predictably, Gen Xers (58%) and Baby Boomers (59%) are significantly more likely to say they are in a career than Millennials (31%), who are just beginning their working lives. But a third of Millennials say they have their foot in the door: They are about twice as likely as Gen Xers (33% vs. 14%) and roughly five times as likely as Boomers (33% vs. 6%) to say their current job is a steppingstone to a career.

But when it comes to non-career jobs, similar shares of Millennials (36%) and Boomers (34%) say their current job is just something “to get me by.”

Labor economists know that income, education and employment type are closely associated. Better-educated individuals are more likely to occupy better paying jobs, which largely explains why survey respondents with annual family incomes of $100,000 or more are more than twice as likely as those making less than $50,000 to say they are in career jobs (77% vs. 31%).

At the same time, about half (49%) of those with family incomes below $50,000 say their work is just a job to get them by, a view held by only 10% of highest-earning adults.

Back to School

Most Don’t Intend to Go Back to School

The value of education on the job is clearly seen when adults younger than 65 and not in school are asked if they ever plan to resume their education. A quarter say they intend to return to school someday, and an additional 11% say they might.

According to the survey, those who have not obtained a bachelor’s degree are more likely than those who have at least a bachelor’s degree to have plans to return to school (28% vs. 18%). Yet even people who have a four-year degree under their belt are considering going back to school, with fully 21% of bachelor’s degree holders and 12% of post-graduate degree holders saying they will resume their education.

Social science, liberal arts and education majors are more likely than business majors to say they will return to school or “maybe” will go back (40% vs 23%). Some 28% of science and engineering majors say they are definitely or maybe planning to return to school.

The survey also found that blacks and Hispanics are twice as likely to say they plan to go back to school as whites. About four-in-ten (43% of blacks and 41% of Hispanics) say this, compared with 18% of whites—a relationship that holds up even accounting for different levels of education.

Minorities More Likely Than Whites to Say They Want to Return to School

For example, 42% of blacks with less than a bachelor’s degree and 41% of Hispanics with the same level of education intend to return to school, compared with 21% of whites with comparable education.

As might be expected, plans to return to school diminish with age. About half (54%) of 18- to 29-year-olds intend to return to school. This share falls to 28% among 30- to 49-year-olds and only 10% among 50- to 64-year-olds. The question was not asked of respondents ages 65 and older.

Household income also is modestly correlated with the intent to go back to school. People in families making less than $50,000 per year are the most likely to have plans to return (33% say they will). By contrast, 18% of those in families making between $50,000 and $99,999, and 14% of those making $100,000 or more say they plan to go back to school.

As might be expected, those who think they need more training or education to succeed in their career are more likely to plan to go back to school. About four-in-ten (41%) of those currently employed who say they need more training to get ahead in their job or career intend to go back to school, compared with only 14% of those who feel they already have the necessary education. A similar share (45%) of those not employed who say they need more training in order to get the kind of job they want intend to return to school, while only 17% who already have the education they need have plans to go back.

Is College Still Worth It?

Generations Agree: College Is Worth It

In spite of rising tuition rates at both public and private colleges, most college graduates agree that college has paid off.17 A significant majority (83%) of bachelor’s degree holders believe that they have already seen a return on what they and their family paid for their bachelor’s degree. An additional 8% say that it hasn’t paid off yet, but they believe it will in the future. Only 6% of graduates say that college has not paid off for them and that they do not expect it to in the future.

The generations agree that getting their college degree was worthwhile. But Gen Xers (84%) and Boomers (89%) are significantly more likely than Millennials (62%) to say they already have seen a payoff. By contrast, for the remainder of those who say their degree has not yet paid off, Millennials are more likely than older generations to think it will eventually be worth it (26% vs. 6% for Gen Xers and 3% for Boomers.)

College Graduates Who Earn More Say College Degree Was Worth It

Majorities of college graduates say their education paid off, regardless of their family income. But college graduates with family incomes of at least $50,000 per year are more likely than those earning less to feel that their degrees have already paid off (90% vs. 63%). Those in the top income tier, earning $100,000 or more, are the most likely to say this (98%).

The Value of College, by Education and College Type

The Pew Research Center poll shows that the higher the degree attained, the more graduates feel their undergraduate education has paid off. Among those with postgraduate degrees, almost all have no regrets (93% say their bachelor’s degree has paid off and 3% believe it will in the future).

Slightly fewer of those whose highest educational attainment is a bachelor’s degree  are as positive (89% say it’s paid off or think it will), and even fewer—but still a sizable majority—of those with two-year college degrees say the same (76%).

Despite the higher sticker price at most private colleges, graduates from public and private schools express similar satisfaction in value for their money. Some 84% of public college graduates and 81% of private college graduates say that their education has paid off, and an additional 9% of public college graduates and 7% of private college graduates say it will pay off in the future.

Student Loans

Borrowing for College … and Paying It Back

Half of college graduates took out loans to help finance their education. Perhaps reflecting the fact that college tuition has risen sharply over the decades, Millennials (66%) and Gen Xers (59%) are more likely than Boomers (43%) to have taken out loans to pay for their education. Among those who did take out loans, Gen Xers are much more likely (56%) to have finished paying them back than Millennials (18%). The sample size of Boomers who took out loans is too small for analysis.

College graduates at all income levels are about equally likely to have taken out loans. But those earning more are significantly more likely to have finished paying off their student debt, in part because they are older and have had more time to pay off their loans. About two-thirds (68%) of college graduates who took out loans and who have a family income of at least $75,000 have paid off their loans, compared with 42% of college graduates making less than $75,000.

Those who have completed at least a bachelor’s degree are the most likely to have taken out loans, compared with those who have a degree from a two-year college (50% vs. 37%).

College graduates who did not take out loans are more likely than those who did borrow money to say that their degree has paid off (91% of non-borrowers say this, compared with 79% of those who took out loans). Conversely, those who took out loans to help pay for college are more likely to say that their education will pay off in the future (10% vs. 3%). And those who borrowed less money are more likely to say that their education has already paid off (87% of those who took out less than $20,000 in loans say this, compared with 68% of those who took out more). The biggest contrast is among graduates who have paid off their loans compared with those who have not. Fully nine-in-ten (93%) of those who have already repaid all the money they borrowed say that their degree has paid off, compared with only 59% of those who are still in the process of paying them off.

Job Preparation

Regardless of Education, Few Workers Feel Underqualified for Job

Regardless of level of education, about half (52%) of people who are currently employed feel they have the right qualifications for the job. Most of the remainder (38%) feel overqualified for their current job, and only a few (9%) think they are underqualified.

But these views vary by demographic characteristics. For example, blacks are more likely (53%) than either Hispanics (39%) or whites (36%) to feel that they have more qualifications than their job requires. And Millennials are more likely than older generations to say the same (46% of Millennials, compared with 34% of older adults).

People in the upper half of the income scale feel more content with their qualifications than those in the lower half. More than half of those making at least $50,000 say they have about the right amount of qualifications for their job (61%), compared with 43% of those who make less than $50,000. Those making less than $50,000 are more likely to say they are overqualified than those making at least $50,000 (45% vs. 33%).

Education and Work

College degrees or at least some experience at college may help with other measures of job satisfaction. Those with at least some college experience are more likely to report being “very satisfied” in their current job than those with a high school diploma or less.

Those with a degree from a four-year college are more likely than those with less education to say their education was “very useful” in preparing them for a job or career. About six-in-ten (57%) bachelor’s and graduate degree holders say this, compared with 48% of those who completed a two-year degree or went to college but did not graduate and 36% of those with a high school diploma or less.

As might be expected, college graduates are much more likely to be in a job requiring a college degree—yet a notable number of those without diplomas also say they hold a job that requires a college degree. About two-thirds (68%) of those who have at least a bachelor’s degree say their job requires a college degree. Roughly one-third (31%) of two-year college graduates say the same. Yet fully 14% of those who say they attended some college but did not graduate and 6% of those who have a high school diploma or less say they work in a job that requires a college degree.

The Value of a College Major

About Half Say Current Job Is “Very Closely” Related to Field of Study

About seven-in-ten college graduates (69%) say their undergraduate or graduate field of study is at least somewhat related to their current work and only 29% say they should have selected a different undergraduate field of study to prepare them for their ideal job, according to the Pew Research survey.

But these views vary significantly by field of study and how far an individual went in school. By most measures tested in this survey, science and engineering majors are more likely than respondents with degrees in liberal arts, social science or education to say their education is a better fit with their current job and career goals. At the same time, those with graduate or professional degrees are more likely than other college graduates to say their job is closely related to their studies.

For example, only about a quarter (24%) of science and engineering majors say they should have selected another major to better prepare them for their ideal job. In contrast, a third (33%) of all liberal arts, social sciences and education majors express a similar view.

In a similar vein, social science, liberal arts and education majors are significantly more likely than science and engineering graduates to say they are overqualified for their job (42% vs. 28%).

Most Say Job Is Related to Major

Usefulness of Major, by Field of Study

The survey found that about seven-in-ten college graduates say their work is “very closely” (49%) or “somewhat closely” (20%) tied to their undergraduate or graduate degree.

Science and engineering majors and, to a lesser extent, those who majored in business are more likely than those who majored in the liberal arts, social science or education to say their current job is closely related to their college majors.

Usefulness of Major to Current Job, by Degree Type

Overall about eight-in-ten science and engineering majors (78%) say they have a job related to their field of study, including 60% who say it is “very closely” linked to their major. A similar share of business majors say that their job is related to their field of study (73%), but a smaller share of business majors than science and engineering majors say it is “very closely” related (43% vs. 60%). Only 59% of social science, liberal arts or education majors say their job is related to their degree, with 43% saying it is very closely related.

Millennials and their Majors

Usefulness of Major, by Generation

Compared with other generations, a larger share of Millennials are college graduates. At the same time, these young college graduates are significantly less likely than older graduates to say their current job is closely related to their field of study, in part because so many of these recent college graduates fill entry-level positions.

According to the survey, 36% of Millennials say their job is very closely related to their major. In contrast, about six-in-ten Gen Xers (59%) and 48% of Baby Boomers say they have a job that is very closely aligned with their major field of study.

At the same time, Millennials are more likely than Gen Xers or Baby Boomers to say their current job is somewhat closely related to their undergraduate or graduate majors (28% for Millennials vs. 18% for Gen Xers and 17% for Boomers). Altogether, the share of Millennials saying their job is “very” or “somewhat” related to their major is 64%, smaller than the share among Gen Xers (77%) but similar to the share of Boomers who say the same (65%).

Roughly a third of Millennials (35%) say their current job is either “not very closely” or “not at all” related to their majors. That’s the same as the overall share of Boomers (35%) but larger than the share of Gen Xers (22%) who express the same view.

Other Demographic Differences

Usefulness of Major, by Key Demographic Groups

Non-Hispanic whites and individuals with a graduate degree are more likely than minorities or those with a bachelor’s or two-year degree to say their major is very closely related to their current job.

According to the survey, about half 53% of all non-Hispanic whites report their major and their job are very closely related, but just 36% of blacks, Hispanics and other minorities say this. (The sizes of the black and Hispanics samples were too small to analyze separately.)

Respondents with a graduate or professional degree (68%) are more likely to say their current job matches very well with their degree than those with a bachelor’s degree (40%) or a two-year degree (37%).

At the same time, some 56% of those with family incomes of $100,000 or more say their current job is very closely connected to their major, compared with 33% of those earning less than $50,000.

Second Thoughts about their Major

College Majors, Reconsidered

Roughly three-in-ten college graduates (29%) say that selecting a different field of study as undergraduate students would have better prepared themselves for their ideal job.

In terms of preparing them for their desired job, liberal arts, social science and education majors are significantly more likely than those who majored in science and engineering to have second thoughts about their undergraduate field of study (33% vs. 24%).

Minority college graduates in particular say a different major would have better prepared them for the type of job they wanted. According to the survey, about four-in-ten non-whites (39%) say they would have enhanced their chances of getting a job they wanted if they had chosen a different major, compared with 26% of whites.

Similarly, those with family incomes of less than $50,000 are much more likely than those earning $100,000 or more to express some degree of regret with their majors (37% vs. 21%).

Looking Back

College Days, Reconsidered

In addition to selecting a different major, the Pew Research Center survey asked college graduates whether they could have better prepared for a job they wanted while still in school by gaining more work experience, studying harder or beginning their job search earlier.

About three-quarters of all college graduates (74%) say taking at least one of those four steps would have enhanced their chances to land their ideal job.

Looking Back, by Generation

Leading the should-have-done list: getting more work experience while still in school. Half say taking this step would have put them in a better position to get the kind of job they wanted. Roughly four-in-ten (38%) regret not studying harder, while three-in-ten say they should have started looking for work sooner (30%) or picked a different major (29%).

Taken together, the survey suggests that, among these items tested, only about a quarter (26%) of all college graduates have no regrets, while 21% say they should have done at least three or all four things to enhance their chances for their desired job.

Millennials See More Missed Opportunities

Millennials Most Likely to Say They Could Have Done Things Differently in College

Millennials are significantly more likely than Baby Boomers to express regrets on three of the four items tested and to express multiple regrets about their college experience, the survey found. (The sample of those in the Silent generation was too small to analyze.)

About two-thirds of all Millennials (65%) but 53% of Gen Xers and 44% of Baby Boomers say they should have gotten more work experience while in college. Millennials also are more likely than Boomers to say they would have improved their employment prospects if they had looked for work sooner (43% vs. 21% for Boomers). About a third (36%) of Gen Xers said this.

When it comes to majors, Millennials (36%) are more likely than Boomers (26%) to say their job prospects would have been enhanced if they had chosen another field of undergraduate study.

There were no significant differences among the generations in terms of those who say they should have studied harder.

Overall, Millennials are more likely to have multiple regrets about their college experience. Only 17% of Millennials say none of the four steps would have prepared them to get the job they wanted, while larger shares of Baby Boomers (32%) had no regrets. About two-in-ten Gen Xers (21%) say they have no regrets about their educational experience.

In contrast, three-in-ten (31%) of all Millennials but 17% of Boomers say they should have done three or all four things differently in order to prepare themselves for the job they wanted. Some 22% of Gen Xers say it would have been better if they did three or four things differently when they were undergraduates.

The Major Disconnect

Most Found They Preferred Other Types of Jobs, or Couldn’t Find Work in Field of Major

When college graduates who say their job is “not very closely related” or “not at all related” to their field of study in college or graduate school were asked why, no single reason dominated. About a quarter (26%) blame the bad economy or say they were unable to find work in their field. A similar share wanted a change or found that the work wasn’t for them (23%), while 16% say they are happy with their current job.

For others, life got in the way. About one-in-ten say they had children or other life circumstances interfered (9%), and 8% say their major was too general or it was useless, they lacked the experience or qualifications to find work in their field, or they chose a non-related job for financial reasons.

Appendix A: Additional Charts on the Labor Market

Average Weeks of Unemployment of Unemployed 25- to 32-year-olds, by Educational Attainment

Appendix B: Data Sources

Government Data

Most of the analysis in Chapter 1 is based on the Current Population Survey (CPS). The CPS is collected monthly by the U.S. Census Bureau for the Bureau of Labor Statistics. The survey is the basis for the widely reported monthly national unemployment rate. This report uses the CPS’s Annual Social and Economic Supplement (CPS ASEC), conducted in March of each year. The CPS sample size is expanded for the ASEC collection and in 2013 was based on interviews with about 75,000 households. The CPS is nationally representative of the civilian noninstitutionalized population. The integrated micro data files of the March CPS produced by the University of Minnesota were analyzed. Additional documentation on the March CPS IPUMS can be found at https://cps.ipums.org/cps/.

The unweighted number of 25- to 32-year-olds in each survey year are as follows:

Unweighted Numbers

The CPS has been collected since the 1940s, but there have been revisions in the information collected since its initiation. In 1992, the Census Bureau altered the educational attainment question. Prior to 1992, respondents were asked about the number of grades of school completed rather than their highest educational degree attained. So for surveys before 1992 (1986, 1979 and 1965) a “high school graduate” refers to those who completed 12th grade (regardless of whether they received a high school diploma); “some college” refers to those who reported completing one to three years of college, and respondents who completed at least four of years of college are considered to have at least a bachelor’s degree.

Most of a person’s characteristics refer to the individual’s characteristics at the time of the survey or March of the year. However, annual earnings, household income and poverty status are based on the respondent’s income characteristics in the calendar year prior to the survey.

The figures on the net worth of households in Chapter 1 were tabulated from the U.S. Census Bureau’s Survey of Income and Program Participation (SIPP). SIPP has consistently collected detailed data on household asset and liabilities since 1984. The Census Bureau has periodically published reports on the nation’s net worth in its P70 report series. For further details, see Gottschalk (2008).

Dollars figures in the report were converted to 2012 dollars using the research series of the consumer price index (CPI-U-RS).

Survey Methodology:

Results for the Pew Research Center survey are based on telephone interviews conducted October 7-27, 2013 among a national sample of 2,002 adults 18 years of age or older living in the United States (a total of 479 respondents were interviewed on a landline telephone, and 1,523 were interviewed on a cell phone, including 929 who had no landline telephone). The survey was conducted by interviewers at Princeton Data Source under the direction of Princeton Survey Research Associates International (PSRAI). Interviews were conducted in English and Spanish. A combination of landline and cell phone random digit dial (RDD) samples were used; both samples were provided by Survey Sampling International. The landline RDD sample was drawn using traditional list-assisted methods where telephone numbers were drawn with equal probabilities from all active blocks in the U.S. The cell sample was drawn through a systematic sampling from dedicated wireless 100-blocks and shared service 100-blocks with no directory-listed landline numbers.

In order to increase the number of 25 to 34 year-old respondents in the sample additional interviews were conducted with that cohort by screening RDD cell sample and by calling back 25 to 34 year-olds from recent PSRAI surveys.

Number of Interviews Conducted by Sample Segment

Both the landline and cell samples were released for interviewing in replicates, which are small random samples of each larger sample. Using replicates to control the release of telephone numbers ensures that the complete call procedures are followed for all numbers dialed. As many as 7 attempts were made to contact every sampled telephone number. The calls are staggered over times of day and days of the week (including at least one daytime call) to maximize the chances of making contact with a potential respondent. An effort is made to recontact most interview breakoffs and refusals to attempt to convert them to completed interviews.

Respondents in the landline sample were selected by randomly asking for the youngest adult male or female who is now at home. Interviews in the cell sample were conducted with the person who answered the phone, if that person was an adult 18 years of age or older. The additional interviews with 25- to 34-year-olds from the cell sample were administered an age screener; those who were in the target age range completed the interview. For the landline callback sample, interviewers asked to speak with the person based on age and gender who participated in an earlier survey. For the cellular callback sample, interviews were conducted with the person who answered the phone once it was confirmed that they were in the target age range.

Weighting is generally used in survey analysis to adjust for effects of sample design and to compensate for patterns of nonresponse that might bias results. The weighting was accomplished in multiple stages to account for the different sample frames as well as the oversampling of 25-34 year-olds. Weighting also balances sample demographic distributions to match known population parameters.

In the final stage of weighting, the combined sample was weighted using an iterative technique that matches gender, age, education, race, Hispanic origin, and region to parameters from the U.S. Census Bureau’s 2011 American Community Survey data. The population density parameter is county based and was derived from the Decennial Census. The sample also is weighted to match current patterns of telephone status and relative usage of landline and cell phones (for those with both), based on extrapolations from the July-December 2012 National Health Interview Survey.

The survey’s margin of error is the largest 95% confidence interval for any estimated proportion based on the total sample – the one around 50%. For example, the margin of error for the entire sample is plus or minus 2.7 percentage points. This means that in 95 out of every 100 samples drawn using the same methods, estimated proportions based on the entire sample will be no more than 2.7 percentage points away from their true values in the population. Sampling errors and statistical tests of significance take into account the effect of weighting. The following table shows the sample sizes and the error attributable to sampling that would be expected at the 95% level of confidence for different groups in the survey:

Margin of Error at 95% Confidence Level

In addition to sampling error, one should bear in mind that question wording and practical difficulties in conducting surveys can introduce error or bias into the findings of opinion polls.

Appendix C: Young Adult Living Arrangements and Household Incomes

The second section presented typical adjusted household incomes for households headed by young adults ages 25 to 32. Not all 25- to 32-year-olds reside in households headed by a 25- to 32 year-old, and the likelihood of living in such a household may have changed over time. Are the patterns evident among 25- to 32-year-old heads of households not representative of the household income patterns for all young adults? No, this appendix demonstrates that the patterns evident among 25- to 32-year-old heads of households are replicated when we consider the full population of young adults.

Rather than focusing on households headed by young adults, let’s examine the adjusted household incomes of all young adults. Following Bell, Burtless, Gornick, and Smeeding (2007), the most serious shift in living arrangements that might undermine the tabulations based on heads of households is that greater proportions of Millennials are living with mom and/or dad compared with earlier generations.18 Fewer Millennials are married, but that is largely offset by the fact that more Millennials have unmarried partners.

The Appendix Table below tabulates the median adjusted household incomes for the universe of young adults who are not residing with their parent(s) and those residing in the household of their parent(s). Not surprisingly, for any year-education cell the household incomes of 25- to 32-year-olds who reside in the home of their parent(s) tends to exceed the corresponding year-education group of young adults who reside independently of their parent(s).

Yes, there may have been some shifting around between marriage/cohabitation and between living with parents and living independently. The bottom panel of the table shows the adjusted household incomes of ALL 25- to 32-year-olds. Similar to the median-adjusted household income of 25- to 32-year-old heads of households, the household income of all young adults.

  • Exhibit a growing dispersion by the education of the young adult from early Boomers to Millennials.
  • The adjusted household income of all early Boomers in 1979 is not above the typical adjusted household income of all Millennials ages 25 to 32 in 2013.

Household Incomes of 25- to 32-year-olds

Rather than examining household incomes, the personal incomes of young adults can be examined. These are presented in the second panel of the table in Chapter 1, under “Household Income.” Personal incomes simply reflect the total income (including sources of income other than earnings) of the young adult. Personal incomes do not account for the income contributed by other members of the household. Nor do they account for any dependents the young adult may have. Conventional measures of economic well-being (for example, poverty) are household-based and recognize that economic gains can be realized from shared living arrangements (for example, two can rent an apartment cheaper than one) and that dependents may entail some economic costs.19

References

Aguiar, Mark, and Erik Hurst. 2007. “Measuring Trends in Leisure: The Allocation of Time Over Five Decades,” The Quarterly Journal of Economics, August, vol. 122, no. 3, pp. 969-1006.

Bell, Lisa, Gary Burtless, Janet Gornick, and Timothy M. Smeeding. 2007. “Failure to Launch: Cross-National Trends in the Transition to Economic Independence,” in The Price of Independence: The Economics of Early Adulthood, edited by Sheldon Danziger and Cecilia Rouse. New York: Russell Sage Foundation.

DeNavas-Walt, Carmen, Bernadette D. Proctor, and Jessica C. Smith. 2013. “Income, Poverty, and Health Insurance Coverage in the United States: 2012.” Current Population Reports, Consumer Income, P60-245. Washington, DC: U.S. Census Bureau, September

Fry, Richard, D’Vera Cohn, Gretchen Livingston, and Paul Taylor. 2011. The Rising Age Gap in Economic Well-being. Washington, DC: Pew Research Center Social & Demographic Trends project, November.

Fry, Richard, and Kim Parker. 2012. Record Shares of Young Adults Have Finished Both High School and College. Washington, DC: Pew Research Center Social & Demographic Trends project, November.

Fry, Richard. 2013. A Rising Share of Young Adults Live in Their Parents’ Home. Washington, DC: Pew Research Center Social & Demographic Trends project, August.

Gottschalck, Alfred O. 2008. Net Worth and the Assets of Households: 2002. Current Population Report P70-115. Washington, DC: U.S. Census Bureau, April.

[Machine-readable database]

Mykyta, Laryssa. 2012. “Economic Downturns and the Failure to Launch: The Living Arrangements of Young Adults in the U.S. 1995-2011.” U.S. Census Bureau Social, Economic and Housing Statistics Division (SEHSD) Working Paper 2012-24. https://www.census.gov/hhes/www/poverty/publications/WP2012-24.pdf

Pew Research Center. 2010. Millennials: Confident. Connected. Open to Change. Washington, DC: Pew Research Center, February.

Thomas, Adam, and Isabel Sawhill. 2005. “For Love and Money? The Impact of Family Structure on Family Income,” The Future of Children, vol. 15, no. 2, Fall.