
Pew Research Center

FOR RELEASE JUNE 13, 2013

A Survey of LGBT Americans

An overwhelming share of America’s lesbian, gay, bisexual and transgender adults (92%) say society has become more accepting of them in the past decade and an equal number expect it to grow even more accepting in the decade ahead. They attribute the changes to a variety of factors, from people knowing and interacting with someone […]

FOR MEDIA OR OTHER INQUIRIES:

Communications Department
202.419.4372
www.pewresearch.org

RECOMMENDED CITATION

Pew Research Center, June 2013, "A Survey of LGBT Americans"

About Pew Research Center

Pew Research Center is a nonpartisan, nonadvocacy fact tank that informs the public about the issues, attitudes and trends shaping the world. It does not take policy positions. The Center conducts public opinion polling, demographic research, computational social science research and other data-driven research. It studies politics and policy; news habits and media; the internet and technology; religion; race and ethnicity; international affairs; social, demographic and economic trends; science; research methodology and data science; and immigration and migration. Pew Research Center is a subsidiary of The Pew Charitable Trusts, its primary funder.

© Pew Research Center 2026

Table of contents

  • About Pew Research Center
  • A Survey of LGBT Americans
  • Chapter 1: Demographic Portrait and Research Challenges
  • Chapter 2: Social Acceptance
  • Chapter 3: The Coming Out Experience
  • Chapter 4: Marriage and Parenting
  • Chapter 5: Identity and Community
  • Chapter 6: Religion
  • Chapter 7: Partisanship, Policy Views, Values
  • Appendix 1: Survey Methodology

A Survey of LGBT Americans

An overwhelming share of America’s lesbian, gay, bisexual and transgender adults (92%) say society has become more accepting of them in the past decade and an equal number expect it to grow even more accepting in the decade ahead. They attribute the changes to a variety of factors, from people knowing and interacting with someone […]

An overwhelming share of America’s lesbian, gay, bisexual and transgender adults (92%) say society has become more accepting of them in the past decade and an equal number expect it to grow even more accepting in the decade ahead. They attribute the changes to a variety of factors, from people knowing and interacting with someone who is LGBT, to advocacy on their behalf by high-profile public figures, to LGBT adults raising families.1
SDT-2013-06-LGBT-0-02

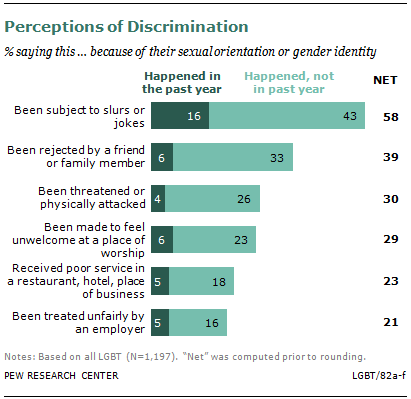
At the same time, however, a new nationally representative survey of 1,197 LGBT adults offers testimony to the many ways they feel they have been stigmatized by society. About four-in-ten (39%) say that at some point in their lives they were rejected by a family member or close friend because of their sexual orientation or gender identity; 30% say they have been physically attacked or threatened; 29% say they have been made to feel unwelcome in a place of worship; and 21% say they have been treated unfairly by an employer. About six-in-ten (58%) say they’ve been the target of slurs or jokes.
SDT-2013-06-LGBT-0-03

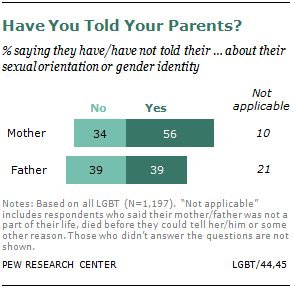
Also, just 56% say they have told their mother about their sexual orientation or gender identity, and 39% have told their father. Most who did tell a parent say that it was difficult, but relatively few say that it damaged their relationship.

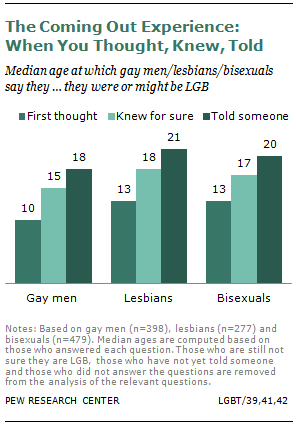
The survey finds that 12 is the median age at which lesbian, gay and bisexual adults first felt they might be something other than heterosexual or straight. For those who say they now know for sure that they are lesbian, gay, bisexual or transgender, that realization came at a median age of 17.
SDT-2013-06-LGBT-0-04

Among those who have shared this information with a family member or close friend, 20 is the median age at which they first did so.

Gay men report having reached all of these coming out milestones somewhat earlier than do lesbians and bisexuals.

The survey was conducted April 11-29, 2013, and administered online, a survey mode that research indicates tends to produce more honest answers on a range of sensitive topics than do other less anonymous modes of survey-taking. For more details, see Chapter 1 and Appendix 1.

The survey finds that the LGBT population is distinctive in many ways beyond sexual orientation. Compared with the general public, Pew Research LGBT survey respondents are more liberal, more Democratic, less religious, less happy with their lives, and more satisfied with the general direction of the country. On average, they are younger than the general public. Their family incomes are lower, which may be related to their relative youth and the smaller size of their households. They are also more likely to perceive discrimination not just against themselves but also against other groups with a legacy of discrimination.

About the Survey

Findings in this report are based on two main data sources:

This report is based primarily on a Pew Research Center survey of the LGBT population conducted April 11-29, 2013, among a nationally representative sample of 1,197 self-identified lesbian, gay, bisexual and transgender adults 18 years of age or older. The sample comprised 398 gay men, 277 lesbians, 479 bisexuals and 43 transgender adults. The survey questionnaire was written by the Pew Research Center and administered by the GfK Group using KnowledgePanel, its nationally representative online research panel.

The online survey mode was chosen for this study, in part, because considerable research on sensitive issues (such as drug use, sexual behavior and even attendance at religious services) indicates that the online mode of survey administration is likely to elicit more honest answers from respondents on a range of topics.

The margin of sampling error for the full LGBT sample is plus or minus 4.1 percentage points at the 95% confidence level. For more details on the LGBT survey methodology, see Appendix 1.

In most cases the comparisons made between LGBT adults and the general public are taken from other Pew Research Center surveys.

Same-Sex Marriage

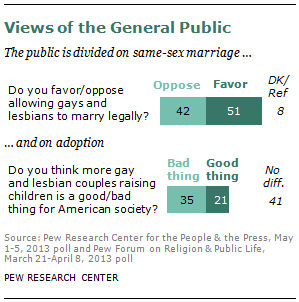
On the topic of same-sex marriage, not surprisingly, there is a large gap between the views of the general public and those of LGBT adults. Even though a record 51% of the public now favors allowing gays and lesbians to marry legally, up from 32% in 2003, that share is still far below the 93% of LGBT adults who favor same-sex marriage.

Despite nearly universal support for same-sex marriage among LGBT adults, a significant minority of that population—39%—say that the issue has drawn too much attention away from other issues that are important to people who are LGBT. However, 58% say it should be the top priority even if it takes attention away from other issues.

The survey finds that 16% of LGBT adults—mostly bisexuals with opposite-sex partners—are currently married, compared with about half the adults in the general public. Overall, a total of 60% of LGBT survey respondents are either married or say they would like to marry one day, compared with 76% of the general public.

Large majorities of LGBT adults and the general public agree that love, companionship and making a lifelong commitment are very important reasons to marry. However LGBT survey respondents are twice as likely as those in the general public to say that obtaining legal rights and benefits is also a very important reason to marry (46% versus 23%). And the general public is more likely than LGBT respondents to say that having children is a very important reason to marry (49% versus 28%).

The LGBT Population and its Sub-Groups
SDT-2013-06-LGBT-0-05

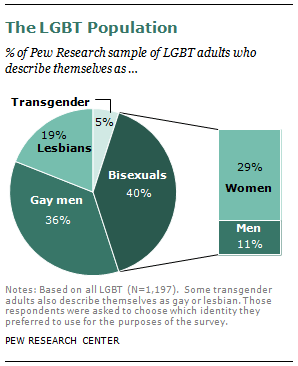
Four-in-ten respondents to the Pew Research Center survey identify themselves as bisexual. Gay men are 36% of the sample, followed by lesbians (19%) and transgender adults (5%).2 While these shares are consistent with findings from other surveys of the LGBT population, they should be treated with caution.3 There are many challenges in estimating the size and composition of the LGBT population, starting with the question of whether to use a definition based solely on self-identification (the approach taken in this report) or whether to also include measures of sexual attraction and sexual behavior.

This report makes no attempt to estimate the share of the U.S. population that is LGBT. Other recent survey-based research reports have made estimates in the 3.5% to 5% range. However, all such estimates depend to some degree on the willingness of LGBT individuals to disclose their sexual orientation and gender identity, and research suggests that not everyone in this population is ready or willing to do so. (See Appendix 1 for a discussion of these and other methodological issues).
SDT-2013-06-LGBT-0-06

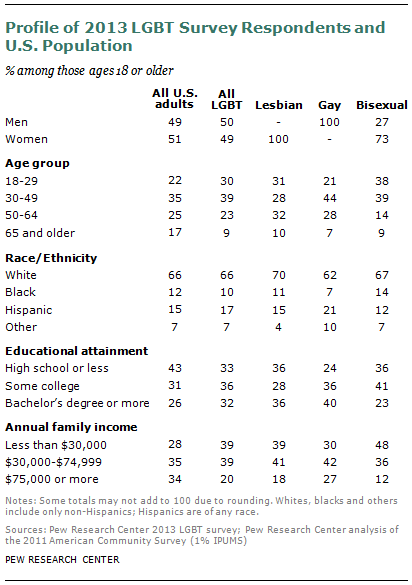
The table above provides a look at key demographic characteristics of the full Pew Research LGBT survey sample and its three largest sub-groups—bisexuals, gay men and lesbians. It shows, among other things, that bisexuals are younger, have lower family incomes and are less likely to be college graduates than gay men and lesbians. The relative youth of bisexuals likely explains some of their lower levels of income and education.
SDT-2013-06-LGBT-0-07

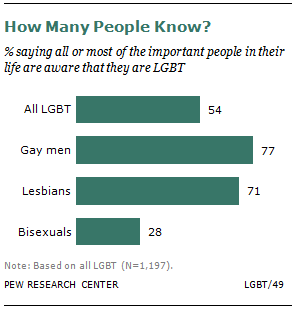
The survey also finds that bisexuals differ from gay men and lesbians on a range of attitudes and experiences related to their sexual orientation. For example, while 77% of gay men and 71% of lesbians say most or all of the important people in their lives know of their sexual orientation, just 28% of bisexuals say the same. Bisexual women are more likely to say this than bisexual men (33% vs. 12%). Likewise, about half of gay men and lesbians say their sexual orientation is extremely or very important to their overall identity, compared with just two-in-ten bisexual men and women.
SDT-2013-06-LGBT-0-08

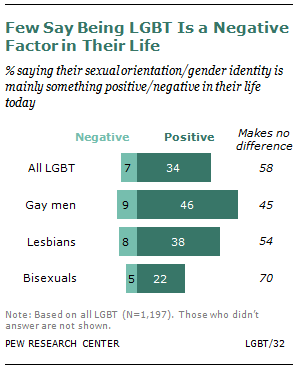
Gays and lesbians are also more likely than bisexuals to say their sexual orientation is a positive factor in their lives, though across all three subgroups, many say it is neither positive nor negative. Only a small fraction of all groups describe their sexual orientation or gender identity as a negative factor.

Roughly three-quarters of bisexual respondents to the Pew Research survey are women. By contrast, gay men outnumber lesbians by about two-to-one among survey respondents. Bisexuals are far more likely than either gay men or lesbians to be married, in part because a large majority of those in committed relationships have partners of the opposite sex and thus are able to marry legally. Also, two-thirds of bisexuals say they either already have or want children, compared with about half of lesbians and three-in-ten gay men.

Across the LGBT population, more say bisexual women and lesbians are accepted by society than say this about gay men, bisexual men or transgender people. One-in-four respondents say there is a lot of social acceptance of lesbians, while just 15% say the same about gay men. Similarly, there is more perceived acceptance of bisexual women (33% a lot) than of bisexual men (8%). Transgender adults are viewed as less accepted by society than other LGBT groups: only 3% of survey respondents say there is a lot of acceptance of this group.

Social Acceptance and the Public’s Perspective

Even though most LGBT adults say there has been significant progress toward social acceptance, relatively few (19%) say there is a lot of social acceptance for the LGBT population today. A majority (59%) says there is some, and 21% say there is little or no acceptance today.

Surveys of the general public show that societal acceptance is on the rise. More Americans now say they favor same-sex marriage and fewer say homosexuality should be discouraged, compared with a decade ago. These changing attitudes may be due in part to the fact that a growing share of all adults say they personally know someone who is gay or lesbian—87% today, up from 61% in 1993.

A new Pew Research Center analysis shows that among the general public, knowing someone who is gay or lesbian is linked with greater acceptance of homosexuality and support for same-sex marriage.

LGBT adults themselves recognize the value of these personal interactions; 70% say people knowing someone who is LGBT helps a lot in terms of making society more accepting of the LGBT population.
SDT-2013-06-LGBT-0-09

Still, a significant share of the public believes that homosexuality should be discouraged and that same-sex marriage should not be legal. Much of this resistance is rooted in deeply held religious attitudes, such as the belief that engaging in homosexual behavior is a sin.

And the public is conflicted about how the rising share of gays and lesbians raising children is affecting society. Only 21% of all adults say this trend is a good thing for society, 35% say this is a bad thing for society, and 41% say it doesn’t make much difference. The share saying this is a bad thing has fallen significantly in recent years (from 50% in 2007).

The Coming Out Process

In the context of limited but growing acceptance of the LGBT population, many LGBT adults have struggled with how and when to tell others about their sexual orientation. About six-in-ten (59%) have told one or both of their parents, and a majority say most of the people who are important to them know about this aspect of their life.

Most of those who have told their parents say this process wasn’t easy. Some 59% of those who have told their mother about their sexual orientation or gender identity and 65% who have told their father say it was difficult to share this information. However, of those who have told their mothers, the vast majority say it either made the relationship stronger (39%) or didn’t change the relationship (46%). A similar-sized majority says telling their father about their sexual orientation or gender identity didn’t hurt their relationship.

Age, Gender and Race

The survey finds that the attitudes and experiences of younger adults into the LGBT population differ in a variety of ways from those of older adults, perhaps a reflection of the more accepting social milieu in which younger adults have come of age.

For example, younger gay men and lesbians are more likely to have disclosed their sexual orientation somewhat earlier in life than have their older counterparts. Some of this difference may be attributable to changing social norms, but some is attributable to the fact that the experiences of young adults who have not yet identified as being gay or lesbian but will do so later in life cannot be captured in this survey.

As for gender patterns, the survey finds that lesbians are more likely than gay men to be in a committed relationship (66% versus 40%); likewise, bisexual women are much more likely than bisexual men to be in one of these relationships (68% versus 40%). In addition women, whether lesbian or bisexual, are significantly more likely than men to either already have children or to say they want to have children one day.

Among survey respondents, whites are more likely than non-whites to say society is a lot more accepting of LGBT adults now than it was a decade ago (58% vs. 42%) and, by a similar margin, are more optimistic about future levels of acceptance.4 Non-whites are more likely than whites to say being LGBT is extremely or very important to their overall identity (44% versus 34%) and more likely as well to say there is a conflict between their religion and their sexual orientation (37% versus 20%).

Views of Issues, Leaders, Institutions
SDT-2013-06-LGBT-0-10

On the eve of a ruling expected later this month by the U.S. Supreme Court on two same-sex marriage cases, 58% of LGBT adults say they have a favorable view of the court and 40% view it unfavorably; these assessments are similar to those held by the general public.

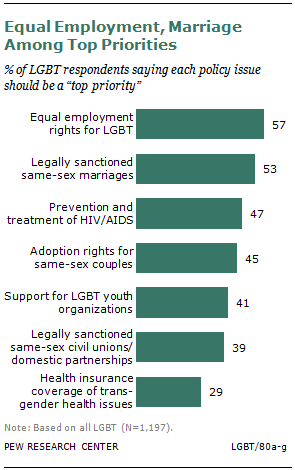
While the same-sex marriage issue has dominated news coverage of the LGBT population in recent years, it is only one of several top priority issues identified by survey respondents. Other top rank issues include employment rights, HIV and AIDS prevention and treatment, and adoption rights.
SDT-2013-06-LGBT-0-11

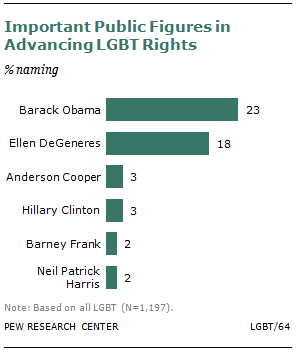
When asked in an open-ended question to name the national public figures most responsible for advancing LGBT rights, President Barack Obama, who announced last year that he had changed his mind and supports gay marriage, tops the list along with comedian and talk show host Ellen DeGeneres, who came out as a lesbian in 1997 and has been a leading advocate for the LGBT population ever since then. Some 23% of respondents named Obama and 18% named DeGeneres. No one else was named by more than 3% of survey respondents.
SDT-2013-06-LGBT-0-12

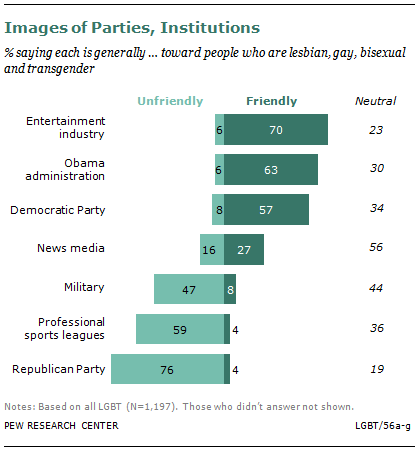
For the most part LGBT adults are in broad agreement on which institutions they consider friendly to people who are lesbian, gay, bisexual and transgender. Seven-in-ten describe the entertainment industry as friendly, 63% say the same about the Obama administration, and 57% view the Democratic Party as friendly. By contrast, just 4% say the same about the Republican Party (compared with 76% who say it is unfriendly); 8% about the military (47% unfriendly) and 4% about professional sports leagues (59% unfriendly). LGBT adults have mixed views about the news media, with 27% saying it is friendly, 56% neutral and 16% unfriendly.

LGBT survey respondents are far more Democratic than the general public—about eight-in-ten (79%) are Democrats or lean to the Democratic Party, compared with 49% of the general public. And they offer opinions on a range of public policy issues that are in sync with the Democratic and liberal tilt to their partisanship and ideology. For example, they are more likely than the general public to say they support a bigger government that provides more services (56% versus 40%); they are more supportive of gun control (64% versus 50%) and they are more likely to say immigrants strengthen the country (62% versus 49%).

Self and Country
SDT-2013-06-LGBT-0-13

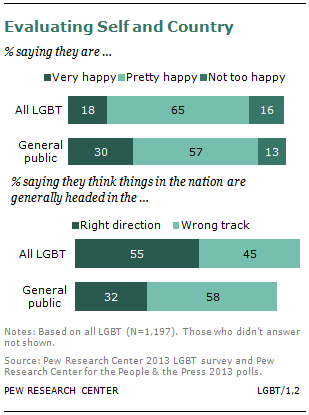
LGBT adults and the general public are also notably different in the ways they evaluate their personal happiness and the overall direction of the country.

In the case of happiness, just 18% of LGBT adults describe themselves as “very happy,” compared with 30% of adults in the general public who say the same. Gay men, lesbians and bisexuals are roughly equal in their expressed level of happiness.

When it comes to evaluations of the direction of the nation, the pattern reverses, with LBGT adults more inclined than the general public (55% versus 32%) to say the country is headed in the right direction. Opinions on this question are strongly associated with partisanship.

Religion

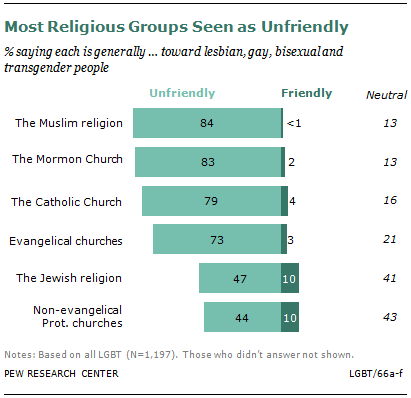
Religion is a difficult terrain for many LGBT adults. Lopsided majorities describe the Muslim religion (84%), the Mormon Church (83%), the Catholic Church (79%) and evangelical churches (73%) as unfriendly toward people who are LGBT. They have more mixed views of the Jewish religion and mainline Protestant churches, with fewer than half of LGBT adults describing those religions as unfriendly, one-in-ten describing each of them as friendly and the rest saying they are neutral.

The survey finds that LGBT adults are less religious than the general public. Roughly half (48%) say they have no religious affiliation, compared with 20% of the public at large. Of those LGBT adults who are religiously affiliated, one-third say there is a conflict between their religious beliefs and their sexual orientation or gender identity. And among all LGBT adults, about three-in-ten (29%) say they have been made to feel unwelcome in a place of worship.
SDT-2013-06-LGBT-0-14

Pew Research surveys of the general public show that while societal views about homosexuality have shifted dramatically over the past decade, highly religious Americans remain more likely than others to believe that homosexuality should be discouraged rather than accepted by society. And among those who attend religious services weekly or more frequently, fully two-thirds say that homosexuality conflicts with their religious beliefs (with 50% saying there is a great deal of conflict). In addition, religious commitment is strongly correlated with opposition to same-sex marriage.

Community Identity and Engagement
SDT-2013-06-LGBT-0-15

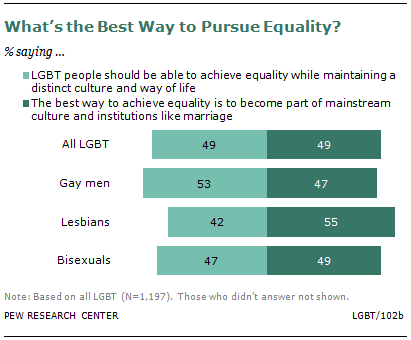
As LGBT adults become more accepted by society, the survey finds different points of view about how fully they should seek to become integrated into the broader culture. About half of survey respondents (49%) say the best way to achieve equality is to become a part of mainstream culture and institutions such as marriage, but an equal share say LGBT adults should be able to achieve equality while still maintaining their own distinct culture and way of life.

Likewise, there are divisions between those who say it is important to maintain places like LGBT neighborhoods and bars (56%) and those who feel these venues will become less important over time (41%). Gay men are most likely of any of the LGBT subgroups to say that these distinctive venues should be maintained (68%).
SDT-2013-06-LGBT-0-16

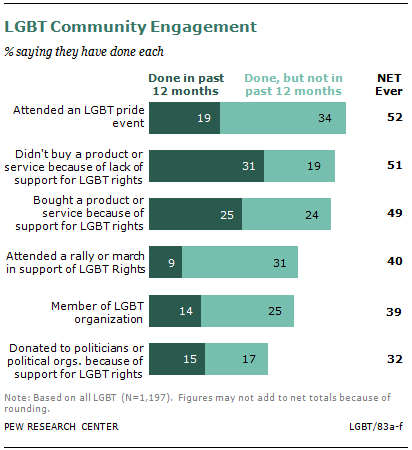
When it comes to community engagement, gay men and lesbians are more involved than bisexuals in a variety of LGBT-specific activities, such as attending a gay pride event or being a member of an LGBT organization.

Overall, many LGBT adults say they have used their economic power in support or opposition to certain products or companies. About half (51%) say they have not bought a product or service because the company that provides it is not supportive of LGBT rights. A similar share (49%) says they have specifically bought a product or service because the company is supportive of LGBT rights.

Some 52% have attended an LGBT pride event, and 40% have attended a rally or march in support of LGBT rights. About four-in-ten (39%) say they belong to an LGBT organization and roughly three-in-ten (31%) have donated money to politicians who support their rights.

LGBT Adults Online
SDT-2013-06-LGBT-0-17

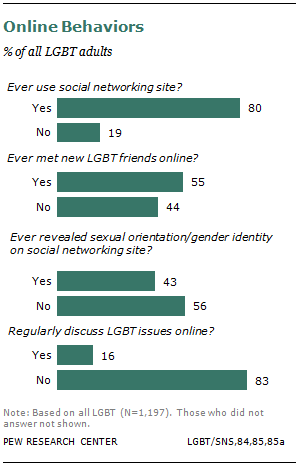
LGBT adults are heavy users of social networking sites, with 8o% of survey respondents saying they have used a site such as Facebook or Twitter. This compares with 58% of the general public (and 68% of all internet users), a gap largely attributable to the fact that as a group LGBT adults are younger than the general public, and young adults are much more likely than older adults to use social networking sites. When young LGBT adults are compared with all young adults, the share using these sites is almost identical (89% of LGBT adults ages 18 to 29 vs. 90% of all adults ages 18 to 29).

There are big differences across LGBT groups in how they use social networking sites. Among all LGBT adults, 55% say they have met new LGBT friends online or through a social networking site. Gay men are the most likely to say they have done this (69%). By contrast, about half of lesbians (47%) and bisexuals (49%) say they have met a new LGBT friend online.

About four-in-ten LGBT adults (43%) have revealed their sexual orientation or gender identity on a social networking site. While roughly half of gay men and lesbians have come out on a social network, only about one-third (34%) of bisexuals say they have done this.

Just 16% say they regularly discuss LGBT issues online; 83% say they do not do this.

A Note on Transgender Respondents

Transgender is an umbrella term that groups together a variety of people whose gender identity or gender expression differs from their birth sex. Some identify as female-to-male, others as male-to-female. Others may call themselves gender non-conforming, reflecting an identity that differs from social expectations about gender based on birth sex. Some may call themselves genderqueer, reflecting an identity that may be neither male nor female. And others may use the term transsexual to describe their identity. A transgender identity is not dependent upon medical procedures. While some transgender individuals may choose to alter their bodies through surgery or hormonal therapy, many transgender people choose not to do so.

People who are transgender may also describe themselves as heterosexual, gay, lesbian, or bisexual. In the Pew Research Center survey, respondents were asked whether they considered themselves to be transgender in a separate series of questions from the question about whether they considered themselves to be lesbian, gay, bisexual, or heterosexual (see Appendix 1 for more details).

The Pew Research survey finds that 5% of LGBT respondents identify primarily as transgender; this is roughly consistent with other estimates of the proportion of the LGBT population that is transgender. Although there is limited data on the size of the transgender population, it is estimated that 0.3% of all American adults are transgender (Gates 2011).

Because of the small number of transgender respondents in this survey (n=43), it is not possible to generate statistically significant findings about the views of this subgroup. However, their survey responses are represented in the findings about the full LGBT population throughout the survey.

The responses to both open- and closed-ended questions do allow for a few general findings. For example, among transgender respondents to this survey, most say they first felt their gender was different from their birth sex before puberty. For many, being transgender is a core part of their overall identity, even if they may not widely share this with many people in their lives.

And just as gay men, lesbians, and bisexuals perceive less commonality with transgender people than with each other, transgender adults may appear not to perceive a great deal of commonality with lesbians, gay men, and bisexuals. In particular, issues like same-sex marriage may be viewed as less important by this group, and transgender adults appear to be less involved in the LGBT community than are other sub-groups.

Here are some of the voices of transgender adults in the survey:

Voices: Transgender Survey Respondents

On Gender Identity

“It finally feels comfortable to be in my own body and head—I can be who I am, finally.” –Transgender adult, age 24

“I have suffered most of my life in the wrong gender. Now I feel more at home in the world, though I must admit, not completely. There is still plenty of phobic feeling.”  –Transgender adult, age 77

“Though I have not transitioned fully, being born as male but viewing things from a female perspective gives me a perspective from both vantage points. I am very empathetic because of my circumstance.” –Transgender adult, age 56

“I wish I could have identified solely as male. Identifying as another gender is not easy.” –Transgender adult, age 49

On Telling People

“Times were different for in-between kids born in the 30’s. We mostly tried to conform and simply lived two lives at once. The stress caused a very high suicide rate and a higher rate of alcohol addiction (somehow I was spared both.)” -Transgender adult, age 77

“It’s been hard and very cleansing at the same time. The hardest part is telling old friends because they’ve known you for so long as your born gender. But most people are willing to change for you if they care enough.” –Transgender adult, age 27

“I have only told close members of my family and only a handful of friends. I don’t think that it is important to shout it out from the rooftops, especially in my profession.” –Transgender adult, age 38

“This process is difficult. Most people know me one way and to talk to them about a different side of me can be disconcerting. I have not told most people because of my standing in the community and my job, which could be in jeopardy” –Transgender adult, age 44

“Some of my family still refers to me as “she” but when we go out they catch themselves because of how I look, they sound foolish to strangers :). When it’s a bunch of family or old friends, they usually don’t assign me a gender they say my name. But I don’t get too bothered by it, they are family and well, that’s a huge thing to have to change in your mind. For the ones that do it out of disrespect, I just talk to them one on one and ask for them to do better.” –Transgender adult, age 29

LGBT/32a,50

Interactive: LGBT Voices

Explore some 300 quotes from LGBT survey respondents about their coming out experiences.

Notes on Terminology

Unless otherwise noted, all references to whites, blacks and others are to the non-Hispanic components of those populations. Hispanics can be of any race. Non-whites refers to people whose race is not white (e.g. black, Asian, etc.) or to Hispanics regardless of their race.

Throughout this report, the acronym “LGBT” is used to refer to the lesbian, gay, bisexual and transgender population. The phrases “LGBT adults,” “LGBT individuals,” “LGBT people” and “LGBT respondents” are used interchangeably throughout this report as are the phrases “LGBT population” and “LGBT community.”

In the survey instrument, when LGBT adults were asked about their identity, gays, lesbians and bisexuals were asked about their sexual orientation while transgender respondents were asked about their gender identity. This protocol is also used in the report when reporting LGBT adults’ views of their identity.

References to the political party identification of respondents include those who identify with a political party or lean towards a specific political party. Those identified as independents do not lean towards either the Democratic Party or the Republican Party.

Acknowledgments

Many Pew Research Center staff members contributed to this research project. Paul Taylor oversaw the project and served as lead editor of the report. Kim Parker, Jocelyn Kiley and Mark Hugo Lopez took the lead in the development of the LGBT survey instrument. Scott Keeter managed development of the survey’s methodological strategy.

The report’s overview was written by Taylor. Chapter 1 of the report was written by D’Vera Cohn and Gretchen Livingston. Parker wrote chapters 2 and 3. Chapter 4 was written by Eileen Patten. Chapter 5 was written by Kiley and Patten. Cary Funk and Rich Morin wrote Chapter 6 of the report. Kiley wrote Chapter 7. Keeter wrote the report’s methodology appendix. Lopez, Patten, Kiley, Sara Goo, Adam Nekola and Meredith Dost curated quotes for the “voices” features and online interactive. The report was number checked by Anna Brown, Danielle Cuddington, Matthew Frei, Seth Motel, Patten, Rob Suls, Alec Tyson and Wendy Wang. Noble Kuriakose and Besheer Mohamed provided data analysis for the report’s demographic chapter. The report was copy-edited by Marcia Kramer of Kramer Editing Services and Molly Rohal.

Others at the Pew Research Center who provided editorial or research guidance include Alan Murray, Michael Dimock, Carroll Doherty, Andrew Kohut, Alan Cooperman, Lee Rainie and James Hawkins.

Staffers who helped to disseminate the report and to prepare related online content include Goo, Vidya Krishnamurthy, Michael Piccorossi, Russ Oates, Adam Nekola, Diana Yoo, Michael Suh, Andrea Caumont, Michael Keegan, Jessica Schillinger, Bruce Drake, Caroline Klibanoff, Rohal, Russell Heimlich and Katie Reilly.

The Pew Research Center thanks and acknowledges M.V. Lee Badgett and Gary J. Gates. Badgett is the Director of the Center for Public Policy & Administration and Professor of economics at the University of Massachusetts, Amherst. She is also the research director of UCLA’s Williams Institute. Gates is the Williams Distinguished Scholar at UCLA’s Williams Institute. They served as advisors to the project, providing invaluable guidance on survey questionnaire development, demographic analysis of U.S. Census Bureau data and the survey’s methodology. We also thank Stephanie Jwo, Joseph Garrett and Monsour Fahimi of the GfK Group, who worked with Keeter on the survey’s sampling design, data collection protocol and weighting plan and oversaw the collection of the data; and Frank Newport of Gallup, who provided comparative data from Gallup’s surveys.

The Pew Research Center conducted a focus group discussion on March 26, 2013 in Washington, D.C. to help inform the survey questionnaire’s development. The focus group was moderated by Lopez and was composed of 12 individuals ages 18 and older. Participants were told that what they said might be quoted in the report or other products from the Pew Research Center, but that they would not be identified by name.

Roadmap to the Report

Chapter 1, Demographic Portrait and Research Challenges, examines the demographic profile of lesbian, gay, bisexual and transgender adults surveyed by the Pew Research Center and other prominent research organizations. It also includes data on same-sex couples from the U.S. Census Bureau. In addition, this chapter discusses the challenges involved in surveying this population and making estimates about its size and characteristics.

Chapter 2, Social Acceptance, looks at societal views of the LGBT population from the perspective of LGBT adults themselves. It also chronicles the ways in which LGBT adults have experienced discrimination in their own lives and looks at the extent to which they believe major institutions in this country are accepting of them.

Chapter 3, The Coming Out Experience, chronicles the journey LGBT adults have been on in realizing their sexual orientation or gender identity and sharing that information with family and friends. It also looks at where LGBT adults live, how many of their friends are LGBT and whether they are open about their LGBT identity at work. This chapter includes a brief section on online habits and behaviors.

Chapter 4, Marriage and Parenting, looks at LGBT adults’ attitudes toward same-sex marriage and also their experiences in the realm of family life. It examines their relationship status and their desire to marry and have children—detailing the key differences across LGBT groups and between LGBT adults and the general public.

Chapter 5, Identity and Community, explores how LGBT adults view their sexual orientation or gender identity in the context of their overall identity. It looks at the extent to which this aspect of their lives is central to who they are, as well as how much they feel they have in common with other LGBT adults. It also looks at the extent to which LGBT adults are engaged in the broader LGBT community and how they view the balance between maintaining a distinct LGBT culture and becoming part of the American mainstream.

Chapter 6, Religion, details the religious affiliation, beliefs and practices of LGBT adults and compares them with those of the general public. It also looks at whether LGBT adults feel their religious beliefs are in conflict with their sexual orientation or gender identity, and how they feel they are perceived by various religious groups and institutions.

Chapter 7, Partisanship, Policy Views, Values, looks at the party affiliation of LGBT adults and their views of Barack Obama and of the Democratic and Republican parties. It also includes LGBT views on key policy issues, such as immigration and gun control, and compares them with those of the general public. And it also looks at how LGBT adults prioritize LGBT-related policy issues beyond same-sex marriage.

Following the survey chapters is a detailed survey methodology statement. This includes descriptions of the sampling frame, questionnaire development and weighting procedures for the LGBT survey. It also has a demographic profile of the Pew Research LGBT survey respondents with details on specific LGBT groups.

Interspersed throughout the report are Voices of LGBT adults. These are quotes from open-ended questions included in the survey and are meant to personalize the aggregate findings and add richness and nuance. Individual respondents are identified only by their age, gender and sexual orientation or gender identity. Additional quotes from LGBT respondents are available in an interactive feature on the Pew Research Center website.

Chapter 1: Demographic Portrait and Research Challenges

This section examines the demographic profile of lesbian, gay, bisexual and transgender adults surveyed by the Pew Research Center and other prominent research organizations. It also discusses the challenges involved in collecting data on the size and characteristics of a population that can be defined several different ways and whose members may be reluctant to disclose their sexual orientation and gender identity in a survey interview or questionnaire because of perceived stigma.

As shown in the table below, different surveys yield broad similarities but also some notable differences in the characteristics, geographic location and political affiliation of this population. As explained later in this section, both the means of determining sexual orientation and gender identity and the mode of questionnaire administration can significantly affect results and may explain the variances. No single set of findings should be deemed authoritative; all should be taken as estimates.

SDT-2013-06-LGBT-1-01

SDT-2013-06-LGBT-1-02

Comparing Survey Respondent Demographics

Results from the 2013 Pew Research Center LGBT survey, as well as the Gallup 2012 and General Social Surveys (GSS), all indicate that LGBT respondents are generally younger than the overall adult population. The Pew Research survey suggests that they have more education than the total adult population. And all three survey sources indicate that they have lower family or household incomes (which is likely due, in part, to their younger ages and the fact that fewer live in family households, which tend to have higher incomes than other households). The LGBT respondents and the overall adult population share fairly similar profiles in terms of gender composition, race/ethnicity, and region of residence.

Among respondents to the Pew Research Center LGBT survey, 30% are ages 18 to 29, higher than the 22% share of this age group among all adults, according to the Census Bureau’s 2011 American Community Survey. In the 2012 Gallup LGBT survey sample, extracted from the Gallup daily tracking poll in 2012, 37% of respondents are ages 18 to 29.

In terms of educational attainment, 32% of Pew Research LGBT respondents have a bachelor’s degree or more, compared with 26% of the U.S. adult population and 27% of Gallup LGBT respondents. Among Pew Research LGBT respondents, a third (33%) have a high school education or less, compared with 43% of the adult population and 40% of Gallup LGBT respondents.

In financial terms, 39% of LGBT respondents have annual family incomes of less than $30,000, compared with just 28% of adults overall. (Gallup respondents were asked about monthly income, and the offered categories do not permit direct comparison with Pew Research data or other sources.)

Data from the General Social Survey (GSS) are also shown in the table. The GSS is a biennial survey conducted by the National Opinion Research Center (NORC). The survey includes a question asking whether a respondent identifies as gay, lesbian, homosexual, bisexual, straight or heterosexual, and the majority of responses are collected via in-person interviews.

Challenges in Studying the LGBT Population

In the Pew Research Center survey, sexuality and gender identity are based upon self-identity. Respondents are asked whether they consider themselves to be heterosexual, gay, lesbian or bisexual; in a separate question, they are asked whether they consider themselves to be transgender. In some other studies, researchers categorize respondents’ sexuality based upon whether they report ever being attracted to same-sex or opposite-sex persons.

Another means of categorizing sexuality is based upon behavior—whether, for example, a respondent ever had sexual relations with a same-sex person and/or an opposite-sex person. Adding a layer of complexity to this method is the time dimension. Researchers might choose to classify an individual based on a single sexual relationship many years ago, based only on a pattern of recent sexual activity or based on something in between (Gates 2012).

These different approaches yield different results. A 2011 review of various survey findings indicated that while an estimated 3.5% of respondents self-identified as gay, lesbian or bisexual, 8.2% reported having engaged in same-sex behaviors, and 11% of respondents (ages 18 to 44) reported at least some level of attraction to people of the same sex (Gates 2011).

A related issue is the possible unwillingness of some LGBT individuals to reveal their status in a survey interview. Given that there are mixed public attitudes about less common forms of sexual orientation and gender identity, respondents may worry about the consequences of disclosing their LGBT status. Consequently, surveys may understate the LGBT share of the population and be biased because different kinds of LGBT individuals may be more or less willing to disclose their status. For example, many studies show that younger people are more likely than older adults to self-identify as LGBT. This may reflect real differences but could also reflect a greater willingness of younger people to disclose their sexual orientation.

Because of the stigma that some attach to LGBT status, collecting information on this population group may be especially sensitive to the mode of interview used. Results from a face-to-face or telephone interview may underestimate the size of the LGBT population, if some respondents do not feel comfortable disclosing such information to others. A self-administered questionnaire, as was used in the 2013 Pew Research Center LGBT Survey, typically produces a higher share of respondents who disclose that they are LGBT (Gates 2011).

Results from two large national surveys illustrate this discrepancy. The National Election Pool’s 2012 exit poll, conducted among voters on Election Day using self-administered paper questionnaires and in telephone surveys among those who voted early and absentee, found 5% of voters identifying as gay, lesbian or bisexual. Gallup’s Daily Tracking telephone surveys aggregated from June to December 2012 finds 3.5% of respondents identifying as LGBT. These estimates are lower than that among 2012 voters; the difference may be partially related to the fact that the Gallup survey is conducted entirely by telephone interviewers, while most of the interviews in the exit poll are self-administered and thus anonymous.

Census Data on Same-Sex Couples and Opposite-Sex Couples Living Together

SDT-2013-06-LGBT-1-03Another source of data on this population comes from the Census Bureau, which publishes counts and characteristics of same-sex couples. This measure does not cover the full gay and lesbian population because it does not tabulate unpartnered gay men or lesbians, as well as people who consider themselves to be in same-sex couples but who do not live together.

Nearly 650,000 same-sex couple households were counted in the 2010 Census (O’Connell and Feliz, 2011).5 They included nearly 515,000 unmarried-partner couples and nearly 132,000 couples who identified themselves as married.6

The Census Bureau statistics on same-sex couples, both in the decennial count and the annual American Community Survey,7 come from a question that asks how other members of the household are related to the householder. Among the response categories are “husband/wife” and “unmarried partner.” If a householder is linked to another household member who has one of these relationship classifications, and that person is of the same sex as the householder, the two are deemed a same-sex couple. This measure, therefore, does not capture the small share of cohabiting same-sex couples where neither member of the couple is the householder.

About half (51%) of same-sex couples in the 2011 American Community Survey8 were female, a change from 2005 when the majority were male, according to an analysis comparing same-sex and opposite-sex couples (Gates, 2013a). The same analysis reported that the share of same-sex couples with at least one partner ages 65 and older had increased to 9.7% in 2011, from 7.5% in 2005.

Same-sex couples on average fall between opposite-sex married and unmarried couples on the age spectrum, according to a Census Bureau comparison of same-sex and opposite-sex couples in the 2011 American Community Survey (Census Bureau 2012). The average age of the householder was 47.7 years for same-sex couples, compared with 51.3 for opposite-sex married couples and 38.3 for opposite-sex unmarried couples.

While 12.6% of same-sex couple households include a household head ages 65 and older, this share is 20% for opposite-sex married couples and 4.6% for opposite-sex unmarried couples. Similarly, 20.4% of same-sex couple households include a household head who is younger than 35, compared with 15% of opposite-sex married couples and 48.5% of unmarried opposite-sex couples.

The share of same-sex couple householders who are non-Hispanic white (78.6%) is the same or slightly higher than the share of opposite-sex married couple householders (74.7%) and higher than the share of unmarried opposite-sex couple householders (65.2%). The share of black householders (including black Hispanics) among same-sex couples (7%) is similar to the share among married opposite-sex couples (6.9%), but this share is lower than among unmarried opposite-sex couples (11.6%). Hispanic householders are also less prevalent among same-sex couples (9.8%) than among married opposite-sex couples (11.8%) or unmarried opposite-sex couples (18.3%).

Same-sex couples (13.9%) are at least as likely as opposite-sex unmarried couples (12.7%) to have partners of different races, and more so than opposite-sex married couples (6.4%).

Same-sex couples are more likely than opposite-sex couples to include at least one college-educated partner. According to 2011 American Community Survey data, 48.8% of householders in same-sex couples have college degrees, and in 31% of those couples, both partners have at least a college education. For opposite-sex married couples, 35.8% of householders have college degrees, and in 22.3% of marriages, both spouses do. For opposite-sex unmarried couples, 21.7% of householders have college degrees and in 11.2% of couples, both partners do.

The average household income in 2011 of same-sex couples is higher than those in both opposite-sex married and unmarried couples. Same-sex couples bring in an average of $107,000 a year, compared with $96,000 for opposite-sex married couples and $65,000 for opposite-sex unmarried couples.

Their higher income probably reflects the high educational attainment of same-sex couples, but also their greater likelihood (compared with opposite-sex married couples) of being in a two-worker household. Both partners are employed in 58% of same-sex couples, compared with 47.2% of opposite-sex married couples and 54.7% of opposite-sex unmarried couples.

Counting Same-Sex Couples in the Census and ACS

The 1990 Census was the first to include an “unmarried partner” relationship category, which allowed for a count of same-sex couples living together. Since that time, the number of same-sex couples living together has grown markedly. However, the Census Bureau cautions against comparing totals from earlier counts with more current ones. There are a number of reasons it’s difficult to gauge the increasing share of same-sex couple households—among them, the changing acceptability of homosexuality; issues with data collection; and changes in the way the Census Bureau edits the data.

As with other types of surveys, some people may not disclose their living arrangements, due to perceived stigma associated with homosexuality or fear of discrimination. They may report their relationship to the household head as a “roommate” instead of as an “unmarried partner” or “husband/wife,” for example. Since public acceptance of same-sex couples has been increasing in recent years, and since the Census Bureau has improved its outreach to the LGBT population (Cohn 2011), the likelihood of same-sex couples who live together accurately reporting this fact probably has increased.

Accidental misreporting may also occur in the data collection process. For instance, after analyzing 2010 Census data, bureau officials reported that the initial tally of same-sex couples was likely an overcount, in part because of a poorly designed questionnaire that caused some people to be assigned the wrong gender. The original count had more than 900,000 same-sex couples; the bureau released a new “preferred” lower count of 646,464 and promised that improvements in upcoming surveys would raise the quality of the data about same-sex couples.9

With any survey, problems can arise after data collection. And even relatively minor coding errors can have a big impact on results for small populations like same-sex couples. Since the 1990 introduction of the same-sex couple option on the decennial Census (and later on the ACS), a number of issues have arisen in the editing of the data. For instance, in the 1990 Census data, if a household’s census form listed a married same-sex couple, the Census Bureau changed the gender of one of the spouses on the assumption that an error had been made (because at that time, same-sex marriage was not legal).

Family Profiles from Past Surveys and Census Data

There are marked differences between same-sex and opposite-sex couples when it comes to the presence of children under age 18 in the household, according to the Census Bureau. About four-in-ten opposite-sex married couples (40.7%) and unmarried couples (41.8%) have children younger than 18 living with them. But that is true of only 17.5% of same-sex couples (11% of male couples and 23.2% of female couples).

Both the 2012 Gallup Survey and the General Social Survey extracted similar information for individuals, based upon their own definition of their sexuality and gender identity. In the case of the Gallup Survey, among LGBT respondents in the prime child-rearing ages (up to age 50) about 35% reported that they had a child under age 18 in the home. The comparable number among non-LGBT adults is 70%. (Gates 2013b). The 2008 and 2010 General Social Surveys include parenthood status based upon reported children ever born. Results indicate that among gay, lesbian and bisexual adults, more than one-third (37%) have had a child; due to the way the question was worded, these are most likely biological children.

In the Pew Research survey, more than one-third (35%) of LGBT respondents report that they are the parent or guardian of a child, and 17% report that they are the parent or guardian of a child under age 18. Bisexual respondents (52%) are much more likely than lesbians (31%) or gay men (16%) to be parents.

References

Cohn, D’Vera. 2011. “How Accurate Are Counts of Same-Sex Couples?” Washington, DC: Pew Research Center, August.

O’Connell, Martin, and Sarah Feliz. 2011. “Same-sex Couple Household Statistics from the 2010 Census.” SEHSD working paper 2011-26. Washington, DC: U.S. Census Bureau.

Gates, Gary J. 2013a. “Same Sex and Different Sex Couples in the American Community Survey: 2005-2011.” Los Angeles, CA: Williams Institute at UCLA School of Law, February.

Gates, Gary J. 2013b. “LGBT Parenting in the United States.” Los Angeles, CA: Williams Institute at UCLA School of Law, February.

Gates, Gary J., and Frank Newport. 2013c. “LBGT Percentage Highest in D.C., Lowest in North Dakota.” Princeton, NJ: Gallup, February.

Gates, Gary J. 2012. “LGBT Identity: A Demographer’s Perspective.” Los Angeles, CA: Loyola of Los Angeles Law Review, March.

Gates, Gary J. 2011. “How many people are lesbian, gay bisexual and transgender?” Los Angeles, CA: The Williams Institute at UCLA School of Law, April.

U.S. Census Bureau. “Table 1. Household Characteristics of Opposite-Sex and Same-Sex Couple Households: ACS 2011.” Washington, DC: 2012.

Chapter 2: Social Acceptance

Americans’ attitudes about gays and lesbians have changed dramatically over the past decade or so, and the LGBT adults are acutely aware of this. These changing attitudes have meant that LGBT adults feel more accepted by society now than in the past. They have also given rise to a nearly universal sense of optimism about what lies ahead for this community.

At the same time, only about one-in-five LGBT adults (19%) say there is “a lot” of social acceptance of lesbian, gay, bisexual and transgender people in this country today, and 53% say there is a lot of discrimination against these groups. And significant shares of LGBT adults report having been treated unfairly because of their sexual orientation or gender identity—through experiences ranging from poor service in restaurants and hotels to threats and physical attacks.

In the eyes of LGBT adults, greater social acceptance has come as a result of more Americans knowing someone who is lesbian, gay, bisexual or transgender as well as the efforts of high-profile public figures. A large majority (70%) says individuals simply knowing someone who is LGBT has helped a lot in terms of making society as a whole more accepting. Similar-sized majorities say well-known public figures—both LGBT (67%) and non-LGBT (66%)—have helped change societal views.

LGBT adults’ perceptions of how society has evolved differ by age and sexual orientation, as do their personal experiences with discrimination. This section will look in depth at how LGBT adults view various American institutions (including the two political parties), how they perceive and experience discrimination, and how levels of social acceptance differ across groups of LGBT adults (gay men, lesbians, bisexual men and bisexual women).

Social Acceptance

SDT-2013-06-LGBT-2-02

LGBT respondents were asked, overall, how much social acceptance there is of gay, lesbian, bisexual and transgender people in this country today. On this particular measure, the verdict is mixed. About one-in-five (19%) say there is a lot of acceptance for the LGBT population, 59% say there is some acceptance, and 21% say there is only a little. Just 1% say there is no acceptance at all.

Perceptions are fairly consistent across specific groups, although bisexuals have a somewhat more negative view of the current level of social acceptance. Roughly three-in-ten bisexuals (28%) say there is only a little or no acceptance of the LGBT population, compared with 15% of gay men and 16% of lesbians. In addition, middle-aged and older LGBT adults give a slightly more upbeat assessment of where things stand today. Among those ages 45 and older, 23% say there is a lot of acceptance for the LGBT population these days. Only 16% of those under age 45 say the same.

Respondents were also asked to assess the level of social acceptance for specific LGBT groups: gay men, lesbians, bisexual men, bisexual women and transgender people. Across the LGBT population, bisexual women and lesbians are viewed as being more accepted by society than gay men, bisexual men or transgender people. There is a significant gap in perceptions about the extent to which society accepts gay men and lesbians. One-in-four LGBT adults say there is a lot of social acceptance of lesbians, while only 15% say there is a lot of acceptance of gay men.

Similarly there is a gap in views about social acceptance of bisexual women and men. One-third of all LGBT adults say there is a lot of social acceptance for bisexual women; only 8% say the same about bisexual men.

SDT-2013-06-LGBT-2-03

LGBT adults see relatively little social acceptance for transgender people. Fully eight-in-ten say there is only a little (59%) or no (21%) social acceptance of this group. Only 3% say there is a lot of acceptance, and 15% say there is some.

When it comes to social acceptance of gay men, gay men themselves are just as likely as lesbians and bisexuals to say there is a lot of social acceptance for their group. They are somewhat more likely than lesbians or bisexuals to say there is some social acceptance (and less likely to say there is only a little or no acceptance).

Lesbians’ views about how much their group is accepted by society are almost identical to the views of gay men and bisexuals. Roughly one-in-four from each group say there is a lot of social acceptance for lesbians, and about six-in-ten say there is some social acceptance for this group.

Among bisexuals, men and women agree that there is a lot more social acceptance for female bisexuals than there is for male bisexuals.

Most See Progress and Expect More to Come

When survey respondents were asked how the level of overall social acceptance of people who are LGBT has changed over the past decade, their reactions were overwhelmingly positive. About nine-in-ten LGBT adults (92%) say society is more accepting of gay, lesbian, bisexual and transgender people than it was 10 years ago. This breaks down to 52% who say society is a lot more accepting today and 40% who say society is a little more accepting. An additional 4% of LGBT adults say things are no different in this regard than they were 10 years ago, and 3% say society is either a lot or a little less accepting today.

SDT-2013-06-LGBT-2-04

Gay men and lesbians have a more positive assessment than bisexuals of how things have changed over the past decade. Majorities from each group (66% of gay men and 57% of lesbians) say society is a lot more accepting of the LGBT population today than was the case 10 years ago. Among bisexuals, 41% say society is now a lot more accepting.

Evaluations of progress vary widely across key demographic groups. Again age is a factor, with middle-aged and older LGBT adults much more likely to see progress than younger LGBT adults. Among those ages 45 and older, 61% say society is a lot more accepting now than it was 10 years ago. Among those ages 18 to 44, only 46% agree with this assessment. Older LGBT adults have had the opportunity to witness more change and may have a greater understanding of the degree to which public views have shifted.

Among all LGBT adults, whites are more likely than non-whites to say society is a lot more accepting now (58% vs. 42%).10 Similarly, a greater share of college graduates (63%) than non-college graduates (48%) say they think society has become a lot more accepting of the LGBT population over the past decade.

Looking ahead to the next 10 years, the vast majority of LGBT adults expect society to become even more accepting of them. Fully 92% say, looking ahead 10 years from now, they think there will be greater acceptance of gay, lesbian, bisexual and transgender people in this country. Roughly two-thirds (65%) say society will be a lot more accepting 10 years from now, and an additional 27% say society will be a little more accepting. Some 6% say things will be no different from the way they are now, and only 2% say society will be less accepting of the LGBT population 10 years from now.

Gay men and lesbians are much more optimistic than bisexuals about societal acceptance increasing in the future: 71% of gay men and 76% of lesbians, compared with 58% of bisexuals, say society will be a lot more accepting of the LGBT population 10 years from now. Opinions also differ by race: 69% of whites compared with 58% of non-whites say there will be a lot more acceptance a decade from now.

Why Are Societal Views Changing?

SDT-2013-06-LGBT-2-05

Respondents were asked about the various factors that may have contributed to increased acceptance of people who are LGBT. Individual relationships and the role of well-known public figures are viewed as being the most helpful things in terms of fostering acceptance. Fully seven-in-ten LGBT adults say people knowing someone who is lesbian, gay, bisexual or transgender helps a lot, and 24% say this helps a little.

A similar majority say well-known public figures who are open about being LGBT help make society more accepting (67% say this helps a lot, and 27% say this helps a little). LGBT adults say public figures who support LGBT issues but are not LGBT themselves are equally helpful in terms of increasing public acceptance: 66% say these leaders help a lot, and 28% say they help a little.

A smaller share of LGBT adults think that LGBT characters in TV shows and movies have a positive impact on societal acceptance. About half of all LGBT adults (49%) say these characters help a lot, and 42% say they help a little.

The presence of LGBT adults raising families these days is seen as a positive factor for most LGBT respondents. Some 57% say LGBT adults raising families helps a lot in making society more accepting of the community, and an additional 35% say this helps a little.

Even fewer see LGBT pride events as being very helpful in making society more accepting. Only 28% say these events help a lot, and 48% say they help a little. One-in-five (21%) say these events do not help improve societal acceptance of the LGBT population.

Gay men and lesbians are more likely than bisexuals to see a lot of value in people knowing someone who is LGBT and in the influence of public figures who are open about being LGBT. College graduates are more likely than those without a college degree to see a large benefit from knowing someone who is LGBT and from the support of non-LGBT leaders for LGBT issues.

While pride events are seen as the least helpful in making society more accepting of the LGBT population, there are some important demographic differences. Non-white LGBT adults are more likely than whites to say these events help a lot in terms of bringing about greater social acceptance (36% vs. 24%, respectively). Younger LGBT adults have a more positive view of these events than their older counterparts. Among those ages 18 to 44, 33% say these events help a lot; this compares with 22% of those ages 45 and older. Finally, LGBT adults who have not graduated from college are about twice as likely as college graduates to say LGBT pride events help a lot (34% vs. 16%).

Barack Obama, Ellen DeGeneres Most Important Public Figures

SDT-2013-06-LGBT-2-06

LGBT respondents were asked to name public figures at the national level who have been important in advancing the rights of people who are LGBT. Two very different public figures stand out from all the rest: Barack Obama and Ellen DeGeneres. Roughly one-in-four LGBT adults (23%) named President Obama when asked for an important national figure in advancing LGBT rights. Some 18% named talk show host Ellen DeGeneres. DeGeneres made national news in 1997 when she came out publicly as a lesbian—first on “The Oprah Winfrey Show” and soon after on “The Ellen Show.”

Just one year ago, Obama announced that he supported same-sex marriage. He had opposed same-sex marriage in the past and spoke last year about the evolution of his views. Obama spoke again about same-sex marriage and LGBT rights more generally in his January 2013 inaugural address.

White and non-white LGBT adults are equally likely to point to Obama as an important public figure in advancing the LGBT rights. And there is no significant age gap in the share naming Obama as an important public figure.

Roughly equal shares of gay men (30%) and lesbians (24%) name Obama as an important figure in advancing LGBT rights. Not surprisingly, lesbians are more likely than gay men to name DeGeneres as an important figure (27% vs. 16%). And she has more bipartisan appeal than Obama: 19% of LGBT adults who identify with or lean toward the Democratic Party name DeGeneres as an important public figure, as do 15% of LGBT adults who identify with or lean toward the Republican Party. Democrats are much more likely than Republicans to name Obama (26% vs. 10%).

Voices: Which Public Figures, at the National Level, Have Been Important in Advancing LGBT Rights?

“Barack Obama helps a lot—I am amazed to have a sitting president supporting my right to marry. Also, the lawyers arguing the two Supreme Court cases, and the Supreme Court justices themselves.” –Lesbian, age 32

“Any and all elected government officials who support and accept that gay people deserve complete equality as citizens. I believe it was profoundly brave of President Obama to end the “don’t ask, don’t tell” policy.” –Gay man, age 60

“Ellen DeGeneres—I know it sounds corny, but she has been out for so long that it is no longer an issue, and older white women feel comfortable with her show. She normalizes LGBT people.” –Bisexual woman, age 31

“Well of course Ellen started something very big! But having celebrities like Wanda Sykes come out, get married, and have children has given more visibility to the lives of the LGBT community. And President Obama publicly declaring his changed views and support has been absolutely huge!” –Lesbian, age 33

“Anderson Cooper. By far the most influential person to come out publicly. Very well respected man and seen as a trusted member of the news corps.” –Gay man, age 43

“Politically? Hillary Clinton, Obama, and right now those Republicans who are now supporting the rights because one of their family members has come out. I think that’s going to help a lot. Public figures like celebrities? Anne Hathaway, Brad and Angelina, Pink.” –Bisexual woman, age 37

“I think the most influential public figures are the ones who were opposed to gay marriage previously, but have changed their perspective. Those with LGBT friends or family members are often the first to change their minds, and their admission is very powerful.” –Lesbian, age 45

LGBT/64

Some 3% of LGBT respondents name CNN’s Anderson Cooper and an equal share name Hillary Clinton when asked which public figures were important in advancing the rights of the LGBT population. Former representative Barney Frank and actor Neil Patrick Harris, both openly gay, were each named by 2% of respondents.

Other individuals who were mentioned by at least 1% of respondents include a mix of political figures: Joe Biden, Michelle Obama and Tammy Baldwin and entertainers and media personalities: Lady Gaga, Frank Ocean, Elton John, Rachel Maddow, George Takei and Wanda Sykes.11

Overall, LGBT adults are just as likely to point to political or civic leaders (31%) as they are to name well-known entertainers or media personalities (29%) when asked to name public figures who have been important in advancing the rights of the LGBT population. Many respondents couldn’t come up with an answer. Some 19% said they didn’t know of any public figures, and 30% refused to answer the question.

LGBT Views on Political Parties and Institutions

SDT-2013-06-LGBT-2-07

When it comes to politics, most LGBT adults are affiliated with the Democratic Party, and one very important reason for that may be that they believe that the Democrats are friendly toward them and that the Republicans are not.

About six-in-ten (57%) say the Democratic Party is generally friendly toward lesbian, gay, bisexual and transgender people. About one-third of LGBT adults (34%) say the Democratic Party is neutral toward them, and only 8% say the party is unfriendly.

Some 63% of LGBT adults say the Obama administration is friendly toward them, 30% say the administration is neutral toward them, and 6% say it is unfriendly. The LGBT population has a much different view of the Republican Party. Only 4% say the GOP is generally friendly toward people who are lesbian, gay, bisexual or transgender, while 76% say the party is unfriendly. An additional 19% views the Republican Party as neutral toward the LGBT population.

Gay men and lesbians are more likely than bisexuals to see the Democratic Party as friendly to the LGBT population and to see the Republican Party as unfriendly. Middle-aged and older LGBT adults also have a more favorable view of the Democrats than younger LGBT adults: 66% of those ages 45 and older say the Democratic Party is friendly to the LGBT population, compared with 51% of those ages 18 to 44. These two age groups are equally likely to view the Republican Party as unfriendly to the LGBT population.

Many LGBT adults who are Republican or lean toward the Republican Party share the view that the GOP is unfriendly to the LGBT population. Among this group, roughly half (47%) say the Republican Party is unfriendly to the LGBT population, and only 13% say the party is friendly. LGBT adults who are Democrats or lean to the Democratic Party overwhelmingly say the GOP is unfriendly to the LGBT population: 83% say this, while only 2% see the GOP as friendly.

SDT-2013-06-LGBT-2-08

Respondents were asked about a series of other institutions and organizations. Most LGBT adults (70%) view the entertainment industry as friendly toward people who are LGBT. Only 6% say the entertainment industry is unfriendly to the LGBT population, and 23% say the industry is neutral. Gay men stand out in this regard, with 80% saying the entertainment industry is friendly to the LGBT population. Lesbians and bisexuals are significantly less likely to express this view. Some 65% from each group say the entertainment industry is generally friendly to the LGBT population.

Of the four institutions tested in the poll, the entertainment industry is clearly viewed as being the friendliest toward people who are LGBT. The news media are perceived as being more neutral than friendly. About six-in-ten LGBT adults (56%) say the news media are neutral toward the LGBT population, while 27% view the media as friendly to the community and 16% say the media are unfriendly.

Even as it has taken steps to remove the barriers that have prevented gay and lesbian adults from serving openly, the military is viewed by many LGBT adults as being unfriendly toward them. Fully 47% say the military is unfriendly toward the LGBT population, while a similar share (44%) says the military is neutral. Only 8% say the military is friendly toward people who are LGBT. Lesbians and bisexuals are significantly more likely than gay men to view the military as unfriendly (51% of lesbians and 52% of bisexuals say so, compared with 39% of gay men).

Professional sports leagues have an even more negative image among LGBT adults. A majority (59%) say these leagues are unfriendly to the LGBT population. About one-third (36%) say pro sports leagues are neutral toward the LGBT population, and only 4% view them as friendly. Gay men, lesbians and bisexuals all express similar views about professional sports. Notably, since the survey was completed, two male athletes—NBA basketball player Jason Collins and professional soccer player Robbie Rogers—have revealed that they are gay.

Discrimination Persists Amid Social Progress

While they feel that social acceptance of the LGBT population has increased over the past decade and that it will increase even more in the future, most LGBT adults still feel, as a group, they are discriminated against. Fully half (53%) say there is a lot of discrimination against gays and lesbians, and an additional 39% say there is some discrimination. About one-in-ten say there is only a little discrimination against gays and lesbians (6%) or none at all (1%).12

There are no significant differences among gay men, lesbians and bisexuals in terms of the level of discrimination they perceive against gays and lesbians (55% of gay men, 61% of lesbians and 51% of bisexuals say there is a lot of discrimination).

SDT-2013-06-LGBT-2-09

LGBT adults are much more likely than the general public to say there is discrimination against gays and lesbians. In a 2013 Pew Research Center nationwide survey of all adults, 39% said there is a lot of discrimination against this group, and 33% say there is some discrimination. Roughly one-in-four adults (23%) said there is only a little discrimination or no discrimination against gays and lesbians.13

There is a significant age gap in views on this issue. Among the general public and the LGBT population, young adults (those ages 18 to 29) are more likely than their older counterparts to say there is discrimination against gays and lesbians these days. Fully half (52%) of all adults younger than 30 and 62% of LGBT adults in that age group say there is a lot of discrimination today against gays and lesbians.

The survey also asked about four other groups, each with its own legacy of discrimination: Muslim Americans, African Americans, Hispanic Americans and women. For both LGBT adults and the general public, Muslim Americans and gays and lesbians are seen as the two groups facing the most discrimination. LGBT adults are somewhat more likely than all adults to say there is a lot of discrimination against Muslim Americans (57% vs. 45%). Still, both groups rank Muslim Americans as facing more discrimination today than blacks, Hispanics or women.

About three-in-ten (28%) LGBT adults say there is a lot of discrimination against African Americans in our society today. The share is slightly lower among the general public (22%).

Roughly a quarter of LGBT adults (26%) and all adults (25%) say there is a lot of discrimination against Hispanics today. Among LGBT adults who are white and non-Hispanic, 23% say there is a lot of discrimination against Hispanics; 20% of all white, non-Hispanic adults say the same.

Within the LGBT population and among the general public, women are less likely than other groups to be viewed as victims of discrimination. Some 17% of LGBT adults and 15% of all adults say there is a lot of discrimination against women today. In both groups, women are much more likely than men to say their gender is discriminated against (the same share of LGBT women and all women, 21%, say there is a lot of discrimination against women).

LGBT Status Makes Some a Target

SDT-2013-06-LGBT-2-10

Many lesbian, gay, bisexual and transgender adults say they have experienced discrimination on a personal level because of their sexual orientation or gender identity. The survey included six types of incidents—ranging from poor service in restaurants to physical attacks—and found that two-thirds of all LGBT respondents (66%) had experienced at least one of them.

The most common occurrence among the survey respondents is being the subject of slurs or jokes. Some 58% of LGBT adults say they have experienced this at some point, including 16% who say this has happened to them in the past year.

About four-in-ten (39%) say they have been rejected by a friend or family member at some point; 6% say this has happened to them in the past 12 months.

Three-in-ten LGBT adults say they have been threatened or physically attacked (4% in the past year). And a similar share (29%) say they have been made to feel unwelcome at a place of worship or religious organization (6% in the past year).

SDT-2013-06-LGBT-2-11

About one-in-four LGBT adults (23%) have received poor service in a restaurant, hotel or other places of business, with 5% saying this has happened to them in the past 12 months. And 21% of LGBT adults say they have been treated unfairly by an employer in hiring, pay or promotions (5% in the past year).

Gay men and lesbians are significantly more likely than bisexuals to have had these types of experiences. Fully 84% of gay men say they have experienced at least one of these things, as do 73% of lesbians. This compares with 49% of bisexuals. Gay men are the most likely to have experienced several of these things—33% of gay men say four or more of things have happened to them compared with 22% of lesbians and 16% of bisexuals.

SDT-2013-06-LGBT-2-12

There are two types of experiences where gay men stand out in particular: being subjected to jokes or slurs and being physically attacked or threatened. About eight-in-ten gay men (79%) say they have been subjected to jokes or slurs in the past; 21% say they have dealt with this in the last 12 months. By comparison, 60% of lesbians have ever been subjected to jokes or slurs, as have 40% of bisexuals.

There are other types of incidents that gay men and lesbians are equally likely to have experienced: being rejected by a friend or family member; being made to feel unwelcome at a place of worship or religious organization; receiving poor treatment in a restaurant, hotel or other place of business; and being treated unfairly by an employer. In most cases, bisexuals are significantly less likely to report having experienced such an incident.

Among all LGBT adults, whites and non-whites are equally likely to have experienced these types of discrimination. And there are few significant differences by age. LGBT adults under age 45 are somewhat more likely than older LGBT adults to say they have been made to feel unwelcome at a church or religious organization (32% vs. 24%). But there is no age gap on the other items tested in the poll.

LGBT adults living in the South are more likely than those living in the Northeast and Midwest to have experienced four or more of these incidents—29% vs. 18% for the Northeast and 19% for the Midwest. LGBT adults living in the West are not statistically different from any of the three regional groups in this regard (22% say they’ve experienced four or more of these incidents).

Chapter 3: The Coming Out Experience

For lesbians, gay men, bisexuals and transgender people, realizing their sexual orientation or gender identity and sharing that information with family and friends is often a gradual process that can unfold over a series of years. This section looks at the process of coming out—when and how it happens, how difficult it is, and what impact it has on relationships.

This section also explores the interactions LGBT adults have outside of their circles of family and close friends—in their communities and workplaces. Some seek out neighborhoods that are predominantly LGBT, but most do not. A majority of employed LGBT adults say their workplaces are accepting of people who are lesbian, gay, bisexual or transgender. Still, about half say only a few or none of their co-workers know about their sexual orientation or gender identity.

Ultimately, these journeys are personal and hard to quantify. Survey respondents were invited to elaborate on their experiences, and many of their stories are captured in an interactive feature on the Pew Research Center website.

Interactive: LGBT Voices

Explore some 300 quotes from LGBT survey respondents about their coming out experiences.

How Many of the Important People in Your Life Know?

SDT-2013-06-LGBT-3-01

The vast majority of LGBT respondents (86%) say they have told one or more close friends about their sexual orientation or gender identity. And some 54% say all or most of the important people in their life know that they are lesbian, gay, bisexual or transgender.

There are large differences here across LGB groups. Lesbians and gay men are more likely than bisexuals to have told at least one close friend about their sexual orientation (96% of gay men and 94% of lesbians, compared with 79% of bisexuals). And they are much more likely to say that most of the people who are important to them know about this aspect of their life: 77% of gay men and 71% of lesbians say all or most people know, compared with 28% of bisexuals. Among bisexuals, there are large differences between men and women in the share who say the people closest to them know that they are bisexual. Roughly nine-in-ten bisexual women (88%) say they have told a close friend about their sexual orientation; only 55% of bisexual men say they have told a close friend. Similarly, while one-third of bisexual women say most of the important people in their life know they are bisexual, only 12% of bisexual men say the same. Furthermore, 65% of bisexual men say that only a few or none of the important people in their life know they are bisexual.

Among all LGBT adults, those with a college degree are more likely than those who have not graduated from college to say all or most of the important people in their life know they are lesbian, gay, bisexual or transgender (64% vs. 49%). There are no significant differences across age groups. Similar shares of young, middle-aged and older LGBT adults say most of the important people in their life are aware of their sexual orientation or gender identity. There is an age gap among bisexuals, however, with bisexuals under the age of 45 much more likely than those ages 45 or older to say most of the important people in their life know that they are bisexual (32% and 18%, respectively).

Growing Up LGBT

SDT-2013-06-LGBT-3-02

Lesbian, gay and bisexual survey respondents were asked how old they were when they first felt they might be something other than straight or heterosexual.14 The median age across all LGB adults is 12, although there are some differences across groups. Gay men report, on average, thinking around age 10 that they might not be straight. For both lesbians and bisexuals, the median age is 13.

Among gay men, about four-in-ten (38%) say they were younger than 10 when they first felt they were not heterosexual. By comparison 23% of lesbians and 18% of bisexuals say they were younger than 10 when they first started to question their sexuality.

The vast majority of lesbians, gay men and bisexuals say they were in their teens or younger when they first started to feel they might not be straight. Only 7% were in their twenties, and 4% were 30 or older. Gay men are the least likely to report first having these feelings in their twenties or beyond: 3% say they were 20 or older, compared with 14% of lesbians and 15% of bisexuals.

After these initial feelings, it took some time for most LGBT adults to be sure of their sexual orientation or gender identity.15 Among LGBT adults who say they know for sure that they are lesbian, gay, bisexual or transgender (92%), 17 is the median age at which they say they knew.

Relatively few LGBT adults (5%) say they were sure about their sexual orientation or gender identity before they were age 10. A majority (59%) say they knew between the ages of 10 and 19. One-in-five say they knew for sure they were lesbian, gay, bisexual or transgender when they were in their twenties, and 8% say it wasn’t until they were 30 or older. Some 6% say they still aren’t entirely sure.

Again, gay men reached this milestone, on average, sooner than lesbians and bisexuals. The median age at which gay men say they were sure they were gay is 15. For lesbians, the median age when they were certain about their sexual orientation was 18, and for bisexuals it was 17.

Telling Friends and Family

SDT-2013-06-LGBT-3-03

The next step in the process for many people is telling a close friend or family member that you are or might be lesbian, gay, bisexual or transgender. For a small share of respondents in the Pew Research survey, this is a step they have not yet taken and may never take. Some 4% of gay men and 5% of lesbians say the fact that their sexual orientation has not come up with close friends or family members. Bisexuals are much more likely to fall into this category—24% say the fact that they are bisexual has not come up with friends and family.

Among those who have told a friend or family member about their sexual orientation or gender identity, the median age at which they did this was 20. The median age is slightly lower for gay men (18) than lesbians (21) or bisexuals (20).

SDT-2013-06-LGBT-3-04

There are modest differences on this measure by age group among gay men and lesbians.16 The median age at which gay men and lesbians younger than 30 say they first told a close friend or family member is 17. Among those ages 30 to 49, the median age is 20, and for those ages 50 and older, the median age is 21.

Among gay men and lesbians under age 30, 24% say they first told a friend or family member that they were gay or lesbian before the age of 15. This compares with 8% of gay men and lesbians between the ages of 30 to 49 and 3% of those ages 50 and older. Fully two-thirds of gay men and lesbians under age 30 say they shared their sexual orientation with a friend or family member before they were 20 years old. This compares with 47% of those ages 30 to 49 and 35% of those ages 50 and older.

SDT-2013-06-LGBT-3-05

These age gaps may be related to the fact that younger adults who may not yet identify themselves as lesbian, gay, bisexual or transgender (but may in the future) would not qualify to be included in the survey. Therefore, by definition, these younger adults could not have waited until they were age 30 or older to tell someone they were gay or lesbian. Even so, these age gaps may reflect the changes that have taken place in society over the past decade or so. As the public has become more accepting of the LGBT population, it may be that gay men and lesbians feel more comfortable sharing their sexual orientation at an earlier age.

It is important to note that many LGBT adults followed a different sequence in coming to realize their sexual orientation or gender identity and beginning to share it with others. Some individuals first felt they might be something other than straight, then told someone about it, but are still not entirely sure. Others may know for certain that they are lesbian, gay, bisexual or transgender but may have never shared this information with anyone.

Telling Mom and Dad

An important milestone for many lesbians, gay men, bisexuals and transgender people is telling their parents about their sexual orientation or gender identity. Overall, LGBT adults are more likely to have shared this information with their mothers than with their fathers. Most say telling their parents was difficult, but relatively few say it damaged their relationship.

SDT-2013-06-LGBT-3-06

Some 56% of LGBT adults say they have told their mother that they are lesbian, gay, bisexual or transgender. About one-third (34%) say they have not told their mother, and an additional 10% say this is not applicable to them because their mother is not a part of their life or died before they could tell her.

Roughly four-in-ten LGBT adults (39%) say they have told their father about their sexual orientation or gender identity. The same share say they have not told their father. An additional 21% say that their father is deceased or that they have no relationship with him.

Overall, LGBT adults are much more likely to have told a close friend that they are lesbian, gay, bisexual or transgender than they are to have told one of their parents. Fully 86% say they have shared this information with a close friend.

Across LGB groups, gay men and lesbians are much more likely than bisexuals to have told their parents about their sexual orientation. Fully 70% of gay men and 67% of lesbians have told their mother, compared with 40% of bisexuals. Similarly, 53% of gay men and 45% of lesbians have told their father, compared with only 24% of bisexuals.

SDT-2013-06-LGBT-3-07

There is a significant difference here between bisexual men and women. Fully 47% of bisexual women say they have told their mother that they are bisexual compared with 22% of bisexual men. And while 29% of bisexual women have told their father about their sexual orientation, only 8% of bisexual men have done the same.

LGBT respondents who said that they have not told their parents about their sexual orientation or gender identity were asked in an open-ended question why they had not shared this information. Two main reasons emerged. First, many respondents say it was not important to tell their parent or that the subject never came up. About one-in-four respondents (27%) who have not told their mother gave this as a reason, as did 21% who have not told their father.

Bisexuals are much more likely than gay men and lesbians to say their sexual orientation never came up with their parents or that raising the subject was not important to them. Among those who have not told their mothers, 34% of bisexuals and 16% of gay men and lesbians gave this type of explanation when asked why they hadn’t told her.17 The pattern is similar among LGB adults who said they have not told their father about their sexual orientation.

The second-most common response given by LGBT adults in explaining why they did not tell their mother or father about their sexual orientation or gender identity was that they assumed their parent would not be accepting or understanding of this, or they worried about how it would affect their relationship with their parent. Among LGBT respondents who have not told their mother, 22% gave this type of explanation; 20% of those who haven’t told their father gave a similar reason. There are no significant differences here between gay men, lesbians and bisexuals.

One-in-five gay men and lesbians who have not told their mother about their sexual orientation say they never told her because she already knew or someone else told her. A much smaller share of bisexuals says this—only 7% say they didn’t tell their mother, but that she already knew. Among LGB adults who have not told their father about their sexual orientation, 13% of gay men say this is because he already knew, as well as 17% of lesbians and 5% of bisexuals.

For LGBT adults who have not told their father that they are lesbian, gay, bisexual or transgender, about one-in-ten (12%) say they didn’t tell him because they do not have a close relationship with him. This is less of a factor with mothers: Only 4% of LGBT respondents say they haven’t told their mother about their sexual orientation because their relationship is not close.

Voices: Why Didn’t You Tell Your Mother or Father?

Mother:

“My mom strongly upholds all of the views of her church and one of those is being totally anti-gay. She is very conservative and not very accepting.” – Lesbian, age 65

“It was experimentation. I didn’t think it was any of her business, as it was none of her business how many men partners I had.” – Bisexual woman, age 61

“Don’t want to stress her out. Her oldest brother was casualty of the AIDS epidemic in the early 90s.” – Gay man, age 43

“I always felt she already knew. I always meant to have ‘the conversation’ but the time never seemed right.” – Gay man, age 57

“It’s just never come up. I rarely discuss details of my love life with anyone since I am a deeply private person. If I were to make a serious commitment to another woman, I would tell my mother about it” – Bisexual woman, age 39

Father:

“This is not a subject to discuss or tell anyone about, ever, except those with whom I may enjoy having sex with. It’s not my identity. It is an activity – like bowling, or gardening, or pick-up basketball games in the neighborhood, or joining the PTA – except that it’s more intimate & personal, as a matter of discretion and respect for proper behavior in polite society.” – Bisexual woman, age 54

“I doubt he would have any clue what I was talking about or why I was bringing it to him or what it meant.” – Transgender person, age 19

“He’s very religious and he observed my orientation before I outwardly expressed it. It was like a silent acknowledgement but not acceptance.” – Lesbian, age 58

“Unless I decide to be with a girl long term, there is no reason for him to know.” – Bisexual woman, age 25

“He was homophobic, plus we had a rocky relationship. I was very conflicted about him. I wanted his love.” – Gay man, age 86

[I’m]

LGBT/44new,45new

It Was Hard, but It Was Worth It

SDT-2013-06-LGBT-3-08

For those LGBT adults who have told one or both parents about their sexual orientation or gender identity, most say it was not easy. However, on balance, they say their relationship either grew stronger or didn’t change after sharing this information. Relatively few say their relationship grew weaker.

Among those respondents who say they have told their mother, 59% say it was difficult to tell her; 40% say it was not difficult. Gay men and lesbians are more likely than bisexuals to say telling their mother about their sexual orientation was a difficult thing (64% of gay men and 65% of lesbians say it was difficult, vs. 48% of bisexuals).

Four-in-ten LGBT adults (39%) who say they have told their mother about their sexual orientation say, since telling her, that their relationship has grown stronger. An additional 46% say their relationship with their mother has not changed, and 14% say their relationship has grown weaker. Lesbians are twice as likely as gay men to say telling their mother about their sexual orientation hurt their relationship (23% of lesbians say the relationship grew weaker, compared with 12% of gay men).

For those who have told their father that they are lesbian, gay, bisexual or transgender, the pattern is much the same. About two-thirds (65%) say it was difficult to tell their father about their sexual orientation or gender identity, while 34% say it was not difficult. Gay men are about as likely as lesbians to say it was hard to share this information with their father (74% of gay men vs. 63% of lesbians).

SDT-2013-06-LGBT-3-09

Since telling their father, some 54% of LGBT adults say their relationship has not changed, and an additional 32% say it has grown stronger (32%). Some 13% say telling their father made their relationship weaker. Gay men and lesbians are more likely than bisexuals who have told their father about their sexual orientation to say this made their relationship stronger.

Brothers and Sisters

Among lesbian, gay, bisexual and transgender adults who have a sibling, roughly six-in-ten say they have told their siblings about their sexual orientation or gender identity. Two-thirds (65%) have told a sister, and 59% have told a brother.

Gay men and lesbians are more likely than bisexuals to have shared this information with a sister or brother. Among gay men and lesbians who have at least one sister, large majorities say they have told a sister about their sexual orientation (75% of gay men and 80% of lesbians). By contrast, only 50% of bisexuals say they have told a sister that they are bisexual. Similarly, roughly three-quarters of gay men (74%) and lesbians (76%) with at least one brother say they have told a brother about their sexual orientation, compared with 42% of bisexuals.

Voices: Tell Us More About Your Coming Out Experience

“It is always nerve-wracking when I come out to someone, but I have had a positive reaction from everyone I have told, except for my dad. My mom and I were already very close, so it didn’t affect our relationship. Nearly everyone in my life knows, and if someone new comes into my life, I tell him or her. If this person cannot accept that I am gay, then he or she does not need to be a part of my life.” –Lesbian, age 25, first told someone at age 13

“There were two friends from my high school days who I lost after coming out to them. That was painful. They had always said they believed in everyone being their own person and living their own life, so this was a surprise when they trotted out the “see a shrink” line and wouldn’t talk to me anymore. Plus, we’d just been through the ’60s and the Summer of Love and all that – I expected more open minds. Everyone else has been great, and for 40+ years I have never hesitated about or regretted being out.” –Lesbian, age 58, first told someone at age 17

“Coming from a strong evangelical Christian upbringing, and still applying that to my life, it’s been difficult. A lot of people (some or most of my family included) don’t approve or want to have anything to do with it, and choose to ignore my partner.” –Lesbian, age 28, first told someone at age 16

“I wish I would have told people sooner. I came of age when AIDS first emerged and homophobia was acceptable. I wasted too many years being afraid of my sexuality and making choices that allowed me to hide in the background of life. I was sort of a professional wallflower.” –Gay man, age 43, first told someone at age 22

“The most difficult part was acknowledging this in myself. Telling my best friend wasn’t too hard. I was nervous, even though he told me afterwards that he had known for a while. None of my other friends or family members know and I don’t plan on telling them unless absolutely necessary. I’m comfortable with myself, but am afraid of the reactions that I will receive should I divulge this information to those with whom I am closest.” –Bisexual woman, age 20, first told someone at age 20

“In the beginning, it was difficult, but always ended up positive. Nowadays, there really is no decision. I simply have a sexual orientation the same as anyone else, and talk about my partner, etc., the same way anyone mentions their opposite-sex spouse, and there’s no “event” associated with it.” –Gay man, age 57, first told someone at age 21

“The hardest thing is just… there’s really no good way to bring it up. You almost hope people will ask, because it’s just sort of a burden, carrying around a secret. For my parents, I was mostly worried that they wouldn’t take it seriously and treat it as a phase. For my friends, I was scared they would think I was hitting on them. I come from a pretty Catholic, Midwestern town, so it was rough.” -Bisexual woman, age 20, first told someone at age 14

“It was extremely difficult to come out to my family. I didn’t do so until I was in my 30’s. Thankfully, my family said they loved me no matter what. Many of my friends weren’t as fortunate to have such a positive response. It’s still not something my family really discusses but I am happy that I was finally able to share my orientation with them.” -Bisexual woman, age 41, first told someone at age 17

“It’s always on a case by case basis. Those who love me and truly care for me have, of course, been the most understanding. My brother has actually taken the news the best; much better than I even expected. He’s met the current guy I’m dating and they hit it off well.” -Bisexual man, age 31, first told someone at age 18

“My first ‘coming out’ was in a Facebook post. My friends have been cool; they generally use the right pronouns once that was explained and they all call me my chosen name now which is just wonderful. Now on the internet and in association with peers and fan culture, I am out. The people I am not out to generally include adults, such as coworkers or friends parents, and my own family – I don’t feel that, as the average person (and not in a more accepting youthful age), they would really ‘believe’ in nonbinary genders or understand me saying that I am one.” –Transgender person, age 19

LGBT/50

Interactive: LGBT Voices

Explore some 300 quotes from LGBT survey respondents about their coming out experiences.

Cities, Towns, Neighborhoods

SDT-2013-06-LGBT-3-10

Most LGBT adults (70%) say there is at least some social acceptance of the lesbian, gay, bisexual, and transgender population in the city or town where they live. But relatively few (29%) say there is a lot of acceptance. About three-in-ten say there is only a little (23%) or no acceptance (4%) of people who are LGBT in their community.

Gay men and lesbians are more likely than bisexuals to say there is a lot of social acceptance of the LGBT population in their city or town. Four-in-ten gay men (39%) and 31% of lesbians, compared with 20% of bisexuals, say there’s a lot of acceptance where they live.

SDT-2013-06-LGBT-3-11

Among gay men and lesbians, perceptions about social acceptance differ by region of the country. Those living in the West (51%) are more likely than those living in the South (29%) or Midwest (29%) to say there is a lot of acceptance of LGBT individuals in their city or town. At the same time, Midwesterners are more likely than those living in any other region to say there is some acceptance in their community of LGBT individuals (52% of gay men and lesbians living in the Midwest say this, compared with 35% or less of those living in the Northeast, South or West). Gay men and lesbians living in the South are much more likely than those living in the West or Midwest to say there is only a little or no acceptance of the LGBT population where they live (36% in the South vs. 19% in the Midwest and 18% in the West). Gay men and lesbians with a college degree and those with annual incomes of $75,000 or higher are among the most likely to say there is a lot of acceptance of the LGBT population in the city or town where they live. Among college graduates, 48% say there is a lot of acceptance. This compares with only 29% of those without a college degree. Similarly, among those with an income of $75,000 or higher, 51% say there is a lot of acceptance where they live, while only 32% of those with lower incomes say the same.

Regardless of how they feel about the level of social acceptance in their city or town, most LGBT adults say this is not a reason why they live in that particular place. Only 12% say the level of social acceptance in their city or town is a major reason for living there. One-in-five say this is a minor reason. Fully two-thirds (67%) say this is not a reason at all.

SDT-2013-06-LGBT-3-12

LGBT adults who say there is a lot of acceptance of people who are lesbian, gay, bisexual and transgender in their city or town are much more likely to say this is an important reason why they live there than are those who say there is little or no acceptance of the LGBT population in their community. About four-in-ten respondents (38%) who say there is at least some acceptance of LGBT individuals in their community also say this is a major or minor reason for living there. Among those who say there is little or no acceptance in their city or town, only 15% say the level of social acceptance is a reason they live there.

Overall, gay men and lesbians are more likely than bisexuals to say the level of social acceptance in the city or town where they live is an important reason why they live there. Some 23% of gay men say this is a major reason, and 13% of lesbians say the same. Only 3% of bisexuals say the level of social acceptance of LGBT adults is a major reason for living in their city or town.

Among gay men and lesbians, there is a significant age gap on this measure. Gay men and lesbians under age 45 are much more likely than those ages 45 and older to say the level of social acceptance in their city or town is a reason why they live there. Among those ages 18 to 44, about half (48%) say the level of social acceptance is at least a minor reason why they live in their city or town. This compares with only 33% of gay men and lesbians who are 45 and older. Among the older age group, 67% say this is not a reason why they live in their community.

Gay men and lesbians with a college degree are more likely than those who have not completed college to say the level of social acceptance in their city or town is one reason for living there (49% of college graduates say this is a major or minor reason, compared with 35% of non-college graduates).

LGBT Neighborhoods

SDT-2013-06-LGBT-3-13

Among all LGBT respondents to the Pew Research survey, relatively few (12%) say they currently live in a neighborhood known for being an LGBT neighborhood. An additional 14% say that while they do not currently live in an LGBT neighborhood, they have lived in one in the past. Fully 72% say they have never lived in an LGBT neighborhood.

Gay men are more likely than lesbians to have lived in an LGBT neighborhood at some point in their life. Three-in-ten gay men (32%), compared with 18% of lesbians, either live in this type of neighborhood now or did in the past. Among bisexuals, 26% live or have lived in an LGBT neighborhood. Bisexual women (29%) are much more likely than bisexual men (17%) to have done this.

Among gay men and lesbians, the more important they say their sexual orientation is to their overall identity, the more likely they are to have lived in an LGBT neighborhood. Fully one-third (35%) of those who say being gay or lesbian is extremely or very important to their overall identity either live in an LGBT neighborhood now or have lived in one in the past. This compares with only 21% of those who say their sexual orientation is less important to their overall identity. Some 78% of this group have never lived in an LGBT neighborhood.

Among all LGBT adults, non-whites are more likely than whites to have lived in an LGBT neighborhood (31% of non-whites vs. vs. 23% of whites say they have ever lived in this type of neighborhood). There is no significant difference by age in the share of LGBT adults who either live in an LGBT neighborhood or have done so in the past, but LGBT adults ages 45 and older are more likely than younger LGBT adults to say they did this in the past, but are not currently living in this type of neighborhood. There are no differences by relationship status either. LGBT adults who are married or living with a partner are just as likely as those who are not in a relationship to say they have lived in an LGBT neighborhood.

Friends and Co-Workers

SDT-2013-06-LGBT-3-14

For lesbians, gay men, bisexuals and transgender adults, their close friends are a mix of people who are LGBT and people who are not. Only 12% of all LGBT adults say all or most of their close friends are LGBT. An additional 42% say some of their close friends are LGBT, about one-third (35%) say only a few of their friends are LGBT, and 9% say none of their friends are.

There are significant differences across LGB groups. Gay men are more likely than lesbians or bisexuals to have a lot of LGBT friends. Some 22% of gay men say all or most of their close friends are LGBT, compared with 12% of lesbians and 5% of bisexuals. Among bisexuals, fully half say only a few (41%) or none (12%) of their friends are LGBT. Bisexual men are much more likely than bisexual women (67% vs. 47%) to say only a few or none of their close friends are LGBT.

Not surprisingly, lesbian, gay, bisexual and transgender adults who have lived in an LGBT neighborhood are more likely than those who have not to have a lot of LGBT friends. Among those who live in an LGBT neighborhood now or have in the past, 21% say all or most of their friends are LGBT. Among those who haven’t lived in this type of neighborhood, only 10% say the same.

Finding Acceptance at Work

Among LGBT adults who are employed full or part time, most say that their workplace is accepting of employees who are lesbian, gay, bisexual or transgender. About half (51%) say their workplace is very accepting, while 35% say it is somewhat accepting. Only 13% say their workplace is either not too accepting (11%) or not at all accepting (2%).18

Gay men find their workplaces somewhat more accepting than do bisexuals. Among employed gay men, 60% say their workplace is very accepting of gay men. Half of working lesbians say that their workplace is very accepting of lesbian employees, and 44% of bisexuals say their workplace is very accepting of bisexual employees.

Although they seem to find at least some acceptance at work, only one-third of employed LGBT adults say all or most of the people they work closely with at their job are aware of their sexual orientation or gender identity. An additional 18% say some of the people they work closely with know they are lesbian, gay, bisexual or transgender. Some 22% say only a few of their co-workers know this, and 26% say no one at work knows.

There are big gaps here across LGB subgroups. About half of gay men (48%) and lesbians (50%) who work say all or most of the people they work with closely at their job know that they are gay or lesbian. Among bisexuals, only 11% say most of their closest co-workers know they are bisexual. Fully seven-in-ten bisexuals who work say only a few or none of the people they work closely with at their job know they are bisexual.

Going Online

SDT-2013-06-LGBT-3-15

People who identify as lesbian, gay, bisexual, or transgender are more socially active on social networking sites than the general public, but this is likely due in part to the relative youth of the LGBT population. Eight-in-ten (80%) LGBT adults report ever using social networking sites. By comparison, in a February 2012 Pew Research survey of the general public, only 58% of adults (and 68% of adult internet users) said the same. However, equal shares of LGBT adults ages 18 to 29 and all adults ages 18 to 29 say they have ever used social networking sites—89% and 90% respectively.

Some 54% of LGBT social networking site users say they have referred to being LGBT or revealed their sexual orientation or gender identity on a social networking site. Gay men (69%) and lesbians (62%) are more likely to say they have done this than bisexuals (40%). Younger LGBT social networking site users are also more likely to be open about their sexual or gender identities online than older users. Some 58% of those ages 18 to 44 say they have revealed their identity on a social networking site compared with 46% of those ages 45 and older.

Overall, about half (55%) of LGBT adults say they have made new LGBT friends online or through a social networking site. Gay men are more likely to say they have met new LGBT friends online (69%) than either lesbians (47%) or bisexuals (49%).

Though social networking sites are popular among LGBT internet users and many have made LGBT friends online, using the internet to discuss LGBT issues is less common. According to the Pew Research survey, only 16% of LGBT adults say they regularly discuss LGBT issues online or on a social networking site. Gay men (20%) are more likely to do this compared with bisexual men (7%). Some 16% of bisexual women and 14% of lesbians also say they regularly discuss LGBT issues online.

Happiness

SDT-2013-06-LGBT-3-16

When they are asked, in the most general terms, how happy they are with their life overall, LGBT adults are less upbeat than the general public. Only 18% of LGBT respondents say they are very happy compared with 30% of the general public.19 About two-thirds (65%) of LGBT respondents say they are pretty happy and 16% say they are not too happy. Among all adults, 57% say they are pretty happy and 13% say they are not too happy.

There is no significant difference across LGBT groups in the share saying they are very happy. Roughly one-in-five gay men (18%), lesbians (20%) and bisexuals (16%) are very happy.

Among all LGBT adults, there is some variation in happiness across age groups. Nearly equal shares of young, middle-aged and older LGBT adults say they are very happy. However, those under age 50 are much more likely than those ages 65 and older to say they are not too happy (19% vs. 6%).

There are bigger gaps by income. LGBT adults with annual family incomes of $75,000 or higher are about twice as likely as those with lower incomes to say they are very happy (32% vs. 15%). LGBT adults at the lowest end of the income scale (with annual incomes of less than $30,000) are about twice as likely as those in the middle- and highest-income brackets to say they are not too happy (23% vs. 12% for middle and high-income LGBT adults).

There is a similar income gap in happiness among the general public. Among all adults, about one-in-four (25%) of those with annual household incomes of less than $30,000 say they are not too happy with their lives overall. This compares with 13% of those making between $30,000 and $74,999 and only 6% of those making $75,000 or more. LGBT adults are more likely than all adults to fall into the lowest income category (with annual family incomes of less than $30,000). This is due in part to the fact that fewer of them are married and living in dual income households (see Chapter 1 for more details).

SDT-2013-06-LGBT-3-17

Those who are married or living with a partner are significantly happier than those who are not.20 Some 26% of LGBT adults who are married or living with a partner say they are very happy, compared with 14% of those who are not. The pattern is similar among the general public, although the happiness gap between married and unmarried adults is not as wide among all adults as it is among those who are LGBT.

Perceptions of how much social acceptance there is of gay, lesbian, bisexual and transgender people these days is also related to personal happiness. A large majority of LGBT adults (77%) say that there is at least some social acceptance of the LGBT population today. Those who say there is a lot of acceptance are happier than those who say there is little or no acceptance. Among those who see a lot of social acceptance, 26% are very happy. This compares with 13% of those who see little or no acceptance. Among those who say there is some acceptance, 17% are very happy.

Trust in Others

SDT-2013-06-LGBT-3-18

About four-in-ten (39%) LGBT adults say that, in general, “most people can be trusted” while 60% say “you can’t be too careful dealing with people.” This is nearly identical to the balance of opinion within the general public.

Bisexuals are somewhat less likely than lesbians and gay men to say that most people can be trusted. There are big differences in trust between bisexual men (45% say most people can be trusted) and women (29%).

Both in the general public and among LGBT adults, younger people are less likely than others to say that most people can be trusted.

Chapter 4: Marriage and Parenting

Support for the legal right to marry and adopt children is nearly universal within the LGBT population. Still, LGBT adults are less likely than the general public to want to marry or have children. These differences may be related to the fact that marriage—and to some degree, parenting—have been legally off-limits to most LGBT adults.

The survey finds that 16% of LGBT adults—mostly bisexuals in opposite-sex relationships—are currently married, compared with about half of adults in the general public. Overall, a total of 60% of LGBT respondents are either married or would like to marry one day, while 27% say they are not currently sure if they want to marry someday. As for the general public, a similar question on a 2010 Pew Research survey found that 76% of adults were either currently married or thought they wanted to get married, and 13% said they were not sure.21

The new survey also finds that 35% of LGBT adults are parents, compared with 74% of adults in the general public. About half of LGBT respondents (51%) either have children or want to; an additional 19% say they are not sure. A May 2013 Pew Research survey that asked a slightly different question (with no explicit option for “not sure”) found that 91% of all adults either have or want children, with an additional 1% volunteering that they are not sure.

Within the LGBT population, gay men are less likely than lesbians to say they are currently a parent or would like one day to become one. Bisexuals are more likely than gay men and lesbians to already be parents.

LGBT adults are somewhat divided on whether the issue of same-sex marriage should play as prominent a role as an LGBT issue as it has in recent years. Some 58% of survey respondents agree that same-sex marriage should be the top priority right now, but 39% say the issue is taking too much focus away from other important issues, such as equal employment rights.

Views on Same-Sex Marriage

SDT-2013-06-LGBT-4-01

An overwhelming majority of lesbian, gay, bisexual and transgender adults favor allowing gay men and lesbians to marry legally.22 Fully three-quarters (74%) say they strongly favor this, and an additional 18% say they favor same-sex marriage, though not as strongly. Just 7% of LGBT adults say they oppose or strongly oppose same-sex marriage.

Among the general public, support for same-sex marriage has grown markedly over the past decade, but it still falls well below the levels registered within the LGBT population. In a May 2013 Pew Research poll, 51% of Americans said they either strongly favor (21%) or favor (30%) allowing gay men and lesbians to marry legally. About four-in-ten (42%) Americans say they oppose same-sex marriage, with about two-in-ten (19%) saying they strongly oppose it. In 2003, just one-third (32%) of Americans supported same-sex marriage.23

Among LGBT respondents, a greater share of gay men and lesbians than bisexuals strongly favors same-sex marriage. Some 80% of gay men and 85% of lesbians say they are strongly in favor of same-sex marriage, as are 69% of bisexuals. Among bisexuals, women (73%) are more likely than men (56%) to say they strongly favor allowing same-sex couples to marry legally.

There are large differences by age among the general public on the question of same-sex marriage. Americans who are younger than 30 are the most likely to favor same-sex marriage (65% say “strongly favor” or “favor”), and those ages 30 to 49 (54%) are more likely than those ages 50 to 64 (45%) or 65 and older (39%) to favor same-sex marriage. By contrast, among LGBT respondents, at least nine-in-ten in all age groups favor allowing same-sex marriage, though a slightly larger share of LGBT adults ages 18 to 29 than those ages 30 and older say they strongly favor same-sex marriage (82% vs. 71%).

While a majority of all demographic subgroups within the LGBT population favor allowing same-sex marriage, the party and religious divisions on this issue that are evident among the general public are also present to some extent among LGBT adults.

For example, while 81% of LGBT adults who identify with or lean toward the Democratic Party say they strongly favor same-sex marriage, only 45% of LGBT adults who identify with or lean toward the Republican Party say the same. Still, most LGBT Republicans favor allowing same-sex marriage; in all, 78% of LGBT Republicans and 96% of LGBT Democrats either strongly favor or favor same-sex marriage. And compared with Republicans overall, LGBT Republicans are far more accepting of same-sex marriage; only 34% of adults in the general public who identify with or lean toward the Republican Party favor allowing gay men and lesbians to marry legally, with 10% saying they strongly favor this.24

Religiously affiliated LGBT adults are somewhat less supportive of same-sex marriage than those who are religiously unaffiliated. About two-thirds (67%) of the religiously affiliated say they strongly favor same-sex marriage, compared with 82% of those who are atheist, agnostic or have no particular religion. In all, 90% of religiously affiliated LGBT adults either strongly favor or favor same-sex marriage, while 96% of LGBT adults who are not affiliated with a faith favor it. Among religiously affiliated adults in the general public, 47% say they favor same-sex marriage, with just 17% saying they strongly favor it.25

SDT-2013-06-LGBT-4-02

Even with such strong support for same-sex marriage, not everyone in the LGBT population places the issue at the top of the community’s policy agenda. Respondents were asked which statement came closer to their views: “The push for same-sex marriage has taken too much focus away from other issues important to LGBT people” or “Same-sex marriage should be the top priority for LGBT people right now, even if this means some other issues do not get much attention.” Overall, about four-in-ten survey respondents (39%) say the push for same-sex marriage has taken too much focus away from other important issues, while 58% say that same-sex marriage should be the top priority for LGBT people right now.

Among LGBT adults, lesbians (71%) are the most likely to say that same-sex marriage should be the top priority right now. About six-in-ten bisexuals (58%) and gay men (57%) say the same.

Reasons for Getting Married

SDT-2013-06-LGBT-4-03

Despite the differences between LGBT adults and the general public on the issue of same-sex marriage, both groups have similar views about the most important reasons to marry. Nearly identical shares of LGBT adults (84%) and all adults (88%) say love is a very important reason to marry, and for each group love ranks at the top of the list of seven possible reasons.

“Companionship” and “making a lifelong commitment” rank second and third for both LGBT adults and the general public. Fully 71% of LGBT adults and 76% of the general public say companionship is a very important reason to get married. When it comes to making a lifelong commitment, LGBT adults are somewhat less likely than all adults to say this is a very important reason to marry (70% vs. 81%).

A greater share of LGBT adults than the general public say that the “legal rights and benefits” of marriage (46% vs. 23%) and “financial stability” (35% vs. 28%) are very important reasons to get married.

Meanwhile, the general public is much more likely than LGBT respondents to say “having children” (49% vs. 28%) and “having a relationship recognized in a religious ceremony” (30% vs. 17%) are very important reasons to get married. Overall, about half of LGBT respondents (53%) say that having a relationship recognized in a religious ceremony is “not an important reason” to get married, compared with about one-third of the general public (35%).

SDT-2013-06-LGBT-4-04

On some of these response categories, bisexuals have attitudes that distinguish them from other LGBT subgroups.

For example, while 60% of gay men and 56% of lesbians say legal rights and benefits are a very important reason to get married, only about half as many bisexuals (32%) say the same. And bisexuals (33%) are somewhat more likely than gay men (23%) to say having children is a very important reason to get married; 29% of lesbians say this.

When it comes to recognition of a marriage in a religious ceremony, the views of bisexuals are closer to those of gay men and lesbians than they are to the general public. About two-in-ten gay men (17%), lesbians (19%) and bisexuals (17%) say this is a very important reason to get married, compared with 30% of all adults.

Marital and Relationship Status

Some 16% of LGBT respondents in the Pew Research survey say that they are currently legally married and an additional 21% say they are living with a partner.26 By comparison, a May 2013 Pew Research survey of the general public found that about half (51%) of all adults say they are married and an additional 7% say they are living with a partner.27

Among the two-in-ten LGBT adults who are living with a partner but not legally married, 7% say they have a legal civil union or domestic partnership and 14% say they are living with a partner outside of a civil union or marriage. An additional 16% of LGBT adults are in a committed relationship, but not living together. About half of LGBT respondents (46%) say they are not currently in any of these types of relationships. Among the general public, about three-in-ten adults are not currently in any of these types of relationships.

Both lesbians and bisexual women are more likely than gay and bisexual men to be in committed relationships. Among LGBT respondents who say they are in some type of committed relationship, almost all gay men and lesbians have same-sex partners, while the overwhelming majority of bisexuals have opposite-sex partners.28

SDT-2013-06-LGBT-4-05

In all, 23% of LGBT adults say they are either legally married or have a legal civil union or domestic partnership; about two-in-ten lesbians (18%) and one-in-ten gay men (11%) have these types of relationships. Bisexuals are the most likely to say they have these types of relationships, particularly bisexual women. Of the 41% of bisexual women and 24% of bisexual men who are married or in a legal union or partnership, most have an opposite-sex partner.

Desire for Marriage

SDT-2013-06-LGBT-4-06

The Pew Research survey asked LGBT respondents who were not currently married or separated if they would like to get married (or get married again) someday. About half (52%) say that they would like to get married in the future, a third (33%) say they are not sure whether they would like to get married someday, and 15% say they do not want to get married. Roughly half of unmarried gay men (56%) and lesbians (58%) say they want to get married someday, compared with 45% of bisexuals.

In all, 60% of LGBT respondents either are currently married or would like to get married.29 An additional 27% are not currently sure if they want to marry someday. The share of LGBT adults who either are married or want to get married is similar across gay men, lesbians and bisexuals; bisexuals are more likely than gay men and lesbians to already be married.

A similar question on a 2010 Pew Research survey found that 76% of adults in the general public were either currently married or thought they wanted to get married, and 13% said they were not sure.30

Views on Same-Sex Adoption

SDT-2013-06-LGBT-4-07

Attitudes about allowing gay men and lesbians to adopt children are nearly identical to attitudes about allowing gay men and lesbians to marry legally.31

Three-quarters of LGBT adults (74%) say they “strongly favor” allowing gay men and lesbians to adopt children. An additional two-in-ten (19%) say they favor adoption among gay men and lesbians, though not as strongly. Just 6% of LGBT adults say they oppose or strongly oppose allowing gay men and lesbians to adopt children.

The general public’s views on allowing gay men and lesbians to adopt children also parallel their views on same-sex marriage. In a June 2012 Pew Research poll, 52% of Americans said they either strongly favor (23%) or favor (28%) allowing gay men and lesbians to adopt children. About four-in-ten (42%) Americans said they oppose adoption by gay men and lesbians, with about two-in-ten (22%) saying they strongly oppose it.

Just as public support for same-sex marriage has increased over the past 10 to 15 years, so has support for adoption by gay men and lesbians. In 1999, the balance of opinion was reversed: 42% of Americans favored allowing gay men and lesbians to adopt children and 52% opposed it.32

Among LGBT respondents, a greater share of gay men and lesbians than bisexuals says they strongly favor allowing gay men and lesbians to adopt. Some 81% of gay men and 84% of lesbians say they are strongly in favor of adoption by gay men and lesbians, compared with 69% of bisexuals. Bisexual women (77%) are more likely than bisexual men (48%) to say they strongly favor allowing adoption.

Among LGBT adults, those younger than 30 are more likely than those ages 30 and older to be strongly in favor of allowing gay men and lesbians to adopt (85% vs. 70%), but at least nine-in-ten of both younger and older LGBT adults say they either strongly favor or favor this (96% and 92%, respectively).

There are large age gaps on this issue among the general public as well. Adults younger than 30 are the most likely to say they strongly favor or favor allowing gay men and lesbians to adopt children (67%), followed by those ages 30 to 49 (56%) and ages 50 to 64 (47%). Just one-third (35%) of those ages 65 and older favor allowing gay men and lesbians to adopt.33

The patterns by party and religious affiliation are almost identical for the issue of adoption by gay men and lesbians as they are for the issue of same-sex marriage.

LGBT Parents

About one-third (35%) of LGBT respondents in the Pew Research survey are parents, and 17% have children who are younger than 18. Bisexuals are the most likely to be parents about half (52%) of bisexuals are parents, including 59% of bisexual women and 32% of bisexual men. Three-in-ten (31%) lesbians and 16% of gay men are parents.

Three-in-ten (30%) bisexuals have children younger than 18, and the gap between bisexual women (40%) and bisexual men (4%) is wide. By contrast, only 8% of lesbians and 5% of gay men have children under age 18.

The shares of parents with children of any age and parents with children younger than 18 among adults in the general public are about twice as high as they are among LGBT adults. About three-quarters of adults in the general public (74%) are parents, and about one-third (32%) have children younger than 18 currently living in their household.34

The Pew Research survey asked LGBT respondents younger than 60 who were not already parents if they would like to have children someday or not. About three-in-ten (28%) of these LGBT respondents say they would like to have children someday, 34% say they are not sure, and 36% say they would not like to have children.

Overall, 51% of LGBT adults of all ages either have children already or would like to have children someday. An additional 19% say they are currently not sure. A May 2013 Pew Research survey of the general public included a slightly different question (with no explicit option for “not sure”) and found that nearly all adults in the general public either already have children or would like to have children someday (91%).35 Though the questions on the LGBT and general public surveys were not identical, this nevertheless suggests lower levels of interest in parenthood among LGBT adults than among the general public.36

Chapter 5: Identity and Community

While every respondent in this survey self-identifies as lesbian, gay, bisexual or transgender, they vary widely in the importance they attach to their own sexual orientation or gender identity and in the sense of community they share with other LGBT adults.

Some, including about half of gay men and lesbians, view their sexual orientation or gender identity as extremely or very important to their overall identity, but others say it carries relatively little weight.

LGBT adults also differ in how much they have in common with other subgroups within the LGBT population; how much they participate in activities such as LGBT pride events and rallies; and how big a role they believe that venues such as LGBT neighborhoods and bars should play in the future as their population becomes more accepted by the broader society.

Importance of Identity to LGBT Individuals

SDT-2013-06-LGBT-5-01

While 37% of LGBT adults say that being lesbian, gay, bisexual or transgender is “extremely” or “very” important to their overall identity, a similar share (36%) says it is “not too” or “not at all” important. About a quarter of LGBT adults (26%) fall in between—saying their LGBT identity is “somewhat important” to their overall identity.

Gay men and lesbians are far more likely than bisexuals to view their sexual orientation as important to their overall identity. About half of gay men (48%) say that being gay is extremely or very important to their overall identity; 50% of lesbians say being lesbian is extremely or very important to their overall identity. By comparison, only two-in-ten bisexuals (20%) say being bisexual is extremely or very important to their overall identity. And while 25% of gay men and 21% of lesbians say their sexual orientation is not too or not at all important to their overall identity, 53% of bisexuals say this. About a quarter of each group says their sexual orientation is a “somewhat important” aspect of their identity.

SDT-2013-06-LGBT-5-02

Age plays a role in the extent to which survey respondents see sexual orientation as an important aspect of their overall identity. Among gay men and lesbians, those ages 45 and older are more likely than those ages 18 to 44 to say their sexual orientation is not too or not at all important to their identity on the whole (30% vs. 18%). And a similar pattern is evident among bisexuals: 63% of bisexuals ages 45 and older say their sexual orientation is not too or not at all important to their overall identity, compared with 49% of younger bisexuals.

LGBT adults who are non-white are more likely to view their LGBT identity as very or extremely important to their overall identity: 44% of non-whites (including Hispanics) say this, compared with 34% of white LGBT adults.

While bisexuals are less likely than gay men and lesbians to view their bisexuality as important to their overall identity, this is particularly true of bisexuals who say they are more attracted to individuals of the opposite sex. Among bisexuals who say they are more attracted to the opposite sex, 64% say their bisexuality is not too or not at all important to their overall identity. By comparison, 44% of those who are either equally attracted to both sexes or more attracted to those of the same sex, say their bisexuality is not too or not at all important to their overall identity.

Is Your Sexual Orientation a Positive or Negative in Your Life?

When asked whether they think of their sexual orientation or gender identity as mainly something positive in their life today, mainly something negative or if it doesn’t make much difference either way, about six-in-ten LGBT respondents (58%) say their sexual orientation or gender identity doesn’t make much difference either way, while 34% say it is mainly something positive and just 7% say it is mainly something negative.

SDT-2013-06-LGBT-5-03

Gay men (46%) and lesbians (38%) are more likely than bisexuals (22%) to view their sexual orientation as something positive in their life today, and a small share of all groups says that their sexual orientation is something negative in their lives. Seven-in-ten bisexuals (70%) say their sexual orientation is neither something positive nor something negative.

Unsurprisingly, those who place a high level of importance on their sexual orientation or gender identity to their overall identity are also more likely to say that their sexual orientation has an impact—particularly a positive one. A 53% majority of those who say their LGBT identity is an extremely or very important part of their overall identity say that it is mainly something positive in their life today, while just 37% say it doesn’t make much difference. By contrast, 79% of those who say their LGBT identity is not too or not at all important to their overall identity say it has neither a mainly negative nor mainly positive aspect of their lives today.

While the proportion of LGBT adults who say their sexual orientation or gender identity is mainly something negative in their lives is relatively small (just 7%), this sentiment is more prevalent among some religious subgroups than others. Among LGBT Catholics, 12% say it is mainly something negative, as do 14% of LGBT evangelical Protestants (compared with just 3% of LGBT mainline Protestants). And 15% of those who attend religious services at least monthly view their sexual orientation or gender identity negatively, as do 14% of those who say religion is very important in their lives and 14% of those who see conflict between their LGBT identity and their religious beliefs.

Why Is Your LGBT Identity a Positive or Negative in Your Life?

SDT-2013-06-LGBT-5-04

For the one-third of LGBT adults who say their sexual orientation or gender identity is mainly something positive in their lives, 46% volunteer, in an open-ended question, responses along the line of “it’s just who I am” or “how God made me.” Some (15%) say it has helped them find love or is generally good for their love life, 10% say it gives them empathy for other minority groups or makes them focus on justice and equality, and 9% say it makes them a stronger person or a role model for others in the LGBT population.

Although responses characterizing their sexual orientation as a positive because it is how they are born or made by God are about equally common among gay men, lesbians and bisexuals, bisexuals who see their sexual orientation as a positive are somewhat more likely than gay men and lesbians together to mention that their sexual orientation has helped them to find love or relationships (31% say this vs. 11% of gays and lesbians). Gay men and lesbians are more likely than bisexuals (12% vs. 3%) to say they view their sexual orientation as a positive because it makes them a stronger person or a role model for others in the LGBT population.

Voices: Why Is Your LGBT Identity Something Positive?

Defines me/Who I am/Born this way/God made me:

“Because while it’s something I must defend, it is a huge part of who I am. I love who I am, and that makes it positive.” –Lesbian, age 26

“It is who I am, and the way God created me. If this was how I was born, God must see it as good.” –Gay man, age 42

“Because it’s who I really am inside.” –Transgender adult, age 27

“It’s who I am. Why would it be other than positive?” –Lesbian, age 64

Has helped me find love/Good for love life:

“My sexual orientation has affected whom and how I love. I have been with my partner for 13 years and love him as much as always. I would not be with him otherwise.” –Gay man, age 51

“Because it opens me and my heart up to more people. Not just whom society and the past think I should be open to.” –Bisexual woman, age 32

Empathy for other minority groups/focus on equality:

“Makes it possible to better understand the problems facing blacks, women, others who are ‘closed out’ of society.” –Gay man, age 83

“Helps me be more tolerant of various differences among people—makes my horizon a little bigger—and makes me feel like part of a community.” –Bisexual woman, age 50

Makes me a stronger person/Role model for other LGBT:

“Learning how to live with discrimination and fight it makes me a stronger person.” –Lesbian, age 25

“I think I set an example. Made it easier for gays in the rural town I grew up in.” –Gay man, age 49

LGBT/32a

The sample size for those saying their LGBT identity is something negative is too small for analysis (n=71), but responses generally fell into three categories: discrimination or lack of social acceptance or understanding by some combination of society, family or friends; personal struggles, such as finding a mate, living openly, or accepting one’s own LGBT identity; and lack of legal rights.

Voices: Why Is Your LGBT Identity Something Negative?

Discrimination/lack of social acceptance:

“Judgment from others. Can’t say who I truly am, especially in Texas. Must lie to family. Hard to find others.” – Gay man, age 22

“It’s basic. The general populace discriminates against anyone who is different. Not everyone feels this way but most do. Some just don’t say anything and pretend there is no discrimination …” –Lesbian, age 49

“People assume that I will sleep with anyone I meet because I am attracted to both genders. This, of course, is not true.” –Bisexual woman, age 22

[is]

Personal struggles:

“It prevents me from living my life in the open the way other people can who are in heterosexual relationships.” –Bisexual woman, age 43

“I’m turning 50 … I wish I had a family of my own. I would turn straight if I could in order to have a family at this point in my life …” –Gay man, age 49

“My family and I are religious and it conflicts with some things that they/we believe. I am married and my husband is okay with knowing I am bisexual.” –Bisexual woman, age 22

Lack of legal rights:

“Because I cannot change or hide who I am, and it is still completely legal to discriminate and in some cases harm me just because of who I am.” –Gay man, age 32

“We are treated like second-class citizens even though we pay first-class taxes.” –Lesbian, age 55

LGBT/32a

Attraction and Sexual Orientation

Sexual orientation is not a simple subject, and it can be measured in a variety of ways. This survey relies on self-identification, while other surveys have used measures of sexual behavior or sexual attraction. For many LGB adults, particularly bisexuals, self-identification does not necessarily correspond to particular types of attraction.37

SDT-2013-06-LGBT-5-05

Large majorities of both gay men and lesbians say that they are primarily attracted to individuals of the same sex. Nearly all gay men say they are either only or mostly attracted to men (91%) or somewhat more attracted to men than women (9%). About three-quarters of lesbians (78%) say they are only or mostly attracted to women, and an additional 13% say they are somewhat more attracted to women, 3% say they are about equally attracted to both sexes, and 2% say they are more attracted to men.

Bisexuals express a broad range of attraction, with some notable differences between bisexual men and bisexual women. Among bisexual men, about equal shares say they are more attracted to men (34%), more attracted to women (38%) and attracted to both sexes about equally (28%). Among bisexual women, however, a plurality say they are at least somewhat more attracted to men (47%), including 13% who say they are mostly or only attracted to men; 22% of bisexual women say they are at least somewhat more attracted to women; and 31% say they are attracted to both sexes equally.

SDT-2013-06-LGBT-5-06

According to the survey, about half (54%) of LGB adults are in committed relationships, including 38% who are married or living with a partner. Among LGB adults in committed relationships, 57% are in same-sex relationships, 40% are in opposite-sex relationships and 2% are in relationships with someone who is transgender. Almost all gay men (98%) and lesbians (99%) in relationships have partners of the same sex, compared with about one-in-ten bisexuals (9%). Fully 84% of bisexuals who are in a committed relationship are involved with someone of the opposite sex (4% have a spouse or partner who is transgender).

Does Being LGBT Make You Different?

SDT-2013-06-LGBT-5-07

When asked which of two statements comes closer to their views—“I don’t want to be seen as different because of my sexual orientation/gender identity” or “My sexual orientation/gender identity makes me different from other people, and I am comfortable with that”—about three-quarters (74%) of LGBT adults say they don’t want to be seen as different because of their LGBT identity, and a quarter (25%) say their LGBT identity makes them different and they are comfortable with that.

Overall, majorities of all LGBT subgroups say they don’t want to be seen as different because of their LGBT identity. However, 36% of those who say that their sexual orientation or gender identity is extremely or very important to their overall identity say that their sexual orientation or gender identity makes them different and that they are comfortable with that. By comparison, among those whose sexual orientation or gender identity is less important to their overall identity, only about two-in-ten (18%) say the same.

Importance of Identity for the LGBT Population

SDT-2013-06-LGBT-5-08

Lesbians, gay men, bisexuals and transgender adults are often described as being part of an “LGBT community,” but opinions vary about just how much each of the groups in the acronym share common concerns and identity with the other groups, how involved they are in LGBT events and issues, and how important it is to maintain a distinct LGBT culture and way of life and distinct LGBT places.

Asked how much they feel they share common concerns and identity with other groups, 70% of gay men say they feel they share a lot or some common concerns and identity with lesbians, while a similar share of lesbians (75%) say they share a lot or some in common with gay men. And about two-thirds of gay men (65%) and 60% of lesbians feel they share at least some commonalities with bisexuals. Among both gay men (52%) and lesbians (47%), fewer say they have a lot or some common concerns and identity with transgender people.

Among bisexuals, the sense of shared community with lesbians and gays is strongly linked to gender. Two-thirds of bisexual men (66%) say they have a lot or some in common with gay men, but just 37% see at least some common ground with lesbians; roughly a third (32%) say they do not share any common concerns with lesbians. Bisexual women, conversely, are more likely to say they have a lot or some in common with lesbians (75%) than with gay men (55%), and 21% say they have no common concerns with gay men.

Only about a quarter of bisexual men (24%) and about four-in-ten bisexual women (38%) say they have a lot or some in common with transgender people; pluralities of both bisexual men (51%) and bisexual women (39%) say that they feel they do not have any common concerns and identity with transgender people.38

Lesbian, gay, and bisexual respondents who feel their own sexual orientation or gender identity is an extremely or very important aspect of their overall identity are, in general, more likely to say they share commonality with most of the groups. For example, while 47% of lesbians feel a sense of commonality with transgender people, that share rises to 58% among those who say being lesbian is extremely or very important to their overall identity. One exception is commonality with bisexuals: Gay men and lesbians who view their own sexual orientation as extremely or very important to their overall identity are no more (or less) likely than other gay men or lesbians to see commonality with bisexuals.

Level of Engagement in LGBT Groups, Events, Issues

While many individuals have been involved in LGBT events or groups or have been active in support of LGBT rights and recognition, these types of activities are far from universal.

SDT-2013-06-LGBT-5-09

About half (52%) of survey respondents say they have attended an LGBT pride event at some point in their lives, and two-in-ten (19%) say they have done so in the past 12 months. Four-in-ten (40%) say they have attended a march or rally in support of LGBT rights, including 9% who have done so in the past year.

About four-in-ten LGBT adults (39%) say they have been a member of an LGBT organization at some point in their lives, including 14% who say they have been a part of an LGBT organization in the past year. About a third (32%) say they have donated money to politicians or political organizations because of their support for LGBT rights, including 15% over the past 12 months.

Fully half of LGBT adults say they have either expressly supported or avoided businesses because of their stance on LGBT rights: 49% say they have bought a product or service because the company is supportive of LGBT rights, while 51% say they have decided not to buy a product or service because the company is not supportive of LGBT rights. Many of these are the same people: 42% have done both.

About three-in-ten LGBT adults (31%) say they have decided not to buy from a company that is not supportive of gay rights in the past year, while 25% say they have bought a product in the past year because the company was supportive of gay rights.

The survey asked about involvement in six types of LGBT-related events or activities. Overall, 70% of respondents say they have done at least one in their lifetimes, and 46% have done at least one within the past year.

SDT-2013-06-LGBT-5-10

Gay men and lesbians are more likely than bisexuals to have engaged in any of these community activities. And gay men stand out even more than lesbians when it comes to LGBT pride events and rallies and marches for LGBT rights. For example, 72% of gay men have ever attended an LGBT pride event, compared with 61% of lesbians and 33% of bisexuals.

However, when looking at attendance at pride events and LGBT rights marches in the past 12 months—a period in which there have been a lot of marches and rallies surrounding the issue of same-sex marriage—there are no significant gaps between gay men and lesbians. Some 29% of gay men and 23% of lesbians have attended an LGBT pride event in the past 12 months, compared with 9% of bisexuals.

Perhaps not surprisingly, those who say their sexual orientation or gender identity is an extremely or very important aspect of their overall identity are much more likely than those for whom it is less important to have engaged in any of these activities, with the gaps ranging from 20 percentage points (for donating money to politicians or political organizations who support LGBT rights) to 31 percentage points (for buying products from companies supportive of LGBT rights).

Education and income are also strongly associated with participation in each of these activities. For example, 68% of LGBT adults with a bachelor’s degree or more have attended a pride event, compared with 45% of those without a bachelor’s degree.

Ideology and partisanship are also linked to engagement in each of these activities. Liberal and Democratic LGBT adults are more likely than others to have done each of these activities. For the most part, this relationship holds among just gay men and lesbians as well (as discussed in Chapter 7, gays and lesbians are more likely than bisexuals to be liberal or Democratic). However, there are no significant partisan differences among gay men and lesbians in attendance at rallies or pride events.

Maintaining Distinct LGBT Culture vs. Going Mainstream

SDT-2013-06-LGBT-5-11

When it comes to views about the best course of action to achieve equality, LGBT adults are divided about whether they think members of the LGBT population should “be able to achieve equality while maintaining a distinct culture and way of life” or whether “the best way to achieve equality is to become part of mainstream culture and institutions like marriage” (49% say each).

There are only modest differences on this question across identity or demographic subgroups of the LGBT population

On a related question, more than half of LGBT adults (56%) say that “It is important to maintain places like LGBT neighborhoods and gay and lesbian bars,” while 41% say “these types of places will not be important as LGBT people are more accepted into society.” Gay men are the most likely LGBT group to say that maintaining distinctly LGBT places is important; 68% do so, compared with 55% of lesbians and 47% of bisexuals.

SDT-2013-06-LGBT-5-12

Younger LGBT adults are more likely to say maintaining these venues is important (61% of those ages 18 to 44 say this, compared with 50% of those ages 45 and older; this is especially true among younger gay men and lesbians, for whom 73% say it is important to maintain LGBT places, compared with 54% of gay men and lesbians ages 45 and older.

Those who say their sexual orientation or gender identity is extremely or very important to their overall identity are more likely than others to place importance on maintaining distinctly LGBT places (66% vs. 51%). However, the opinions of those who currently live—or those who have lived—in LGBT neighborhoods are no more likely to say these types of neighborhoods and establishments are important to maintain.

Chapter 6: Religion

Lesbians, gay men, bisexuals and transgender adults are, on the whole, less religious than the general public. About half (48%) say they have no religious affiliation, compared with 20% in the general public; this pattern holds among all age groups. LGBT adults who do have a religious affiliation generally attend worship services less frequently and attach less importance to religion in their lives than do religiously affiliated adults in the general public.

Also, a third (33%) of religiously affiliated LGBT adults say there is a conflict between their religious beliefs and their sexual orientation or gender identity.

That sentiment is even more prevalent among the general public. About three-quarters of white evangelical Protestants (74%) and a majority of all U.S. adults with a religious affiliation (55%) say homosexuality conflicts with their religious beliefs. Among all adults in the general public, there is a strong correlation between the frequency of church attendance and the belief that homosexuality should be discouraged.

The new Pew Research survey asked LGBT respondents to rate six religions or religious institutions as friendly, neutral or unfriendly toward the LGBT population. By overwhelming margins, most rate all six as more unfriendly than friendly. About eight-in-ten LGBT respondents say the Muslim religion, the Mormon Church and the Catholic Church are unfriendly toward them, while one-in-ten or fewer say each of these religious institutions is friendly toward them. Similarly, about three-quarters of LGBT adults (73%) say that evangelical churches are unfriendly toward them, about a fifth (21%) consider these churches neutral and just 3% say evangelical churches are friendly toward the lesbian, gay, bisexual and transgender population. By comparison, fewer LGBT adults see the Jewish religion and non-evangelical (mainline) Protestant churches as unfriendly toward them, but more say each is unfriendly rather than friendly by a large margin. And about three-in-ten LGBT adults (29%) say they personally have “been made to feel unwelcome at a place of worship or religious organization,” as detailed in Chapter 2 on social acceptance.

SDT-2013-06-LGBT-6-02

Nonetheless, about half of LGBT adults (51%) have a religious affiliation, including a sizable minority of all LGBT respondents (17%) who have a religious affiliation and also say religion is very important in their lives. Most of those with a religious affiliation are Christian (53% Protestant, 26% Catholic and 1% some other Christian faith). Among LGBT Catholics, two-thirds consider the Catholic Church unfriendly toward the lesbian, gay, bisexual and transgender population, while 26% say it is neutral and just 6% see it as friendly. By contrast, among LGBT adults who are white mainline Protestants, most say that non-evangelical Protestant Churches are either friendly (20%) or neutral (54%) toward them, while 24% see these churches as unfriendly.

The remainder of this chapter explores all of these patterns in more detail and provides quotes from survey respondents on topics related to religion.

Religious Profile of the LGBT Population

When it comes to religion, the LGBT population has a distinctly different profile than the general public. Fewer LGBT adults have a religious affiliation. About half of LGBT respondents describe themselves as atheist, agnostic or having no particular religion (48%)─more than double the portion of the general public that is religiously unaffiliated (20%). Like the U.S. general public, LGBT adults with a religious affiliation are primarily Christian. In all, 42% are Christian (including 27% who are Protestant, 14% who are Catholic and 1% who belong to other Christian faiths). One-in-ten identify with Judaism (2%) or some other non-Christian faith (8%).

SDT-2013-06-LGBT-6-03

Young LGBT adults are particularly likely to have no religious affiliation, a pattern that is also found among the general public. However, compared with the general public, a higher share of LGBT adults are unaffiliated across all age groups. For example, among adults ages 18 to 29 in the general public, 31% are religiously unaffiliated, while roughly double that share (60%) are unaffiliated among LGBT adults of the same age. And roughly one-in-eight adults ages 50 and older in the general public are unaffiliated (13%), compared with about four-in-ten (39%) of older LGBT adults.

SDT-2013-06-LGBT-6-04

Apart from age, there are few subgroup differences among LGBT adults in the tendency to be religiously affiliated or unaffiliated. Gay men, lesbian and bisexual adults are about equally likely to be religiously affiliated. Similarly, within the LGBT population there are no significant differences in religious affiliation levels among whites compared with racial and ethnic minorities, or among college graduates compared with those without a college degree.

While marriage is correlated with religious practice in the general public, being married or in a civil union is not significantly associated with having a religious affiliation among LGBT respondents.

There are modest differences across regions. LGBT respondents living in the South are more inclined to have a religious affiliation (57%) than those living in the Northeast (41%).

SDT-2013-06-LGBT-6-05

Unlike the general public, LGBT adults tend to tilt strongly toward the political left regardless of whether they are religiously affiliated or unaffiliated. About three-quarters of LGBT adults with a religious affiliation (76%) identify as Democrats or as independents who lean to the Democrats—as do 83% of LGBT adults with no religious affiliation.

LGBT adults identifying as liberals outnumber conservatives by more than two-to-one among both those who have and those who do not have a religious affiliation. However, LGBT respondents with a religious affiliation are somewhat more likely than those who are unaffiliated to identify themselves as conservatives (18%, compared with 7% among the unaffiliated).

Religious commitment. LGBT adults also exhibit lower levels of religious commitment. Compared with the general public, fewer LGBT adults attend worship services regularly (13% attend at least weekly, compared with 37% of the general public). And religion tends to be less salient in the lives of LGBT respondents. A fifth (20%) of LGBT adults say that religion is very important in their lives, compared with roughly six-in-ten (59%) among the general public.

SDT-2013-06-LGBT-6-06

Some, but not all, of these differences in religious commitment are related to the lower levels of religious affiliation among LGBT adults. However, even after controlling for affiliation with a religion, LBGT adults exhibit lower levels of religious commitment.

LGBT respondents with a religious affiliation attend worship services less frequently than do adults in the general public who have a religious affiliation. Among those who have a religious affiliation, a fifth (20%) attend religious services at least weekly, 36% attend monthly or yearly and about 44% say they seldom or never attend. Among adults in the general public who have a religious affiliation, the pattern is reversed, with about a fifth (18%) saying they seldom or never attend services, 36% attending monthly or yearly and 45% attending at least weekly.

The vast majority of people with no religious affiliation, both those who are LGBT and the general public, say they seldom or never attend worship services.

There are modest differences among gay men, lesbians and bisexual adults in worship service attendance. Gay men are less likely than lesbians to attend services regularly; fully 71% of gay men say they seldom or never attend worship services, while 57% of lesbians say the same. Neither gay men nor lesbians are significantly different from bisexual adults in their frequency of worship service attendance, however; 64% of bisexual adults say they seldom or never attend services.

SDT-2013-06-LGBT-6-07

There is a similar pattern when it comes to the importance of religion. Compared with the general public, LGBT adults are less inclined to see religion as very important in their lives; a fifth (20%) say religion is very important to them, 23% say it is somewhat important and a majority (55%) say religion is not too or not at all important in their lives. By contrast, 59% of all U.S. adults say religion is very important in their lives.

SDT-2013-06-LGBT-6-08

Some, but not all, of the difference between LGBT adults and the general public is explained by the higher percentage of religiously unaffiliated lesbian, gay, bisexual and transgender adults. Religiously unaffiliated adults are less inclined to consider religion personally important. Even among those with a religious affiliation, however, LGBT respondents place less importance on religion. For example, a third of LGBT adults with a religious affiliation say religion is very important in their lives. This compares with two-thirds (67%) of those who are religiously affiliated in the general public.

There are modest differences in religious importance among LBGT adults. A majority of lesbians (56%) consider religion either very important or somewhat important in their life. This compares with 40% among bisexual adults (42% among bisexual women) and 39% among gay men.

SDT-2013-06-LGBT-6-09

While LGBT adults generally are less religious than American adults as a whole, a sizable minority of them show a high level of religious commitment. About one-fifth (17%) identify with a religion and consider religion very important in their lives.

This group of more religiously committed adults also attends worship services more frequently, as expected (41% say they attend weekly). They are more likely than other LGBT adults with a religious affiliation to be bisexual women and they are more likely to reside in the South. Apart from those differences, they are similar to other LGBT adults with a religious affiliation on a number of demographic background characteristics including age and marital status.

Tensions Between Religious Beliefs and Homosexuality

SDT-2013-06-LGBT-6-10

The relatively high share of LGBT adults with no religious affiliation could be explained, in part, by real or perceived tensions with U.S. religious groups and institutions. The Pew Research survey of LGBT adults asked about the extent to which respondents feel a conflict between their religious beliefs and their sexual orientation or gender identity. Overall, about a quarter of LGBT adults (26%) say there is a conflict between their religious beliefs and their sexual orientation or gender identity, while a majority (73%) says there is no conflict.

Those having a religious affiliation are more inclined to see a conflict (33% of the affiliated, 18% of the unaffiliated). Nevertheless, a solid majority of both groups says there is no conflict (66% of the affiliated, 82% of the unaffiliated).

SDT-2013-06-LGBT-6-11

Among LGBT adults with a religious affiliation, a third (33%) say there is some conflict between their religious beliefs and their sexual orientation: a fifth (20%) say there is “a lot” of conflict, and 13% say there is “a little” conflict. Two-thirds (66%) say there is no conflict.

Gay men and lesbians are somewhat more inclined than bisexual adults, especially bisexual women, to see a conflict between their religious beliefs and their sexual orientation. Roughly three-in-ten gay men (29%) and lesbians (31%) say there is a conflict, compared with a fifth (21%) of bisexual adults.

These viewpoints contrast sharply with opinions in the general public about the degree of conflict between religious beliefs and homosexuality.

About half of adults in the general public (48%) see a conflict between their religious beliefs and homosexuality. Compared with the unaffiliated, those with a religious affiliation are especially likely to say there is a conflict; 41% of this group say there is a lot of conflict between their religious beliefs and homosexuality, 14% say there is a little conflict and 41% say there is no conflict.

SDT-2013-06-LGBT-6-12

Fully 74% of white evangelical Protestants in the general public say there is a conflict between their religious beliefs and homosexuality, as do 62% of white non-Hispanic Catholics and 58% of black Protestants. Only one of the major U.S. religious groups is substantially less likely to see a conflict: 41% of white mainline Protestants say there is a conflict between their religious beliefs and homosexuality, while a 55% majority takes the opposite view.

Those who attend worship services more frequently, across all faiths, are especially likely to see a conflict between their religious beliefs and homosexuality. Two-thirds of this group say there is a conflict, including half (50%) who say there is a lot of conflict.

Feeling Unwelcome in Religious Communities

Many LBGT adults see major religious institutions as unfriendly toward them. And as shown in Chapter 2 on social acceptance, about three-in-ten LGBT adults (29%) say they personally have been made to feel unwelcome in a church or religious organization.

SDT-2013-06-LGBT-6-13

More than eight-in-ten LGBT adults surveyed say the Muslim religion (84%) is unfriendly to those who are lesbian, gay, bisexual or transgender, while less than 1% say the Muslim religion is friendly and 13% consider it neutral. Perceptions of the Mormon Church are similar, with 83% of LGBT respondents saying the Mormon Church is unfriendly toward them. About eight-in-ten (79%) consider the Catholic Church unfriendly, and 73% say the same about evangelical churches. By comparison, the Jewish religion and non-evangelical (mainline) Protestant churches are seen as less hostile, although many more LGBT adults consider these institutions to be unfriendly than friendly toward them. Roughly half of the LGBT adults surveyed say the Jewish religion (47%) is unfriendly toward the LGBT population, just one-in-ten say the Jewish religion is friendly and about four-in-ten (41%) say it is neutral. Perceptions of non-evangelical Protestant churches are similar; 44% of LGBT adults say these churches are unfriendly, 10% say they are friendly and 43% say they are neutral.

SDT-2013-06-LGBT-6-14

Perceptions of these religious institutions among LGBT adults loosely correspond with survey findings on attitudes toward homosexuality within each of the religious groups. Members of the U.S. general public who identify as white evangelical Protestant, black Protestant, Mormon and Muslim are less accepting of homosexuality than the general public as whole. Each of these groups is more likely to say that homosexuality should be discouraged by society rather than accepted by society, according to Pew Research surveys, with the exception of U.S. Muslims, who are about equally likely to say that homosexuality should be accepted as discouraged by society. White mainline Protestants and Jews (along with the unaffiliated) are more accepting of homosexuality than the general public as a whole. Catholics are also more accepting of homosexuality than the general public as whole, although the Catholic Church officially teaches that homosexual behavior is a sinful act.

SDT-2013-06-LGBT-6-15

Among LGBT Catholics, two-thirds (66%) say the Catholic Church is unfriendly toward them, just 6% see the Church as friendly and 26% say it is neutral. By comparison, unaffiliated LGBT adults are more likely to see the Catholic Church as unfriendly (84%), and 74% of LGBT Protestants say the Catholic Church is unfriendly.

Perceptions of religious institutions vary somewhat between LGBT adults with and without a religious affiliation. Eight-in-ten or more of both affiliated and unaffiliated LGBT adults say the Muslim religion and the Mormon Church are unfriendly toward them. The affiliated are less negative than those with no religious affiliation particularly when it comes to evangelical churches, but a majority of both groups says evangelical churches are unfriendly toward LGBT adults. Two-thirds of the affiliated (67%) and 81% of the unaffiliated say evangelical churches are unfriendly toward the LGBT population. The religiously affiliated are also less inclined to see non-evangelical Protestant churches as unfriendly; 36% of the affiliated (compared with 53% of the unaffiliated) say non-evangelical (mainline) Protestant churches are unfriendly. Among LGBT adults who are white mainline Protestants, roughly equal portions consider non-evangelical Protestant churches overall to be friendly (20%) or unfriendly (24%), while 54% says these churches are neutral.

Voices: On Religion and the Coming Out Process*

Comments from LGBT survey respondents on the conflict they feel between religion and their sexual orientation:

“The only thing holding me back from being open about my sexuality is the very strong religious Christian views that most of my family has. I have come out and been open with anyone and everyone who I know won’t judge me based on their religious views and have yet to encounter any negative responses or discrimination. I am confident that the religious members of my family will judge me based on their conservative and radical views of their religion and will end their relationships with me, and I’m not prepared to lose such a large part of my family over it.” -Gay man, age 26

[came]

[omitted]

“When I was 18 I couldn’t handle it and attempted suicide. I became religious thinking God would make me straight. I gave that up at 26 when I finally realized it wasn’t God who had a problem with me but his followers.” – Gay man, age 64

Comments from LGBT respondents who are active in a church or other religious group:

“… I’m also very involved in my church as a youth leader, and I have not breached the topic with anyone. However, I do believe that both of my pastors “know” that I am gay but it has not been brought up and they don’t appear to have any issue with it. I attend a church that does allow gays and lesbians to be ordained. However, it would be an issue for some people in the church and I’m not ready to open that can of worms.” -Lesbian, age 49, evangelical Protestant

“When I told my parents, initially our relationship grew weaker. However, after speaking with their pastor; it started getting better. With time, my life became to them a picture of normality, stability, and morality. Now everything with my parents is awesome, loving, and spiritually sound. My brothers have been by my side from the start. My sister won’t speak to me even after 21 years of being ‘out.’ All relatives with the exception of one aunt has been supportive, welcoming and family to me.” -Gay man, age 40, Catholic

[k]

LGBT/50

Interactive: LGBT Voices

Explore some 300 quotes from LGBT survey respondents about their coming out experiences.

Chapter 7: Partisanship, Policy Views, Values

The lesbian, gay, bisexual and transgender population is one of the most Democratic demographic groups in the country. According to the 2012 national exit polls conducted by the National Election Pool, gay, lesbian, and bisexual adults voted for Barack Obama over Mitt Romney by more than three-to-one (76% vs. 22%).

This Democratic advantage can be seen in the partisan identification of LGBT adults, a majority of whom are Democrats. It also expresses itself in policy preferences across a range of issues, including size of government, attitudes about gun policy and immigration.

When it comes to issues of specific interest to the LGBT population, many LGBT adults say equal rights, including employment rights, marriage rights and adoption rights, should be top policy priorities. Many also say the same about prevention and treatment of HIV/AIDS.

A Democratic Constituency

SDT-2013-06-LGBT-7-01

More than half (56%) of LGBT adults consider themselves to be Democrats, just 8% identify as Republican and 30% are independent. By comparison, 32% of the general public are Democrats, 24% are Republicans, and 37% are independents.

The overwhelming Democratic identification of LGBT adults is even clearer when leaned partisanship of independents is taken into account. About eight-in-ten (79%) LGBT adults are Democrats or lean Democratic, while just 18% are Republican or lean Republican.

Democratic affiliation is higher among gay men (67%) and lesbians (64%) than among bisexuals (44%). Still, about three-quarters of bisexuals (74%) identify as Democrats or lean toward the Democratic Party.

Half of LGBT adults (50%) self-identify as liberal, 37% are moderate, and just 12% say they are conservative. LGBT adults are about three times as likely as the overall public to be liberal Democrats (36% vs. 11% of the overall public). In addition, 49% plurality of gay men are liberal Democrats, significantly more than among lesbians (36%) and bisexuals (28%).

Views of Barack Obama

SDT-2013-06-LGBT-7-02

Barack Obama is viewed favorably by 76% of LGBT adults. A Pew Research Center survey in January, found that 59% of the general public viewed Obama favorably.

The higher favorable rating for Obama among LGBT adults is reflective of their strong Democratic leanings: 89% of Democratic and Democratic-leaning LGBT adults have a favorable impression of Obama, compared with 79% of all Democrats and Democratic leaners. Among Republican and Republican-leaning LGBT adults, just 23% view Obama favorably, while 77% view him unfavorably. (Among all Republicans and Republican leaners, Obama’s rating was 22% favorable, 75% unfavorable in January.)

While Obama enjoys positive ratings across the LGBT population, gay men (83%) and lesbians (84%) are more likely than bisexuals (68%) to say they have a favorable impression.

Ratings of the Major Parties

SDT-2013-06-LGBT-7-03

The two major parties are viewed very differently among LGBT adults: About two-thirds (66%) have a favorable opinion of the Democratic Party, while just 15% have a favorable impression of the Republican Party. Among the general public, the Democratic Party is also rated higher than the GOP, but the gap is much narrower (14 points).

Of all LGBT adults, lesbians hold the most positive views of the Democratic Party, with eight-in-ten (80%) having a favorable opinion. About two-thirds of gay men (68%) also have a positive opinion of the Democrats, as do a smaller majority (58%) of bisexuals.

Supreme Court Views

SDT-2013-06-LGBT-7-04

Just weeks before the Supreme Court is set to rule on two cases involving same-sex marriage, 58% of LGBT adults have a favorable view of the institution while 40% view it unfavorably, with similar views of the court among gay men, lesbians and bisexuals. These ratings are similar to the public’s views of the court.

Majority of LGBT Adults Say Country Is on the Right Track

SDT-2013-06-LGBT-7-05

A 55% majority of LGBT adults say that things in the nation are generally headed in the right direction, while 45% say they are off on the wrong track. This is a much more optimistic view of the nation’s direction than among the overall public: Just 32% of the public says the nation is headed in the right direction, while 58% say it is off on the wrong track.

Views about the direction of the country are strongly correlated with party, as evidenced by large partisan divides on this question both within the LGBT population and the overall public. About six-in-ten LGBT Democrats and Democratic leaners (62%) have a positive view about the direction of the country; that compares with 24% of LGBT Republicans and Republican leaners.

Yet even within partisan groups, LGBT adults are more upbeat about the direction of the nation than the general public is. A narrow majority of all Democrats and Democratic leaners (53%) say the country is headed in the right direction, compared with 62% of LGBT Democrats. Similarly, although 11% of all Republicans and Republican leaners say things are going in the right direction, 24% of LGBT Republicans and leaners express this view.

What Are the Priorities When It Comes to LGBT-Related Policy Issues?

Asked in an open-ended question to name the most important problems facing the lesbian, gay, bisexual, and transgender population today, 57% of LGBT adults volunteer some aspect of social treatment. The aspects raised include: 28% mentioning discrimination, prejudice, or lack of equality; 19% citing a general lack of acceptance; 13% saying ignorance; and 7% mentioning violence or bullying.

SDT-2013-06-LGBT-7-06

An additional 32% cite legal rights, including 15% who specifically mention the right to legally marry. The other or more general mentions of legal rights include some rights traditionally associated with marriage (such as hospital visitation rights or shared health insurance or tax benefits) as well as some statements about wanting the same rights as married heterosexual couples, even if those rights aren’t granted through marriage.

Although garnering fewer mentions, other problems mentioned include religious opposition (8%), self-acceptance (3%), and sexually transmitted diseases, including HIV/AIDS (2%).39

LGBT respondents were also asked to rate several specific policies that affect the LGBT population as a top priority, very important but not a top priority, a somewhat important priority or not a priority at all. Fully 57% of LGBT adults say equal employment rights should be a top priority, while 53% cite legally sanctioned marriages for same-sex couples as a top priority.

SDT-2013-06-LGBT-7-07

About half (47%) of LGBT respondents say more efforts aimed at prevention and treatment of HIV and AIDS should be a top priority. A similar share (45%) says adoption rights for same- sex couples should be a top policy priority. Roughly four-in-ten say support for organizations that provide services to LGBT youth (41%) and legally sanctioned civil unions or domestic partnerships for same-sex couples (39%) should be top policy priorities. Coverage of transgender health issues by health insurance ranks last, with 29% saying it should be a top priority.

Among the different LGBT groups, lesbians are more likely than gay men and bisexuals to rate legal marriage and adoption rights as top priorities. About seven-in-ten (69%) lesbians say legal marriage should be a top priority, compared with 54% of gay men and 50% of bisexuals. And six-in-ten (60%) lesbians say the same about adoption rights, compared with 45% of gay men and 42% of bisexuals. Meanwhile, gay men are more likely than lesbians and bisexuals to say HIV/AIDS prevention and treatment programs should be a top priority—57% of gay men say this, compared with 45% of lesbians and 40% of bisexuals.

Voices: Most Important Problems Facing the LGBT Population

Social treatment: discrimination, lack of acceptance, ignorance, and violence

“Same as always: ignorance. We are not sexual predators. We want to enlarge, not destroy the institution of marriage. We want to live in happy families.” – Gay man, age 68

“Privately — acceptance of self and putting so much emphasis on others acceptance of us. Publicly — the lies and fighting coming from all sides of the ‘battle.’ ” – Lesbian, age 50

“Oppression by religious people who try to force their views about us on others. LGBT youth are committing suicide because the message in our culture is that they are garbage and have no value. We live in a country that is seeing the hatred for differences on the rise. Where religious and political parties are using fear of differences to fuel hatred and cause their followers to seek out people of differences to beat up and kill.” – Lesbian, age 64

“Hate crimes and violence, and the fear of both of those things – they are absolutely unnecessary and uncivil.” – Bisexual woman, age 22

Legal rights: marriage and more

“People view anything different than themselves…as a threat to them and society. That is why there is such discrimination against them: marriage, adoptions, benefits, etc…” – Transgender person, age 56

“Legal barriers to establishing long term relationships, especially for younger people who want to start families and hold property together.” – Lesbian, age 60

“I think that equal employment opportunity and financial benefits from marriage are among the most important issues facing LGBT individuals in society these days.” – Bisexual woman, age 25

LGBT/52

Policy Preferences

SDT-2013-06-LGBT-7-08

Across a variety of issues, the views of the LGBT population differ from the overall public in ways that are largely consistent with the Democratic political preferences of the LGBT population.

Views of immigrants are more positive among the LGBT population than the population as a whole. About six-in-ten (62%) LGBT adults say immigrants “strengthen our country because of their hard work and talents,” while far fewer (37%) say immigrants are a burden “because they take our jobs, housing and health care.” Among the public, 49% say immigrants strengthen the country while 41% say they are a burden.

The view that immigrants strengthen the country is more prevalent among gay men than among other LGBT adults: 71% of gay men say this, compared with 54% of lesbians and 57% of bisexuals.

When it comes to views of gun control, a clear majority of LGBT adults say controlling gun ownership is more important than protecting the right to own guns (64% vs. 36%), in contrast to the nearly even split on this issue among the general public (50% control ownership, 48% protect rights).

SDT-2013-06-LGBT-7-09

And roughly six-in-ten LGBT adults (62%) say that “poor people have hard lives because government benefits don’t go far enough to help them live decently,” while just 37% say “poor people today have it easy because they can get government benefits without doing anything in return.” By contrast, the general public is divided on this question (44% say the poor have hard lives, and 45% say they have it easy).

Size of Government

SDT-2013-06-LGBT-7-10

Overall, more LBGT adults say they would rather have a bigger government that provides more services than a smaller government that provides fewer services (56% vs. 43%). Among the general public, a narrow majority would opt for a smaller government (51% vs. 40%).

But partisan differences within the LGBT population are as pronounced as within the overall public. While about two-thirds of LGBT Democrats and Democratic leaners (64%) prefer a bigger government, 77% of LGBT Republicans and Republican leaners would prefer a smaller one.

Political Participation

SDT-2013-06-LGBT-7-11

On measures of political registration and voting, the LGBT population is as politically active as the general public. About three-quarters (77%) say they are certain they are registered to vote, nearly identical to the rate among the public (74%).

And about three-quarters of LGBT adults say they always (49%) or nearly always (26%) vote, little different than the 71% of the public who say they vote always (50%) or nearly always (21%).

Gay men and lesbians are registered to vote at higher rates than bisexuals (83% of gays and lesbians vs. 69% of bisexuals) and are also more likely to say they vote often. Younger bisexuals (those age 44 and younger) are significantly less likely than their gay and lesbian counterparts to be registered or regularly vote, although there is no difference in registration rates between bisexuals and gays and lesbians ages 45 and older.

As is the case among the general public, younger LGBT adults are less likely than older adults to be registered or report voting.

On a measure of attention to government and public affairs, 31% of LGBT adults report following government affairs most of the time, while 51% of the general public says this. This gap between LGBT adults and all adults holds among most age groups. However, a word of caution in interpreting this difference, since it may be attributable to differences in survey administration between the LGBT survey and general populations surveys.40

Appendix 1: Survey Methodology

About the Survey of LGBT Adults

The analysis of the experiences and attitudes of the LGBT population in this report is based on a survey conducted April 11-29, 2013, among a sample of 1,197 self-identified LGBT adults, 18 years of age or older. The survey was conducted by the GfK Group using KnowledgePanel, its nationally representative online research panel. KnowledgePanel members are recruited through probability sampling methods and include both those with internet access and those without (KnowledgePanel provides internet access for those who do not have it and, if needed, a device to access the internet when they join the panel). A combination of random digit dialing (RDD) and address-based sampling (ABS) methodologies have been used to recruit panel members (in 2009 KnowledgePanel switched its sampling methodology for recruiting panel members from RDD to ABS). The panel comprises households with landlines and cellular phones, including those only with cell phones, and those without a phone. Both the RDD and ABS samples were provided by Marketing Systems Group (MSG). KnowledgePanel continually recruits new panel members throughout the year to offset panel attrition as people leave the panel. The survey was conducted in English.

Panel members complete an annual profile survey that includes a range of demographic, attitudinal and behavioral questions. Among these are questions about sexual orientation and gender identity. A total of 3,645 panelists classified as LGBT in response to the profile questionnaire, although some are no longer active in the panel. All active members of the GfK panel who identified as LGBT in the profile survey were eligible for inclusion in this study, but only one person per household (where more than one LGBT individual resided), randomly selected, was recruited for the study. In all, 1,924 panelists were invited to take part in the survey. All sampled members received an initial email to notify them of the survey and provide a link to the survey questionnaire. Additional follow-up reminders were sent to those who had not yet responded as needed. In order to avoid any potential response bias related to the topic of the survey, the invitations did not describe the content or target population of the study.

The Pew Research survey relies on a random sample of adults who have agreed to be a part of the GfK KnowledgePanel and complete surveys in exchange for a modest monetary reward. Interviews are conducted online, with no interviewer present. This is not an anonymous survey, but the level of trust established between respondents and the survey organization is likely to be high. Consequently, it is possible that some LGBT individuals who would be unwilling to disclose their status in other contexts are willing to identify themselves as LGBT in this panel.41 Considerable research on sensitive issues (such as drug use, sexual behavior and even attendance at religious services) indicates that the online mode of survey administration is likely to elicit more honest answers from respondents on a range of topics.42 The percentage of GfK KnowledgePanel respondents who identify as LGBT is 5.2%.

Identifying and Interviewing LGBT Respondents

A total of 1,924 members of the GfK KnowledgePanel who had identified as LGBT in their profile survey were recruited to take the current survey; 1,422 of these completed enough of the interview to determine their eligibility for the study. All of those recruited to the study were offered a $10 incentive to complete the interview; near the end of the field period, the incentive was increased to $20 to reduce the rate of non-response. All respondents who completed the screening questions (below) were given the incentive, regardless of whether they were determined to be eligible for the study or not.

The survey opened with general political questions and other topics unrelated to LGBT identity and experiences. Before the survey shifted to questions of particular relevance to LGBT individuals, respondents were asked the following questions about their sexual orientation and gender identity in order to reconfirm their eligibility for the survey:

SDT-2013-06-LGBT-A1-01

Those whose answers indicated that they were not LGBT were asked the following question:

SDT-2013-06-LGBT-A1-02
SDT-2013-06-LGBT-A1-03

Overall, the vast majority of gay men (99%) and lesbian women (98%) reconfirmed as LGBT in the screening questions, though a few indicated that they belonged to a different category in the current survey than in their profile. Similarly, 85% of bisexuals reconfirmed as LGBT, including 78% who said they were still bisexual (2% identified as lesbian, 3% as gay and 2% as transgender). But most respondents who had indicated that they were transgender in the profile survey failed to reconfirm in any LGBT category. Among all those contacted for the Pew Research survey who identified as transgender in the profile survey (N=181), 23% reconfirmed as transgender in the current survey and an additional 11% identified as lesbian, gay or bisexual.

Respondents who did not reconfirm as LGBT (15%) were thanked for their time and told that the interview was over. In addition, five respondents who appeared qualified for the survey on the basis of these screening questions subsequently indicated during the interview that they were not LGBT; they, too, are excluded from the survey.

Twenty other individuals appeared qualified for the survey but broke off and did not complete the questionnaire, yielding a break-off rate of 1.1%. The final qualified sample size is 1,197. In all, 73% of those invited to take the survey screened in as qualified and completed the interview, screened out as not qualified, or indicated in their answers to other questions that they were not qualified. The cumulative response rate (CUMRR1) based on the household recruitment rate for the panel, the household profile completion rate, and the cooperation rate for this study is 7.4%. Including the average panel attrition rate in the calculation (CUMRR2) produces a response rate of 2.6%.43

Respondents who indicated that they are both transgender and either gay, lesbian or bisexual were asked which term (e.g., transgender or gay) they would prefer that the survey use in referring to them in the rest of the survey. This term was then automatically inserted at the appropriate places in subsequent questions.

Questionnaire Development

The questionnaire was developed by the Pew Research Center. The design of the questionnaire was informed by the advice and counsel of two external advisers on the project: Gary J. Gates of the Williams Institute at UCLA and M.V. Lee Badgett of the University of Massachusetts, Amherst. In addition, the development of the questionnaire was informed by a focus group discussion of LGBT adults in the Washington, DC, area that met on March 26, 2013, at the offices of the Pew Research Center. The online questionnaire also benefited from comments and advice by GfK staff. As a further check on the questionnaire, the survey was administered as a slow launch, i.e., with a small group of panelists at the beginning of the field period. These respondents were also asked an additional open-end question to solicit feedback on any problems with clarity or other issues in the questionnaire. The Pew Research Center had final authority and responsibility for the design of the questionnaire and retains sole responsibility for the analysis and interpretation of survey findings. The median length of the questionnaire was 19 minutes.

Survey Weighting

The final qualified sample was weighted in several steps. All members of the KnowledgePanel carry a weight designed to produce a nationally representative sample of the U.S. adult population. This weight uses an iterative technique that matches gender, age, race/ethnicity, education, region and metropolitan area to parameters from the April 2013 Census Bureau’s Current Population Survey (CPS). In addition, the sample is weighted to match household income and homeownership status to a parameter from the March 2012 CPS survey and to match current patterns of internet access from the July 2011 CPS survey. This weight is multiplied by an initial sampling or base weight that corrects for differences in the probability of selection of various segments of the sample and by a panel weight that adjusts for any biases due to nonresponse and noncoverage at the panel recruitment stage (using all of the parameters described above). Details about the KnowledgePanel panel-level weights can be found at http://www.knowledgenetworks.com/knpanel/KNPanel-Design-Summary.html.

Because the final sample is narrowed to LGBT members of the panel, an additional weighting step was taken to correct for any potential biases introduced at this stage. This step weighted the LGBT sample selected for the survey to match the characteristics of the full sample of 3,645 members of the panel who are identified as LGBT, with an adjustment to correct for the different rates by which lesbians, gays, bisexuals and transgender individuals reconfirmed their eligibility for the study when interviewed. The sample was weighted using an iterative technique that matches gender, age, race/ethnicity, education, region, metropolitan area and household income among LGBT individuals to targets derived from the weighted sample of all LGBT individuals in the panel.

An additional adjustment was made to align the Hispanic composition of the sample to a target based on a weighted average of the KnowledgePanel (N=3,645 LGBT individuals), the 2008-2012 General Social Surveys (LGBT N=188) and a telephone survey of 2,669 LGBT respondents from RDD telephone surveys conducted June-August 2012 by the Gallup Organization. The KnowledgePanel survey estimated the Hispanic share of the LGBT population at 22.5%, compared with 14.0% in the Gallup sample and 15.6% in the General Social Survey. The weighted average of the Hispanic share of LGBT respondents in these three surveys was computed by using the effective sample sizes of each survey to determine its relative contribution to the average.

Sampling errors and statistical tests of significance take into account the effect of weighting at each of these stages. The margin of sampling error at the 95% confidence level is plus or minus 4.1 percentage points for results based on all LGBT respondents (N=1,197). Sample sizes and margins of error for key subgroups of the sample are shown below. There were too few confirmed transgender respondents to tabulate separately (N=43). Sample sizes and sampling errors for other subgroups are available upon request.

SDT-2013-06-LGBT-A1-04

In addition to sampling error, one should bear in mind that question wording and practical difficulties in conducting surveys can introduce error or bias into the findings of opinion polls.

Profile of Pew Research Center 2013 LGBT Survey Respondents

The LGBT survey sample is evenly split by gender—50% of respondents identify as male, and 49% as female. Among bisexuals, almost three-fourths (73%) are females, and 27% are men.

SDT-2013-06-LGBT-A1-05

Among respondents in the survey, 30% are ages 18-29. Some 39% are ages 30-49, and 23% are ages 50-64. Just 9% are ages 65 or older. Bisexuals are younger, on average, than gay and lesbian respondents. Fully 38% are younger than age 30, as compared with 31% of lesbians and only 21% of gay men.

Two-thirds (66%) of respondents are non-Hispanic whites, and 17% are Hispanic. Smaller shares are non-Hispanic blacks (10%). Bisexual respondents include a significantly higher share of blacks (14%) than do gay men (7%). Conversely, gay male respondents are significantly more likely to be Hispanic (21% are) than bisexual respondents (12% are).

Overall, some 93% of respondents in the LGBT sample were born in the United States. The remainder were born in a U.S. territory or a foreign country.

About one-third (32%) of LGBT respondents have a bachelor’s degree or more, and an additional 36% have some college experience. One-third (33%) have a high diploma or less. Bisexual respondents are far less likely than gay or lesbian respondents to have a bachelor’s degree (23% do); this is probably in part a reflection of their younger age profile.

Some 39% of LGBT respondents report annual family incomes of less than $30,000; another 39% report incomes of $30,000 to $74,999; and 20% have incomes of $75,000 or more. Gay male respondents are particularly affluent, with more than one-fourth (27%) having incomes of $75,000 or more, while bisexual respondents are less affluent—only 12% report such high family incomes.

Survey respondents are located throughout the U.S. Fully one-third (34%) live in the South, and 27% reside in the West. One-fifth (20%) are in the Northeast, and the same share resides in the Midwest. Respondents are concentrated in more urban areas—89% live within a metropolitan statistical area (MSA), while 11% reside in more rural parts of the country.