Pew Research Center is a nonpartisan, nonadvocacy fact tank that informs the public about the issues, attitudes and trends shaping the world. It does not take policy positions. The Center conducts public opinion polling, demographic research, computational social science research and other data-driven research. It studies politics and policy; news habits and media; the internet and technology; religion; race and ethnicity; international affairs; social, demographic and economic trends; science; research methodology and data science; and immigration and migration. Pew Research Center is a subsidiary of The Pew Charitable Trusts, its primary funder.
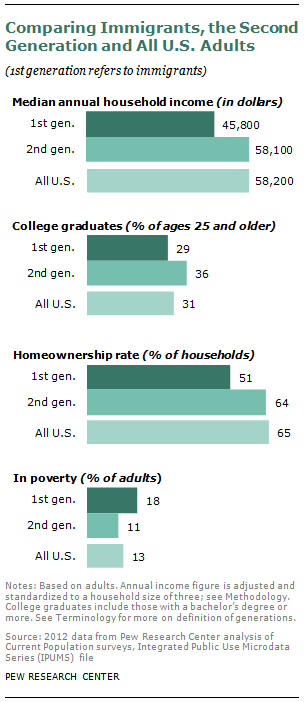
Second-generation Americans—the 20 million adult U.S.-born children of immigrants—are substantially better off than immigrants themselves on key measures of socioeconomic attainment, according to a new Pew Research Center analysis of U.S. Census Bureau data. They have higher incomes; more are college graduates and homeowners; and fewer live in poverty. In all of these measures, their characteristics resemble those of the full U.S. adult population.
Hispanics and Asian Americans make up about seven-in-ten of today’s adult immigrants and about half of today’s adult second generation. Pew Research surveys find that the second generations of both groups are much more likely than the immigrants to speak English; to have friends and spouses outside their ethnic or racial group, to say their group gets along well with others, and to think of themselves as a “typical American.”
The Pew Research surveys also find that second-generation Hispanics and Asian Americans place more importance than does the general public on hard work and career success. They are more inclined to call themselves liberal and less likely to identify as Republicans. And for the most part they are more likely to say their standard of living is higher than that of their parents at the same stage of life. In all of these measures, the second generation resembles the immigrant generation more closely than the general public.
As the U.S. Congress gears up to consider immigration legislation, this new Pew Research report on second-generation Americans looks at the attitudes, values, life priorities, economic experiences, intergroup relations and identity markers of a group that will have a significant impact on the nation’s economy and politics for decades to come.
Given current immigration trends and birth rates, virtually all (93%) of the growth of the nation’s working-age population between now and 2050 will be accounted for by immigrants and their U.S.-born children, according to a population projection by the Pew Research Center.
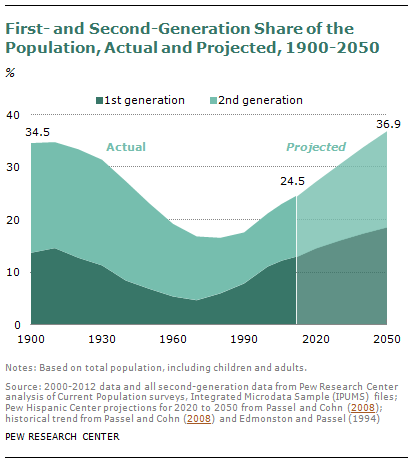
By then, the nation’s “immigrant stock” (first and second generations combined, adults and children combined) could grow from 76 million now to more than 160 million, at which point it would comprise a record share (37%) of the U.S. population.1
The focus of this report is on the 20 million adult members of the second generation (an additional 16 million U.S-born children of immigrants are under the age of 18).
This is a heterogeneous group that includes many younger Hispanic, Asian-American and white adults who are the children of modern-era immigrants as well as many older adults who are mostly the children of European immigrants who arrived as part of an earlier immigration wave that peaked a century ago.
Given the diversity of this population, two caveats are in order. First, the data presented here should not be interpreted as proving or disproving that there has been upward mobility between immigrant parents and their children.2 That’s because many of today’s second generation are not the children of today’s immigrants; many are the children of early 20th-century immigrants, now deceased. Second, the aggregate data on today’s second generation conceal what are often large subgroup differences by race and ethnicity. Whenever possible in this report, we disaggregate findings by these and other relevant demographic characteristics.
Here is a summary of key findings:
Educational and Economic Attainment: Adults in the second generation are doing better than those in the first generation in median household income ($58,000 versus $46,000); college degrees (36% versus 29%); and homeownership (64% versus 51%). They are less likely to be in poverty (11% versus 18%) and less likely to have not finished high school (10% versus 28%). Most of these favorable comparisons hold up not just in the aggregate but also within each racial/ethnic subgroup (e.g., second-generation Hispanics do better than first-generation Hispanics; second-generation whites do better than first-generation whites, and so on).
Identity:
Pew Research surveys of Hispanics and Asian Americans—the groups that comprise the bulk of the modern immigration wave—find that roughly six-in-ten adults in the second generation consider themselves to be a “typical American,” about double the share of immigrants who say the same. Still, most in the second generation also have a strong sense of identity with their ancestral roots. Majorities say they identify themselves most often by their family’s country of origin (i.e., Mexican, Chinese American) or by a pan-ethnic or racial label (i.e., Hispanic or Asian American). Some 37% of second-generation Hispanics and 27% of second-generation Asian Americans say they most often describe themselves simply as “American.”
Intergroup Relations: About half of second-generation Latinos (52%) and about two-thirds of Asian Americans (64%) say their group gets along well with all other major racial and ethnic groups in America; smaller shares of Latino (26%) and Asian-American (49%) immigrants say the same. The second generations of these groups are also more likely than the immigrants to say they have friends outside of their ethnic or country of origin group.
Intermarriage.
About one-in-six (15%) married second-generation adults have a spouse of a different race or ethnicity from themselves, compared with 8% of all immigrants and 8% of all U.S. adults. Intermarriage rates are especially high for second-generation Hispanics (26%) and Asian Americans (23%).
Belief in Hard Work. About three-quarters of second-generation Hispanics (78%) and Asian Americans (72%) say that most people can get ahead if they’re willing to work hard. Similar shares of the immigrant generations of these groups agree. By contrast, 58% of the full U.S. population of adults feel the same way, while 40% say that hard work is no guarantee of success.
Political and Social Values:
Second-generation Hispanics and Asian Americans, as well the first generation of each group, identify more with the Democratic Party than the Republican Party and characterize themselves as liberals at higher rates than the general public. About half or more of the second generation believe that abortion should be legal, and more than two-thirds say homosexuality should be accepted by society. The relative youth of the second generation contributes to, but does not fully explain, their liberal political leanings.
Nonmarital Childbearing: In what some scholars have described as a pattern of negative assimilation, 41% of second-generation women who recently gave birth were unmarried, compared with 23% of immigrant women who recently gave birth. The higher share of nonmarital childbearing among the second generation has been driven mostly by second-generation Hispanic women (52% of these women with a recent birth were unmarried). Among the U.S. population as a whole, 36% of women who recently gave birth were not married.3
Language Usage: About nine-in-ten second-generation Hispanic and Asian-American immigrants are proficient English speakers, substantially more than the immigrant generations of these groups. When it comes to retaining one’s ancestral language, there are sizable differences by race and ethnicity. Eight-in-ten second-generation Hispanics say they can speak Spanish at least pretty well; just four-in-ten second-generation Asian Americans say the same about their parents’ native tongue.
Perceptions of Generational Mobility.
By lopsided margins, most second-generation Hispanics (67%) and Asian Americans (75%) say their standard of living is better than that of their parents at the same stage of life. Similar shares of the immigrant generations of both groups say the same. By contrast, 60% of the full U.S. population feel the same way. Looking ahead, two-thirds of second-generation Hispanics, but 41% of Asians, believe their own children will eventually surpass their current standard of living. Overall, 48% of American adults say the same.
Comparisons with Parents’ Country of Origin: Seven-in-ten second-generation Asian Americans and eight-in-ten (81%) second-generation Hispanics say that conditions for raising children are better in the U.S. than in their parents’ country of origin. Like immigrants, they also rate the U.S more favorably than their ancestral country in terms of treatment of the poor and the opportunity to get ahead. Less than half of both generations rate the U.S. as better than their ancestral country as a place to maintain strong family ties.
Population Projections. Immigrants tend to have higher birth rates than do native-born Americans.4 If current immigration flows and birth rates continue, then by 2050, an estimated 37% of the U.S. population—highest in modern history—will be immigrants or the children of immigrants, according to a 2008 Pew Research population projection. That projection also shows that, because of the aging of the Baby Boomer generation, as much as 93% of the growth of the working-age population between now and then will be accounted for by immigrants (43%) or their U.S.-born children (50%).
Group Differences within the Second Generation
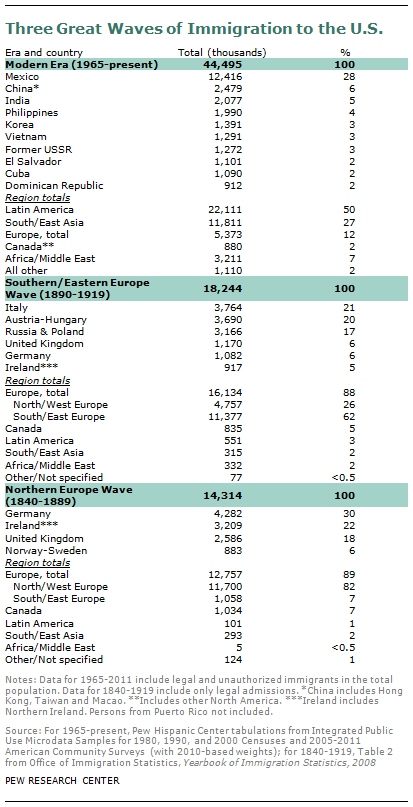
The modern immigration wave to this country began with the passage of landmark legislation in 1965 that had the effect, for the first time in the nation’s history, of opening U.S. borders on a roughly equal basis to non-Europeans as well as Europeans. Half of the 44 million immigrants who have come since then have been from Latin America, about a quarter (27%) from Asia, and the remainder from other regions.5 In the nation’s two previous immigration waves during the late 19th and early 20th centuries, nearly nine-in-ten new arrivals were Europeans.
Hispanics and Asian Americans are the focus of the Pew Research survey research findings in this report. Each of these groups include immigrants from more than a dozen countries, all with unique cultures, characteristics and migration histories.6
Despite these country-of-origin differences, some broad patterns are evident. The bulk of Hispanic immigrants have relatively low levels of formal education and work in low-skilled, low-paying jobs, while the majority of Asian immigrants (especially those who have arrived in the past few decades) have relatively high levels of education and skills that help position them for jobs in higher-skilled occupations.
These large racial or ethnic group differences in the human capital of recent immigrants are echoed in the socioeconomic profile of the second generation. For example, some 55% of second-generation Asian Americans have a bachelor’s degree or more, compared with 21% of Hispanics. There are also gaps in household income and poverty rates among second-generation Hispanics and Asian Americans.
But while large gaps remain between groups, it is also the case that within each group, the second generation is doing better than the first on most key measures of economic success.
Intergenerational Mobility, Now and Then
Some scholars of immigration have questioned whether today’s immigrants and their offspring will be able to match the high levels of intergenerational upward mobility experienced by much of the immigrant stock of the 19th and early 20th centuries.7
The skeptics cite many factors: Most modern immigrants are non-white and thus face deeply ingrained social and cultural barriers; about a quarter of today’s immigrants (the vast majority of whom are Hispanic) have arrived illegally and thus must navigate their lives in the shadows of the law; globalization and technology may have eliminated many of the jobs that provided pathways to the middle class for earlier generations of hard-working but low-skilled immigrants; the relative ease of travel and communication have enabled today’s immigrants to retain their ties to their countries of origin and may have reduced incentives to adapt to American customs and mores.
It is beyond the scope of this report to make definitive statements about the success of today’s second-generation immigrants compared with those of earlier eras. Most of our data trends do not extend that far back in history. Moreover, with so many of today’s second generation just now starting to age into adulthood (16 million are under the age of 18), and with more than a million new immigrants continuing to arrive each year, it will take decades before one can attempt a comprehensive generational scorecard of the modern wave of immigrants and their children.
What we can say with certainty is that members of the second generation will have a major impact on this nation’s destiny for decades. And at this stage of their journey, we can provide some empirical assessments of their economic circumstances. For Hispanics and Asian Americans—the groups that comprise the bulk of the modern immigration wave—we can also provide some empirical assessments of their attitudes and beliefs, based on data gathered from our own surveys and those of the Census Bureau.
A Roadmap to the Report
The remainder of this report is organized as follows: Chapter 2 presents a detailed analysis of U.S. Census Bureau data on the second generation in comparison with immigrants, with third and higher generations and with the U.S. adult population. Generational patterns are also examined separately for each of four racial and ethnic groups: Hispanics, Asian Americans, non-Hispanic whites and non-Hispanic blacks.
Chapters 3 through 7 supplement this demographic portrait with an analysis of recent Pew Research Center surveys conducted with a nationally representative sample of Hispanics and a separate representative survey of Asian Americans on a range of topics. These chapters compare the second generation with the first generation in each group. No analysis of third-and higher-generation Hispanics or Asian Americans is included due to the small sample sizes of those subgroups in the survey data. Comparisons to the general public using data from other recent Pew Research Center surveys are included wherever possible. Survey data with an adequate number of second-generation whites and blacks for analysis is not available. Thus, the survey comparisons are limited to the two race or ethnic groups comprising the bulk of the modern immigration wave. These comparisons help illuminate the ways in which the second generation tends to be similar and dissimilar to the first generation within each race or ethnic group, but they cannot be used to characterize the second generation in the U.S. as a whole.
Chapter 3 looks at questions of self-identity, proficiency in English and attitudes about maintaining their ancestral language. Chapter 4 examines how the generations see their quality of life in relation to their parents, their expectations for their children, and their perception of their financial well-being. Chapter 5 examines attitudes about intergroup relations and intergroup marriage. This chapter includes a detailed analysis of data from the U.S. Census Bureau on the rate of intergroup marriage for all adults in the U.S. and separately for Hispanics, Asian Americans, whites and blacks. Chapter 6 focuses on attitudes about political party, ideology and social issues. Chapter 7 considers a wide array of other topics, including views about discrimination, personal goals, values and comparisons between the U.S. and their ancestral country. The appendices provide a detailed explanation of the methodologies used and a topline summary of the survey findings for Hispanics and Asian Americans. They also provide detailed tables, drawn from 2012 census data, that show the socioeconomic characteristics of first, second and third and higher generations of whites, blacks, Hispanics and Asian Americans.
About the Authors
This report is a joint effort of survey researchers, demographers and writers in the Pew Research Center. Paul Taylor, executive vice president of the Pew Research Center, wrote the overview and provided editorial guidance for the report. Senior writer D’Vera Cohn wrote the demographic analysis in Chapter 2 with data analysis and advice from research associate Ana Gonzalez-Barrera, senior demographer Jeffrey S. Passel and senior researcher Gretchen M. Livingston. Wendy Wang, research associate, number-checked Chapter 2 along with the detailed demographic tables in Appendix 1 and the analysis of intermarriage in Chapter 5. Chapter 3 was written by Livingston. Chapters 4 and 6 were written by senior researcher Cary Funk. Rich Morin, senior editor, wrote Chapters 5 and 7 with the assistance of Funk and Livingston. The analysis of intermarriage in Chapter 5 also benefited from the advice of Passel and Wang. Research assistant Eileen Patten number-checked Chapters 1, 3, 4 and 5. Research assistant Seth Motel number-checked Chapters 6 and 7 and prepared charts and tables for Chapters 1 and 2. Patten, Motel and Gonzalez-Barrera also assisted with other aspects of the report including compiling and checking the topline of findings, preparing charts and formatting the final report. The report was copy-edited by Marcia Kramer of Kramer Editing Services.
The report also benefited from the advice and guidance of Mark Hugo Lopez, associate director of Pew Research Hispanic Center; Rakesh Kochhar, associate director of research of Pew Research Hispanic Center; Kim Parker, associate director of Pew Research’s Social & Demographic Trends project; Phillip Connor, research associate in the Pew Research Center’s Forum on Religion & Public Life; Scott Keeter, the Pew Research Center’s director of survey research; and Leah Christian, senior researcher in the Pew Research Center.
Notes on Terminology
All references to whites, blacks and others are to the non-Hispanic components of those populations. Asians include a small number of Hispanics. Whites, blacks and Asians are single-race-only groups. “Others” includes persons reporting single races not listed separately and persons reporting more than one race.
The terms “Latino” and “Hispanic” are used interchangeably in this report.
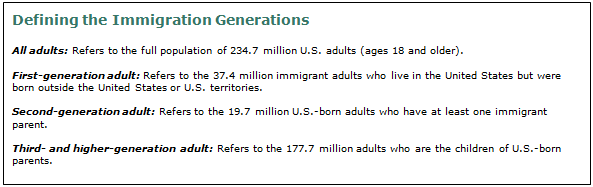
“Foreign born” refers to people born outside of the United States, Puerto Rico or other U.S. territories to parents neither of whom was a U.S. citizen. “Foreign born” and “immigrant” and “first generation” are used interchangeably. Unauthorized immigrants are included in this group.
“Native born” or “U.S. born” refer to people who are U.S. citizens at birth, including those born in the United States, Puerto Rico or other U.S. territories and those born abroad to parents at least one of whom was a U.S. citizen.
“Multi-generational family households” refer to those that include at least two adult generations (with the younger generation including at least one adult who is 25 years old or older) or households consisting of grandparents and grandchildren, with no parent present.
References to demographic data for all adults or the total population are to the civilian noninstitutional population included in the Current Population Survey. See Methodology for more information.
Immigrant Generations
“First generation” or “foreign born” refers to people born outside of the United States to parents neither of whom was a U.S. citizen. For this report, people born in Puerto Rico or other U.S. territories are not considered foreign born.
“Second generation” refers to people born in the United States, with at least one first-generation (immigrant) parent. People born in Puerto Rico or other U.S. territories with at least one parent born in a different country are considered second generation.
“Third and higher generation” refers to people born in the United States, including Puerto Rico or other U.S. territories with both parents born in the United States, including Puerto Rico or other U.S. territories.
Chapter 2: Demographic Portrait of Adult Children of Immigrants
Overview
Many of the nation’s U.S.-born children of immigrants are just coming into adulthood, but as a group they already are having an impact on the nation’s communities, workforce, electorate and other realms of American life.
The most striking features of this U.S. second generation—the adult children of immigrants—are their youth and their racial and ethnic background. Most were born since the onset of the nation’s most recent four-decade wave of immigration, mainly from Latin America and Asia.
The median age of second-generation adults is 38, compared with 43 for foreign-born adults and 46 for all adults. This generation is distinct as well for its racial and ethnic mix, in which no group holds a majority, and for its above-average intermarriage rate.
Second-generation adults in the U.S. today are not necessarily the children of immigrants in the U.S. today. Although today’s second generation includes some adults who are the children of today’s immigrant population, it also includes some whose parents arrived more than a century ago and are no longer living so are not in the data. The reverse also is true: Today’s immigrants are not necessarily the parents of the adult second generation. The U.S. first generation includes some immigrants who have no children or whose children are not yet adults.
Furthermore, because generational progress occurs over years or decades, a true comparison between the first and second generations would show today’s second generation compared with their parents at a similar stage of life. That would require historical data not available here.
For these reasons, comparisons between immigrant generations should not necessarily be used to assess generational progress.
That said, a snapshot comparison indicates that in some realms of life, the second-generation U.S.-born adult children of immigrants are better off than the people who make up the first generation. They have more education, reflecting the higher educational attainment in the U.S. compared with the home countries of many immigrants. Their higher education levels help explain why they have higher household incomes and a lower share in poverty than immigrants. They are slightly less likely to be married than immigrants, reflecting their younger age structure, and their share of births to unmarried mothers is higher, perhaps reflecting adaptation to U.S. customs.
In general, the second generation, who are U.S. citizens at birth regardless of their parents’ immigration status, resembles the overall population more than it does the first generation. One prominent exception is that both first- and second-generation adults are more likely than the adult population overall to live in multi-generational family households.
Both the first- and second-generation populations of adults grew about 14% from 2006 to 2012, twice the 7% growth rate for adults overall, according to data from the Current Population Survey. Since 2000, the immigrant adult population has grown 35%, and the number of second-generation adults has grown 20%. The nation’s 37 million foreign-born adults outnumber the nearly 20 million second-generation adults. Second-generation adults made up 8% of the adult population in 2012.
The second generation’s share of the U.S. population—children as well as adults—peaked during the early decades of the 20th century, when about 20% of U.S. residents of all ages had immigrant parents. But the relative size of the second generation began to fall as the large wave of immigration that began in the late 19th century came to an end. Immigration flows dropped steadily in the 1920s and virtually ceased during the Great Depression and World War II. By 1990, the second generation represented only 10% of the population, a 20th century low, before its share began to rise again as a result of a new immigration wave that began in the 1960s.
This report focuses on the 20 million adult children of immigrants. There also are roughly 16 million second-generation children, ages 17 and younger, for a total of 36 million second-generation residents of the U.S. Thus, as the second-generation children reach adulthood, the second generation is poised to continue as a sizable segment of the population.
Among second-generation adults, fully 35% are ages 18-29, higher than this age group’s 22% share of the overall adult population and 18% share among immigrant adults. In fact, among all 18- to 29-year-olds, second-generation adults (6.9 million) slightly outnumber those in the immigrant generation (6.8 million), the only age group for which this is so. The second-generation share of the adult population is 8%, but they represent 14% of adults ages 18 to 29.
The second generation has a smaller share of middle-aged adults—ages 30 to 64—than does the foreign-born population or overall population. Only 44% of the second generation is in this age group, compared with 68% of immigrants and 61% of all adults. But 21% are ages 65 and older, reflecting births that followed the early 20th-century influx of immigrants, mainly from Europe. By comparison, only 13% of immigrants and 18% of adults overall are ages 65 and older.
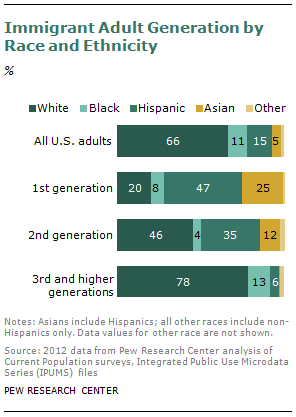
Whether all age groups or only adults are included, the current second generation has no race or ethnic majority, in contrast to the majority-white makeup of the overall population and of past waves of immigration. Among adult children of immigrants, whites account for 46%, Hispanics 35%, Asian Americans 12% and blacks 4%. The remainder of the second generation includes adults from smaller non-Hispanic race groups, such as Pacific Islanders, as well as adults who are of more than one race.
By contrast, among immigrant (first-generation) adults, 20% are white, while 47% are Hispanic, 25% Asian American and 8% black.
Hispanics and Asians represent about seven-in-ten of the nation’s adult immigrants, and their adult children will be the most prominent legacy of the current wave of immigration. The second generation makes up an important and growing share of the nation’s adult Hispanic and Asian-American populations. Among Hispanics, 20% of adults are the children of immigrants. Among Asian Americans, 19% are. The second generation makes up a smaller share of white adults (6%) and black adults (3%).
The residential pattern of the second generation is similar to that of foreign-born adults and both differ somewhat from adults overall. The West is the most likely region for the second and first generations to live—more than a third of each reside there, compared with about a quarter of adults overall. Notably lower shares of the adult children of immigrants (13%) and immigrants themselves (11%) live in the Midwest, compared with all adults (21%).
Somewhat lower shares of adult children of immigrants (27%) and immigrants (32%) live in the South, compared with adults overall (37%).
Educational Attainment
As a group, the adult children of immigrants are more highly educated than are immigrant adults and the overall population. More than a third (36%) have at least a bachelor’s degree, compared with 29% of immigrants and 31% of all adults. Second-generation adults are much more likely than immigrants to have completed high school: Only 10% have less than a high school diploma, compared with 28% of immigrants and 12% of all adults.
In comparing immigrants and the second generation, the second generation is more likely to hold at least a high school diploma not just overall but also in each age group analyzed—25 to 29, 30 to 39, 40 to 49, 50 to 64 and ages 65 and older. When it comes to having a college education, the second generation is more likely than the first to do so in each age group except for adults ages 65 and older, when both groups are equally likely to be college-educated.
Compared with the population overall, second-generation adults are at least as likely to have graduated from college in each age group. Second-generation adults in each age group are slightly less likely than the population overall to lack a high school diploma.
Among young adults, ages 18-24, the second generation and all adults have markedly lower high school dropout rates than do foreign-born young adults. Among 18- to 24-year-old children of immigrants, 7% have not completed high school and are not enrolled in school, compared with 18% of foreign-born adults of similar ages.
Economic Well-Being
On average, the economic well-being of the second generation tracks that of the adult population overall and is higher than that of immigrants. Adult children of immigrants have a median household income of $58,100 a year, compared with $58,200 for adults overall and $45,800 for foreign-born adults.
In this report, household incomes are adjusted and standardized to a household size of three to account for differences in average household size that affect the amount of income available to each member of the household.
The overall income differences between the second generation and the total adult population are influenced by the relative youth of the second generation. For example, only 15% of second-generation adults are ages 50-64, when incomes are at their peak, compared with 26% of the total population and 23% of immigrants who are in that age group.
Among young adults, ages 18-29, differences in median adjusted household income between the second generation and overall population are relatively modest, but those differences widen in the second generation’s favor at subsequent ages, until ages 65 and older. But because the second generation is so heavily young, compared with all adults, its income profile is pulled down by the more modest incomes of its large contingent of young adults.
Compared with immigrants, the second generation has a higher adjusted median household income in all age groups, but the gap widens among adults in their 30s and older, until ages 65 and older.
Homeownership, Poverty, Insurance
Second-generation adults are more likely to own their own homes than are immigrant adults and are about as likely as the overall population to be homeowners. This pattern holds for all age groups. In 2012, the homeownership rate for second-generation householders was 64%, compared with 51% for immigrant householders and 65% for all householders.
Second-generation adults are on average less likely to be in poverty than are immigrants and slightly less likely than adults overall. The overall share in poverty for the adult children of immigrants is 11%, compared with 18% for foreign-born adults and 13% for all adults.
Among adult children of immigrants, the share in poverty for adults ages 18 to 64 is higher than that of older adults—13% compared with 6%. This pattern is similar among all adults, but the share in poverty for immigrant adults is similar in both age groups (18% for ages 18 to 64 and 16% for ages 65 and older).
About one-in-five second-generation adults (19%) do not have health insurance. That is comparable to the share of all adults who are uninsured and is notably lower than the one-in-three (34%) foreign-born adults who do not have health insurance.
Employment and Occupation
Among second-generation adults, 62% are in the labor force, compared with 68% of foreign-born adults and 65% of all adults. Of those, 9.3% of second-generation adults were unemployed in March 2012, compared with 8.6% of immigrants and 8.3% of all adults.
Many differences between the generations can largely be explained by differences in age structure. Immigrants are more likely than others to be in their 30s and 40s, the prime working ages. The second generation still has an above-average share in the 18-29 age group, many of whom are still in school, as well as an above-average share of those ages 65 and older, who are more likely to be retired from the workforce.
Compared with foreign-born adults, the second generation is more likely to be in white-collar jobs such as management or office services. They are less likely to be in service, construction, transportation or maintenance occupations.
The most common job category for all adult generations is management, professional and related occupations, which accounts for 40% of jobs held by members of the second generation but 31% of those held by immigrants. An additional 28% of second-generation adults hold sales and office support jobs, compared with 17% of immigrants. The profile for all adults is more similar to that of the second generation than foreign-born adults.
Only 14% of adult children of immigrants are employed in service occupations, compared with about a quarter of immigrants (23%) and 16% of all adults. The share of the second generation employed in occupations related to maintenance production transportation and material moving is 13%, compared with 19% for immigrants and 16% for adults overall. Construction, mining and farming jobs are held by 5% of the second generation, 10% of immigrants and 6% of adults overall.
Family and Living Arrangements
The living arrangements of second-generation adults are more similar to those of the overall population than to those of the first generation.
The second generation includes nearly equal shares of adults who are married (40%) and never married (42%), with a smaller share who are separated, widowed or divorced (18%). The married share is lower than for foreign-born adults (63%) and for all adults (54%). The never-married share is higher than for foreign-born adults (22%) and all adults (28%).
The relative youthfulness of the second generation explains much, but not all, of the difference in the share of adults who are married. Most Americans do not marry for the first time until their late 20s, and the second generation has a larger share of those in the 18-29 age group than do the immigrant or overall populations.
However, in each decade of life, adults in the second generation have a slightly lower currently married rate than the overall population. For those in their 20s and 30s, this is due to a larger share among the second generation who have never married. In later decades, this difference fades, but the second generation has a higher rate of divorce, separation or widowhood.
However, foreign-born adults are more likely to be married at each stage of life than the second generation or all adults. Among those ages 18-29, fully 32% are married, compared with 15% for the second generation and 21% for all adults. Marriage rates are higher for immigrants in each subsequent decade of life, until ages 65 and older.
One explanation for the higher marriage rates among immigrants is that many come from nations with higher marriage rates than the U.S. Data gathered by the United Nations, and analyzed for the 10 nations that are the top current sources of immigrants, indicate that most or all have higher shares of currently married adults, except among the oldest adults. Another contributing factor, in some cases, is that U.S. policies give high priority to spouses in allocating visas.8
Among those who are married, second-generation adults (17%) are more likely to have a spouse of a different race or ethnicity than are all adults (8%) or foreign-born adults (8%).
The higher overall second-generation shares are influenced by relative youth of the second generation, because intermarriage is more common among recent marriages than older ones.9 However, in each decade of life until age 65, intermarriage is more common for second-generation adults than for foreign-born adults or all adults. For example, among those in their 40s, 20% of second-generation adults have a spouse of a different race or ethnicity, compared with 8% of foreign-born adults and 9% of all adults.
Another factor explaining the larger share of second-generation adults who are intermarried is the large proportion of Asian Americans and Hispanics in this population. Both of these groups are more likely than the population overall to be married to someone of a different race or ethnicity.
Chapter 5 has additional detail on intermarriage by race, ethnic group and other demographic characteristics, as well as a discussion of attitudes about intermarriage from a Pew Research Center survey.
Looking at marriage by nativity—whether a U.S.-born adult has a foreign-born spouse or vice versa—both second-generation adults (17%) and first-generation adults (20%) have higher rates than do all adults (7%).
Second-generation adults are markedly more likely than the population overall to live in multi-generational households, with at least two adult generations or a grandparent and grandchild sharing living space. Among the adult children of immigrants, 22% live in multi-generational households, compared with 18% of the overall adult population and 24% of foreign-born adults.
The age group most likely to live in multi-generational family households is adults ages 25 to 34. In this age group, fully 33% of the second generation lives in such households, a markedly higher share than for comparably aged adults overall or immigrant adults (both 20%).
As the Pew Research Center recently reported, immigrants have accounted for a growing share of all births in recent decades,10 although that share has dipped since the onset of the Great Recession in 2007. Among women ages 15-44 in all race and ethnic groups, immigrants are more likely than second-generation women or all women in that age group to have had a birth in the past year.
Among all second-generation women ages 15-44, for example, 6% gave birth in the previous year, according to pooled Current Population Survey data for 2004-2010. That compares with 9% of similarly aged foreign-born women and 7% of all similarly aged women.
Among women ages 15-44 who gave birth in the previous year, second-generation women are more likely than foreign-born women to be unmarried. Using pooled Current Population Survey data for 2004-2010, 41% of second-generation mothers who gave birth in the previous year were not married, compared with 23% of foreign-born women and 36% of all women.11
Voting and Turnout
The adult children of immigrants accounted for 9% of eligible voters in 2010, the latest year for which numbers are available. (An eligible voter is defined as an adult U.S. citizen.) That share is slightly higher than for immigrants, who account for 8% of eligible voters. The turnout rate for second-generation adults—that is, votes cast as a share of eligible voters—was 43%, higher than the 37% turnout for foreign-born voters and lower than overall turnout of 46%.
What is the racial and ethnic makeup of second-generation eligible voters? In 2010, 49% were white, 33% Hispanic, 11% Asian American and 5% black. By comparison, whites represent 73% of all eligible voters, blacks represent 12%, Hispanics 10% and Asian Americans 4%.
The distribution of eligible voters by immigrant generation varies markedly by race and ethnic group. Among whites, only 6% of eligible voters are adult children of immigrants, and for blacks the share is 3%. However, 30% of eligible Hispanic voters are second-generation adults, as are 26% of eligible Asian-American voters.
Future Growth
The impact of the adult second generation is projected to grow rapidly in the coming decades. According to Pew Research Center projections, the adult second generation will grow 126% from 2012 to 2050, more sharply than the first generation (103%) or the adult population overall (42%). By 2050, the second generation will account for 16% of adult Americans, compared with about 8% in 2012.
The growth rate of the second generation will be even more striking among adults ages 18 to 64. From 2012 to 2050, the second generation working-age population is projected to grow 198%, compared with 83% for immigrants and 32% for adults overall. The second generation’s share of the working-age population, 8% in 2012, is projected to increase to 18% in 2050.
Among adults, immigrants will continue to outnumber the second generation in 2050, 75 million to 52 million. That also will be true for working-age adults, where the second generation will number 46 million and the immigrant generation 59 million.
Racial and Ethnic Portraits by Generation
This section examines each four major race and ethnic groups—Hispanics, Asians, whites and blacks—and focuses in particular on the second generation, the adult children of immigrants. The different timing of their waves of immigration affects the size of their generations. Among blacks and whites, for example, nearly nine-in-ten adults were born in the U.S. to U.S.-born parents. The great wave of white immigration happened a century ago; for blacks, a wave of voluntary immigration began only in recent decades.
The Hispanic and Asian populations are more dominated by immigrants, although the U.S.-born population is catching up among Hispanics. In both groups, a large influx of immigration began in the 1960s. Hispanics and Asians represent the future of the second generation. Although just under half of second-generation adults are Hispanic or Asian, these two groups account for more than seven-in-ten foreign-born adults.
Third Generation
The third-and-higher generation is the dominant group in the white population, accounting for nearly nine-in-ten adults. This also is true of the black population, where 86% of adults are the U.S.-born children of U.S.-born parents.
The third-and-higher generation among Asian-American adults is small—only 7% of the total—reflecting the long period of U.S. restrictions on immigrants from the Far East, Southeast Asia and the Indian subcontinent.
Among Hispanics, third-and-higher generation adults are not generally the grandchildren of recent immigrants—as proof, note that their median age (39) is only slightly lower than that of the first generation (41). They are more likely to be descendants of families that came from Latin America many generations ago. In some cases, they would have been living in U.S. territories when those areas were incorporated into the nation as new states.
Hispanic Second Generation
Among adult Hispanics, 20% are the children of immigrants and 51% are foreign born. The second generation is notably young, with a median age of 28, compared with 41 for Hispanic immigrants and 38 for Hispanic adults overall. Among second-generation Hispanics, 53% are ages 18-29 and only 6% are ages 65 and older.
Among all Hispanics, including children as well as adults, 31% are the children of immigrants and 36% are foreign born. Among this total second generation, 57% are younger than 18.
The Hispanic second generation is mainly the product of mass immigration from Latin America that began in the 1960s. By the 1980s, the number of Hispanic immigrant adults had surpassed the number of Hispanics from the third-and-higher generations, including some whose families had lived in the U.S. for more than a century.
About half of the 44 million immigrants who have come to the U.S. since 1965 are from Latin America. That flow has been dominated by the 12 million immigrants from Mexico, who account for more than half of Hispanic immigrants and about 30% of all U.S. foreign-born residents.12 But seven other Latin American nations also are among the top 20 source countries of the nation’s foreign-born population: El Salvador, Cuba, the Dominican Republic, Guatemala, Colombia, Honduras and Ecuador.
The Hispanic immigrant population is a mix of cultures, histories and characteristics. It includes refugees who fled their countries because of political repression, natural disasters or other reasons, as well as highly trained professionals. But it is dominated by the large influx of immigrants from Mexico, who are disproportionately low-educated and unauthorized. Hispanic unauthorized immigrants account for three-quarters of the U.S. unauthorized population and about 45% of Hispanic immigrants, according to a Pew Research Center analysis of government data.13
Immigrants make up about half of the Hispanic adult population. Since the 1970s, immigration had been the dominant force in Hispanic population growth, but over the past decade, births—especially to immigrants—have become the major driver.14
Fueling this trend is the fact that Hispanic immigrants not only are more likely than the U.S. population overall to be in their prime child-bearing years, but also have higher fertility.15 In addition, Hispanic immigration levels, especially from Mexico, have fallen since 2006.
As a result, the number of U.S.-born adult Hispanics has grown to nearly equal the number of adult Hispanic immigrants.
Educational Attainment
Second-generation Hispanics are better educated in general than immigrant Hispanics. About one-in-five (21%) has a college degree or more, compared with 11% of foreign-born Hispanics.
Among second-generation adults, 17% do not have a high school diploma, compared with 47% of foreign-born Hispanics.
The second generation of Hispanics is more educated than Hispanic adults overall. The share of second-generation Hispanics with at least a college degree exceeds that of Hispanics overall (and matches or betters the third-and-higher generation).16
Economic Well-Being
Household incomes of second-generation Hispanic adults are higher than those of immigrant Hispanics and all Hispanic adults. Median household income, adjusted to a household size of three, was $48,400 in 2012 for second-generation adults, compared with $34,600 for immigrant Hispanics and $39,200 for all Hispanic adults.
Half of Hispanic second-generation householders own their own homes. This rate is higher than the 43% homeownership rate for immigrant Hispanic householders and the 46% rate for all Hispanic householders.
Second-generation Hispanic adults are less likely than immigrant Hispanic adults or Hispanic adults overall to be poor. In 2012, 16% of second-generation adults were poor, compared with 23% of immigrants and 21% of Hispanic adults overall. Shares in poverty also are lower for Hispanic second-generation adults within two age subgroups—adults ages 18 to 64 and those ages 65 and older.
About a third (32%) of second-generation Hispanic adults do not have health insurance. That uninsured rate is lower than it is for foreign-born Hispanic adults, about half (49%) of whom do not have insurance. It also is lower than the 38% uninsured rate for Hispanic adults overall.
Second-generation Hispanic adults are as likely to be in the labor force as Hispanic adults overall (69% each) and slightly less likely than immigrant Hispanics (71%).
Family and Living Arrangements
Among Hispanic adults, the younger second generation is notably less likely to be married (34%) than immigrant Hispanics (60%) or Hispanics overall (49%). Most (54%) have never married, compared with 25% of immigrants and 35% of Hispanics overall. Second-generation adults are slightly more likely than foreign-born adults to be living with an unmarried partner (9% compared with 7%).
A third of Hispanic second-generation adults (33%) who are married have a spouse who is foreign born. By contrast, only 17% of married immigrant Hispanic adults have a U.S.-born spouse.
Fully 46% of second-generation Hispanic householders have dependent children living with them, compared with 54% for immigrants and 49% for Hispanic householders overall.
Among Hispanics, 30% of second-generation adults live in multi-generational family households, somewhat higher than the 26% of the Hispanic adult immigrant population or overall population who do so. Looking at 25- to 34-year-olds, 37% of Hispanic children of immigrants live in multi-generational households, compared with 19% of comparably aged Hispanic immigrants and 25% of all comparably aged Hispanics.
Among Hispanic women ages 15-44, 7% of the second generation gave birth in the previous year, compared with 9% of foreign-born women and 8% of Hispanic women overall. Half (52%) of second-generation Hispanic women who gave birth in recent years were unmarried, compared with 29% for immigrant Hispanic women and 39% for Hispanic women overall.
Asian-American Second Generation
Among adult Asian Americans, 19% have immigrant parents and 74% are immigrants themselves. The Asian-American adult second generation is notably young, with a median age of 30. Among this group, 48% of adults are ages 18-29, compared with 17% of immigrant Asian Americans and 23% of Asian Americans overall. Only 8% are ages 65 and older.
Among all Asian Americans, both children and adults, the second generation accounts for 30% of population, and immigrants make up 62%. About half (51%) are younger than 18.
The modern immigration wave from Asia, like that from Latin America, dates back to the 1960s. Until then, immigration restrictions had held down the size and growth of the Asian-American population. Asian immigrants represent about a quarter of the nation’s total immigrant population. Although they are far outnumbered by Hispanics in the U.S. foreign-born population, Asians have outnumbered Hispanics since at least 2009 among new immigrant arrivals because of a slowdown in immigration from Latin America.17
Although Asian immigrants come from dozens of nations in the Far East, Southeast Asia and the Indian subcontinent, 82% come from six countries: China, the Philippines, India, Vietnam, South Korea and Japan, according to the 2011 American Community Survey.
Immigrants account for about three-quarters of the Asian-American adult population, and therefore dominate it to a greater extent than is true for Hispanics, where immigrants are half the adult population. Among major Asian-American groups, only the Japanese are majority U.S.-born. Among Asian-American adults, the second generation outnumbers the third-and-higher generation, in contrast to the pattern of third-generation dominance among Hispanics and other racial groups.
As is true of other groups, Asian-American immigrants arrive in the U.S. through varied pathways. Most, as is true of immigrants overall, arrive on family-sponsored visas. But Asian immigrants are more likely than those from other regions to be admitted on employment visas. This is especially true of Korean and Indian immigrants, about half of whom received green cards in 2011 based on employer sponsorship. Among major subgroups, the Vietnamese are the only population to have come in large numbers as political refugees, but smaller influxes from other Asian nations also arrived with refugee status.18
About 10-11% of the U.S. unauthorized immigrant population is made up of Asian-American immigrants, and about 13-15% of the Asian-American immigrant population during the 2000-2010 decade was unauthorized, according to a Pew Research Center analysis of government data.19
Educational Attainment
Among those ages 25 and older, second-generation Asian-American adults are, on average, slightly better educated than immigrants and the overall population. More than half (55%) have at least a college education, compared with 50% of immigrants and 51% of the overall Asian-American population. Only 7% have not completed high school, compared with 12% of immigrants and 11% of the total Asian-American population.
Among those ages 18 to 24, the difference is even smaller on high school completion—3% of the second generation and overall adults have not completed high school, compared with 4% of immigrants.
Economic Well-Being
Despite their younger median age, second-generation Asian-American adults have a median household income, adjusted to a household size of three ($67,500), that is comparable to that of all Asian-American adults and slightly higher than incomes of Asian-American immigrants ($65,200).
The homeownership rate for second-generation Asian-American householders is 51%, lower than the 58% rate for immigrants and 57% rate for overall adults. However, this appears to be a function of their younger age profile. For each age group, the second-generation homeownership rate is at least as high as that of the immigrant or overall Asian-American adult populations.
Among second-generation Asian-American adults, the 12% share in poverty is similar to that for all adults and immigrants. However, among Asian Americans ages 65 and older, the share is somewhat lower for the second generation (7%), compared with immigrants (13%) and adults overall (12%).
About one-in-five second-generation adults do not have health insurance, which is similar to the rate for immigrant adults and all adults among Asian Americans.
Among Asian Americans, nearly two-thirds of second-generation adults (63%) are in the labor force, comparable to all adults and immigrant adults (65%). Their unemployment rate is somewhat higher, however, perhaps reflecting their younger age profile, since younger adults (ages 18-29) are more likely to be unemployed than older ones.
Among Asian-American adults, the second generation is less likely than immigrants to be employed in service occupations and more likely to work in sales and office support. The second generation of Asian-American adults also is slightly less likely than immigrants to be employed in maintenance, production, transportation and material moving jobs. Second-generation adults are somewhat more likely to work in the information and finance industries, and less likely to work in the manufacturing industry, compared with immigrant Asian Americans.
Family and Living Arrangements
Among the second generation, a greater share of adults have never been married (56%) than are currently married (37%), the opposite of the pattern for Asian-American adults overall and immigrant Asian Americans. This reflects the younger age profile of the second generation (26%).
Among Asian Americans, 29% of second-generation adults live in multi-generational family households, slightly higher than the 27% of foreign-born Asian Americans and 27% of all Asian Americans who do. Among 25- to 34-year-old Asian Americans, 39% of the second generation live in multi-generational family households, compared with 23% of immigrants and 28% of the total population in this age group.
Among Asian-American women ages 15-44, 4% of the second generation had a birth in the previous year, compared with 8% of immigrants and 7% of the total population. There is not enough data to make comparisons by generation for births to unmarried mothers.20
White Second Generation
Among white adults, 6% are the children of immigrants and 5% are immigrants themselves. White second-generation adults are notably older than other second-generation adults, with a median age of 57, which is eight years older than white adults overall or white foreign-born adults. In the other major race and ethnic groups, the second generation is notably younger than the first generation.
White second-generation adults are concentrated in the older age groups: Only 15% are ages 18 to 29, while 61% are ages 50 and older.
Among the total white population, 6% are the children of immigrants and 4% are foreign born. Only 23% of the white second generation is younger than 18, and 30% are ages 65 and older.
The adult second generation of whites mainly is a legacy of the great wave of European immigration in the late 19th and early 20th centuries. From 1890 to 1919, 18 million immigrants arrived, including 11.4 million from southern and eastern European nations.
The largest source of current white immigrants are the former republics of the Soviet Union, which account for about 1 million current U.S. immigrants (see table in Overview). Also among the top 20 source countries for the U.S. foreign-born population are Canada (676,000), the United Kingdom (642,000) and Germany (537,000), most of whose immigrants are white.
Educational Attainment
The white second-generation population is well educated, compared with the population overall: 39% have at least a college degree, and only 7% have less than a high school education. Among whites, second-generation adults are slightly more likely than all adults and slightly less likely than foreign-born adults to be college-educated.
Economic Well-Being
Household incomes of second-generation white adults are slightly higher than those of foreign-born white adults and slightly lower than those of all white adults. Median household income, adjusted to a household size of three, is $63,200 for second-generation adults, compared with $60,600 for immigrants and $65,800 for all white adults.
The homeownership rate among white second-generation householders is 76%. That is similar to the rate among all white householders and higher than the 64% homeownership rate for foreign-born white householders. The high share of homeownership among white second-generation adults reflects in part their older age structure. The homeownership rate rises with age, and well over half of second-generation white adults are ages 50 and older.
The share in poverty for second-generation white adults is quite low, only 7%. That share is similar to that in the overall white adult population and five percentage points lower than among white immigrants.
Only 9% of white second-generation adults have no health insurance, which is comparable to the rate among all white adults and lower than the 18% uninsured rate among white immigrant adults.
Among white second-generation adults 54% are in the labor force, a lower participation rate than for all white adults (65%) or for foreign-born white adults (61%), due largely to their older age profile. For those in the labor force, their unemployment rate in March 2012 (6.6%) was lower than that of all adults or immigrants, among whites.
Among whites, there are not notable differences in the occupation or industry patterns of second-generation adults, compared with all adults or immigrant adults.
Family and Living Arrangements
The living arrangements of older second-generation whites reflect their older age profile. About half (52%) are currently married, while 26% are divorced, separated or widowed. Both these shares are lower than for all white adults or white immigrant adults. Second-generation white adults also are notably less likely to have dependent children living at home than either all white adults or foreign-born adults. Only 19% do.
Among whites, 14% of second-generation adults live in a multi-generational family household, the same share as in the population overall and roughly similar to the share among immigrants (16%). Among adults ages 25 to 34, the second generation is notably more likely to live in a multi-generation household: 23%, compared with 14% of immigrants 16% among the overall population.
Among white second-generation women ages 15-44, 6% gave birth during the previous year, similar to the share of all white women in that age group but lower than the 8% share of immigrants. About one-in-five (19%) white second-generation women who gave birth were unmarried, compared with 29% of all white women who gave birth and 13% of white immigrant women who gave birth.
Black Second Generation
The black second generation represents a smaller slice of the overall black adult population than of other major racial and ethnic groups. Only 3% of adults have immigrant parents; 11% of adults are themselves immigrants.
The median age of the black adult second generation is quite young—only 27. Among second-generation adults, most (57%) are ages 18-29. Only 5% are ages 65 and older, compared with 11% and 13% of the first generation and all black adults.
The relative youth of this group, with a younger median age than Asian Americans, Hispanics or whites, helps explain its economic well-being and living arrangements.
In the overall black population, including both adults and children, the second generation also represents a small share of the total, only 5%.
Although the U.S. has a large black population as a legacy of slavery, voluntary black immigration began relatively recently.21 Most black immigrants during 2008-2009 were from the Caribbean (1.7 million) or Africa (1.1 million).
Voluntary immigration from the Caribbean ticked up after the Spanish-American War ended in 1898 and widened after passage of 1965 federal legislation opened immigration pathways from a greater variety of countries. Most black Caribbean immigrants come from Jamaica, Haiti, Trinidad and Tobago, and the Dominican Republic.22
Most are admitted on family visas, but at least 7% are refugees for various reasons, including Cubans, Dominicans and Haitians. About 16% of Caribbean immigrants were unauthorized in 2006-2008. Most Caribbean immigrants come from a country where English is spoken, which gives them an advantage in the job market upon arrival.
Immigration from Africa was sparse until late in the 20th century. No single country dominates the flow; the largest source country, Nigeria, accounted for 19% of black African immigrants in 2009.
Black Africans are more likely than other groups to be admitted as refugees or under a diversity visa program intended to expand immigration from underrepresented groups. African immigrants are more likely than other groups (or the U.S. born) to have graduated from college. About 21% of African immigrants are unauthorized.
Immigrants from Africa were among the fastest-growing groups within the U.S. foreign-born population from 2000 to 2009. If current trends continue, some analysts predict that Africa will replace the Caribbean by 2020 as the major source of black immigration to the U.S.
Educational Attainment
The educational attainment of black second-generation adults is high, especially compared with black adults overall, and is somewhat higher than for black immigrants. Four-in-ten (40%) have at least a college degree and only 5% have not completed high school. Among black immigrants, 31% have completed college and 14% have less than a high school diploma. Among all black adults, 21% have completed college and 14% have less than a high school diploma.
Economic Well-Being
Despite their relative youth, second-generation black adults have higher median incomes than all black adults, though lower incomes than adult immigrants. Their median household income, adjusted to a household size of three, $43,500, compares with $39,000 for all black adults and $46,500 for black immigrant adults.
Only about a third of second-generation black adult householders (32%) are homeowners, lower than the rate for black immigrants (42%) or all black householders (44%). This difference is due in part to the youth of the second generation; more than half are ages 18 to 29, and homeownership peaks at older ages. Compared with immigrant (11%) and all black adults (15%) ages 18 to 29, second-generation black adults (17%) have a somewhat higher homeownership rate.
The share in poverty for black second-generation adults is lower than that of first-generation adults or of all adults.
The second generation is as likely as all black adults not to have health insurance (23% do not), though somewhat more likely than immigrant black adults (28% of whom do not have health insurance.)
Second-generation black adults are somewhat less likely to be in the labor force than immigrant adults—66% to 72%. Their unemployment rate—15.7% in March 2012—was higher than that of immigrants (11.6%).
In terms of occupation, patterns for the second generation resemble more closely that of immigrants than of black adults overall. About four-in-ten (41%) work in management, professional or related jobs, 24% work in sales and office support and 21% hold service employment.
Family and Living Arrangements
Only 20% of second-generation black adults are married and 69% have never married, as might be expected of such a young population. In the first generation 48% are married and 33% have never married. Among all black adults, 34% are married and 43% have never married.
Among black second-generation adults, 34% live in multi-generational households, higher than the shares for immigrants (26%) and the overall population (26%). Among 25- to 34-year-olds, an estimated 42% of black children of immigrants live in multi-generation family households, compared with 26% of immigrants and 28% of the total population in this age group.
Among black women ages 15-44, 6% of second-generation women gave birth during the previous year, compared with 9% of immigrant women and 7% of all women. Insufficient data are available to calculate the share of births to unmarried mothers for second-generation black women.23
Chapter 3: Identity
The U.S.-born children of Hispanic and Asian-American immigrants are strikingly similar in how they identify with their native America. About six-in-ten of both groups say they consider themselves to be a “typical American.” That is roughly double the share of their immigrant forebears who say the same.24
But for these adult children of immigrants, seeing oneself as a typical American has not meant losing their overriding sense of identity with their family roots. A majority of the second generations of both groups say they most often identify themselves either by their ancestral country of origin (e.g., Mexican; Chinese American) or by a pan-ethnic or pan-racial term (e.g., Hispanic, Asian American).
A minority of second-generation Hispanics (37%) and Asian Americans (27%) say they most often describe themselves simply as “an American.” Notably, however, these shares are substantially higher than the shares among the immigrant generations of these groups who say the same (8% for Hispanics, 9% for Asian Americans).
These findings come from an analysis of recent Pew Research Center surveys conducted with a nationally representative sample of Hispanics and a separate representative survey of Asian Americans.
Those surveys, along with our analysis of U.S. Census Bureau data, also find that Latinos and Asian Americans differ markedly both in their language skills and in their views on the importance of maintaining the language of their ancestral home. While fully three-fourths (78%) of Asian immigrants in the U.S. speak English either very well or pretty well, about half of Hispanic immigrants (48%) are English proficient. This may reflect the fact that a large share of Asian American immigrants are highly educated and often come to the United States to obtain even more education, while a large share of Hispanics who come to the U.S. have less education and come primarily to work.
Among the second generation, half of Latinos have the ability to speak Spanish, while less than half of Asian Americans are proficient in the language of their ancestral home. And as with Hispanics and Asian Americans overall, second-generation Hispanics are far more wedded to future generations retaining their ancestral language than are second-generation Asian Americans.
Self-Identification
When asked how they most often describe themselves, about six-in-ten (61%) foreign-born Latinos use a term linked to their country of origin (e.g., “Mexican”). Only half that many (29%) report that they call themselves a pan-ethnic term such as “Hispanic” or “Latino.” And just 8% of Latino immigrants say that they most often call themselves “American.”
Patterns among the second generation show marked differences. A notable minority (38%) still identifies primarily with their family’s country of origin, and 20% most often call themselves either “Hispanic” or “Latino.” However, second-generation Latinos are far more likely than their foreign-born counterparts to most often call themselves “American”—37% do.
This pattern of self-identification across generations is quite similar to that of Asian Americans. Among the foreign born, some 69% report that they most often classify themselves by their country of origin (e.g., “Chinese American”). Asian immigrants are slightly less likely than their Hispanic counterparts to identify by a pan-ethnic or pan-racial term, but still almost two-in-ten (18%) identify as “Asian” or “Asian American.” Finally, some 9% of Asian immigrants state that they most often identify themselves as “American.”
As with Latinos, the share of second-generation Asian Americans who identify primarily by their country of origin is smaller than it is among the first generation. Some 45% of second-generation Asian Americans say as much. The share of second-generation Asian Americans who identify primarily as “Asian” or “Asian American” is 23%, not much different than the share in the first generation who say the same. Second-generation Asian Americans, though, are much more likely to describe themselves as “American,” with about one-fourth (27%) saying they do so.
Do You Think of Yourself as a Typical American?
Though the bulk of Latinos continue to identify themselves based upon their country or region of origin, many also think of themselves as a typical American. Fully one-third (33%) of immigrants say as much, as do more than six-in-ten (61%) second-generation Latinos. Conversely, 59% of immigrant Latinos and about one-third (36%) of second-generation Latinos report that they think of themselves as very different from a typical American.
The patterns of response on this question among Asian Americans are almost identical. Some 30% of Asian immigrants think of themselves as a typical American, as do 61% of second-generation Asian Americans, while 60% of Asian immigrants and 34% of second-generation Asian Americans think of themselves as very different from a typical American.
English-speaking ability is limited among Hispanic immigrants in the U.S. Less than half (48%) of foreign-born Latinos can converse in English either very well or well: About one-fourth (28%) report speaking English very well, and 20% report speaking the language well. One-fifth (20%) of Latino immigrants speak no English at all, and about one-third (32%) don’t speak the language well.
However, the vast majority (93%) of second-generation Latinos report that they can speak English either very well (85%) or well (8%).
Patterns of English proficiency are quite different among Asian American immigrants compared with their Hispanic counterparts. Fully three-fourths (78%) speak English either very well (54%) or well (23%). About 6% don’t speak English at all, and the remaining 17% don’t speak the language well.
As with second-generation Latinos, the vast majority of second-generation Asian Americans speak English either very well or well. About nine-in-ten of this group report that they speak English either very well (82%) or well (10%).
Retaining the Language of the Ancestral Home
The ability to speak Spanish persists for a large share of second-generation Hispanics, with eight-in-ten reporting that they can converse either very or pretty well in that language: Fully half (50%) report that they can speak Spanish very well, and 30% report that they can speak it pretty well. An additional 16% of second-generation Latinos report that they can speak just a little Spanish, and 4% report no ability to speak Spanish.
Among second-generation Asian Americans, the story is quite different. Just 4-in-10 (41%) report that they can speak the language used in their familial country of origin either very well (18%) or pretty well (23%). The plurality of second-generation Asian Americans (33%) report that they speak just a little of the language from their family’s country of origin, and fully one-fourth (26%) report that they don’t speak that language at all.
The Importance of Retaining the Language of the Ancestral Home
Very different attitudes may explain, in part, the stark differences in the likelihood that Latinos and Asian Americans maintain the ancestral language beyond the first generation. Respondents were asked how important it is that future generations living in the U.S. be able to speak the language of the familial homeland. On average, Hispanics were far more likely than Asian Americans to believe this was important. And among both Hispanics and Asians, immigrants were more likely than their second-generation counterparts to say that maintaining the ancestral language is very important.
Almost all (96%) foreign-born Hispanics feel that it is very or somewhat important for future generations to retain the ability to speak Spanish. Most (82%) consider it very important. Even among the second generation, some 94% of Latinos think it important for future generations to continue to speak Spanish, though they are a bit less adamant than the first generation. Some 68% of second-generation Latinos consider it very important for future generations to be able to speak Spanish. Third-generation Latinos are equally as likely as their second-generation counterparts to state that retaining the ability to use Spanish is very or somewhat important.26
In comparison, Asian Americans are less attached to the idea of maintaining the language of their familial homeland. While the majority (82%) of Asian immigrants say that it is very or somewhat important to do so, about half (49%) say that it is very important for future generations to retain the language of their homeland.
Second-generation Asian Americans are less likely than their immigrant counterparts to value the ability to speak the language of the familial homeland, with 37% reporting it is very important and 39% saying it is somewhat important.
Chapter 4: Standard of Living
America’s immigrants and the adult children of immigrants are different in many ways but nearly identical in one: Overwhelming majorities of both groups see themselves as better off than their parents were at the same stage of life, according to an analysis of recent Pew Research Center surveys conducted with a nationally representative sample of Hispanics and a separate representative survey of Asian Americans.
This chapter also looks at how first- and second-generation Hispanics and Asian Americans assess their personal finances and their satisfaction with the direction of the country as a whole.
Second-generation Hispanics are more upbeat about their personal financial situation than are Hispanic immigrants, consistent with their better financial outcomes shown in Chapter 2. Among Asian Americans, however, there are much less pronounced differences in median household income for immigrants compared with the second generation, and the two generations give a similar assessment of their financial situation.
Clear generational differences emerge when it comes to evaluations of the U.S., however. Second-generation Hispanics and Asian Americans are, on average, more dissatisfied about the direction of the country than the immigrant generation in their respective race or ethnic group. Latino and Asian immigrants are more positive about the direction of the country than is the general public overall. Second-generation Asian Americans tend to resemble the general public in views about the direction of the country.
Standard of Living Comparisons
There is a strong tendency to see one’s own standard of living as better than that of one’s parents at the same age; this pattern holds regardless of generation.
About seven-in-ten (71%) first-generation Hispanics say they are better off than their parents were at the same age; a roughly equal percentage (67%) of second-generation Hispanics say the same.
Both first- and second-generation Asian Americans give similar assessments of their standard of living compared with their parents at the same age. Three-quarters of first-generation (74%) and second-generation (75%) Asian Americans say they are better off than their parents were at the same age.
Compared with the general public, a greater share of second-generation Asian Americans see themselves as having a better standard of living than their parents at the same age; the same tendency is found among second-generation Hispanics, but it does not reach statistical significance.
Expectations for one’s own children down the road, however, tend to be more tempered among second-generation Asian Americans.
Most Hispanics expect their children’s standard of living to exceed their own at the same stage of life; 72% of Hispanic immigrants expect their children to be better off than they are now. Expectations among second-generation Hispanics are similar, with two-thirds (66%) predicting their children’s standard of living will be better than their own at the same age in life. Both first- and second-generation Hispanics are more optimistic than the general public overall about their children’s standard of living.
Among Asian Americans, however, there are generational differences in outlook. A majority of Asian-American immigrants expect their children’s standard of living to be better than their own (57%). Second-generation Asian Americans are less sanguine, with 41% predicting their children will be better off, 28% saying their standard of living will be the same and a quarter (24%) saying their children will be worse off than they are now.
These differences in expectations across generations hold even when controlling for age, with younger immigrants (ages 18 to 34) more optimistic about their children’s standard of living than second-generation Asian Americans in the same age group (62% versus 44% expect their children’s standard of living will be better than their own).
Personal Finances
Perceptions of personal finances tend to vary by immigrant generation among Hispanics but not among Asian Americans. The generational pattern among Asian Americans is in the same direction but does not reach statistical significance.
Hispanics as a whole are worse off, on average, than all U.S. adults in terms of household income.27 And relative to the general public, Hispanics are less positive in how they perceive their personal financial situation. About a quarter of Hispanic immigrants (27%) consider their personal finances to be excellent or good. Ratings of personal finances are better among second-generation Hispanics; 41% of this group says their finances are excellent or good. Ratings of personal finances are about the same among second-generation Hispanics as they are for the general public as a whole.
The portrait for Asian Americans as a whole is quite different. Asian Americans are better off, on average, than all U.S. adults in terms of household income (adjusted and standardized to a three-person household). And more Asian Americans rate their personal finances in positive terms than does the general public. First- and second-generation Asian Americans rate their personal financial situation similarly to each other, however. About half or more of both first-generation (50%) and second-generation (56%) Asian Americans consider their financial situation to be excellent or good; the difference between generational groups does not reach statistical significance. About one-in-ten of each group say it is poor, and the remainder says it is “only fair” or do not give a rating.
Country Satisfaction
When it comes to perspectives on the U.S. as a whole, about half of Hispanics (51%) and 43% of Asian Americans are satisfied with the direction of the country. Second-generation Hispanics and Asian Americans tend to be more discontented than are immigrants in their respective race or ethnic group.
Among Hispanics, a majority of immigrants are satisfied with the direction of the country (57%) and 36% are dissatisfied. The second generation is closely divided, with 49% saying they are satisfied with the way things are going in the country today and 47% saying they are dissatisfied.
A similar generational difference is found among Asian Americans. Among Asian immigrants, 46% are satisfied and 44% dissatisfied with the direction of the country. Second-generation Asian Americans are more negative; six-in-ten (59%) are dissatisfied with the direction of the country and a third (33%) are satisfied. This difference in outlook between generations holds even when controlling for age; among 18- to 34-year-olds, immigrants are more satisfied (50%, versus 42% dissatisfied) with the direction of the country than is the second generation (35% satisfied versus 56% dissatisfied).
Compared with the general public, first-generation Hispanics and Asian Americans are more positive about the direction of the country. Second-generation Asian Americans resemble the general public in views about the direction of the country, while second-generation Hispanics tend to be more positive than the general public.
Chapter 5: Intergroup Relations
Second-generation Latinos and Asian Americans are significantly more likely than the first generation to say their group gets along well with people from other racial and ethnic groups, according to an analysis of recent Pew Research Center surveys conducted with a nationally representative sample of Hispanics and a separate nationally representative survey of Asian Americans.
The second generation is also more likely than the first generation to have a circle of friends that extends well beyond people from their country of origin.
The two surveys also find that second-generation Latinos and Asian Americans are more likely than the immigrant generation to say they would be “very comfortable” if their child married someone of a different country of origin or a different race or ethnicity.
Data collected by the U.S. Census Bureau on marriage trends offer partial confirmation that these expressions of acceptance reflect a larger reality. Second-generation Hispanics are roughly four times as likely as the first generation to be married to someone who is not Latino, while second-generation Asian Americans are about twice as likely as the first generation to marry a non-Asian, according to the 2010-2012 Current Population Survey.
Group Relations
The survey asked respondents to rate how well their racial or ethnic group, as a whole, gets along with other racial and ethnic groups in the U.S.: whites, blacks, and either Hispanics or Asian Americans.
Overall, Asian Americans see group relations with these others in more positive terms than do Hispanics. The second generation, more so than the first generation, of both groups tends to see intergroup relations in a positive light. More second- than first-generation Latinos and Asian Americans say their group gets along with people from all three other racial and ethnic groups either “very well” or “pretty well.” Among Latinos, 52% of the second generation and 26% of the first generation see their group as getting along very well or pretty well with whites, blacks and Asian Americans. Among Asian Americans, the same pattern occurs; 64% of second-generation Asians and 49% of Asian immigrants say their group gets along with people from all three other racial and ethnic groups (whites, blacks and Hispanics) either very well or pretty well.
Group Relations with Blacks: Generational differences occur when Hispanics and Asian Americans are asked in the two surveys how well their group gets along with blacks.
About half (52%) of first-generation Latinos say Hispanics get along “not too well” or “not well at all” with African Americans. Yet among second-generation Hispanics, the proportion who report tensions between Latinos and blacks is only about half as large (27%). In place of perceived conflict, good relations prevail: Seven-in-ten (69%) second-generation adults report that Latinos get along very well or pretty well with African Americans.
Similar though less pronounced differences in attitudes exist between first and second generations of Asian Americans. About six-in-ten Asian immigrants say that Asian Americans from their home country get along very well or pretty well with African Americans.28 Among the second generation, that proportion is 11 percentage points higher (71%).
Latino-Asian Relations: Equally large generational differences occur in perceptions of how well Latinos and Asian Americans say they get along with each other.
About half (49%) of first-generation Hispanics report good relations with Asians, while 34% say the two groups do not get along. (An additional 17% did not rate group relations with Asians.) But among second-generation Latinos, about three-in-four (76%) say the groups get along very well or pretty well, and 20% report that they do not.
Similar though less pronounced differences surface among first- and second-generation Asian Americans. Among the second generation, about eight-in-ten (78%) report good relations between Latinos and Asian Americans from their country of origin, nine percentage points more than the share among the immigrant generation (69%).29
Group Relations with Whites: Hispanics and Asian Americans tend to see group relations with whites in more positive terms than with either blacks or with each other. But here, too, generational differences emerge.
Two-thirds of Latino immigrants say their group gets along with whites either very or pretty well. That figure is higher among second-generation Latinos, of whom 81% say their group gets along well with whites.
Less dramatic generational differences occur among Asian Americans. Fully 86% of Asian immigrants say their group gets along with whites very well (25%) or pretty well (61%). More second-generation Asian Americans say their group gets along with whites (91%); 31% say the two groups get along very well and 61% pretty well.30
Friendships
Hispanics and Asian Americans who were born outside the United States are significantly more likely than the second generation to say most or all of their friends are also from their home country.
Among Hispanics, about two-thirds of the foreign born (64%) say all or most of their friends in the United States also trace their roots to the same country of origin, compared with 49% of second-generation Latinos.
The “friendship gap” is even larger among Asian Americans. Among the first generation, about half (49%) say their friends are mostly from their country of origin. In contrast, only 17% of the second generation has as narrow a circle of friends.
Generations and Attitudes toward Intermarriage
Large generational differences also emerge on questions measuring attitudes toward intermarriage.
About half (49%) of first-generation Hispanics but 71% of the second generation say they would be “very comfortable” if their child married someone who was not Hispanic.
Among Asian Americans, about four-in-ten (41%) of the first generation but 73% of the second say they would be “very comfortable” if their child married someone who is not Asian.
A similar pattern emerges when respondents are asked in a separate question how comfortable they would be if their child married someone who was not from their country of origin.
About six-in-ten (58%) first-generation Hispanics but 76% of the second generation say they would be very comfortable if their child married someone from a home country different from their own. Similarly, close to half (46%) of foreign-born Asian Americans and 78% of the second generation would be very comfortable to welcome a son- or daughter-in-law who was not from their country of origin.
Intermarriage Rates
Data from the 2010 through 2012 Current Population Surveys show that these contrasting views on intermarriage echo generational differences in marriage patterns.
Overall about 8 percent of all married adults in the U.S. have a spouse of a different race or ethnicity; intermarriage is more common among second-generation immigrants (15%) than those in the first generation (8%).31 This generational pattern holds among most race and ethnic groups, except among whites.
About a quarter of married second-generation Hispanics (26%) have intermarried, compared with 7% for members of the first generation. The proportion where the spouse is non-Hispanic increases to 31% among Latinos in the third generation and higher.
Among those who are married, about a quarter (23%) of second-generation Asian Americans have a non-Asian spouse, compared with 10% of the immigrant generation. The percentage with a non-Asian spouse rises to 31% among Asian Americans in the third generation and higher.
In contrast, intermarriage for non-Hispanic whites is about the same across generations. Among this group, only 6% of the first generation have a spouse of a different race or ethnicity, identical to the percentage for second-generation whites and about equal to the 5% for later generations.
Among those who are married, 9% of blacks are married to someone who is not black. About 7% of all married black immigrants have a spouse who is not black. That proportion rises to 27% of the second generation. Unlike Hispanics and Asian Americans, similar percentages of blacks in the first generation and the third generation or higher intermarry (7% and 9%, respectively). The different pattern of intermarriage across generations of blacks could be related to a number of factors. Although the U.S. has a sizable black population as a legacy of slavery, voluntary black immigration is a relatively recent trend. There was almost no significant black immigration from about 1850 through 1970; the percentage of immigrants in the black population was never higher than 1.5% during that period. As such, second-generation blacks descending from the immigrant generation also have a more recent history in the U.S. Differences between the native stock (third generation or higher) and the immigrant stock (first and second generations combined) in the black population are not likely driven by trends in immigration over the past 150 years.
Recent Marriages: While this analysis is based on U.S. adults who are married—whether those vows were taken in the past few years or past few decades—the same generational differences are found for married adults ages 18 to 29 as among all adults. The patterns among younger adults reflect relatively recent marriage trends, while the patterns in the entire adult population are a function of longer-term trends in marriage patterns. Thus, while intermarriage has become more common in the population as a whole in recent years, the generational difference in intermarriage is also present among younger, more recently married adults.32
Immigrants and Marriage before Arrival: Some of the generational differences in marrying outside of one’s racial or ethnic group may be explained by the fact that many immigrants are already married when they arrive in the United States. A previous Pew Research Center analysis of new marriages finds the intermarriage rate is higher among U.S.-born (i.e., second generation and higher) Hispanics and Asian Americans than among the first generation of each group, a pattern that has held since 1980 even for immigrants who married after coming to the U.S.33
Group Size and Intermarriage: It is important to keep in mind that the percentage married to someone of another race or ethnic group is influenced by the size of each group in the population. A smaller race or ethnic group has, by definition, a smaller pool of potential spouses from the same race or ethnic group and a larger pool of potential spouses from a different group. In the U.S., for example, it is mathematically impossible for intermarriage rates of the majority race or ethnic group, non-Hispanic whites, to surpass those of smaller race and ethnic groups even if intermarriage rates for those smaller groups were 100%.
Patterns of Intermarriage by Gender and Education
Intermarriage also tends to vary by gender and education. However, the overall generational pattern found among Hispanics, Asian Americans, and blacks—with more in the second generation than in the first marrying outside their group—tends to hold for both men and women and across education levels.
Gender: Overall, there are no gender differences in the prevalence of intermarriage for married men and women by generation.
There is a modest gender difference in intermarriage among first-generation Hispanics (6% for men and 8% for women). Married Hispanic men and women in the second generation are about equally likely to have a spouse who is not Latino.
While Asian-American women are more likely than men to intermarry, generational differences in intermarriage hold among both men and women.
Among whites, men and women within the first and second generation are about equally likely to intermarry.
Overall, black men are more likely than black women to intermarry (12% versus 5%). This gender difference is especially pronounced among second-generation blacks; immigrant black men and women are about equally likely to be intermarried.
Education: Overall, there is a modest relationship between educational attainment and intermarriage among all those currently married.34 The strength of the association between education and intermarriage varies somewhat across racial and ethnic groups; it is strongest among Hispanics.
Generational differences in intermarriage tend to hold across education differences, with the second generation more likely than the first generation to intermarry, regardless of education level.
Among married Hispanics, those who attended college are significantly more likely than those who did not to have a non-Hispanic spouse. This association is especially strong among second-generation Hispanics but also occurs among the first generation.
A somewhat different pattern emerges among married Asian Americans. Among the second generation, about three-in-ten college graduates (29%) have a spouse who is a non-Asian, while 13% of those with a high school diploma or less schooling have a non-Asian spouse. But among members of the first generation, the intermarriage rate is virtually identical for those with college degrees (10%) and those with a high school diploma or less schooling (9%).
There is no relationship between education and intermarriage among first-generation whites, although there is a modest relationship among second-generation whites. And there are too few second-generation blacks for a full analysis of intermarriage by generation and education; among first-generation blacks, higher education is associated with more intermarriage.
Chapter 6: Political and Social Issues
Relative to the general public, Asian Americans and, particularly, Hispanics tend to skew more Democratic than Republican in party identification and more liberal than conservative in ideology, according to an analysis of recent Pew Research Center surveys conducted with a nationally representative sample of Hispanics and a separate representative survey of Asian Americans. Second-generation and immigrant Asian Americans hold roughly the same partisan affiliations, though second-generation Hispanics are even more strongly Democratic-leaning than are immigrant Hispanics, however.
Other political orientations paint a complex portrait of the generations. Among Asian Americans, there are no differences in political ideology by generation, but the second generation is more inclined than the first generation to prefer a smaller government with fewer services over a larger, more activist government. Some of that difference may be explained by the younger average age of second-generation Asian Americans relative to Asian immigrants.
Among Hispanics, there is somewhat less support for an activist government among the second generation than Hispanic immigrants, although a clear majority of both generations prefers a larger government with more services to a smaller one providing fewer services. But more of the second-generation Hispanics identify themselves as liberal on political issues than do first-generation Hispanics.
Generational differences are pronounced on attitudes about social issues. Second-generation Hispanics and Asian Americans are more liberal than the first generation on attitudes about homosexuality and abortion. Compared with the general public, second-generation Asian Americans are more liberal on both issues. Second-generation Hispanics tend to be more accepting of homosexuality than the general public; their views on abortion are similar to those of the general public.
Party identification
Both Hispanics and Asian Americans as a whole identify more with the Democratic than the Republican Party. Second-generation Hispanics follow this pattern even more strongly than do Hispanic immigrants.
About six-in-ten (63%) first-generation Hispanics are Democrats or independents who lean toward the Democrats. Second-generation Hispanics even more strongly identify with or lean toward the Democratic Party (71%) than the Republican Party (19%).
Among Asian Americans, there is no difference between first and second generation in party identification. About half identify with or lean toward the Democratic Party (49% among first-generation Asian Americans and 52% among the second generation), while fewer identify with or lean toward the Republican Party (27% among the first generation and 32% among the second). Compared with Hispanics, more Asian Americans do not lean toward either party.
Political Ideology
Relative to the general public, both Hispanics and Asian Americans also tilt more toward liberal than conservative views on political issues. Generational differences on political ideology are modest, with second-generation Hispanics somewhat more liberal than immigrant Hispanics and no differences by generation among Asian Americans.
Second-generation Hispanics are more likely than immigrant Hispanics to describe their political views as either “very liberal” or “liberal”—36% versus 27%. The share describing their views as either “very conservative” or “conservative,” however, is not a statistically significant difference—28% for second-generation Hispanics and 34% for the first generation.
Among all U.S. Asians, 31% describe their political views as liberal, while 24% say they are conservative and 37% say they are moderate. There are no significant differences between first- and second-generation Asian Americans on political ideology.
Role of Government
There are modest generational differences on views about the role of government, with second-generation Hispanics and Asian Americans less inclined than the immigrant generation toward an activist government.
About eight-in-ten (83%) first-generation Hispanics say they would rather have a bigger government with more services than a smaller government with fewer services. While still a clear majority, the share opting for an activist government is lower (71%) among second-generation Hispanics. Compared with the general public, both first- and second-generation Hispanics prefer a more activist government.
Among Asian Americans, more of the first generation (57%) than the second generation (47%) prefer a bigger government that provides more services. Second-generation Asian Americans hold views more similar to those of the general public on this issue. However, some of the generational differences among Asian Americans may be related to age. Younger Asian Americans are somewhat less inclined to an activist role of government than are older adults (age 55 and older). When comparing immigrants ages 18 to 34 with their age peers in the second generation, the differences between generations on this item are not statistically significant.
Attitudes on Social Issues
Differences by generation are evident when it comes to attitudes on social issues such as homosexuality and abortion. Second-generation Hispanics and Asian Americans are more accepting of homosexuality and legal abortion relative to the foreign born in each group.
Among Hispanics, about half (53%) of the first generation say that homosexuality should be accepted by society. Among second-generation Hispanics, fully two-thirds (68%) say the same. Second-generation Hispanics are also more accepting of homosexuality than is the general public as a whole.
Generational differences among Asian Americans are even more pronounced. First-generation Asian Americans are divided in their views, with 46% saying homosexuality should be accepted by society and 41% saying it should be discouraged. Second-generation Asian Americans skew strongly toward acceptance, however, with 78% saying homosexuality should be accepted by society. As with Hispanics, second-generation Asian Americans are more accepting of homosexuality than is the general public.
Views on homosexuality also tend to be related to age. While younger Asian-American immigrants tend to be more accepting of homosexuality than older immigrants, the greater acceptance of homosexuality among second-generation Asian Americans versus those in the first generation remains even when controlling for age. (Fully 81% of second-generation Asian Americans ages 18 to 34 say homosexuality should be accepted by society, compared with 58% of the first generation.)
Similar generational differences are evident when it comes to views about abortion, with the second generation of each group holding more liberal positions on this issue.
Foreign-born Hispanics are more conservative than second-generation Hispanics about abortion. About six-in-ten (58%) first-generation Hispanics say abortion should mainly be illegal; a third (33%) say it should mainly be legal. The balance of opinion about abortion among second-generation Hispanics is in the opposite direction, with 55% saying abortion should mainly be legal and four-in-ten (40%) saying it should mainly be illegal. Views about abortion among second-generation Hispanics closely mirror those of the general public.
About two-thirds (66%) of second-generation Asian Americans say abortion should be legal in all or most cases, a sentiment shared by about half (51%) of first-generation Asian Americans. This pattern of greater acceptance of legal abortion among second-generation Asian Americans compared with the first generation holds even when controlling for age. Two-thirds (66%) of second-generation Asian Americans ages 18 to 34 say abortion should mainly be legal, compared with 54% among immigrants in that age group. Support for legal abortion is higher among second-generation Asian Americans than it is among the general public.
Chapter 7: Country Comparisons, Personal Values and Goals, Perceptions of Group Success
This chapter summarizes findings on a wide range of survey topics on which generational differences are mixed, nonexistent or varied between Asian Americans and Hispanics. Among the topics covered are evaluations of the United States versus one’s ancestral country of origin; personal values and goals; perceptions of discrimination and group success; and attitudes about work and social trust.
How the U.S. Compares with Country of Origin
Majorities of Latinos and Asian Americans say the United States is better than their country of origin in terms of opportunities to get ahead, treatment of the poor and conditions for raising children. Fewer than half rate the United States as being better than the country where they or their ancestors came from in terms of the strength of family ties and its moral values. Across these five ratings, few generational differences emerge, however.
Generational differences are seen when it comes to rating conditions for raising children. Second-generation Hispanics and Asian Americans are significantly more likely than the immigrant generation to say the United States is a better place than their country of origin to raise children (81% versus 69% for Latinos, 70% versus 61% for Asian Americans).
A mixed pattern emerges when the focus turns to opportunities to get ahead. Virtually identical proportions of first- and second-generation Latinos say chances for advancement are better in the U.S. (88% and 87%, respectively). But among Asian Americans, a larger share of the second generation (80%) than the first (71%) sees more opportunities in this country.
No significant generational differences emerge among Latinos on the three other conditions tested in the survey or among Asian Americans on two of the three.
Roughly equal proportions of first- and second-generation Latinos say the U.S. is superior to their country of origin in terms of treatment of the poor (74% among first-generation Latinos and 69% among the second generation). Among Asian Americans, more in the first generation say the U.S. is superior to their country of origin in terms of treatment of the poor than do those in the second generation (68% versus 57%).
In terms of moral values in the U.S. compared with one’s country of origin, both Latinos and Asian Americans of each generation are about equally likely to say moral values are better in the U.S. than in their country of origin.
The two generations in both groups also resemble each other in their views about the strength of family ties in U.S. compared with their country of origin. About four-in-ten first- and second-generation Latinos say family ties are stronger in their country of origin (39% and 44%, respectively); majorities of first- and second-generation Asian Americans (57% and 60%, respectively) say the same thing.
Perceptions of Group Success
A mixed generational pattern emerges when Hispanics and Asian Americans are asked how well their group has done in the U.S. compared with other minorities.
More than four-in-ten of the first generation (44%) of Asian Americans say their group has achieved relatively more success in this country than other racial and ethnic minority groups. So does a similar share of those in the second generation (39%). Comparable proportions of each generation say Asian Americans have been less successful (5% for both first and second generations) or have had equal success (45% and 48%, respectively).
Among Latinos, 62% of the second generation and 53% of the first generation say Hispanics have been as successful as other racial and ethnic minority groups in the U.S. The remainder of each generation is divided in roughly equal camps, with 17% of the first generation and 15% of the second generation saying that Hispanics have fared better than other minority groups and 23% of the first generation and 20% of the second generation saying Hispanics have fared worse.
Benefits and Burdens of Race, Ethnicity
When respondents are asked whether their race or ethnicity helps or hurts them in finding a job, winning a promotion or getting admitted to schools and colleges, a varied generational pattern emerges.
About half or more of both first- and second-generation Asian Americans say that their heritage has no effect when it comes to getting a job or a promotion, or gaining admission to schools and colleges; those who see an effect are about evenly divided between saying their heritage is a help or a hindrance in getting a job or promotion. However, when it comes to school and college admissions, Asian immigrants are more likely to see their heritage as an advantage (20% say it helps; 10% say it hurts), while about equal portions of the second generation say their heritage helps (21%) as hurts (17%).
As a group, Latinos have mixed views over the effect that being of their ethnic group has on getting a job or a promotion, or applying for admission to schools and colleges. Second-generation Hispanics, more so than the first generation, say there is no effect of being Hispanic on either getting a promotion at work or on gaining admission into schools and colleges. Immigrants are more likely than the second-generation to say that being Hispanic helps in both situations. There are no significant generational differences in views about the effect of being Hispanic on getting a job.
Note that the questions asked of Latinos may not be directly comparable to those asked of Asian Americans on these issues, because Latinos were asked about the effect of being a member of their pan-ethnic group (e.g., Hispanic or Latino), while Asian Americans were asked about the effect being a member of their country of origin group (e.g., Chinese American, Korean American and so forth). See Appendix 3 for results among a subsample of respondents asked about the effect of being a Mexican American on getting a job or a promotion, or in gaining school and college admissions.
Promotions: First-generation Hispanics are considerably more likely than those in the second generation to say that their ethnicity helps rather than hurts their chances of getting a promotion (41% versus 24%).
At the same time, roughly equal shares of both generations say that being Latino hurts promotion chances (21% for the first generation versus 18% for the second). The remainder says it makes no difference.
Among Asian Americans, roughly similar proportions of the first and second generations say their race or country of origin helps them get promotions (15% for the first generation; 11% for the second) or hurts their chances (16% versus 12%). But the immigrant generation is significantly less likely than the second to say makes no difference (58% versus 70%).
Finding a Job: No generational differences emerge when Latinos are asked about the impact of their racial or ethnic background on the chances that they will find a job; generational differences among Asian Americans are modest.
Among Latinos, about four-in-ten of the first generation (40%) and 37% of the second generation see their ethnicity as helpful in getting work, while 22% and 25%, respectively, say it hurts. About a third of each generation say that their ethnicity neither helps nor hurts in a job hunt.
The majority of both first- and second-generation Asian Americans say their heritage makes no difference in finding a job; the second generation is somewhat more likely than the first generation to say this (68% versus 60%). More Asian Americans of both generations say their race or country of origin is a benefit than say it hurts.
Admission to Schools and Colleges: First-generation Latinos are more likely than those in the second generation to say that being Latino helps them get into a school (42% versus 32%).
But by about two-to-one, both generations are more likely to see their ethnicity as a benefit than a barrier (42% versus 19% for the first generation, 32% versus 14% for the second). Roughly one-third of first-generation (36%) and half of second-generation Latinos say their ethnicity does not affect school and college admissions.
When it comes to admissions to schools and colleges, roughly six-in-ten first-generation (62%) Asian Americans and 56% in the second generation say their heritage makes no difference. Among the first generation, about one-in-five (20%) say their heritage is helpful in gaining admission, while half that share (10%) say it hurts their chances. Second-generation Asian Americans are about equally likely to say their heritage helps (21%) as hurts (17%).
Personal Goals
Do different generations of Latinos and Asian Americans have different goals in life? To answer that question, the surveys asked Hispanics and Asian Americans how important each of five aspects of life are to them.35 The five items tested were “being a good parent,” “having a successful marriage,” “owning your own home,” “being successful in a high-paying job or career” and “living a very religious life.”
Latinos and Asian Americans both say being a good parent is their top priority (58% for Hispanics and 67% for Asian Americans), followed by having a successful marriage (39% and 54%, respectively). Smaller shares consider homeownership, career success and living a religious life as important goals.
Both Hispanics and Asian Americans generally place the values in roughly the same rank order. When compared to all adults, the pattern is the same, with one exception: The public places a higher value on “living a very religious life” than job success (20% versus 10%). In contrast, both Latinos and Asian Americans rank career success higher than religiosity.
Generational Patterns: Overall the survey finds few significant generational differences in life goals.
In fact, no significant generational differences emerged among Hispanics on any of the five life goals tested in the survey.
But among Asian Americans, the immigrant generation places a higher priority on four of the five items tested. On the fifth item—being a good parent—about two-thirds of both the first and second generations say it is one of the things they most value in their lives (66% for each). Among Hispanics, more than half (55%) of the immigrant generation and 60% of the second generation rate being a successful parent as highly.
Other findings include:
Having a successful marriage. As a group, Asian Americans are significantly more likely than Hispanics to rate this as one of the most important goals in their life (54% versus 39%). Among Asian Americans, a larger share of the first generation than the second rate a good marriage as one of their top priorities in life (57% versus 48%). The pattern by generation among Latinos is less clear-cut and may even be reversed: 35% of foreign-born Hispanics but 42% of the second generation say that having a successful marriage is one of the most important things in their lives, though this difference falls just short of being statistically significant.
Owning your own home. Hispanics and Asian Americans equally value homeownership; fully 33% of Latinos and 32% of Asian Americans rate owning their own home as a top life goal. Among Latinos there are no generational differences between the first generation (32%) and the second (33%). However, Asian immigrants are significantly more likely than those in the second generation to value homeownership (34% versus 25%).
Being successful in a high-paying job or career. About a third of Latinos (32%) but a somewhat smaller share of Asian Americans (27%) say being successful in a well-paying job is one of their most important goals. About equal shares of first- and second-generation Latinos (33% and 35%, respectively) consider this a top priority. Among Asian Americans, a significantly larger share of the foreign born than the second generation value career success or a high-paying job as highly (29% versus 22%).
Living a very religious life. This life goal ranked behind each of the other four as a top life priority for both Hispanics (23%) and Asian Americans (22%). About one-in-five first-generation Latinos (23%) and 19% of those in the second generation say living a very religious life is one of the most important goals in their life, a difference that is not statistically significant. A generation gap is seen in the views of Asian immigrants and the second generation: About a quarter (24%) of the immigrant generation but 15% of second-generation Asian Americans place a high premium on living a religious life.
Belief in Hard Work
Three-quarters of Latinos (75%) and a slightly smaller majority of Asian Americans (69%) agree that most people can succeed “if they’re willing to work hard,” a belief that is as strongly held by those in the second generation of each group as it is in the first. In contrast, about six-in-ten (58%) of all Americans hold this belief, and 40% say hard work is not a guarantee of success.
According to the survey, first- and second-generation Latinos are equally likely to agree that “most people who want to get ahead can make it if they’re willing to work hard” (78% both groups).
First- and second-generation Asian Americans were also about equally likely to agree with this statement (68% and 72%, respectively, did so).
Social Trust
Majorities of Hispanics and Asian Americans believe “you can’t be too careful in dealing with people,” a view broadly shared by the two generations.
Hispanics as a group profess less trust in others than do Asian Americans (86% versus 56%) or Americans generally (56%).
About nine-in-ten foreign-born Latinos agree that “you can’t be too careful in dealing with people,” a sentiment shared by 84% of the second generation.
Identical proportions of first- and second-generation Asian Americans believe you can’t be too careful in dealing with others (56%).
Main Reason for Coming to U.S.
Immigrants give a variety of reasons for coming to the United States. Overall 56% of first-generation Hispanics say that economic opportunities are the main reason they immigrated. That is more than double the share that came for family reasons (23%), the second-most frequently cited motivation of the five offered. Smaller shares of Latinos say they came primarily for educational opportunities (9%), to escape conflicts or persecution in their home country (5%) or for some other reason (6%).
Among first-generation Asian Americans, about three-in-ten (31%) say they came to the U.S. for family reasons. About as many (28%) cite educational opportunities as the major factor, and about one-in-five (21%) say they immigrated to seek economic opportunities. In addition, 9% of Asian immigrants say they relocated to the U.S. to avoid conflict or persecution in their home country, and 9% give some other reason for coming here.
Regardless of the reason, roughly equal size majorities of Latino (79%) and Asian-American immigrants (76%) say that if they had to decide again whether to come to the United States, they would come again.
Appendix 1: Detailed Demographic Tables
Appendix 2: Methodology
Demographic Analysis Data Sources
The demographic data in this report are derived from the Current Population Survey, which covers the civilian, noninstitutional population. Unless otherwise noted, all data come from the CPS Annual Social and Economic Supplements (ASEC) conducted in March of every year. Unless otherwise noted, the specific files used in this report are from March 2012, the latest year for which ASEC data are available. Conducted jointly by the U.S. Census Bureau and the Bureau of Labor Statistics, the CPS is a monthly survey of approximately 55,000 households and is the source of the nation’s official statistics on unemployment. The ASEC survey in March features a larger sample size as well as an expanded set of detailed questions, and it provides an update of the nation’s social and economic portrait each year. Data on income and poverty from the ASEC survey serves as the basis for the well-known Census Bureau report on income, poverty and health insurance in the United States (DeNavas-Walt, Proctor and Smith, 2011). The ASEC surveys also collect data on the income of a household in the preceding calendar year. Thus, the 2012 file used in this report contains data on income from 2011.
Data on voting and turnout come from the November 2010 Voting and Registration Supplement of the CPS. Data on fertility, as stated below, come from multiple years of a June supplement to the CPS.
The CPS microdata used in this report are the Integrated Public Use Microdata Series (IPUMS) provided by the University of Minnesota. The IPUMS assigns uniform codes, to the extent possible, to data collected in the CPS over the years. More information about the IPUMS, including variable definition and sampling error, is available at http://cps.ipums.org/cps/documentation.shtml.
Intermarriage Rates
Intermarriage rates in this report were estimated for all married adults living with their spouse, whose marital status in the survey data is “married, spouse present.” The unit of analysis in this section of the report is married adults. The IPUMS database includes linkages of spouse records and supplies “attached variables” that place the value for the spouse’s variable on each record. Thus, the first step of analysis was to attach the race, ethnicity and nativity of the spouse to the individual’s record. The second step was to generate variables for the race and ethnic origin of the individual and his or her spouse. Seven different groups were constructed for estimating intermarriage rates: Hispanic and six non-Hispanic racial groups—white alone, black alone, Asian alone, American Indian and Alaska Native alone, Native Hawaiian and Pacific Islander alone, and more than one race. This report includes two different intermarriage rates—race-ethnicity and nativity. For race-ethnicity, the intermarriage rate is the number of people married to a spouse of a different race-ethnic group divided by the number of married people. For nativity, the intermarriage rate is the number of natives with foreign-born spouses (and immigrants with native spouses) divided by the total married population.
Dependent Children
Dependent children refers to children of the household head who are younger than 18, or ages 18-24 and economically dependent. Economic dependency was established as follows:
18-21 and enrolled in high school full time
18-24 and enrolled in college full time with part-time job
18-24 and enrolled in high school or college part time with part-time job and income less than 50% of the individual poverty level
18-24 with part-time job and income less than 50% of the individual poverty level
18-24 with full-time job and no income
Income
Household income is the sum of incomes earned by all members of the household in the calendar year preceding the date of the survey. The CPS collects data on money income received (exclusive of certain money receipts, such as capital gains) before payments for such things as personal income taxes, Social Security, union dues and Medicare deductions. Non-cash transfers, such as food stamps, health benefits, subsidized housing and energy assistance, are not included. The Census Bureau also states that “… there is a tendency in household surveys for respondents to under report their income. From an analysis of independently derived income estimates, it has been determined that wages and salaries tend to be much better reported than such income types as public assistance, Social Security, and net income from interest, dividends, rents, etc.” More detail on the definition of income in the CPS is available in the documentation of the data (http://www.census.gov/apsd/techdoc/cps/cpsmar11.pdf). It should be noted that income data in the CPS public-use microdata files are top coded to prevent the identification of a few individuals who might report very high levels of income.
Adjusting Income for Household Size
Household income data reported in this study are adjusted for the number of people in a household. That is done because a four-person household with an income of, say, $50,000 faces a tighter budget constraint than a two-person household with the same income. In addition to comparisons across households at a given point in time, this adjustment is useful for measuring changes in the income of households over time. That is because average household size in the United States has decreased from 3.2 persons in 1970 to 2.5 persons in 2010, a drop of about 20%. Ignoring this demographic change would mean ignoring a commensurate loosening of the household budget constraint.
At its simplest, adjusting for household size could mean converting household income into per capita income. Thus, a two-person household with an income of $50,000 would have a per capita income of $25,000, double the per capita income of a four-person household with the same total income.
A more sophisticated framework for household size adjustment recognizes that there are economies of scale in consumer expenditures. For example, a two-bedroom apartment may not cost twice as much to rent as a one-bedroom apartment. Two household members could carpool to work for the same cost as a single household member, and so on. For that reason, most researchers make adjustments for household size using the method of “equivalence scales” (Garner, Ruiz-Castillo and Sastre, 2003, and Short, Garner, Johnson and Doyle, 1999).
A common equivalence-scale adjustment is defined as follows:
Adjusted household income = Household income / (Household size)N
By this method, household income is divided by household size exponentiated by “N,” where N is a number between 0 and 1.
Note that if N = 0, the denominator equals 1. In that case, no adjustment is made for household size. If N = 1, the denominator equals household size, and that is the same as converting household income into per capita income. The usual approach is to let N be some number between 0 and 1. Following other researchers, this study uses N = 0.5 (for example, see Johnson, Smeeding and Torrey, 2005). In practical terms, this means that household income is divided by the square root of household size—1.41 for a two-person household, 1.73 for a three-person household, 2.00 for a four-person household, and so on.36
Once household incomes have been converted to a “uniform” household size, they can be scaled to reflect any household size. The income data reported in this study are computed for three-person households, the closest whole number to the average size of a U.S. household since 1970. That is done as follows:
[(3)0.5]
As discussed in the main body of the report, adjusting for household size has an effect on trends in income since 1970. However, it is important to note that once the adjustment has been made, it is immaterial whether one scales incomes to one-, two-, three- or four-person households. Regardless of the choice of household size, the same results would emerge with respect to the trends in the well-being of lower-, middle- and upper-income groups.
Fertility
Fertility data are derived from the June supplement of the CPS, which includes fertility information from female respondents ages 15 to 44. Any woman who gave birth from the prior June through the month of May preceding the survey is included, and the mother’s characteristics are based upon the information provided at the time of the survey.
In order to increase sample size, the analyses are based upon an aggregation of 2004, 2006, 2008 and 2010 data (the June supplement is administered only in even-numbered years). Even with the data aggregation, cell sizes were too small to estimate the share of women who were unmarried when they gave birth for first- and second-generation black women, and for second-generation Asian-American women.
All variables are based upon the characteristics of the mother, not of the father or the baby. A mother is described as married if she is either married or separated at the time of the survey. Otherwise she is considered unmarried.
The nation’s official birth data from the National Center for Health Statistics (NCHS) include a record for each baby born, while the CPS data account for each mother giving birth. Given that approximately 3% of live births include multiples (twins, triplets, etc.), the CPS slightly undercounts the number of babies born. In NCHS data, marital status refers to the mother’s marital status at the time of the birth.
Multi-Generational Households
Estimates of multi-generational households are based on definitions similar to those in previous Pew Research Center reports about such households, including Kochhar and Cohn (2011).
Voting Eligibility and Behavior
Electoral data are derived from the November 2010 Voting and Registration Supplement of the CPS, which includes questions regarding voting registration and voting behavior in past elections. Voting eligibility is based on adulthood (age 18 or older) and citizenship.
Population Projections
Data presented in this report on projected populations through 2050 are consistent with projections published in Passel and Cohn (2008). These projections include subdivisions of the population by race-Hispanic origin and generation.
Historical Data on Generations
The information required to define the first, second and third generations—nativity, citizenship, and country of birth of parents—was not collected consistently in our primary sources of historical demographic data, the U.S. censuses. The questions on country of birth of parents were dropped from the census beginning in 1980, and citizenship information has been inconsistently collected in 20th-century censuses. Moreover, the information across censuses has not always been consistent with trends in immigration or other censuses. To fill this gap, Passel and Cohn (2008) presented historical reconstructions of race-generation data for 1960-2000 based on the population projection methodology used for 2005-2050. Edmonston and Passel (1994) used similar methods to trace the generational composition of race-Hispanic groups back to 1900. These two historical reconstructions are the basis for trends in generational composition presented in this report for 1900-2000.
Historical Data on Immigration Waves
During the first two waves of immigration described here, 1840-1889 and 1890-1919, virtually all immigrants who arrived in the United States did so legally and were processed and counted by immigration authorities. Historical data on legal immigrants arriving are presented annually in the Yearbook of Immigration Statistics, released by the Department of Homeland Security (DHS). Table 2 of the Yearbook shows immigrants arriving by country or region of birth for each decade from 1820 to the present and is the source for our information.
For the most recent wave of immigration from 1965 to the present, data on legal admissions are insufficient because a significant amount of immigration has been unauthorized and because the official data count immigrants when they are admitted legally, not when they arrive. Data from decennial censuses since 1980 and from the American Community Survey (ACS) include most of the unauthorized immigrants and, thus, provides a better count of the total number of immigrants. Because many immigrants come to the U.S. and subsequently leave (or die), the best census or survey estimating the number of arriving immigrants during a period is one close to that period; for example, using the 2011 ACS to estimate the number of immigrants who arrived during the 1970s would seriously understate the number of immigrants. Accordingly, the estimates presented in this report use a number of sources to estimate the magnitude of immigration. For 1965-1980, the counts of immigrants come from the foreign-born population enumerated in the 1980 Census who reported arriving in 1965 or later; for 1980-1990, estimates come from the 1990 Census; and for 1990-1999, the estimates come from the 2000 Census. Tabulations used in this report come from the 5% IPUMS samples of these three decennial censuses. After 2000, the ACS is the source for this information. For immigrants arriving in 2000-2004, estimates come from the 2005 and 2006 ACS. For 2005-2010, the estimates for each individual year come from the next year’s ACS—e.g., the estimate for 2007 comes from the 2008 ACS. Weights for the 2005-2009 ACS were modified to be consistent with results from the 2000 and 2010 Censuses (see Passel and Cohn 2012 for an explanation).
Survey Data Sources
Survey data in this report are based on Pew Research Center surveys. Survey data for Hispanics come from one of two sources: the 2012 or the 2011 National Survey of Latinos. Survey data for Asian Americans come from the 2012 Asian-American Survey. Survey data for the U.S. general public come from a variety of sources; these are listed in the topline results in Appendix 3.
Differences between groups or subgroups, such as first- and second-generation Hispanics or first- and second-generation Asian Americans, are described in this report only when the relationship is statistically significant and therefore unlikely to occur by chance. Statistical tests of significance take into account the complex sampling design used for the surveys and the effect of weighting.
Survey Data: Hispanics
Data from two nationally representative surveys of Hispanics are included in this report.
The 2012 National Survey of Latinos was conducted with a nationally representative sample of 1,765 Hispanic adults ages 18 and older living in the United States. The survey was conducted Sept. 7-Oct. 4, 2012, in all 50 states and the District of Columbia.
The 2011 National Survey of Latinos was conducted with a nationally representative sample of 1,220 Hispanic adults ages 18 and older living in the United States. The survey was conducted Nov. 9-Dec. 7, 2011, in all 50 states and the District of Columbia.
Both surveys were conducted in both English and Spanish on cellular as well landline telephones. Interviews were conducted for the Pew Hispanic Center by Social Science Research Solutions (SSRS). The 2012 survey also included an oversample of non-Catholic Hispanics; the results are weighted to account for this oversampling.
The Pew Research Center’s 2012 Asian-American Survey is based on telephone interviews conducted by landline and cell phone with a nationally representative sample of 3,511 Asian adults ages 18 and older living in the United States. The survey was conducted Jan. 3-March 27, 2012, in all 50 states, including Alaska and Hawaii, and the District of Columbia. The survey was conducted using a probability sample from multiple sources. The data are weighted to produce a final sample that is representative of Asian adults in the United States. Survey interviews were conducted under the direction of Abt SRBI, in English and Cantonese, Hindi, Japanese, Korean, Mandarin, Tagalog and Vietnamese.
Respondents who identified as “Asian or Asian American, such as Chinese, Filipino, Indian, Japanese, Korean, or Vietnamese” were eligible to complete the survey interview, including those who identified with more than one race and regardless of Hispanic ethnicity. The question on racial identity also offered the following categories: white, black or African American, American Indian or Alaska Native, and Native Hawaiian or other Pacific Islander.
U.S. Asian groups, subgroups, heritage groups and country-of-origin groups are used interchangeably in this report to reference respondents’ self-classification into “specific Asian groups.” This self-identification may or may not match respondents’ country of birth or their parents’ country of birth. Self-classification is based on responses to an open-ended question asking for a respondent’s “specific Asian group.” Asian groups named in this open-ended question were “Chinese, Filipino, Indian, Japanese, Korean, Vietnamese, or of some other Asian background.” Respondents self-identified with more than 22 specific Asian groups. Those who identified with more than one Asian group were classified based on the group with which “they identify most.” Many questions on the survey used question wording customized to match the respondent’s self-identification into country-of-origin groups. See the topline in Appendix 3 for details on question wording.
For more details on the methodology, see Appendix 1: Survey Methodology in the “The Rise of Asian Americans.”
Survey Data: General Public
Figures for the U.S. general public are based on nationally representative surveys of respondents of any race. See the topline in Appendix 3 for the survey source on a specific question. Details on the methodology of each survey are available at www.pewresearch.org.
Comparisons between the U.S. general public and Hispanics may understate or overstate the magnitude of differences between U.S. Hispanics and Americans who are not Hispanic, due to the fact that Hispanics are also part of the general public to which the comparison is made. The same is true of comparisons between Asian Americans and Americans who are not Asian and of any other subgroup of the U.S. general public. The maximum possible size of such an effect would be equal to the size of the subgroup in the U.S. population. The maximum possible size of such an effect would occur only if responses of the subgroup members and Americans who are not members of the subgroup were completely different on a specific survey question.
Edmonston, Barry and Jeffrey S. Passel. 1994. “The Future Immigrant Population of the United States,” Immigration and Ethnicity: The Integration of America’s Newest Arrivals, edited by Barry Edmonston and Jeffrey S. Passel, Washington, DC: The Urban Institute Press.
Garner, Thesia, Javier Ruiz-Castillo, and Mercedes Sastre. 2003. “The Influence of Demographics and Household-Specific Price Indices on Consumption-Based Inequality and Welfare: A Comparison of Spain and the United States.” Southern Economic Journal 70(1): 22-48.
Passel, Jeffrey S. and D’Vera Cohn. 2008. “U.S. Population Projections: 2005-2050.” Washington, DC: Pew Social & Demographic Trends project. February 11.
Short, Kathleen, Thesia Garner, David Johnson, and Patricia Doyle. 1999. “Experimental Poverty Measures: 1990 to 1997.” Current Population Reports, Consumer Income, P60-205. Washington, DC: U.S. Census Bureau, June.