
A Bipartisan Nation of Beneficiaries
As President Barack Obama negotiates with Republicans in Congress over federal entitlement spending, a new national survey by the Pew Research Center finds that a majority of Americans (55%) have received government benefits from at least one of the six best-known federal entitlement programs. The survey also finds that most Democrats (60%) and Republicans (52%) […]
As President Barack Obama negotiates with Republicans in Congress over federal entitlement spending, a new national survey by the Pew Research Center finds that a majority of Americans (55%) have received government benefits from at least one of the six best-known federal entitlement programs.
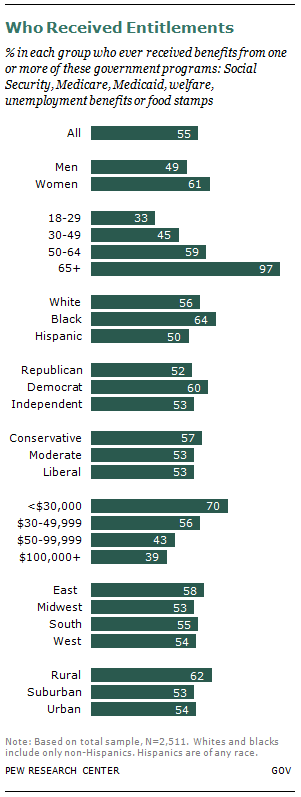
The survey also finds that most Democrats (60%) and Republicans (52%) say they have benefited from a major entitlement program at some point in their lives. So have nearly equal shares of self-identifying conservatives (57%), liberals (53%) and moderates (53%).
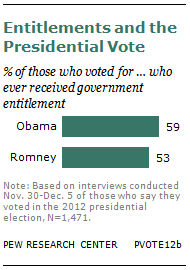
The issue of entitlements moved to center stage during the 2012 presidential campaign. The survey finds that among those who voted for President Obama last month, 59% say they’ve benefited from a major entitlement program. It also finds that 53% of those who supported Mitt Romney have benefited from a major entitlement program.
The survey, which was conducted by telephone from Nov. 28 to Dec. 5, 2012, among a nationally representative sample of 2,511 adults, asked respondents if they or a member of their household had ever received Social Security, Medicare, Medicaid, food stamps, welfare or unemployment benefits. Margin of sampling error for the overall results is plus or minus 2.2 percentage points.
Some 55% said they personally had received benefits from at least one of those programs, including a third (32%) who said they had received help from two or more. An additional 16% said they themselves had not received any benefits but said that a member of their household had—meaning that 71% of adults are part of a household that has benefited from at least one of these programs.1
The survey finds that the ranks of beneficiaries are as diverse as the nation as a whole but that there are some notable group differences. For example, women are more likely than men to have received an entitlement benefit (61% vs. 49%). Blacks (64%) are more likely than whites (56%) or Hispanics (50%) to have gotten federal help from these programs, and rural residents (62%) are more likely than urban (54%) or suburban (53%) dwellers to have gotten help.
The use of entitlement begins at an early age for many Americans, the survey finds. A third (33%) of all adults ages 18 to 29 say they have received at least one major entitlement payment or service in their lives.2
The share that has used entitlements continues to rise steadily with age, growing to 45% among those ages 30 to 49 and to 59% for those ages 50 to 64. It becomes virtually universal (97%) among those ages 65 and older—the age at which most adults qualify for Social Security and Medicare benefits.
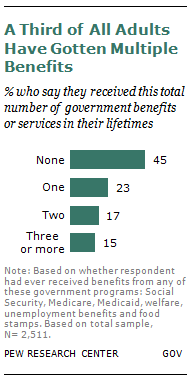
According to the survey, 32% of all adults have received two or more benefits, including 15% who have received three or more. Blacks are more likely than whites or Hispanics to have received three or more benefits (27% vs. 14% for whites and 11% for Hispanics).
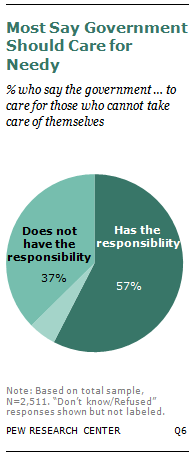
The survey also finds that nearly six-in-ten Americans (57%) say it is the government’s responsibility to care for those who cannot take care of themselves, a view that is only slightly more prevalent among those who have ever received an entitlement benefit (60%) than among those who have not (55%).
Taken together, the six programs tested in this survey generate the vast majority of federal spending on what is often called the social safety net. But each one has a different purpose and target population. (For more details on each of the programs, see the appendix, which begins on page 12.)
Unemployment benefits, food stamps, welfare and Medicaid target lower-income Americans or those facing a short-term economic hardship such as the loss of a job. In contrast, Social Security and Medicare primarily—though not exclusively—serve older adults of all income levels.
Overall, four-in-ten adults (42%) say they have been helped by a program targeted to assist those facing financial hardship. A smaller share (30%) say they have received a Social Security or Medicare benefit. About one-in-six Americans (17%) say they have received benefits from both types of programs at some point in their lives.
Blacks are more likely than whites to have benefited from one of the four economic hardship programs, but the survey suggests there are no statistically significant differences by race in participation over time in Social Security and Medicare.
Predictably, adults 65 and older are far more likely than other age group to have received Social Security and Medicare.
Adults with annual family incomes of less than $30,000 are about three times as likely as those earning $100,000 or more to have received help from Social Security or Medicare. These programs do not have income eligibility requirements: the fact that a larger share of recipients are at the lower end of the income scale reflects the fact that older adults tend to have lower incomes than the general public.
The survey also finds that these low-earning adults are nearly twice as likely as the highest earners to have received some sort of benefit from a poverty program, including unemployment insurance (59% vs. 31%).
The Reach of Entitlement Programs
More than half (55%) of Americans have personally received benefits from at least one of the six major entitlement programs tested in the survey.
The survey finds that 16% of those who have not personally received benefits also say a member of their household has gotten help. Taken together, these results indicate that about seven-in-ten households contain at least one member who has benefited at some point in his or her life from an entitlement program.
If veteran benefits and federal college loans and grants are added to the mix, the proportion of Americans who personally have ever received entitlement benefits rises to 70% and the share of households with at least one recipient grows to 86%.
Most Utilized Programs
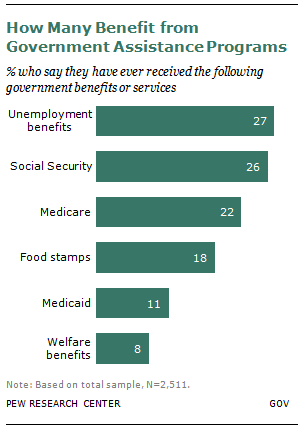
In terms of utilization, unemployment benefits and Social Security top the list of the six entitlement programs that are the focus of this analysis.
About one-in-four adults (27%) say they have received unemployment assistance at some point in their lives.3 About as many (26%) have received Social Security, while 22% have used Medicare. Smaller shares have ever received food stamps (18%), Medicaid (11%) or welfare benefits (8%).
The Demographics of Entitlements
The beneficiaries of entitlements span the social, political and economic spectrum. But some group differences do emerge. Women are more likely than men to have received an entitlement benefit (61% vs. 49%). Blacks (64%) are somewhat more likely than whites (56%) or Hispanics (50%) to have gotten federal help of this kind.
Rural residents also have disproportionately benefited from these entitlements (62%), compared with urban (54%) or suburban (53%) dwellers.
While the two parties are sharply divided over entitlement spending, the differences in the proportions of Republicans and Democrats who have received entitlements is fairly modest: 60% of Democrats, 52% of Republicans and 53% of independents have benefited from one of these six major classes of federal entitlement programs.
And when the lens shifts to political ideology, the survey finds virtually no difference in the share of conservatives (57%), liberals (53%) or political moderates (53%) who have been assisted by at least one entitlement program.
Taken together, the last two findings help explain another result. In the recent presidential election, about six-in-ten (59%) of those who say they voted for President Obama had received entitlement benefits—and so had 53% of those who supported Republican challenger Mitt Romney.
Program Goals and Demographics
Larger group differences emerge when the results are broken down by age and income levels—differences that are often directly related to the goals of specific benefits programs.
For example, adults 65 and older are nearly three times as likely to have received an entitlement benefit during their lives as those adults under the age of 30 (97% vs. 33%). That’s not surprising, since nearly nine-in-ten older adults (88%) have received Social Security and 78% have gotten Medicare benefits. Both programs were specifically created for seniors with age requirements that limit participation by younger adults.
Similarly, Americans with family incomes of less than $30,000 a year are significantly more likely as those with family incomes of $100,000 or more to have gotten entitlement help from the government (70% vs. 39%). Again, this difference is not surprising, as assisting the poor is the primary objective of such financial means-tested programs as food stamps, welfare assistance and Medicaid.
Type of Entitlement and Demographics
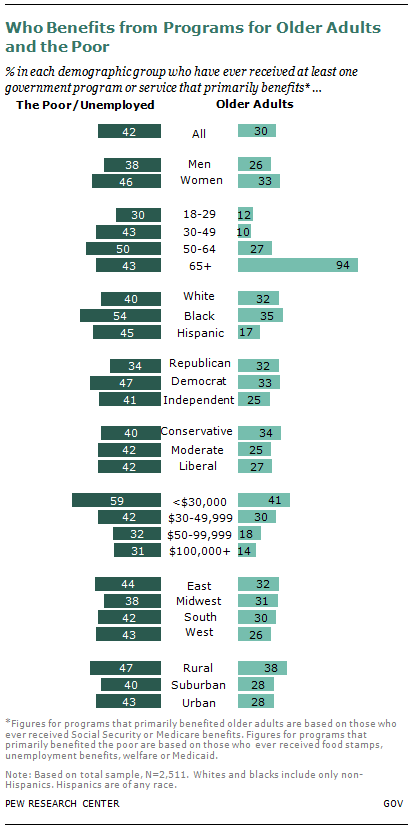
The survey finds that, overall, more Americans have received entitlements from programs primarily designed for the poor or unemployed (42%) than from those that mainly target older adults (30%), while 17% have received benefits from both program types. Not surprisingly, the biggest difference in the demographic profiles of the two groups is the age of recipients.
Adults 65 and older are nearly eight times as likely as adults younger than 30 to receive assistance targeting older Americans (94% vs. 12%).4 But among those who received poverty entitlements, the generation gap narrows to 13 percentage points (43% vs. 30%). While adults 65 and older are still more likely than young people to have benefited from these programs, those 30 to 49 are about as likely as those 65 and older to have received this type of entitlement. Fully half of all 50- to 64-year-olds, the largest share of any age group, have received a poverty entitlement.
On other demographic comparisons, the differences are less dramatic and the patterns less consistent. In fact, despite the very different goals of these two classes of entitlement programs, the demographic patterns in one class of entitlement programs often are roughly mirrored in the other. For example, women are more likely than men to say they have received help from programs that benefited the poor (46% vs. 38%) as well as from those that target older adults (33% vs. 26%).
Less affluent Americans adults also are significantly more likely than those in higher income brackets to have received entitlements, regardless of program class. About six-in-ten (59%) of those with family incomes of $30,000 or less say they have gotten this kind of help, compared with 31% of those earning $100,000 or more. If anything, the income gap is even larger among those who have received Social Security or Medicare (41% vs. 14%).
Other demographic groups show a mixed pattern by class of assistance. Rural residents are more likely than those living in the suburbs to have received entitlements, regardless of the type of assistance. However, there is no significant difference between rural and urban residents among those who have gotten poverty entitlements (47% vs. 43%), though there is a difference between those who received Social Security or Medicare (38% of rural vs. 28% of urban).
As for political characteristics, Democrats are more likely than Republicans or independents to have received poverty or unemployment assistance (47% vs. 34% and 41%, respectively).
But Republicans and Democrats are about equally likely to have gotten Social Security or Medicare benefits (32% vs. 33%). Independents are significantly less likely (25%) than partisans from either party to say they benefited from entitlement programs for the elderly. Despite conservatives’ opposition to many poverty programs, there is virtually no difference in the lifetime participation rate of conservatives (40%), liberals (42%) and moderates (42%) in these programs. Also, conservatives are more likely to have gotten Social Security and Medicare (34% vs. 27% for liberals and 25% for moderates), a difference driven by the fact that self-identifying conservatives are the oldest of the three groups.
Multiple Benefits
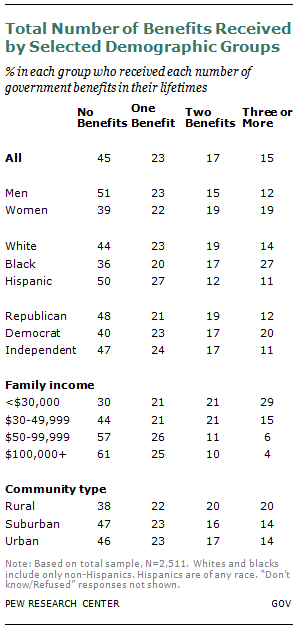
About a third of all Americans (32%) have benefited from two or more entitlement programs over the course of their lives: 17% have been helped by two programs and 15% have received assistance from three or more.
In general, the characteristics of those who have received entitlements from multiple sources echo the overall demographic pattern described earlier: more likely to be black, female, have a lower income, identify with the Democratic Party or live in a rural area.
A plurality of blacks (44%), but 33% of whites and 23% of Latinos, received entitlements from two or more of the six programs tested in the survey.5 About a quarter of all blacks (27%) received entitlements from three or more programs; in contrast, 14% of whites and 11% of Hispanics received help from as many government sources. (As a group, Hispanics experience similar levels of economic hardship as blacks. Their lower utilization of entitlement benefits stems in part from their relative youth and in part from the fact that some are in the country illegally and thus unable to receive benefits.)
Women are significantly more likely than men to have ever received two or more entitlements. According to the survey, about four-in-ten (38%) of all women and 26% of men got help from two or more of the six major entitlement programs.
Lower-income adults are more than three times as likely to receive entitlements from multiple programs as the more affluent (50% for those with family incomes under $30,000 vs. 14% among those making $100,000 a year or more).
Democrats (37%) are more likely than Republicans (30%) or independents (28%) to have received entitlements from two or more government programs.
What Is Government’s Role in Caring For the Most Needy?
Nearly six-in-ten Americans (57%) say government has a responsibility to take care of those who cannot take care of themselves. Do these views vary depending on whether the respondent has personally benefited from a government entitlement program?
These data suggest the answer is a qualified yes. Overall, those who have received benefits from at least one of the six major programs are somewhat more likely than those who haven’t to say government is responsible for caring for those who cannot help themselves (60% vs. 55%).
When the analysis focuses just on just the respondents who have received benefits from at least one of the four programs that target the needy, the gap between entitlement recipients and other adults increases to eight percentage points (62% vs. 54%).
Some larger differences in attitudes toward government’s role emerge when the results are broken down by specific program, though in every case majorities of both recipients and non-recipients affirmed that government has the obligation to help those most in need.
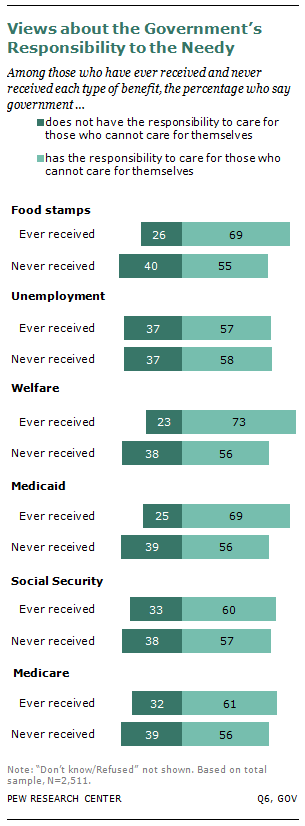
For example, nearly three-quarters of those who ever received welfare benefits (73%) say government has a duty to care for those who cannot care for themselves. In contrast, less than six-in-ten (56%) of those who have never been on welfare agree.
Similar double-digit gaps surface between non-recipients and those who ever received food stamps (14 percentage points) and Medicaid (13 points).
But when those who ever received unemployment benefits are compared with those who have not, the gap virtually disappears: About six-in-ten adults (57%) who have received unemployment benefits say government should help the helpless, while 58% who never collected jobless benefits agree.
No significant differences in attitudes toward government’s responsibility to the neediest emerged between adults who have ever received Social Security and those who have not (60% vs. 57%). Similarly about six-in-ten (61%) of those who benefited from Medicare believe it is government’s duty to help those who cannot help themselves, while 56% of those who have not received these benefits agree.
The survey finds a big difference by partisanship on this question. Nearly three-quarters (74%) of Democrats say the government has such a responsibility compared with 57% of independents and 38% of Republicans.