
Pew Research Center

FOR RELEASE SEPTEMBER 26, 2012

A Record One-in-Five Households Now Owe Student Loan Debt

Burden Greatest on Young, Poor

FOR MEDIA OR OTHER INQUIRIES:

Communications Department
202.419.4372
www.pewresearch.org

RECOMMENDED CITATION

Pew Research Center, September 2012, "A Record One-in-Five Households Now Owe Student Loan Debt"

About Pew Research Center

Pew Research Center is a nonpartisan, nonadvocacy fact tank that informs the public about the issues, attitudes and trends shaping the world. It does not take policy positions. The Center conducts public opinion polling, demographic research, computational social science research and other data-driven research. It studies politics and policy; news habits and media; the internet and technology; religion; race and ethnicity; international affairs; social, demographic and economic trends; science; research methodology and data science; and immigration and migration. Pew Research Center is a subsidiary of The Pew Charitable Trusts, its primary funder.

© Pew Research Center 2026

Table of contents

  • About Pew Research Center
  • A Record One-in-Five Households Now Owe Student Loan Debt
  • Section 1: The Growth of Outstanding Student Debt
  • Section 2: Who Owes the Outstanding Student Debt?
  • Section 3: Student Debt and the Household Ability to Pay
  • Section 4: Student Debt and the Deleveraging of Household Debt
  • References
  • Appendix A: Data Source and Methodology
  • Appendix B: Additional Tables

A Record One-in-Five Households Now Owe Student Loan Debt

Burden Greatest on Young, Poor

About one out of five (19%) of the nation’s households owed student debt in 2010, more than double the share two decades earlier1 and a significant rise from the 15% that owed such debt in 2007, just prior to the onset of the Great Recession, according to a Pew Research Center analysis of newly available government data.

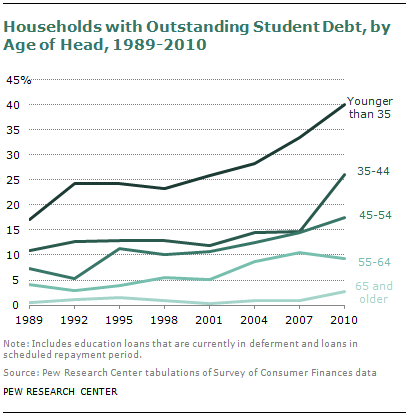
The Pew Research analysis also finds that a record 40% of all households headed by someone younger than age 35 owe such debt, by far the highest share among any age group.

It also finds that, whether computed as a share of household income or assets, the relative burden of student loan debt is greatest for households in the bottom fifth of the income spectrum, even though members of such households are less likely than those in other groups to attend college in the first place.2

Since 2007 the incidence of student debt has increased in nearly every demographic and economic category, as has the size of that debt.
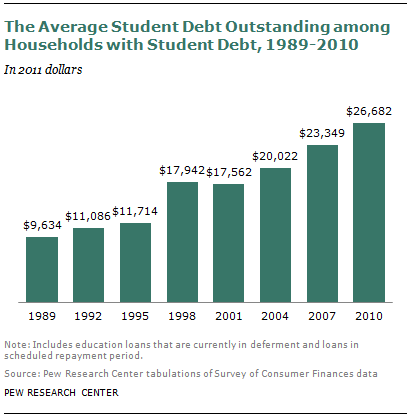
Among households owing student debt, the average outstanding student loan balance increased from $23,349 in 2007 to $26,682 in 2010. Most debtor households had less than $50,000 in outstanding student debt in 2010, but the share of households owing elevated amounts has increased. In 2007, 10% of student debtors owed more than $54,238. By 2010, 10% of student debtor households owed more than $61,894 (all dollar figures adjusted for inflation and in 2011 dollars).

While every income group had more total student loan debt in 2010 than in 2007, the increases were greatest at the two extremes of the income distribution—households in the lowest fifth of households by annual income and in the highest fifth—than in the middle three-fifths.

In 2010 the least affluent fifth of households owed 13% of the outstanding student debt, up from 11% in 2007. Similarly the share of the outstanding student debt pie owed by the richest fifth of households rose from 28% in 2007 to 31% in 2010.

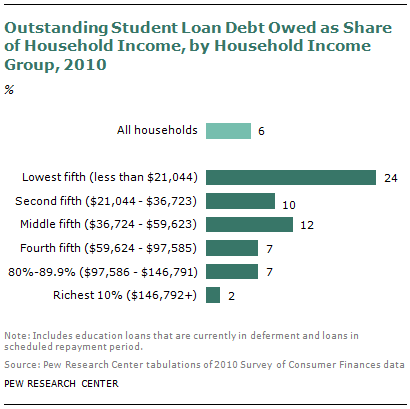
While those at the upper end of the income scale are more likely than others to owe student loan debt, when one considers the resources that households have at their disposal to meet their debts, the relative burden of student loans is much greater for those at the lower end. In 2010 outstanding student debt was nearly a quarter (24%) of the household income of the lowest fifth of households by annual income. By comparison, households in the ninth decile of household income owed only 7 cents of student debt for every dollar of household income received, and those in the tenth decile (90 percent and higher) owed just 2 cents of student debt for every dollar of household income.
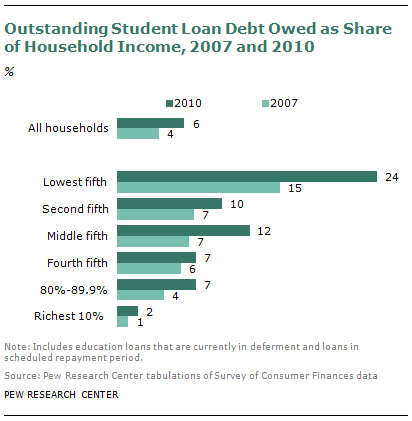
Because outstanding student debt has been rising and household incomes have been falling since 2007, outstanding educational debt has risen as a share of household income for all income groups considered. The outstanding student-debt-to-income ratio nearly doubled for the richest fifth of households from 2007 to 2010, but it remains the case that in both years the ratio of student debt to income was markedly higher for the lowest fifth of households by income. Student debt represented 15 cents of every dollar of household income for the lowest fifth of households in 2007. Even with the recent run-up, educational debt represents a much smaller share of household income for the richest fifth of households in comparison to the lowest fifth of households by annual income.
Leverage ratios, or comparing the outstanding student debt to the household’s assets, tell a similar story. The outstanding student debt in 2010 was 2.2% of the total value of the assets owned by the lowest fifth of households by income. The student debt was only 1.1% of the assets owned by the richest ninth decile of households and a mere 0.2% of the assets owned by the richest tenth of households.
Rising student debt burdens can also be evaluated in light of the other debts owed by households, such as property-related debt, credit card debt and all installment debt. Student debt is a growing share, rising from 3% of outstanding total debt owed by households in 2007 to 5% of all debts in 2010. This reflects growing outstanding student debt and the fact that households have reduced their other debts. Average household indebtedness fell from $105,297 in 2007 to $100,720 in 2010.3
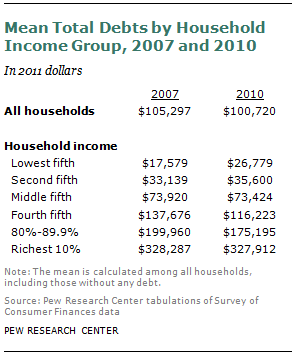
The decline in total indebtedness in spite of rising student debt burdens has not been shared by all households. The average total indebtedness of the lowest fifth of households by annual income rose from $17,579 in 2007 to $26,779 in 2010. Total indebtedness for households in the middle and upper fifths of the income distribution either remained unchanged or declined. The lowest income households have mounting debt obligations in addition to mounting student debt obligations, while the nation’s higher income households have declining other debts in the face of mounting student debt obligations.

About the Report

This report examines outstanding student loan debt in the context of the debtor household’s other debts, assets and other measures of economic ability to handle the student debt. It is based on the Survey of Consumer Finances (SCF), a triennial survey of the financial characteristics of U.S. households sponsored by the Board of Governors of the Federal Reserve with the cooperation of the U.S. Department of the Treasury. The most recent SCF is 2010. The SCF questionnaire has undergone only minor revisions since 1989, and this report analyzes SCF data from 1989 to 2010. The SCF is the nation’s foremost source of data on the wealth or net worth of the nation’s households and use of financial services (as well as the demographic characteristics of the households). Numerous data sources provide detailed information on college student borrowing and its relation to other components of students’ financing their education (for example, the National Postsecondary Student Aid Study, or NPSAS). The value of the SCF is that it sheds light on the role of student debt among persons no longer enrolled in postsecondary education as well as the other debts, assets and wider economic context of student debtors.

“Student debt” or “college debt” in this report refers to outstanding education-related installment debt and includes loans that are currently in deferment as well as loans in their schedule repayment period.

“High school graduate” comprises those who graduated with a regular diploma or its equivalent, such as a GED, but did not obtain any college education. The educational level “some college” refers to those who do not have a four-year college degree, but have completed some college credits, including those who received associate degrees. “College graduate” refers to anyone with at least a bachelor’s degree, including those with a graduate or professional degree.

“Wealth” is the difference between the value of assets owned by a household (such as home, stocks and savings accounts) and its liabilities (such as mortgages, credit card debt and loans for education). The terms “net worth” and “wealth” are used interchangeably in this report.

Dollar amounts are adjusted for inflation and reported in 2011 dollars unless otherwise noted.

See Appendix A for additional details on the SCF and definitions of net worth, household income and household economic groups.

This report was written by Richard Fry. Paul Taylor, executive vice president of the Pew Research Center and director of its Social and Demographic Trends project, assisted the writing of the overview and provided guidance on the structure of the report. Research assistant Seth Motel provided expert assistance with the preparation of charts and formatting the report. The report was number-checked by research assistant Eileen Patten and Motel. The report was copy-edited by Marcia Kramer.

Section 1: The Growth of Outstanding Student Debt

As the nation’s aggregate outstanding student loan debt approaches $1 trillion (Federal Reserve Bank of New York, 2012), recently released Federal Reserve data on household finances reveal a sharp rise in the proportion of households having outstanding student loans. Nationally, in 2010 nearly one-in-five households (19%) owed student loans. In 1989 less than one-in-ten households had outstanding educational loans. As recently as 2007 only 15% of households had student debt, and thus amid the widely noted meltdown in the nation’s stock of wealth accompanying the Great Recession (Bricker et al., 2012), more households have student debt obligations.

The increase over 20 years in the share of households with education debt has occurred among most demographic and economic groups (see the first table in Appendix B). For example, among households by the age of the household head, more older as well as younger households had outstanding student debt in 2010 than in 1989. In regard to the rise in the propensity to have student debt since 2007, all age groups with the exception of households headed by those ages 55 to 64 experienced an increase. By 2010 40% of households headed by those younger than 35 had outstanding student debt, and 26% of households headed by those ages 35 to 44 had outstanding student loan obligations.

Among households owing student debt, the mean outstanding student loan balance was $26,682 in 2010. This average conceals considerable variation in the amount owed. The median amount owed was $13,410, and thus a majority of households paying student debt owe less than $14,000. More than three-quarters of households with student debt have balances less than $30,000. Yet, a nontrivial proportion of households paying student debt still owe at least $50,000. Around 10% of households paying down student debt have outstanding balances in excess of $62,000.

The average outstanding student loan balance among households with student debt has been rising. As previously reported by the Federal Reserve, the average amount owed rose 14%, from $23,349 in 2007 to $26,682 in 2010 (Bricker et al., 2012).

The increase in outstanding student debt since 2007 is being driven by several factors. First, college enrollment has increased sharply during the Great Recession and tepid recovery. In fall 2007, 18.2 million students were enrolled in college (Snyder and Dillow, 2012). By fall 2010, 21.0 million students were pursuing college, a 15% increase.

Second, the trend has been for college students to increasingly borrow to finance their education, and when they do borrow, to borrow greater amounts (Hinze-Pifer and Fry, 2010).

In 2009-10, 51.1% of full-time, first-time undergraduate students had a student loan, an increase from the 43.5% of such students in 2006-07 (Snyder and Dillow, 2012). As far as amounts borrowed, the average public, four-year college graduate had accumulated $22,000 (in 2010 dollars) in debt upon receiving a bachelor’s degree in 2009-10, up from $20,500 (in 2010 dollars) in 2006-07 (College Board Advocacy and Policy Center, 2011).4

Section 2: Who Owes the Outstanding Student Debt?

Most of the nation’s outstanding student loan debt is owed by younger households. In 2010, 70% of the total student debt was owed by households headed by those under age 45. Nearly a fifth (18%) of the outstanding debt was owed by households age 45-54.5

The outstanding debt is overwhelmingly owed by relatively well-educated households. In 2010 nearly 90% of the debt was owed by households whose head had completed at least some college education and almost 70% was owed by households whose head had finished college. These households are “relatively well-educated” since only 56% of the nation’s households in 2010 were headed by those who had at least completed some college education.

Since the nation’s outstanding student debt is largely owed by the nation’s younger households as well as better-educated households, it is not clear which households would be expected to owe student debt in terms of economic affluence.

By the yardstick of current household annual income, the 2010 outstanding student debt was disproportionately owed by the nation’s middle- and upper-income households. The poorest two-fifths, or 40% of households (households with an annual income of $36,723 or less), owe only 24% of the 2010 outstanding student debt. The next richest 40% of households (those with an annual income between $36,724 and $97,585) owe 45% of the outstanding student debt. The richest fifth of households (those with an income of $97,586 or more) owed 31% of the student debt.6

In terms of household wealth or net worth, the nation’s least wealthy households owe most of the student debt. In 2010 the least wealthy fourth of households (those whose net worth is less than $8,562) owed 58% of the outstanding student debt.

That the least wealthy owe most of the student debt reflects at least two factors: The student debt is largely owed by younger households, and for most households it takes many years to accumulate their nest eggs.

It also reflects the manner in which net worth is measured. Conventionally measured net worth equals the value of the household’s assets minus liabilities. Outstanding student debt is included among the household’s liabilities. But the household assets include only financial assets, properties, equity in businesses and other tangible assets (for example, jewelry and collectibles). Net worth does not include the value of human capital. Conventionally measured net worth is biased to show that student debtors have less wealth because the debt is counted but the corresponding asset (i.e., human capital) is not included as an asset.7

Who Owes the Mounting Student Debt?

In terms of household income, the nation’s least well-off and most well-off households owe more of the outstanding student debt than in 2007. In 2007 the poorest one-fifth of households owed 11% of the debt outstanding.8 By 2010 they owed 13% of a significantly larger aggregate student debt. At the other end of the income spectrum, the richest one-fifth also owed a greater proportion of student debt. In 2007 the richest one-fifth of households owed 28% of the outstanding debt; by 2010 this income category owed 31% of the outstanding debt. Between 2007 and 2010, the middle three-fifths of households by income owed a shrinking share of a growing student debt pie.

Section 3: Student Debt and the Household Ability to Pay

Whether student debt is growing increasingly burdensome for household finances involves not only the size of the outstanding loan balances but also changes in the household’s other debts and its ability to pay those debts. This section evaluates mounting student debt in the context of two conventional measures of the household’s ability to pay: its household income and its stock of assets. The next section presents evidence on the more well-known relationship of student debt to other types of household debt.

Outstanding Student Debt to Income

Mounting student debt would be of less concern if household incomes were rising, but as measured by the SCF, annual household incomes have been falling since 2007 and the decline in household income has not been the same across richer and poorer households.

Among all households, mean annual household income fell from $91,275 in 2007 to $80,805 in 2010, or by 11%.

The fifth of households with the lowest incomes did not experience as much of a decline in mean household income as more affluent households. In 2010 the average annual household income of the least affluent one-fifth of households was $13,303, only slightly lower than its 2007 mean household income level of $13,343.

From 2007 to 2010, the mean income of the richest 10% of households declined 17%, from $429,965 to $358,731.

Comparing the stock of outstanding student debt to household income, in 2010 the outstanding debt was 6% of household income. Another way of putting that is that households had 6 cents of outstanding student debt for every dollar of income received.

Though the least affluent one-fifth of households owe only 13% of the outstanding student debt in 2010, they also have low household incomes. As a result, the student-debt-to-household-income ratio for the least well-off one-fifth of households was 24% in 2010, or their outstanding educational debt amounts to 24 cents for every dollar of their household income.

Alternatively, households in the ninth decile of the household income distribution (those with an annual income between $97,586 and $146,791) or perhaps “upper middle income” owe 17% of the outstanding student debt in 2010. But their household incomes are much larger, and as a result their 2010 student-debt-to-income ratio was 7%, or outstanding student loan balances represented only 7 cents on every dollar of household income.

Regarding trend, with outstanding student debt rising and household incomes falling from 2007 to 2010, the student-debt-to-income ratio markedly rose from 2007 to 2010. Across all households, outstanding student debt went from 4 cents on a dollar of income in 2007 to 6 cents in 2010.

For the richest one-fifth of households, the ratio of student debt to income grew significantly. For the richest 10% of households, it doubled from 1 cent on the dollar in 2007 to 2 cents on the dollar in 2010. For households in the ninth decile, the ratio of student debt to income nearly doubled from 4 cents on the dollar in 2007 to 7 cents in 2010.

In comparison, the ratio of student debt to income for the fifth of households with the lowest income increased from 15 cents on the dollar in 2007 to 24 cents in 2010. Although their household income did not decline from 2007 to 2010, these households owe a lot more student debt in 2010 than 2007 (13% of the student debt pie in 2010, up from 11% in 2007).

Outstanding Student Debt to Assets

Patterns and trends in the ratio of outstanding student debt to household assets tell a similar story as the debt-to-income ratio. In the SCF, household assets include the value of physical property (equity in properties, equity in automobiles and furnishings and collectibles), financial assets (stocks, bonds and retirement accounts) and equity in businesses. At least in principle, assets can be liquidated to pay off debts and thus debt-to-asset ratios serve as an alternative measure of a household’s ability to handle debt.

Driven by the housing bust, the value of household assets sharply declined from 2007 to 2010. The mean value of assets among all households fell from $709,000 in 2007 to $611,000 in 2010.

The decline in the value of assets was not uniform across households. Mean assets for households in the lowest fifth of households by income actually increased from $132,000 in 2007 to $147,000 in 2010. Mean assets for households with higher incomes declined from 2007 to 2010.

Households in the lowest fifth of households by income have much less outstanding student debt than do households in the highest fifth. Households in the bottom fifth owe only 13% of the student debt in 2010, while the upper fifth owes 31% of the debt. But the assets of the bottom fifth of households pale in comparison to the assets of the richest fifth of households. The ratio of student debt to assets of the bottom fifth of households (2.2%) is at least twice the size of the ratio of the richest fifth of households. The outstanding student-debt-to-asset ratio for households in the ninth decile of household income was 1.1% in 2010, and the ratio for the richest tenth of households was only 0.2%.

Outstanding student-debt-to-asset ratios roughly doubled for the fifth of households with the highest income from 2007 to 2010, but even so, they remained significantly lower in 2010 than the ratio for households with less income.

Section 4: Student Debt and the Deleveraging of Household Debt

References

Bozick, Robert, and Erich Lauff. 2007. National Center for Education Statistics, Institute of Education Sciences. “Education Longitudinal Study of 2002 (ELS:2002): A First Look at the Initial Postsecondary Experiences of the High School Sophomore Class of 2002.” Washington, DC: U.S. Department of Education, October.

Bricker, Jesse, Arthur B. Kennickell, Kevin B. Moore, and John Sabelhaus. 2012. “Changes in U.S. Family Finances from 2007 to 2010: Evidence from the Survey of Consumer Finances.” Bulletin 98-2. Washington, DC: Board of Governors of the Federal Reserve, June.

Brown, Meta, Andrew Haughwout, Donghoon Lee, Maricar Mabutas, and Wilbert van der Klaauw. 2012. “Grading Student Loans.” Liberty Street Economics blog. New York, NY: Federal Reserve Bank of New York, March 5.

College Board Advocacy and Policy Center. 2011. “Trends in Student Aid 2011.” Trends in Higher Education Series. New York, NY: The College Board.

DeNavas-Walt, Carmen, Bernadette D. Proctor, and Jessica C. Smith. 2011. “Income, Poverty, and Health Insurance Coverage in the United States: 2010.” Current Population Reports, Consumer Income, P60-239. Washington, DC: U.S. Census Bureau, September.

Federal Reserve Bank of New York. 2012. Quarterly Report on Household Debt and Credit. August.

Hinze-Pifer, Rebecca, and Richard Fry. 2010. “The Rise of College Student Borrowing.” November. Washington, D.C.: Pew Research Center, Social & Demographic Trends project.

Pew Research Center. 2012. “The Lost Decade of the Middle Class: Fewer, Poorer, Gloomier.” August. Washington, DC: Pew Research Center, Social & Demographic Trends project.

Snyder, Thomas D., and Sally A. Dillow. 2012. National Center for Education Statistics, Institute of Education Sciences. “Digest of Education Statistics 2011.” Washington, D.C.: U.S. Department of Education, June.

Appendix A: Data Source and Methodology

The Survey of Consumer Finances (SCF) is sponsored by the Federal Reserve Board of Governors and the U.S. Department of the Treasury. It is designed to provide detailed information on the finances of U.S. households. Bricker et al. (2012) serves as useful introduction to the specifics of the SCF.

Household income refers to the household’s cash income, before taxes, for the full calendar year preceding the survey. The components of income in the SCF are wages; self-employment and business income; taxable and tax-exempt interest; dividends; realized capital gains; food stamps and other, related support programs provided by government; pensions and withdrawals from retirement accounts; Social Security; alimony and other support payments; and miscellaneous sources of income.

Wealth, or net worth, is the difference between the value of assets owned by a household and the value of the liabilities (or debt) held by the household. Assets include items such as the value of an owned home, value of a business, accounts in financial institutions, stocks and bonds, 401(k) and thrift accounts, individual retirement accounts and Keogh accounts, rental properties, motor vehicles and other personal property. Liabilities include home mortgages, credit card debt, student loans, vehicle loans and business debt. The SCF does not account for the discounted values of Social Security benefits or defined benefit pension plans.

The analysis ranks households by their relative position in the household income distribution (by fifths) and in the net worth distribution (by fourths). The cutpoints used to define the groups in the distributions of income and net worth are shown on the adjoining chart.

The definition of a “household” in the SCF differs from that used in Census Bureau studies. The sampling unit in the SCF is the “primary economic unit” (PEU), not the household. As stated by the Federal Reserve Board, “the PEU consists of an economically dominant single individual or couple (married or living as partners) in a household and all other individuals in the household who are financially interdependent with that individual or couple.” Federal Reserve Board publications refer to the PEU as a “family,” but readers may infer that this necessitates the presence of two related persons, whereas a PEU can consist of a person living alone. In this document, a PEU is referred to as a “household.”

The household’s characteristics are in part based on the household head. In the SCF if a couple is economically dominant in the PEU, then the head is the male in an opposite sex couple or the older person in a same-sex couple. If a single individual is economically dominant, that person is the household head.

The estimates reported are based on analysis of the public use versions of the 1989 to 2010 SCFs. The 2010 SCF interviewed about 6,500 households, a significantly greater number of interviews than prior years. The unweighted sample sizes in the SCF for various household categories are reported below.

There are notable differences between the SCF data the Federal Reserve Board releases for public use and the data it uses to publish estimates of family income and wealth. One difference is that estimates published by the Federal Reserve Board are often based on preliminary data, while the public-use files represent edited versions of the data. Also, prior to public release, the Federal Reserve Board alters the data using statistical procedures that may affect the estimates, albeit not significantly. That is done for reasons of confidentiality.

The data on student loan debt, net worth and household income are adjusted for inflation with the Bureau of Labor Statistics’ Consumer Price Index Research Series (CPI-U-RS) as published in DeNavas-Walt, Proctor and Smith (2011). This is the price index series used by the U.S. Census Bureau to deflate the data it publishes on household income.

Appendix B: Additional Tables