
Pew Research Center

FOR RELEASE AUGUST 22, 2012

The Lost Decade of the Middle Class

Fewer, Poorer, Gloomier

FOR MEDIA OR OTHER INQUIRIES:

Communications Department
202.419.4372
www.pewresearch.org

RECOMMENDED CITATION

Pew Research Center, August 2012, "The Lost Decade of the Middle Class"

About Pew Research Center

Pew Research Center is a nonpartisan, nonadvocacy fact tank that informs the public about the issues, attitudes and trends shaping the world. It does not take policy positions. The Center conducts public opinion polling, demographic research, computational social science research and other data-driven research. It studies politics and policy; news habits and media; the internet and technology; religion; race and ethnicity; international affairs; social, demographic and economic trends; science; research methodology and data science; and immigration and migration. Pew Research Center is a subsidiary of The Pew Charitable Trusts, its primary funder.

© Pew Research Center 2026

Table of contents

  • About Pew Research Center
  • The Lost Decade of the Middle Class
  • Chapter 2: Middle-Class Demographics
  • Chapter 3: Middle-class Economics
  • Chapter 4: Middle-Class Mobility
  • Chapter 5: Middle-class Politics
  • Chapter 6: Census Trends for Income and Demography
  • Chapter 7: Income and Wealth, by Income Tier

The Lost Decade of the Middle Class

Fewer, Poorer, Gloomier

Chapter 1: Overview

As the 2012 presidential candidates prepare their closing arguments to America’s middle class, they are courting a group that has endured a lost decade for economic well-being. Since 2000, the middle class has shrunk in size, fallen backward in income and wealth, and shed some—but by no means all—of its characteristic faith in the future.

These stark assessments are based on findings from a new nationally representative Pew Research Center survey that includes 1,287 adults who describe themselves as middle class, supplemented by the Center’s analysis of data from the U.S. Census Bureau and Federal Reserve Board of Governors.

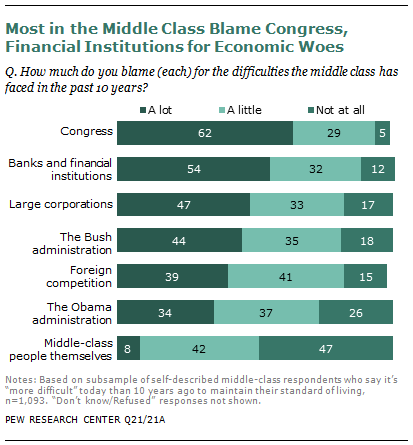
Fully 85% of self-described middle-class adults say it is more difficult now than it was a decade ago for middle-class people to maintain their standard of living. Of those who feel this way, 62% say “a lot” of the blame lies with Congress, while 54% say the same about banks and financial institutions, 47% about large corporations, 44% about the Bush administration, 39% about foreign competition and 34% about the Obama administration. Just 8% blame the middle class itself a lot.

Their downbeat take on their economic situation comes at the end of a decade in which, for the first time since the end of World War II, mean family incomes declined for Americans in all income tiers. But the middle-income tier—defined in this Pew Research analysis as all adults whose annual household income is two-thirds to double the national

median 1 —is the only one that also shrunk in size, a trend that has continued over the past four decades.
In 2011, this middle-income tier included 51% of all adults; back in 1971, using the same income boundaries, it had included 61%. 2 The hollowing of the middle has been accompanied by a dispersion of the population into the economic tiers both above and below. The upper-income tier rose to 20% of adults in 2011, up from 14% in 1971; the lower-income tier rose to 29%, up from 25%. However, over the same period, only the upper-income tier increased its share in the nation’s household income pie. It now takes in 46%, up from 29% four decades ago. The middle tier now takes in 45%, down from 62% four decades ago. The lower tier takes in 9%, down from 10% four decades ago.

For the middle-income group, the “lost decade” of the 2000s has been even worse for wealth loss than for income loss. The median income of the middle-income tier fell 5%, but median wealth (assets minus debt) declined by 28%, to $93,150 from $129,582. 3 During this period, the median wealth of the upper-income tier was essentially unchanged—it rose by 1%, to $574,788 from $569,905. Meantime, the wealth of the lower-income tier plunged by 45%, albeit from a much smaller base, to $10,151 from $18,421.

Which Presidential Candidate Is Better for the Middle Class?

As the 2012 presidential campaign heads toward the party conventions and the fall climax, no group has been the target of more electioneering appeals than America’s beleaguered middle class. The Pew Research survey finds that neither candidate has sealed the deal with middle-class adults but that President Obama is in somewhat better shape than his Republican challenger, Mitt Romney. 4

About half (52%) of adults who self-identify as middle class say they believe Obama’s policies in a second term would help the middle class, while 39% say they would not help. By comparison, 42% say that Romney’s election would help the middle class, while 40% say it would not help. There is much more variance in the judgments of the middle class about the likely impact of the two candidates’ policies on the wealthy and the poor. Fully seven-in-ten (71%) middle-class respondents say Romney’s policies would help the wealthy, while just a third (33%) say they would help the poor. Judgments about Obama tilt the opposite way. Roughly four-in-ten (38%) middle-class respondents say his policies would help the wealthy, and about six-in-ten (62%) say they would help the poor.

Who Is Middle Class?

In addition to looking at a “statistical middle” derived from government data, this report looks at those who self-identify as middle class, based on a Pew Research Center national survey of 2,508 adults. In the survey, 49% of adults describe themselves as middle class; 53% said the same in a similar survey in early 2008, when what is now known as the Great Recession was gathering steam. That recession, according to the National Bureau of Economic Research, began in December 2007 and ended in June 2009.

 The 2012 survey finds an increase in those who self-identify as being in the lower or lower-middle class—32% place themselves in these categories, up from 25% in 2008. And 17% now say they are in the upper or upper-middle class, down from 21% in 2008.

Noteworthy patterns by race, age and gender are present in all of these self-categorizations.

Similar shares of whites (51%), blacks (48%) and Hispanics (47%) say they are middle class, even though government data show that whites have a higher median income and much more wealth than blacks or Hispanics.

Adults ages 65 and older (63%) are more inclined than all other age groups to call themselves middle class and less inclined to say they are lower class (20%). Meantime, younger adults (those ages 18 to 29) are more likely to say they are in the lower or lower-middle class; fully 39% say this now, compared with 25% who said so in 2008.

Men (46%) are somewhat less likely than women (53%) to include themselves in the middle class. In 2008, a somewhat larger share of men (51%) said they were middle class, and 54% of women said they were.

Falling Behind, Moving Ahead

When middle-class Americans size up their personal economies, they see themselves as both moving ahead and falling behind. It all depends on the time frame. Over the short term, their evaluations tilt negative. Over the span of the past decade, they’re mixed. And over the full arc of their lives, they’re positive—albeit less so now than in the past.

The Great Recession officially ended three years ago, but most middle-class Americans are still feeling pinched. About six-in-ten (62%) say they had to reduce household spending in the past year because money was tight, compared with 53% who said so in 2008.

The downbeat short-term perspective is not surprising in light of the heavy economic blows delivered by the Great Recession of 2007-2009 and the sluggish recovery since. About four-in-ten (42%) middle-class adults say their household’s financial situation is worse now than it was before the recession, while 32% say they are in better shape; an additional 23% volunteered that their finances are unchanged. Of those who say they’re in worse shape, about half (51%) say it will take at least five years to recover, including 8% who predict they will never recover.

Asked to compare their financial situation now with what it was 10 years ago, the evaluations of the middle class are more evenly divided. Some 44% say they are more financially secure than they had been, and 42% say less. (An additional 12% volunteered that it’s about the same.)

Over the longer term, the evaluations grow more positive. Six-in-ten (60%) say their standard of living is better than that of their parents at the same age, 24% say it is the same and just 13% say it is worse. However, these evaluations were even rosier four years ago, when 67% said they were doing better than their parents at the same age.

Does Hard Work Pay Off?

In addition to their scaled-back judgments about how they are doing personally, Americans have a bit less faith in their long-held beliefs about the efficacy of hard work.

Two-thirds of the middle class (67%) agree that “most people who want to get ahead can make it if they are willing to work hard,” while 29% agree that “hard work and determination are no guarantee of success for most people.” Among the general public, the shares are similar—63% say hard work pays off, while 34% say it does not necessarily lead to success. The Pew Research Center has asked this question 10 times since 1994, when 68% of the public agreed that hard work would pay off. The proportion saying so peaked in 1999, when roughly three-quarters (74%) expressed that view.

Looking Ahead with Muted Hope

Middle-class Americans look to the economic future—their own, their children’s, and the nation’s—with a mix of apprehension and muted optimism.

About a quarter (23%) say they are very confident that they will have enough income and assets to last throughout their retirement years; an additional 43% say they are somewhat confident and 32% say they are not too or not at all confident.

As for their children’s economic future, some 43% of those in the middle class expect that their children’s standard of living will be better than their own, while 26% think it will be worse and 21% think it will be about the same. Four years ago, in response to the same question, the middle class had higher hopes for their offspring, with 51% predicting they would have a better standard of living and 19% thinking it would be worse.

As for the nation as a whole, the verdict from the middle class is likewise muted. Only about one-in-ten (11%) say they are very optimistic about the country’s long-term economic future, 44% are somewhat optimistic and 41% are somewhat or very pessimistic.

Does Partisan Affiliation Influence Economic Perceptions?

As is true of the population overall, more members of the middle class identify with or lean toward the Democratic Party (50%) than with the Republican Party (39%), with 11% declining to take sides. These partisan affiliations are correlated with the economic attitudes and perceptions of survey respondents in ways that often run contrary to their actual economic circumstances, a pattern evident in many Pew Research surveys conducted since 2008, when the recession took hold and Barack Obama was elected president.

Many of the demographic groups that have fared the worst during the recession—including young adults (ages 18 to 24), blacks and Hispanics—have the most upbeat assessments of their own economic mobility, their children’s economic prospects and the nation’s economic future.

These groups are all heavily Democrats and supporters of President Obama. For example, young adults are more optimistic than older adults about the nation’s long-term economic future (67% of adults ages 18 to 24 vs. 52% of adults ages 35 and older), and blacks (78%) and Hispanics (67%) are more optimistic than whites (48%). The same patterns play out in many evaluations of personal finances.

Partisan differences also affect the way members of the middle class apportion blame for the economic difficulties the middle class has endured over the past decade. Sizable gaps exist on whether a lot of blame belongs with large corporations (Democrats 59% vs. Republicans 27%) and banks and other financial institutions (Democrats 62% vs. Republicans 40%). However, similar majorities of both groups blame Congress (63% for Democrats and 58% for Republicans).


Cost To Lead a Middle-class Life
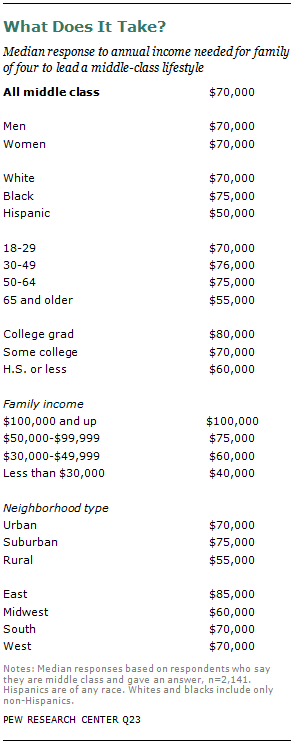
The survey also asked how much annual income a family of four would need to lead a middle-class lifestyle. The median response among those who consider themselves middle class is $70,000, meaning that half of middle-class adults say it would take more than $70,000 annually and half say it would take less than that amount.

Public estimates of how much money it takes for a family of four to live a middle-class lifestyle are quite close to the Pew Research Center’s analysis based on U.S. Census Bureau data that the median income for a four-person household is $68,274. 5

As expected from the varying cost of living across the country, the annual family income seen as necessary for a middle-class lifestyle is a median of $85,000 in the East and $60,000 in the Midwest (with a median of $70,000 in both the South and the West). Similarly, the median among middle-class adults living in rural areas is $55,000; among suburban and urban dwellers, it is $75,000 and $70,000, respectively.

Income Trends from Government Data

The economic narrative the middle class tells about itself through its responses to the Pew Research survey is consistent with the story told by government economic and demographic trend data. For the half century following World War II, American families enjoyed rising prosperity in every decade—a streak that ended in the decade from 2000 to 2010, when inflation-adjusted family income fell for the middle income as well as for all other income groups, according to U.S. Census Bureau data. 6

A Pew Research Center analysis of long-term census data also finds that those in the upper-income tier now take in a much larger share of U.S. aggregate household income than they did four decades ago, while those in the middle tier take in a much lower share. (For the purpose of this analysis, the middle tier is defined as those living in households with an annual income

that is 67% to 200% of the national median; the upper tier is made up of those in households above the 200% threshold, and the lower tier is made up of those below the 67% threshold.)


The Pew Research analysis finds that upper-income households accounted for 46% of U.S. aggregate household income in 2010, compared with 29% in 1970. Middle-income households claimed 45% of aggregate income in 2010, compared with 62% in 1970. Lower-income households had 9% of aggregate income in 2010 and 10% in 1970.

These shifts result from two trends: larger income gains for upper-income households than for others and a decline in the share of adults who live in middle-income households. From 1970 to 2010, median incomes rose 43% for upper-income households, 34% for middle-income households and 29% for lower-income households. Over the same four decades, the share of the adult population living in upper-income households rose to 20% from 14%; for middle-income households, it fell to 51% from 61%; and for lower-income households, it rose to 29% from 25%.

Winners and Losers

Even as the share of Americans in the middle has declined, the income status has improved for some demographic groups and deteriorated for others. This report classified groups into winners and losers by comparing changes over time in their shares in the upper- and lower-income tiers.

From 2001 to 2011, there were distinct differences by age: Adults ages 65 and older were the greatest winners, while other age groups were economic losers. The widowed and currently married were winners, while those who never married or who were divorced or separated were economic losers. Age helps explain some differences by marital status. Widowed and currently married adults tend to be older than those who never married. Adults with only a high school diploma were among the groups that lost the most ground, although college graduates also experienced a small loss.

Over the longer term—1971 to 2011—older adults fared better than younger ones, married adults fared better than the unmarried, and college-educated adults fared better than those with less education.

Wealth, Assets and Debt

The net worth of middle-income families—that is, the sum of assets minus debts—also took a hit during the past decade, according to data for 2001 to 2010 from the Federal Reserve’s Survey of Consumer Finances. Median net worth fell 28%, to $93,150, erasing two decades of gains.

Wealth of middle-income families had been unchanged from 1983 to 1992, then grew sharply—by 43%—from 1992 to 2001, and continued to grow in the 2001-2007 period, by 18%. Net worth of middle-income families dropped 39% in the later years of the decade as the housing market crash and Great Recession wiped out the previous advances. Over the 1983 to 2010 period, only upper-income families registered strong increases in wealth.

Breaking apart the two components of net worth—assets and liabilities—the value of assets grew more than the level of debt in dollar terms from 1983 to 2001 and from 2001 to 2007 for all families and for middle-income families. For middle-income families, though, the rate of increase in debt was larger than the rate of increase in assets during both periods. From 2007 to 2010, mean debt level for middle-income families fell 11%, or $11,040, but the value of their assets fell even more, by 19%, or $75,621.

One reason that upper-income families fared better than others is that they are less dependent on home equity, which has been the main source of declines in wealth since 2006. Home equity accounted for at most 24% of the mean assets of upper-income families from 1983 to 2010, compared with at least 40% of the assets of middle-income families during the same period.

About the Authors

This report was edited by Paul Taylor, executive vice president of the Pew Research Center and director of its Social & Demographic Trends project, who also co-wrote Chapter 1. Senior editor Rich Morin led the team that drafted the questionnaire; he also co-wrote Chapter 3 with research assistant Eileen Patten and wrote Chapter 5. Senior writer D’Vera Cohn co-wrote Chapter 1 and wrote Chapter 2; senior researcher Cary Funk wrote Chapter 4. Chapters 6 and 7 were written by associate director for research Rakesh Kochhar and senior research associate Richard Fry. Research assistant Seth Motel and Patten helped with the preparation of charts, and Patten formatted the final report. Patten and Motel also numbers-checked the report. Social & Demographics Trend project associate director Kim Parker and research associate Wendy Wang assisted on all aspects of the research project. Marcia Kramer copy-edited the report.

About the Report

The remainder of this report is organized as follows: Chapter 2 provides a detailed demographic profile of those who described themselves as middle class in the Pew Research survey. Chapter 3 reports how well middle-class Americans say they have fared financially in the past decade. Chapter 4 examines social mobility, including whether middle-class Americans believe they have done better or worse in life than their parents, their expectations for their children, and asks Americans how much money is needed to lead a middle-class life. Chapter 5 examines the politics of the middle class, including their judgments about the political parties and presidential candidates on matters related to the middle class. Chapter 6 uses an income-based definition of the middle tier derived from U.S. Census Bureau data to analyze economic and demographic trends over the past 60 years, with a special focus on the past decade. Chapter 7 also uses government data to conduct a detailed analysis of trends in both wealth and income from 1983 to 2011, with a special focus on the decline in wealth since 2007 among different income groups.

About the Data

The income, wealth and demographic data come from two primary sources. The demographic and household income data reported in Chapter 6 are derived from the Current Population Survey, Annual Social and Economic Supplements (ASEC) conducted in March of every year. Income is reported for the year prior to the survey year (e.g., 2010 income is reported in the 2011 survey). The specific files used in this report are from March 1971 to March 2011, the latest year for which ASEC data are available. Conducted jointly by the U.S. Census Bureau and the Bureau of Labor Statistics, the CPS is a monthly survey of approximately 55,000 households and is the source of the nation’s official statistics on unemployment. Additionally, the mean family income numbers in Chapter 6 are derived from the U.S. Census Bureau’s Historical Income Tables. The wealth data in Chapter 7 are derived from the Survey of Consumer Finances (SCF), which is sponsored by the Federal Reserve Board of Governors and the Department of Treasury. It has been conducted every three years since 1983 and is designed to provide detailed information on the finances of U.S. families. The SCF sample typically consists of approximately 4,500 families, but the 2010 survey included about 6,500 families. For more details, see Appendix 2.

The general public survey is based on telephone interviews conducted July 16-26, 2012, with a nationally representative sample of 2,508 adults ages 18 and older, including 1,287 respondents who identified themselves as “middle class.” The survey included an oversample of 407 non-Hispanic blacks and 377 Hispanics. A total of 1,505 interviews were completed with respondents contacted by landline telephone and 1,003 with those contacted on their cellular phone. Data are weighted to produce a final sample that is representative of the general population of adults in the continental United States. Survey interviews were conducted in English and Spanish under the direction of Princeton Survey Research Associates International. Margin of sampling error is plus or minus 2.8 percentage points for results based on the total sample, 3.9 percentage points for those in the middle class, 5.7 percentage points for non-Hispanic blacks and 5.5 percentage points for the Hispanic subsamples at the 95% confidence level. For more details, see Appendix 3.

Notes on Terminology

Race/Ethnicity: Hispanics are of any race. Whites and blacks include only non-Hispanics.

Education: “High school or less” refers to those who either did not finish high school or who graduated high school (with a regular diploma or its equivalent, such as a GED) but did not obtain any college education. The educational level “some college” refers to those who do not have a four-year college degree, but have completed some college credits, including those who received associate degrees. “College graduate” refers to anyone with at least a bachelor’s degree, including those with a graduate or professional degree.

Net Worth: The difference between the value of assets owned by a household (such as home, stocks and savings accounts) and its liabilities (such as mortgages, credit card debt and loans for education). The terms “net worth” and “wealth” are used interchangeably in this report.

Income Tiers: Analysis based on census data refers to lower-, middle- and upper-income groups, or tiers. Using income as the criterion, the middle tier is defined as those living in households with an annual income that is two-thirds to double (67% to 200%) the national median; the upper tier is made up of those in households above the 200% threshold, and the lower tier is made up of those below the 67% threshold. The assignment of a household to a tier depends on what its income expressed in 2011 dollars is estimated to be after it is scaled to a three-person household (see Appendix 2 for details on the adjustment process).

Social Classes: In survey-based analysis, assignment into the lower, middle or upper classes is based on a respondent’s answer to the following question: “If you were asked to use one of these commonly used names for the social classes, which would you say you belong in? The upper class, upper-middle class, middle class, lower-middle class or lower class?” Respondents who say they are upper or upper-middle are combined into a single “upper-class” category; respondents who say they are lower or lower-middle are combined into a single “lower-class” category. The size of the middle group, whether based on household income in 2010 or based on self-described class in the 2012 survey, turns out to be nearly identical.

Chapter 2: Middle-Class Demographics

Asked to place themselves on a five-step socioeconomic ladder, about half of Americans (49%) say they are in the middle, according to the Pew Research survey. In a similar survey taken in 2008, 53% of adults placed themselves in the middle class.

An additional 17% of the public places itself in the upper or upper middle class, and nearly a third —32%—in the lower or lower middle class.7 Both proportions have changed since a Pew Research Center survey conducted in early 2008, after the Great Recession began in December 2007 but before its impact was widely felt. The share of the public placing itself in the upper class has declined from 21% since 2008, while the lower-class share rose from 25%.

The share of adults who identify themselves as middle class varies by age but shows little difference by race or Hispanic origin. Analyzed by other characteristics, responses do not vary by educational attainment, but they do vary by gender, marital status and citizenship.

Age Groups

The oldest adults are more likely to identify themselves as middle class than are adults younger than age 65. Among adults ages 65 and older, 63% describe themselves as middle class, compared with 48% of adults ages 30 to 49 and 50 to 64. Among young adults, ages 18 to 29, 42% call themselves middle class.

Young adults are the only age group less likely to describe themselves as middle class now than in 2008, when 54% did. These young adults also are more likely to place themselves in the lower class in 2012 (39%) than in 2008 (25%). In fact, the share of young adults who self-identify as lower class is statistically no different from the share who identify as middle class, while in 2008, the middle-class proportion was double that of the lower class.

Race and Hispanic Origin

By race and Hispanic origin, there is little variation in the proportion of Americans who say they are middle class, or who said so in 2008. However, Hispanics (40%) are more likely than whites (31%) to call themselves lower class. Whites (17%) are more likely than Hispanics (12%) to self-describe as upper class.

The share of Americans who say they are lower class has risen since 2008 for both whites (when it was 23%) and Hispanics (30%), but is unchanged for black adults (33%). Because of the rising tendency of whites to call themselves lower class, there is no difference today in the share of whites and blacks who identify themselves as lower class. In 2008, a higher share of black adults than white adults identified as lower class.

The share of whites who say they are upper class, 17%, has declined from 23% in 2008. Furthermore, the share of whites who include themselves in the upper class is now equal to the share of blacks who do; in 2008, there was a higher share of self-described upper-class whites.

Gender, Marital Status, Education, Income

According to the Pew Research survey, in 2012, a higher share of women (53%) than men (46%) place themselves in the middle class. In 2008, there was no difference in the share of men (51%) and women (54%) who called themselves middle class.

The share of both men and women who identify themselves as middle class appears to have declined since 2008, though the change is statistically significant only for men. However, both genders are now more likely to describe themselves as lower class. For men the share who self-describe as lower class rose to 34% in 2012 from 25% in 2008; for women, it rose to 31% in 2012 from 24% in 2008. The share of men and women who call themselves upper class appears to have declined since 2008, but the change is statistically significant only for women.

Married adults (55%) are more likely to identify themselves as middle class than are unmarried adults (44%). This is true for each subgroup of unmarried adults—those who are living with a partner (40%); separated, divorced or widowed (46%) or never married (43%).

There are few differences by educational attainment when it comes to Americans’ self-description as middle class. However, 31% of college-educated Americans call themselves upper class, compared with less than 11% among those who did not attend or complete college. At the other end of the scale, 39% of those who did not attend or graduate from college describe themselves as lower class, compared with 17% of college graduates.

Among those with family incomes from $50,000 to $99,999 a year, 65% place themselves in the middle class; so do 51% of people in households with annual incomes of $30,000 to $49,999.

However, the appeal of self-identifying with the middle class is such that even 46% of those with family incomes of $100,000 or more say they are middle class, as do 35% of Americans with family incomes under $30,000.

Looked at by immigrant generation, there is not a statistically significant difference in the share of adults identifying as lower, middle or upper class among those born in the U.S. compared with those born abroad. However, citizenship is a dividing line: Half of citizens say they are middle class, compared with only 39% of non-citizens.

Comparing Survey and Census Data

How do these survey results square with Census Bureau data analyzed elsewhere in this report? The share of adults who self-identify as middle class in the survey is about equal to the share of adults living in households defined as middle income using census data (with a size-adjusted household income that is two-thirds to double the overall median size-adjusted household income). Based on Census Bureau data, the share of all households that are middle income declined in the decade from 2001 (54%) to 2011 (51%).8 Based on data from the Pew Research surveys, there was a decline of four percentage points between 2008 and 2012 in the share of adults who define themselves as middle class.

Chapter 3: Middle-class Economics

Over the past decade, the Great Recession, a housing market collapse, an unemployment surge and an anemic recovery have squeezed the middle class. An overwhelming majority of middle-class Americans (85%) say it is more difficult today than 10 years ago for those in the middle class to maintain their standard of living, according to a Pew Research Center national survey of 2,508 adults.

And it’s not just the middle class that feels this way. Some 82% of the self-described upper class and 87% of those who consider themselves in the lower class agree that it’s harder today for middle-class Americans.

Within the middle class, the downbeat assessment is shared by virtually identical proportions of men and women, Republicans and Democrats, the college-educated and those with a high school degree or less. However, there are some notable differences by race and age.

Middle-class whites are more likely than middle-class blacks to say it is harder today to maintain a middle-class lifestyle (87% vs. 79%). Also, those in the middle class who are ages 50 to 64—adults in their prime earning years—are more likely than those younger than 30 (91% vs. 81%) or older than 65 (83%) to say that maintaining a middle-class lifestyle is harder now than a decade ago.

Who’s to Blame?

Those who say the middle class faces increased difficulties today were asked how much they blame each of seven institutions or groups for the economic problems of the past decade. Congress led the list: Among the middle class, about six-in-ten (62%) blame lawmakers “a lot” for the problems of the middle class. Somewhat smaller shares blame banks and financial institutions (54%) and large corporations (47%). An additional 39% say foreign competition is at fault. The Bush administration is held more accountable than the Obama presidency (44% vs. 34%), the survey found.

One group that the middle class does not hold responsible for its economic problems: the middle class itself. Only 8% say it bears “a lot” of the blame.

The Demographics of Blame

Different demographic groups within the middle class point the finger of blame in different directions. For example, men are more likely than women to blame Congress (68% vs. 58%) for the economic problems of the middle class. Blacks are more likely than whites to blame large corporations for the economic woes of the past decade (57% vs. 45%). About four-in-ten blacks (41%) and 34% of Hispanics say foreign competition is a major cause of these problems. Whites are more likely than Hispanics to say Congress is at serious fault (65% vs. 52%) for middle-class difficulties.

Young middle-class adults are significantly less likely than older generations to say that Congress and foreign competition are major causes of economic problems of the middle class.

Most notably, only about a third (35%) of 18- to 29-year-olds in the middle class blame Congress “a lot” for these problems, compared with 62% of 30- to 49-year-olds, 74% of 50- to 64-year-olds and 68% of those 65 and older.

Political Partisanship and Blame

The partisan and ideological debates that have grown louder this presidential year echo sharply throughout these results.

Among the middle class, about six-in-ten (59%) Democrats but only 27% of Republicans blame large corporations for middle-class economic difficulties—that difference of 32 percentage points is one of the largest ones measured in any of the demographic groups analyzed. Democrats also are far more likely than Republicans to say banks and financial institutions played a major role in these problems (62% vs. 40%).

But there is no significant partisan difference in views toward Congress: 58% of Republicans and 63% of Democrats agree that the nation’s lawmakers bear “a lot” of the blame for the economic troubles of the middle class over the past 10 years. If anything, political independents appear to be more critical of Congress than members of either party; two-thirds of independents (67%) say Congress is a major cause of middle-class problems, though the differences fall just short of being statistically significant.

And some potentially bad news for members of Congress seeking re-election: Middle-class registered voters are much more likely than those who are not registered to vote to blame Congress “a lot” (67% vs. 43%).

The partisan gap opens up when middle-class Republicans and Democrats are asked how much they blame each of the two most recent presidents for the financial difficulties of the middle class.

Two-thirds of Democrats (69%) but only 12% of Republicans say the Bush administration deserves a lot of blame for the economic problems the middle class has faced in the past 10 years. The judgments reverse when the lens shifts to the Obama administration: More than six-in-ten Republicans (63%) but just 8% of Democrats blame the current president “a lot.” Among middle-class independents, 46% blame Bush and 38% blame Obama.

The Middle Class Over Time

The Pew Research survey posed a battery of questions designed to gauge the economic attitudes and experiences of middle-class Americans over various time periods. The findings are mixed. While a sizable majority of respondents (71%) say it is more difficult to get ahead today than it was 10 years ago, they are evenly divided when it comes to measuring their own personal economic progress over the past decade. Some 42% say they are less financially secure, while 44% say they are more secure and 12% say there has been no change.

Asked about the impact of the Great Recession, which lasted from December 2007 to June 2009, 42% of middle-class respondents say they still have not recovered financially, while nearly a third (32%) say they are in better shape now, and 23% are doing no better or worse than before the downturn.

Asked about their experiences in the past year, about six-in-ten report they have had to cut back household spending in the past 12 months because money was tight. Roughly three-in-ten in the middle class say they had trouble paying their bills, and 12% say they lost their jobs.

The remainder of this chapter offers more detail on these and related findings. The first sections examine how middle-class Americans say they have fared financially over the past 10 years, including how well they have bounced back from the Great Recession. The next section examines how Americans have fared in the past year. The final section describes how people in the middle class judge their current financial circumstances as well as their family life, education and housing situations.

Financial Security and Social Class

The middle class divides nearly equally when asked if they are more secure financially now than a decade ago. Four-in-ten (42%) say they are less secure now than 10 years ago, while about as many (44%) say they are more sheltered from economic shocks.

In terms of their financial security, different demographic groups within the middle class say they have headed in opposite directions in the past decade. Majorities of blacks and those under the age of 50 say they are more secure now. In contrast, older adults are more likely to say their sense of economic well-being has worsened over the past 10 years. Democrats are more likely to say they are more secure than independents (50% vs. 39%). About four-in-ten Republicans (42%) also feel more protected now.

According to the Pew Research survey, middle-class blacks say that they are more financially secure now than they were a decade ago. Nearly six-in-ten (58%) say they are more secure today while about a third say they are less secure.

In contrast, the experience of middle-class whites and Hispanics is more mixed. About four-in-ten whites (43%) say they are more secure—and 41% feel more vulnerable today. A similar share of Hispanics (45%) say they are more secure, while nearly half (48%) say they are less protected.

About half of all middle-class adults ages 50 and older say they feel less financially protected today than a decade ago. In contrast, nearly six-in-ten younger adults say they are more secure now than they were. 9

Members of the middle class who are near or approaching retirement age are particularly downbeat: About half of those ages 50 to 64 (52%) say they are less economically secure now than 10 years ago, while 35% feel more insulated from financial shocks. These sour views are consistent with other research. As earlier Pew Center reports have documented, these “gloomy boomers” were among the demographic groups hit hardest by the recession and housing market collapse.

Education offers little or no protection from economic reversals, the survey suggests. About half of middle-class college graduates (48%) and 43% of those with less formal education say that they are more financially secure than they were 10 years ago.

Democrats are more likely than political independents to say they are more financially protected now than they were 10 years ago. (50% of Democrats vs. 39% of independents). About four-in-ten Republicans (42%) say the same.

Harder to Get Ahead

Seven-in-ten middle-class adults (71%) say it is harder to get ahead now than it was 10 years ago, an increase of nine percentage points since this question was asked in a 2008 Pew Research survey.10

Substantial majorities of every core demographic group in the middle class say it is harder to get ahead today than it was a decade ago. But some notable differences between groups do emerge. Whites, older adults and Republicans are more likely than non-whites, those younger than 50 and Democrats to say that it is more difficult to advance.

The racial pattern seen in other questions appears again here. Three-quarters of all middle class whites (75%) say it is more difficult now to move forward. In contrast, about six-in-ten blacks (61%) and Hispanics (62%) believe advancement is harder.

Also, older middle-class adults are more negative than the younger generations. Nearly eight-in-ten (78%) of those 50 years old and older say it is more difficult to get ahead, compared with 65% of younger middle-class adults.

Views on advancement are strongly correlated with political partisanship. About eight-in-ten Republicans (79%) but fewer than two-thirds of Democrats (64%) say it’s tougher now to make progress in life than it was a decade ago. Independents fall between the two partisan camps: 73% of all unaligned adults say it is more difficult to move forward.

But differences are either small or non-existent between other key demographic groups. Virtually identical proportions of men (72%) and women (70%) say it is harder to get ahead. And college graduates are about as likely as those with a high school education or less to believe that there are more roadblocks to advancement now than 10 years ago (67% vs. 72%).

In the Wake of the Great Recession

The Great Recession lasted 18 months. But three years after the downturn officially ended, about four-in-ten (42%) middle-class adults say they are worse off financially today than when the recession began in December 2007. An additional 23% say they are doing about as well as they were before the downturn. About a third report they are at least a little better off.

The perceived pace of recovery varies among demographic groups. Men, whites, Republicans, and middle-aged and older adults are more likely than women, non-whites, Democrats and younger adults to say they have not yet recovered from the recession.

About half of all middle-class men (47%) say they are not yet back financially to where they were before the recession. By comparison, about four-in-ten (39%) women say they are worse off now.

Middle-class blacks and Hispanics are significantly more likely than whites to say they are doing better financially now than before the slowdown. About half of blacks (49%) and 43% of Hispanics say they are doing better, compared with only 28% of whites. In addition, a plurality of whites (45%) say they are doing worse, compared with 28% of blacks and 39% of Hispanics.

Adults younger than 50 are twice as likely as those 50 and older to say they are doing better (43% vs. 20%). But this generation gap narrows when the focus shifts to those who say they are doing worse. Nearly four-in-ten middle-class adults ages 30 to 49 (37%) say they are not doing as well as they were before the recession, compared with 47% of those 50 to 64 years old.

Republicans and political independents say they have been the slowest to recover: About half (51%) of all middle-class Republicans say they have not fully made up their recession-era losses, and nearly as many independents say the same thing (46%).

In contrast, four-in-ten Democrats (40%) say they now stand on higher ground financially than they did before the downturn. About a third (35%) are still not fully recovered, while 23% say they now are in the same shape financially as they were before the recession.

Among those in the middle class who say they haven’t yet recovered, about three-in-ten (29%) say it will take four years or less for them to get back to where they were before the recession. An additional 24% expect it will take five to nine years, while 19% say 10 years or more. Eight percent say they expect to never fully recover from the Great Recession, and an additional 20% say they are unsure or do not know how long it will take.

Differences by Social Class

As noted at the beginning of this chapter, Americans in the upper, middle and lower classes agree that maintaining a middle-class lifestyle is more difficult today than 10 years ago. But on other key economic questions, predictable differences emerge among the social classes, with the upper class faring better and those in the lower class faring worse.

For example, even after the Great Recession, the stock market meltdown and the collapse of the housing market, a majority of upper-class adults say they are more financially secure now than they were a decade ago (62%). In contrast, 63% of lower-class adults say they are less financially secure now. The middle class, true to its name, straddles the middle—44% say they are more secure, while 42% say they are less secure.

Similarly, those in the lower class say they were hit the hardest by the Great Recession. About six-in-ten (58%) say they are not yet back to where they were financially before the recession began. Among upper-class Americans, only about a third (34%) say they are worse off while 42% report that they are in better financial shape now.

Belief in the American Dream Shaken but Still Standing

The “lost decade” has shaken but not shattered the public’s belief that anyone can get ahead with hard work and determination.

More than six-in-ten adults (63%), including 67% of the middle class, agree that “most people can get ahead if they are willing to work hard,” while about a third (34%) believe that “hard work and determination are no guarantee of success.”

However, substantial differences by social class exist. Among those in the lower class, only about half say hard work and determination bring success, while roughly as many (45%) disagree. Many more in the upper class (71%) and middle class (67%) express confidence that persistence and effort eventually pay off.

This question has been asked 10 times in Pew Research surveys since 1994, when 68% agreed that hard work would bring success. The percentage peaked in 1999 when about three-quarters (74%) offered the affirmative view.

The next 10 years were marked by an erratic but generally downward drift in this measure, which bottomed out in December 2011, when 58% agreed that hard work would be rewarded and 40% disagreed. While the current five-point uptick since the December survey is a statistically significant increase in positive responses, it is too soon to tell whether this marks the beginning of an upward trend.

Experiences Over the Past Year

Though the Great Recession officially ended in June 2009, the middle class has still experienced economic hardships over the past year. About six-in-ten middle-class adults (62%) say they had to cut back household spending in the past year because money was tight. Three-in-ten (29%) had trouble paying their bills. Just under two-in-ten had trouble getting or paying for medical care for themselves or someone in their family (18%), and a similar share had trouble paying their rent or mortgage (16%). And fully 12% have been laid off or lost their job in the past year.

In a January 2008 Pew Research survey, a smaller share of the middle class said they had cut back spending during the previous year. Fully 53% said they had to cut back spending in the year preceding January 2008, while in the current survey, 62% said so about the year preceding July 2012. However, on other measures of economic stress tested in this battery of questions—inability to pay for medical care; job loss; trouble paying for housing—the share of middle-class respondents reporting problems has not risen significantly over the past four years. 11

Middle-Class Experiences Over the Past Year

The number of negative economic experiences over the past year varies among different subgroups in the middle class.

Middle-class adults younger than 65 are more likely than those ages 65 and older to have experienced two or more of these economic hardships in the past year. In contrast, those 65 and older are less likely than all younger age groups to say they didn’t experience any of these things.

Hispanics (51%) in the middle class are more likely than whites (32%) to say they have experienced two or more economic struggles. The black share (43%) falls in between the shares of whites and Hispanics.

Middle-class individuals with only some college (47%) or who had a high school diploma or less (39%) were more likely than those with a bachelor’s degree or more (26%) to say that they experienced two or more of the economic hardships.

Homeownership is also correlated with the number of negative economic experiences one had over the past year. Homeowners (30%) are less likely than renters (51%) to have encountered two or more of these hardships. In the measure that relates directly to housing—difficulty paying rent or mortgage over the past year—renters are almost three times as likely as homeowners to say this was a problem (29% vs. 10%).

These negative economic experiences are correlated with the happiness and stress level of the middle class. Those who reported two or more economic problems in the past year are less likely to say they are “very happy” these days (21%) than those who had only one economic problem (34%) or no economic problems (43%).

And the number of economic problems is also related to the level of stress in one’s daily life. Those who had no economic problems in the past year are the least likely to say they experience stress frequently in their daily lives (22%). Those who experienced two or more economic hardships are the most likely to be frequently stressed (53%).

Experiences of the Lower, Middle and Upper Classes

Not surprisingly, there are large differences in each of these economic hardships across the three class groups, with the upper class significantly less likely than the middle class to have experienced them over the past year and the lower class being significantly more likely.

Among the largest differences between the upper and middle classes is the share that had to cut back household spending over the past year because money was tight: 62% of middle-class adults had to do so, compared with only 41% of upper-class adults (a difference of 21 percentage points). Fully 84% of the lower class had to do this.

Overall, the gaps in experiences between the middle and the lower class are larger than the gaps between the upper and the middle class. Among the largest gaps between the lower and the middle class is the share that had trouble paying bills over the past year. Nearly two-thirds of the lower class (64%) experienced this problem, while only about three-in-ten (29%) of the middle class and 13% of the upper class say the same.

While 45% of lower-class adults had trouble getting medical care for themselves or their family, only 18% of middle-class adults and 11% of upper-class adults say the same. The shares that had trouble paying rent or mortgage follow a similar pattern: 45% of the lower class experienced this problem, compared with a much lower share of the middle class (16%) or the upper class (7%).

One-quarter of those who say they are in the lower class (25%) say they have been laid off or lost their job over the past year. This compares with only 12% of the middle class and 7% of the upper class.

Another way of looking at these items is by compiling the number of bad economic experiences over the past year into an index. One-third of middle-class adults (33%) didn’t have any of these economic problems in the past year, compared with about half of upper-class adults (54%) and 11% of lower-class adults.

Among the middle class, three-in-ten (30%) report exactly one negative economic experience in the past year, about a quarter (27%) say they experienced two or three, and one-in-ten (10%) experienced four or more.

Among the upper class, the share that experienced just one of these economic hardships (28%) is about equal to that of the middle class, but the shares that experienced two or three of them (14%) or four or more (3%) are significantly lower than the middle class.

Among the lower class, the story is reversed. The share of the lower class that says they experienced only one of these economic hardships (15%) is smaller than either the middle or the upper class. But the shares who experienced two or three (40%) or four or more (34%) are significantly larger.

How Satisfied Is the Middle Class?

Given the struggles many have faced over the past year, it may not come as a surprise that a relatively low share of middle-class adults are satisfied with their personal financial situation. Only about one-third of people in the middle class (32%) say they are “very satisfied” with their personal financial situation, 40% say they are “somewhat satisfied,” and about one-quarter say they are “very” (10%) or “somewhat” (16%) dissatisfied. In other aspects of their lives, however, the middle class is much more upbeat.

For example, roughly three-quarters (78%) say they are very satisfied with their family life, 16% say they are somewhat satisfied, and only 5% say they are either very or somewhat dissatisfied with their family life.

Two-thirds of middle-class adults (67%) are very satisfied with their present housing situation. An additional 23% say they are somewhat satisfied, and about one-in-ten (9%) say they are either very or somewhat dissatisfied with their home.

When it comes to their education, six-in-ten people in the middle class (61%) are very satisfied, three-in-ten (28%) are somewhat satisfied, and only 9% are very or somewhat dissatisfied with their education

The three social classes follow a clear pattern in their overall satisfaction across all these measures, with the upper class rating their satisfaction the highest, followed by the middle and then the lower class. This is true of the share saying they are very satisfied with their family life, present housing situation and education. The largest gaps among the three classes occur in satisfaction with their personal financial situations.

Half of those in the upper class (49%) say they are “very satisfied” with their personal financial situation, compared with only one-third of those in the middle class (32%). The lower class falls well behind the middle class, with only 13% saying they are very satisfied with their finances.

Who’s Satisfied in the Middle Class?

When it comes to family life, every major demographic group within the middle class has high levels of satisfaction. Overall, 78% of the middle-class adults are “very satisfied” with their family life. Satisfaction is not significantly different between men and women or among whites, blacks and Hispanics. However, there are some groups who rate their satisfaction with family life higher than others.

Middle-class adults in the prime ages for marriage and childbirth are happier than both younger and older adults. Those ages 25 to 34 (86%) and ages 35 to 49 (83%) are significantly more likely to say they are very satisfied with their family life than are adults ages 18 to 24 (69%) and adults ages 50 and older (74%).

Along these same lines, married people in the middle class are more likely than unmarried people to be very satisfied with their family life (84% vs. 69%), and people with children younger than 18 are more likely to be very satisfied than those who don’t have young children (84% vs. 75%).

Among married people in the middle class, there is no difference in terms of family satisfaction between families in which one spouse in employed (85%) and those in which both spouses are employed (86%).

But among parents with young children, marital status appears to play a key role in one’s satisfaction with family life. Almost all married parents with young children (91%) are very satisfied with their family lives, compared with only 68% of unmarried parents with young children.

Satisfaction with Housing

When asked about satisfaction with their present housing situation, two-thirds of the middle class (67%) say they are very satisfied.

Responses to this question vary significantly by whether one is a homeowner or renter. About three-quarters of those who own their home (77%) are “very satisfied” with their present housing situation, compared with just 46% of renters.

Also, adults younger than 35 are less satisfied than older adults with their present housing situation. Only about six-in-ten adults ages 18 to 34 (58%) are very satisfied with their housing situation, compared with 70% of adults ages 35 and older.

Whites in the middle class (72%) are more likely than blacks (61%) or Hispanics (49%) to be very satisfied with their current housing situation.

Those who live in rural areas (82%) are more likely than those in suburban (66%) or urban (62%) areas to be very satisfied with their housing situation.

Marital status is also related to home satisfaction. A greater share of those who are married (74%) than those who are unmarried (59%) are very satisfied. But there are no significant differences between those with young children (63%) and those without children (69%).

The different levels of housing satisfaction across many of these groups appear to be related to their levels of homeownership, as owning one’s home was among the strongest indicators of satisfaction. For example, roughly seven-in-ten whites in the middle class (73%) are homeowners, compared with only 49% of blacks and 39% of Hispanics. And the homeownership rate among married people (86%) is about double the rate among unmarried people (41%).

But homeownership rates are not the only factor at play. Even though middle-class people in rural areas are more satisfied than those in suburban areas, their homeownership rates are roughly equal (74% of people in rural areas and 70% of those in suburban areas are homeowners). And those in the suburbs and urban areas have equal levels of satisfaction, even though urbanites have a lower homeownership rate (55%). Furthermore, the difference in homeownership rates among those who have children (76%) and those who do not (36%) does not result in differing levels of satisfaction in one’s present housing situation.

Satisfaction with Education

Overall, 61% of middle-class adults are “very satisfied” with their education, including 85% of those with at least a bachelor’s degree. This compares with about half (54%) of those with some college or a two-year associate degree and48% of those with a high school diploma or less.

There are few to no differences in satisfaction with education in the middle class based on gender, age or marital status. But in terms of race, whites (63%) are more likely to be very satisfied with their education than Hispanics (51%). This is not surprising, given that middle-class whites (34%) are almost three times as likely as middle-class Hispanics (12%) to have a college education.

Satisfaction with Finances

Satisfaction with one’s personal financial situation ranks the lowest among the four measures. Only 32% of the middle class is “very satisfied” with their finances.

There are very few demographic differences in satisfaction with personal financial situation among the middle class.

Only one major demographic—homeownership—is related to satisfaction with finances. Among homeowners, 36% say they are very satisfied with their personal financial situation, compared with 25% of renters.

Satisfaction with finances is more concretely tied to evaluations of one’s financial growth over time.

Among those in the middle class who feel their personal financial situation is more secure or about the same as it was 10 years ago, 44% now say they are “very satisfied” with their personal financial situation. Among those who feel less secure than 10 years ago, only 17% are very satisfied with their finances today.

Chapter 4: Middle-Class Mobility

A majority of middle-class adults say they have a better standard of living now than their parents had at the same stage of life, and a plurality say they expect their own children’s standard of living to eventually surpass their own. However, a somewhat smaller share holds these views now than in early 2008, when the national economy went into a tailspin from which it hasn’t fully recovered.

Middle-class adults also mark their long-term economic progress not just by comparing their own lifestyles with that of their parents, but by comparing the socio-economic class they place themselves in now with the class they placed themselves in when they were growing up. On this measure, too, the survey findings are broadly upbeat. Many more say they grew up in the lower-middle or lower class (40%) than say they grew up in the upper-middle or upper class (16%); 44% say they grew up in the middle class.

Among middle-class adults, there are notable differences by race, age and partisanship in these judgments about long-term economic mobility.

Middle-class blacks and Hispanics stand out from whites in their sense of progress compared with the standard of living of their parents and in their optimism for the future.

But some of the groups that have lost the most ground relative to their upbringing are also strikingly optimistic about the future. For example, younger adults (ages 18 to 29) are more likely than older adults (especially those ages 65 and older) to have moved down the social class ladder, but they are also more optimistic about their children’s ability to surpass their own standard of living down the road. In addition, younger adults are more optimistic than older adults of traditional working age (ages 30 to 64) about their future standard of living.

Party identification is also related to optimism about the future. Middle-class Democrats are more optimistic about their children’s future standard of living than are Republicans. And middle-class Democrats still within traditional working years (ages 18 to 64) are more upbeat than their Republican counterparts that their own standard of living will surpass that of their parents.

Still Upbeat About the Long Run, but Less So than in 2008

Six-in-ten of middle-class adults consider their current standard of living to be better than that of their parents at the same stage in life, 24% say it is the same and 13% say their standard of living is worse than that of their parents at the same stage in life.

Compared with 2008, however, fewer middle-class adults today consider their standard of living to have improved relative to their parents’ generation. In 2008, fully two-thirds (67%) of those in the middle class saw themselves as having a better standard of living than their parents did at the same stage in life.

Middle-class blacks and Hispanics are more likely than middle-class whites to see their own standard of living as better than that of their parents at the same point in life. Half of middle-class blacks (50%) consider their standard of living to be “much better” than that of their parents, and 18% say it is somewhat better. Similarly, 48% of middle-class Hispanics consider their standard of living to be “much better” than their parents was at the same age, and 22% say it is somewhat better. Among whites, a third (33%) say their standard of living is much better than their parents’, and 24% say it is somewhat better.

Middle-class adults with a high school diploma or less are more upbeat than college graduates about their standard of living relative to that their parents held. Fully 64% of those with a high school diploma or less see themselves as better off than their parents were at this point in life, compared with 55% of college graduates and 58% of those with some college education.

Middle-class urbanites are also positive overall about their standard of living relative to that of their upbringing. Two-thirds of the urban middle class (67%) say they are better off now than their parents were at the same age. This compares with 58% among those in the suburbs and about half of those in more rural areas (52%) who say their standard of living is better than that of their parents at that age.

There are no substantial differences between middle-class men and women, or younger and older adults on this measure. Democrats are somewhat more likely than Republicans to see themselves as better off than their parents were at the same age.

Upward and Downward Mobility Over the Life Course

Among middle-class adults, 44% see themselves as having stayed in the middle class over time, four-in-ten (40%) see themselves as having moved up (from lower class to middle class), and 16% see themselves as having moved down (from upper class to middle class) compared with their childhood upbringing.

Middle-class adults under age 30 are especially likely to see themselves as downwardly mobile in comparison to their upbringing. A quarter (25%) of middle-class adults ages 18 to 29 see themselves as downwardly mobile, as do 18% of those ages 30 to 49 years; by comparison, 14% of those ages 50 to 64 and 8% of those ages 65 and older see themselves as downwardly mobile. The age differences are greatest between the oldest (ages 65 and older) and youngest (ages 18 to 29) middle-class adults. More than four-in-ten of those ages 65 and older (44%) say they have moved up the class ladder, compared with about three-in-ten (31%) of those ages 18 to 29 years.

About two-in-ten middle-class adults with at least some college education (21%) or a college degree (21%) see themselves as downwardly mobile compared with their upbringing. By comparison, just one-in-ten (9%) of middle-class adults with a high school diploma or less see themselves as downwardly mobile, and half (50%) see themselves as having stayed in the middle class.

Middle-class whites, blacks and Hispanics are about equally likely to see themselves as upwardly or downwardly mobile compared with their childhood.

Perceptions of social mobility are about the same between middle-class men and women, partisan groups, and neighborhood types.

Where Am I Headed?

Among those in the middle class who have not yet reached traditional retirement age (ages 18 to 64 years), about seven-in-ten (71%) think they will have a better standard of living relative to their parents’ peak financial years, while 17% think they will fare worse than their parents and just 7% expect to fare about the same as their parents.

Younger middle-class adults (age 18 to 29) are more optimistic about surpassing their parents’ standard of living than are older adults. Fully eight-in-ten (83%) of those ages 18 to 29 expect they will have a better standard of living than their parents had in their peak financial years, compared with 71% among middle-class adults ages 30 to 49 and 62% among those ages 50 to 64 years.

Middle-class blacks and Hispanics who have not yet reached retirement age are more optimistic than whites that they will surpass the standard of living of their parents’ peak financial years; a majority of all three groups expect to have a better standard of living than their parents, however.

Expectations tend to vary by party identification. Democrats are largely optimistic about their future standard of living compared with their parents (81%); just 13% say it will be worse. Middle-class Republicans are less optimistic; 55% think their own standard of living will be better than that of their parents’ peak financial years, while three-in-ten think it will be worse (30%).

About eight-in-ten of the urban middle class (79%) think they will have a better standard of living than that of their parents’ peak financial years; 68% of suburban middle-class adults and 64% of rural middle-class adults say the same.

There is no difference in expectations between middle-class men and women ages 18 to 64 on this measure. Similarly, there are no substantial differences in expectations among middle-class adults ages 18 to 64 by education.

Gauging the Prospects for One’s Children

When it comes to the future, a plurality of middle-class adults think their children’s standard of living will be better than their own. Fully 43% think their children’s standard of living at the same stage of adult life will be better than their own, 21% think it will be about the same and 26% think their children will be worse off compared with their own standard of living.

While more middle-class adults are optimistic than pessimistic about their children’s future standard of living, that rosy glow is a little less pink today than it was in 2008, near the start of the recession. In 2008, half (51%) of middle-class adults expected their children to have a better standard of living (down 8 points to 43% today), 19% expected their children’s standard of living to be worse than their own (up 7 points to 26% today) and about two-in-ten (21%) thought it would be about the same.

Hispanics and blacks are more optimistic than are middle-class whites about their children’s standard of living. About seven-in-ten middle-class Hispanics (69%) think their children’s standard of living will be better than their own at the same age, 12% think it will be worse and about one-in-ten (11%) think it will be about the same as theirs is now. Among middle-class blacks, two-thirds (66%) expect their children’s standard of living will outpace their own, 13% think it will be worse and about one-in-ten (11%) think it will be about the same as their own. By contrast, a third of middle-class whites (34%) expect their children’s standard of living will exceed their own, a nearly equal share (31%) think their children’s standard of living will be worse than theirs, and 24% think it will be about the same.

Middle-class adults under age 50 are more optimistic about their children’s future standard of living than are their older counterparts in the middle class. For example, among those ages 18 to 29, half (50%) think their children’s standard of living will exceed their own at the same point in life. Among those ages 65 and older, about a third (34%) say the same.

There is a tendency for middle-class adults with less education to be more optimistic about their children’s future than others in the middle class. Fully 47% of those with a high school diploma or less think their children’s standard of living will surpass their own; 37% of college graduates say the same.

Middle-class Democrats are more upbeat about the next generation’s standard of living than are Republicans; 54% of Democrats compared with 31% of Republicans think their children’s standard of living will exceed their own. Independents fall in between, with 41% expecting their children’s standard of living will surpass their own.

Middle-class urban dwellers are more upbeat about the financial future of their children than are those in the suburbs or rural areas. Half (50%) of middle-class urbanites think their children’s standard of living will be better than their own, compared with four-in-ten (40%) among the suburban middle class and 36% among the rural middle class.

Middle-class men tend to be more pessimistic than middle-class women about their children’s future standard of living. Three-in-ten middle-class men (31%) expect their children’s standard of living will be worse than theirs; 22% of middle-class women say this.

Costing Out a Middle-class Lifestyle

The survey also asked how much annual income a family of four would need to lead a middle-class lifestyle. The median response among those who consider themselves middle class is $70,000, meaning that half of middle-class adults say it would take more than $70,000 annually and half say it would take less than that amount.

Public estimates of how much money it takes for a family of four to live a middle-class lifestyle are quite close to the Pew Research Center’s analysis based on U.S. Census Bureau data that the median income for a four-person household is $68,274.12

As expected from the varying cost of living across the country, the annual family income seen as necessary for a middle-class lifestyle is a median of $85,000 in the East and $60,000 in the Midwest (with a median of $70,000 in both the South and the West). Similarly, the median among middle-class adults living in rural areas is $55,000; among suburban and urban dwellers it is $75,000 and $70,000, respectively.

Perceptions of income needs for a middle-class lifestyle vary with race and ethnicity. Among middle-class Hispanics, the median annual income needed for a middle-class lifestyle is $50,000, compared with $70,000 among middle-class whites and $75,000 among middle-class blacks.

Older adults in the middle class (ages 65 and older) have a lower income threshold for leading a middle-class lifestyle.

Education is also related to perceptions of income needs for a middle-class lifestyle; those who have more formal education tend to see higher annual incomes as necessary for a middle-class lifestyle compared with those who have less formal education.

As expected, one’s current annual income tends to be related to perceptions of the necessary annual income for a middle-class lifestyle.

Chapter 5: Middle-class Politics

A somewhat larger share of middle-class adults believe that the policies of President Obama will help the middle class than say the same about the policies of Republican hopeful Mitt Romney, according to the Pew Research survey.

The survey also finds a much wider gap in perceptions about which party favors the rich—62% of middle-class adults say Republicans do, while just 16% say Democrats do. But neither party is seen as being the champion of the middle class. Slightly more than one-third of middle-class adults (37%) believe Democrats primarily favor their interests, while a smaller share (26%) says the same about the GOP.

The survey of 2,508 adults, including 1,287 who described themselves as members of the middle class, was conducted in late July. Interviewing for the survey ended nearly three weeks before Romney selected Rep. Paul Ryan of Wisconsin to be his running mate and a month before the GOP convention was to convene in Tampa.

According to the survey, about half (52%) of middle-class adults say the president’s policies would help middle-class Americans if he is elected to a second term in November. When asked about Romney’s policies, a somewhat smaller share (42%) says his policies would help the middle class.

Attitudes toward Obama and Romney among the upper and lower classes are similar to those of middle-class adults. About half of those in the upper class (52%) and a similar proportion of those in the lower class (49%) say Obama’s policies would benefit the middle class. Similar shares of the upper (46%) and middle class (42%) believe Romney’s politics would help middle-class Americans, while a smaller share of the lower class (34%) holds this view.

Attitudes on the two presidential contenders diverge when the middle class is asked to evaluate whether Obama and Romney’s programs would help the wealthy or the poor. Fully 71% of the middle class say Romney’s policies would benefit the rich, while 38% offered the same view of Obama’s programs. At the same time, six-in-ten middle-class adults (62%) say the president’s policies would help the poor, while only a third (33%) say the same about Romney’s policies.

Perceptions of the Parties

Judgments about Romney and Obama mirror the views of middle-class Americans toward the Republican and Democratic parties.

According to the survey, only about a quarter to a third of the middle class says that the Republicans (26%) or Democrats (37%) primarily favor middle-class interests over those of the rich or poor. Republicans are perceived as the party of the rich, while the middle class is divided over whether the Democratic Party is more concerned about their needs or those of the poor.

To examine the intersection of social class and politics, the Pew Research survey asked respondents if each of the two major political parties “favors the rich, favors the middle class or favors the poor.”

Overall, the middle class was somewhat more likely to say that the Democratic Party rather than the GOP favored its interests (37% vs. 26%). 13 But about as many say the Democrats favor the poor (34%), and 16% believe the party favors the rich.

At the same time about six-in-ten middle-class adults (62%) say the GOP favors the rich—

roughly double the 26% who say the Republican Party primarily favors middle-class Americans.

The survey also found that the middle class is politically diverse: Roughly equal shares of middle-class adults identify with the Democratic Party (34%) or say they are independents (35%), while somewhat fewer align with the Republican Party (25%). As a group, middle-class adults are more likely to identify themselves as political conservatives (39%) than liberals (22%). About a third (35%) say they are moderates.

On other political issues, the survey found that a majority of middle-class adults (55%) have no opinion when asked if they disagree or agree with the Tea Party movement. Only 15% agree with its objectives, while nearly twice as many disagree (27%).

The remainder of this chapter examines these findings in more detail. The first section examines which political party is seen by core demographic groups in the middle class as favoring the rich, the poor and the middle class. The second section analyzes middle-class perceptions of the Tea Party movement. The final section examines the demographic characteristics of middle-class adults who identify with the Republican and Democratic parties.

Viewing the Parties through a Partisan Lens

The increasingly polarized political landscape is vividly reflected in how Republicans and Democrats view the two parties. Members of the middle class who identify themselves as Republicans are more likely than Democrats to see the GOP as the party of the middle class and the Democrats as the party of the poor.

In contrast, Democrats are much more likely to see their party representing the interests of the middle class and the GOP as the party of the rich.

For example, more than nine-in-ten Democrats (94%) see the GOP as the party of the rich—roughly four times the proportion of Republicans who express that view (22%). In contrast, a plurality of all Republicans (49%) say that the Democratic Party favors the poor, a view shared by 26% of Democrats.

On the rich-poor divide, the views of political independents more closely align with Democrats on some issues but with Republicans on others. A majority of independents (63%) agree with the Democrats that the GOP is the party of the rich. Independents also are about as likely as Democrats to say the Democratic Party favors the poor (32% vs. 26%). But unlike a majority of Democrats, only 30% of middle-class independents say the Democratic Party favors the middle class.

The Partisan Fight for the Middle Class

Middle-class Republicans and Democrats both say their party favors the middle class. Six-in-ten Republicans (59%) say their party represents the middle class, but only 3% of Democrats agree. In contrast, about six-in-ten Democrats say their party favors the middle class—roughly five times the proportion of Republicans who say this (64% vs. 13%).

Most political independents reject both partisan claims. Only 30% of independents say the Democratic Party favors the middle class. At the same time, about a quarter (23%) say Republicans are more aligned with the middle class than with the rich or poor.

Political ideology also is strongly correlated with views of the two parties. Middle-class conservatives divide equally: 42% say the GOP favors the rich, while an identical proportion say the party favors the middle class.

In contrast, about eight-in-ten liberals (82%) say Republicans are the party of the wealthy, but only 8% say the GOP champions the middle class. Views of moderates fall between those of conservatives and liberals: fully 72% say the GOP represents the interests of the rich, while 20% say its primary focus is the middle class.

When the lens shifts to the Democratic Party, the views of conservatives and liberals move in predictable directions. About half of liberals (55%), and 25% of conservatives, say the Democrats favor the middle class. The views of moderates again fall between those of liberals and conservatives: 42% say the Democratic Party favors the middle class.

Other demographic groups differ in their perceptions of the two parties, though in most instances these differences reflect the different partisan makeup of the groups. 14 Among the more significant differences:

Race: Middle-class whites are significantly less likely than minorities to see the Republican Party as favoring the wealthy. Roughly nine-in-ten blacks (87%) and 69% of Hispanics say the GOP generally supports the rich, a view shared by 56% of all whites. When the focus shifts to the Democratic Party, middle-class whites and Hispanics also are more likely than blacks to say the Democrats favors the wealthy (18% and 19%, respectively, vs. 7%).

Blacks and Hispanics are significantly more likely than whites to see the Democratic Party as the party of the middle class. About half of all blacks (49%) and 44% of Hispanics say the Democrats favor the middle class, compared with 33% of whites. That pattern reverses when respondents are asked about the Republican Party: Whites (31%) are more likely than blacks (7%) or Hispanics (14%) to say Republicans favor the middle class.

Middle-class Hispanics are significantly less likely than whites to say the Democrats represent the interests of the poor (22% vs. 38% for whites and 31% for blacks). The Republican Party is viewed as favoring the poor by a slightly larger share of Hispanics (7%) than whites (2%) or blacks (1%).

Age: About two-thirds (68%) of middle-class adults younger than 50 years old believe the Republicans are the party of the rich, a view shared by 55% of those 50 and older. Younger adults also are more likely than those 50 and older to say that the Democratic Party favors the middle class (42% vs. 32%).

Gender: Roughly equal proportions of men (58%) and women (64%) say the Republican Party favors the rich. The Democratic Party is more likely to be seen as the party of the rich by men (20%) than by women (14%). There are no statistically significant differences in the views of men and women on their views of which party favors the middle class.

Education: Two-thirds of college graduates (66%) and 58% of adults with a high school degree or less say the Republicans favor the wealthy class. When respondents are asked about the Democratic Party, a quarter (25%) of less well-educated respondents say the Democrats, favor the rich compared with just 10% of college graduates.

The Tea Party

Most middle-class Americans have no fixed view of the Tea Party, the anti-tax, anti-government grassroots political movement that rose to prominence after the 2008 elections. When asked in the survey whether they agreed, disagreed or had no opinion of the Tea Party, a majority (55%) expresses no firm view.

Even though the Tea Party has played a crucial role in the Republican presidential primaries and other high-profile contests in recent years, about six-in-ten Republicans (57%) say they have no opinion, as do 48% of Democrats.

It’s not that Americans are unaware of the Tea Party movement. Only 2% of those surveyed say they have not heard about the Tea Party.

Among the 42% of the middle class who offer a judgment of the Tea Party movement, attitudes tilt negative. About a quarter (27%) say they disagree with the Tea Party, while 15% agree with it.

Unsurprisingly, Republicans and political conservatives are the most positive toward the Tea Party, while Democrats and liberals are the most negative. About a third (32%) of Republicans say they agree with the Tea Party, compared with only 3% of Democrats.

Among conservatives, about a quarter (25%) support the Tea Party, compared with 11% of all moderates and 5% of liberals. In contrast, 45% of liberals and 35% of moderates disagree with the Tea Party.

Registered voters are more likely than those who are not registered to have an opinion of the Tea Party. Among registered voters with views of the movement, 18% agree and 30% disagree. Only 4% of those not registered to vote agree with the Tea Party and 17% disagree.

Party and Ideology

While both parties present themselves as champions of the middle class, neither has closed the deal with a majority of the middle class itself.

Only about a third of all middle-class adults identify with the Democratic Party (34%), while a smaller share are Republicans (25%). About a third (35%) say they are independents. These breakdowns are virtually identical to the partisan divisions among all adults.

Among the middle class, whites are more likely than minorities to identify with the Republican Party. A third of whites (33%) but only 9% of Hispanics and 1% of blacks say they are Republicans.

Minorities and particularly blacks remain among the Democratic Party’s most loyal constituencies. Fully two-thirds of all blacks (66%) and 41% of Hispanics identify themselves as Democrats, compared with 27% of whites.

Men in the middle class are more likely than women to identify themselves as political independents (41% vs. 29%). At the same time, women are more likely to be Democrats (40% vs. 28%). About a quarter of men and women say they are Republicans.

About four-in-ten Hispanics and adults younger than 30 (42% for both) say they are political independents, compared with 28% of blacks and 26% of those ages 65 and older.

As a group, the middle class is more likely to identify themselves as conservatives (39%) than to say they are liberals (22%). An additional 35% identify themselves as moderates.

Republicans are more likely to be conservative (71%) than Democrats (25%) or independents (33%). In contrast, Democrats are more likely to be liberal (35%) than Republicans (7%) or independents (20%).

A larger share of moderates are independents or Democrats than identify with the Republican Party. About four-in-ten moderates (42%) are independents, and about the same share are Democrats (37%). In contrast, less than half those proportions are Republican (16%).

Chapter 6: Census Trends for Income and Demography

This chapter uses trend data from the U.S. Census Bureau to analyze changes during the modern era in the incomes of Americans at all levels of the economic spectrum. In the half century following World War II, American families could always count on rising prosperity. Each decade ended with family incomes higher than what they were at the start. That is no longer the case. Years of slow growth punctuated by two recessions left American families with lesser incomes and less wealth in 2010 than in 2000.

This “lost decade”15 is unique in the modern era. It is the only decade in which real incomes fell for all families combined as well as for families in every economic stratum examined. The mean income of families overall decreased at an average annual rate of 0.6% in the “lost decade” (after adjusting for inflation).16 The mean income of families in the lowest income quintile fell at a rate of 1.7% annually, and the income of families in the top 5% decreased at a rate of 1.1% annually. The decline was less steep for families in the middle. For all families, the “lost decade” did more than merely fail to deliver gains; it also erased some of the gains from the previous decade.

Based on income growth, the 1950s and the 1960s were the most beneficial decades for American families in post-WWII times. The mean income for families overall increased at an average annual rate of 2.9% from 1950 to 1960. Growth was widespread across the economic spectrum. The mean income of families in the lowest income quintile increased at an annual rate of 3.7%, and the mean income of families in the top 5% increased at an annual rate of 2.2%. Incomes of other families increased at rates in between.

Income growth accelerated in the 1960s, ranging from an annual rate of 4.9% for families in the lowest income quintile to 3.2% for the top 5% of families. Two recessions each in the 1970s and the 1980s slowed the growth in family income but did not bring it to a halt. For all families combined, mean income increased at an annual rate of 0.9% in the 1970s and 1.4% in the 1980s. The one exception to general growth was in the 1980s, with families in the lowest income quintile experiencing a drop in their income at an average annual rate of 0.1%.

The 1990s began with a recession but then delivered the longest economic expansion in modern U.S. economic history. Thus, income growth sped up again for families in all strata to an overall average annual pace of 1.9%. However, the income trends before and after 1980 had one significant difference: Unlike previous decades, income growth in the 1980s and 1990s favored the higher income brackets, and economic inequality in the U.S. rose as a consequence.

Changes in Household Income

More recent trends in household income echo the decadal changes discussed above. Riding the roller coaster of economic peaks and troughs, median household income has generally trended up since 1970.17 However, the Great Recession had a severe impact on incomes of American households. The median household income in 2010 was no higher than its level in 1997, 13 years earlier. Absent a rapid acceleration in economic growth, it might be several years before household incomes return to the peaks they experienced at the turn of the century.

As reported by the Census Bureau, median household income rose modestly from $45,147 in 1970 to $46,025 in 1980. 18 Incomes fell with the twin recessions in the early 1980s but increased sharply later in the decade, with the median level reaching $49,951 by 1990. The 1990s were also a period of economic growth overall and household incomes increased further to $54,842 by 2000. Ten years later, in 2010, the median income had fallen 7%, to $51,006. That was less than the median household income in 1997—$51,705. Over the course of the 40-year period from 1970 to 2010, household incomes at the middle increased by 13%.

Income data reported by the Census Bureau do not account for the changing size of the American household. The typical household in 1970 consisted of 3.2 persons, but the typical household in 2010 had only 2.5 persons, or 20% less. Because a smaller household can do more with a given dollar, the impact of this demographic change should be accounted for when assessing changes in the economic well-being of households.

In simple terms, adjusting for household size means crediting income to households that are of below-average size (because their dollars go farther) and debiting income from households that are of above-average size (because their dollars do not go as far). The amount of income to credit or debit depends on the norm that is assumed for the typical size of a household. In this report, incomes for all households in each year are scaled to a three-person household.19 This adjustment has minimal impact on incomes in the early 1970s, when the average household consisted of three persons, but it notably raises incomes in later years.

The median household income in the U.S. when adjusted for the drop in household size increased from $44,845 in 1970 to $59,127 in 2010. That is an increase of 32%, substantially greater than the increase of 13% prior to an adjustment for household size. The effect of adjusting for household size is most pronounced in the 1970s, a decade in which average household size fell from 3.2 to 2.7. As a result, household incomes in this decade are estimated to have increased by 12.2% instead of a mere 1.9% without adjusting for household size.

Household size from 2000 to 2010 was virtually unchanged, inching down from 2.6 to 2.5. Thus, adjusting or not adjusting for household size has virtually no impact on income trends in the “lost decade.” Prior to adjustment, median household income in this decade fell by 7.0%. After the adjustment for household size, the drop in household income is 6.6%. The adjusted median household income in 2010—$59,127—is also no higher than its level 13 years earlier in 1997—$59,194.

The “lost decade” acquires one other unique characteristic after incomes are adjusted for household size—it is the only 10-year period since 1970 in which median household income at the end of the period has been less than at the start of the period.20

Middle-Income Demography, 1971-2011

Trends in median household income are a good indicator of overall changes in prosperity, but they leave many questions unanswered: Is the rise in prosperity shared equally? Are those in the middle faring as well as those above or below the middle? Are income gaps increasing or decreasing? Is the size of the middle class expanding or shrinking? Who is in the middle?

The analysis of these questions reveals that the share of the American adult population that lives in middle-income households has decreased steadily for the past four decades. This has been accompanied by virtually equal parts movements up and down the income ladder. In other words, there has been both progress and regression in the economic status of American families.

However, progress for some demographic groups has been better than for others, and the regression for some groups has been deeper than for others. The winners include seniors (ages 65 and older), married couples and those with a college degree. The losers include young adults, unmarried men, people who have never married and those without a college degree.21 From 1971 to 2011, there was overall progress, with winners outnumbering losers. However, from 2001 to 2011, there was effectively no change in the status of the population overall, and losers outnumbered winners.

These findings emerge from the Center’s analysis of data from the Census Bureau’s Current Population Survey for 1971 to 2011.22 The specific data analyzed are from the Annual Social and Economic Supplement conducted in March of each year. In this month, respondents are asked to provide household income data for the calendar year prior to the year of the survey. For this reason, income data in this report cover the 1970 to 2010 period and the demographic data cover the 1971 to 2011 period.

Who Is Middle Income?

This section of the report uses data on household income to divide Americans into three income tiers—lower, middle and upper. Results from an alternative approach—allowing the public to describe itself as being lower, middle or upper class—are discussed in another section of the report. The size of the middle, whether based on household incomes in 2010 or based on self-described class in the 2012 survey, turns out to be nearly identical.

Using income as the criterion, middle-income households are defined as those with a size-adjusted household income that is two-thirds to double the overall median size-adjusted household income. 23 Lower-income households have size-adjusted incomes that are less than two-thirds of the median, and upper-income households have size-adjusted incomes that are more than double the median.

The boundaries of the middle-income tier vary by household size. For three-person households in 2010, the middle-income range is about $39,000 to $118,000. The assignment of a household to the middle-income tier depends on what its income is estimated to be after it is scaled to a three-person household.24 A household with reported income less than $39,000 may fall in the middle-income tier if it has fewer than three members. Conversely, a household earning more than $39,000 may fall out of the middle-income tier if it has more than three members.

Because the median household income has risen over time, the threshold for entering the middle-income tier has also risen over time. From 1970 to 2000, the low end of the middle-income range increased from about $30,000 to $42,000. The threshold fell to $39,000 in 2010 because of the decline in median household income. The precise income ranges used to classify households into the middle-income tier after adjusting for household size are shown in the accompanying table.

How Many Adults Are Middle Income?

The size of the middle-income tier varies over time because the incomes of individual households, in relation to the overall median, vary over time. In 2011, 50.7% of adults (ages 18 and older) lived in middle-income households.25 In number, that amounted to 117 million adults out of the U.S. household population of 231 million adults.26 The share of the U.S. adult population that lives in middle-income households has diminished over time. In 1971, 60.8% of adults lived in middle-income households, 10 percentage points more than in 2011.

The shrinking, or hollowing out, of the middle-income tier has been accompanied by an increase in the shares of the adult population at the high and low ends of the income distribution—and roughly equal shares have moved up or down. The share of the population in the upper-income tier has risen from 14% in 1971 to 20% in 2011. At the same time, the share in the lower-income tier grew from 25% in 1971 to 29% in 2011. Thus, from 1971 to 2011, the U.S. adult population has become more economically polarized—with relatively more in the top and the bottom tiers, and fewer in the middle.

The hollowing of the middle-income tier has been a steady and virtually uninterrupted process over the past four decades. Starting from 1970, every decade has ended with a smaller share in the middle-income tier and higher shares in the lower- and upper-income tiers. No single decade stands out as having energized the movement of people out of the middle.

Demography of Middle-Income Adults

Because the majority of adults fall into the middle-income tier, the characteristics of the middle bear a strong resemblance to the population overall. The changes in those characteristics also mirror the demographic changes that have swept the U.S. population since 1971. This section summarizes the major findings; the detailed findings are presented in Appendix 1. Among the key observations:

Education: In 2011, only 10% of middle-income adults had not earned a high school diploma or its equivalent and 32% had only a high school diploma. Both shares were down notably from 1971, as is the case with all adults. At the same time, the share of middle-income adults with some college education rose from 14% in 1971 to 32% in 2011, and the share with a bachelor’s degree or more increased from 10% to 26%. These improvements in educational attainment are in line with the trend for the U.S. population.27

Age: The middle-income group of adults aged somewhat faster than the population from 1971 to 2011. The share of middle-income adults 65 and older nearly doubled from 9% in 1971 to 16% in 2011. That was a much sharper increase than in the overall population, where the share of those ages 65 and older rose from 15% in 1971 to 17% in 2011. Conversely, the share of young adults, ages 18 to 29, in the middle-income tier fell more sharply than their share in the population at large from 1971 to 2011—from 30% to 22% in the middle-income tier and from 28% to 22% in the population.

Race and Ethnicity: As with the full adult population, middle-income adults were more racially and ethnically diverse in 2011 than in 1991.28 The share of Hispanics in the middle-income population increased from 8% in 1991 to 13% in 2011. The share of whites fell from 80% in 1991 to 70% in 2011 as the share of blacks and Asians increased.

Marriage: Marriage is less common in the U.S. today than in 1971, and this is reflected in the changing share of middle-income adults who are married with a spouse present. Among middle-income adults, the share fell from 74% in 1971 to 55% in 2011. In the overall adult population, the share of married people with a spouse present fell from 69% in 1971 to 52% in 2011. Meanwhile, the proportion of middle-income adults who have never been married rose from 16% to 27%, mimicking the change in the total adult population.

Winners and Losers

The steady reduction in the share of the U.S. population that is in the middle has affected all major demographic groups. Regardless of education, age, gender, marriage, race and ethnicity, the share in the middle was either reduced or unchanged from 1971 to 2011. The sole exception to this rule is seniors (65 and older) for whom there was a significant decline in the share in the lower-income tier and a notable rise in the share in the middle-income tier from 1971 to 2011.29 However, despite this progress, seniors are still the age group most likely to live in lower-income households.

Even as the shares in the middle have generally decreased, the income status of some demographic groups has improved and the status of some other groups has deteriorated. For the U.S. adult population, the share that is upper income increased from 14.0% in 1971 to 20.0% in 2011, for a gain of six percentage points in income status. However, over the same period, the share that is lower income increased from 25.2% to 29.3%, a loss of four percentage points in income status. Therefore, the net gain for adults overall is two percentage points.

This yardstick—the difference between the changed likelihood of being upper income and the changed likelihood of being lower income—can be used to classify any demographic group as a “winner” or a “loser.” Winners have experienced net advances up the income tiers over time and losers have, on net, slipped down the income tiers.

Age: Those ages 65 and older experienced the biggest gains in income status across demographic groups. Their share in the lower-income tier fell from 53.6% in 1971 to 39.0% in 2011, and their share in the upper-income tier rose from 7.1% to 13.6%. Moreover, their progression up the income tiers was unabated in the “lost decade.” Young adults (ages 18 to 29) had the opposite experience, with the rise in the share of young adults in the lower-income tier exceeding the increase in the share in the upper-income tier. Across age groups, those ages 65 and older remain the least likely to be upper income and the most likely to be lower income. However, while in 1971, they were 32 percentage points more likely to be lower income than young adults, the gap narrowed in 2011 to only six percentage points.30

Education: A college education presented the best chance of holding one’s ground. From 2001 to 2011, in the midst of economic stagnation, the income status of those with a bachelor’s degree or more slipped the least. Their share in the upper-income tier edged up from 40.3% to 40.6% even as the share in the lower-income tier increased from 9.7% to 11.5%. College graduates also fared better than those with lesser education from 1971 to 2011. Meanwhile, both from 2001 to 2011 and from 1971 to 2011, those with only a high school diploma fared the worst across all demographic groups included in this analysis.

Marriage: When it comes to income status, marriage helps, and it helps couples without children more than it helps other couples.31 This is true for both the long run, from 1971 to 2011, and the short run, from 2001 to 2011. Unmarried men and those who never married have experienced among the greatest losses in income status in either time period. Among those not currently married, the status of those who are widowed has fared the best. Interestingly, the gains for the widowed were experienced in their entirety in the “lost decade.” This could be the result of the aging of women who entered the labor force in ever-increasing numbers in the post-WWII era.32

Race and Ethnicity:  Blacks and Hispanics are about twice as likely as whites and Asians to be lower income.33 But among racial and ethnic groups, the income status of blacks improved the most from 1991 to 2011, followed by whites, Asians and Hispanics. The gains for blacks were realized entirely in the 1990s; from 2001 to 2011 they experienced a reversal in their income status. Whites are the only racial or ethnic group that did not experience a loss in income status from 2001 to 2011.

Changes in the Income Status of Demographic Groups

This section presents additional detail on the distribution of demographic groups across income tiers and how the distributions have shifted over time. These shifts underlie the evidence on winners and losers discussed in the previous section.

Age: Youth has not been well served in the shuffling of people in the income distribution. Young adults (ages 18 to 29) experienced a notable deterioration in their income status. The share of young adults who are middle income fell from 65.8% in 1971 to 51.0% in 2011. That was largely a result of movement down the income ladder, with the share of young adults in the lower-income tier rising from 21.9% in 1971 to 33.5% in 2011.

In contrast, the share of seniors (65 and older) in the lower-income tier fell sharply and the share in the middle rose notably from 1971 to 2011. In 1971, the majority of seniors (53.6%) were in lower-income households. That share fell to 39.0% in 2011. At the same time, the share of seniors who are middle income rose from 39.3% to 47.4%, a notable exception to the widespread diminution in the size of the middle. The share of seniors in upper-income households also increased, from 7.1% in 1971 to 13.6% in 2011. However, these gains were not sufficient to alter the fact that seniors are the most likely age group to be lower income and the least likely to be upper income.

The experiences of middle-age adults, ages 30 to 44 and 45 to 64, resemble that of the overall population. For both age groups, the shares in the middle-income tier fell with notable movements both up and down the ladder. Among 30- to 44-year-olds, for example, the share in the lower-income tier increased by eight percentage points from 1971 to 2011, and the share in the upper-income tier increased by seven percentage points.34

It is worth noting that the economic status of seniors may be understated based on the income criterion alone. Seniors, the vast majority of whom are retired, may supplement their reported incomes with the drawing down of their accumulated wealth. Since a family’s wealth represents the culmination of savings over its lifetime, seniors typically have more wealth than younger families. In 2010, the median wealth of families whose head of household was ages 65 and older was $219,104. 35 That was much higher than the median wealth of other families—$147,555 for families whose head of household was 45 to 64 years of age; $32,989 for families whose head of household was 30 to 44; and $6,344 for families whose head of household was 29 and younger. This may be one reason why seniors, when asked to describe their status in the survey, are more likely than younger people to call themselves middle class, even though based on adjusted household income they have the lowest share in the middle (see Chapter 2).

Education: The U.S. economy has increasingly favored skilled workers over the unskilled, and this is reflected in the income status of education groups. Adults with only a high school diploma or a lower level of educational attainment saw their relative income position decline sharply from 1971 to 2011. Among those with less than a high school diploma, the share in the lower-income tier increased from 41.0% in 1971 to 58.9% in 2011. The share in the middle-income tier fell from a majority—52.9% in 1971—to slightly more than one-third—36.8% in 2011.

Adults with only a high school diploma did not fare any better—the share in lower-income households rose from 17.1% in 1971 to 36.1% in 2011, and the share in middle-income households fell from 69.2% to 53.6%. The slide down the income tiers is also the defining experience for those with some college education but not a bachelor’s degree. The share of those adults in lower-income households increased from 14.1% in 1971 to 25.6% in 2011.

The only education group whose representation in the upper-income tier increased is the group with a bachelor’s degree or higher level of attainment. Among college graduates, the share in the upper-income tier rose from 35.7% in 1971 to 40.6% in 2011. That improvement in economic status largely accounted for the shrinking share of college graduates who were middle income, from 56.2% in 1971 to 47.9% in 2011.

Americans have clearly taken a liking to the increased value of a college education. The share of adults with a college education has increased from 10.7% in 1971 to 27.8% in 2011. Over the same time, the share with less than a high school diploma has fallen from 39.7% to 13.3%.36 The improvement in the education profile of Americans has sustained the overall advance in income status even as all but one education group has experienced a decline.

Gender: Men are more likely than women to live in upper- or middle-income households. In 2011, 52.2% of men were in middle-income households and 21.5% were in upper-income households. In contrast, 49.3% of women were in middle-income households and 18.7% were in upper-income households. From 1971 to 2011, men and women experienced similar declines in the shares that are middle income; the shrinking was roughly equal parts up and down the ladder for both sexes.

Marriage: Being married with a spouse present

has clear economic benefits—these adults are the least likely to live in lower-income households and the most likely to be in the middle- or upper-income tier. The income status of married adults with a spouse present also improved the most from 1971 to 2011. The share of this group in the middle-income tier fell from 65.0% in 1971 to 53.6% in 2011. Virtually all of the movement was into the upper-income bracket, with that share rising from 14.2% to 25.2%.

At the other end of the spectrum, the income status of those who have never married deteriorated sharply. Among the never married, 59.3% were in the middle-income tier in 1971, and this share fell to 49.5% in 2011. Over the same period, the share in the lower-income tier rose from 22.5% to 34.3%.

People who are widowed and those who are separated or divorced are even more likely than the never married to live in lower-income households. For example, slim majorities of the widowed lived in lower-income households in each year examined. The income status of individuals who were widowed, separated or divorced did improve slightly over time, with the shares in upper-income households edging up from 1971 to 2011.

Marriage and Children: Among those who are married with a spouse present, the couples without children present in their homes have relatively better income status. In 2011, 28.6% of married couples with no children at home were in the upper-income tier, compared with 22.2% of married couples with children at home. Both groups experienced improved income status over time. In 1971, only 19.2% of married couples with no children at home and 11.4% of married couples with children at home were in the upper-income tier. Thus, for either group, the shrinking of the middle income was accompanied by a rise in the share in the upper tier. But for married couples with children in the home, there was also an uptick of four percentage points in the share that are lower income.

Marriage, Gender and Children: Among unmarried women, including those who are widowed, divorced or separated, the majority of those with children at home live in lower-income households. This has not changed over time, the share being 55.1% in 1971 and 54.2% in 2011. Only 6% of these adults are in the upper-income tier, and the income status of this group most resembles that of adults with less than a high school level of education.

The income status of unmarried women is improved if there are no children at home. However, they do not currently fare as well as unmarried men. In 2011, 32.4% of unmarried men were in the lower-income tier, compared with 38.6% of unmarried women with no children at home. Unmarried men were also slightly more likely to be in the upper-income tier. However, the gap between these two groups is shrinking. From 1971 to 2011, the share of unmarried men in the lower-income tier increased from 23.6% to 32.4%, and the share in the upper-income tier fell from 19.0% to 17.2%. Among unmarried women with no children at home, the share of those in the lower-income tier was unchanged, and the share in the upper-income tier rose from 11.7% to 14.7%.

Race and Ethnicity: Because of changes to the classification of racial groups, consistent data on the income status of these groups are available only from 1991 to 2011. Blacks and Hispanics are the most likely to live in lower-income households, and whites and Asians are the most likely to be in the middle- or upper-income tier. However, from 1991 to 2011, blacks were the only racial or ethnic group to experience a reduction in the share of lower-income households, with their share falling from 46.9% to 44.0%. Like whites and Asians, the share of blacks in the upper-income tier rose in these two decades, from 6.5% in 1991 to 9.6% in 2011. The income status of Hispanics was virtually frozen from 1991 to 2011 with only a modest increase in the share in the upper-income tier from 7.0% in 1991 to 8.4% in 2011.37

Nativity: Data by nativity are presented for only the 2001 to 2011 period because immigrant status was not recorded in the source data until 1994. Foreign-born adults are much more likely than native-born adults to live in lower-income households—39.3% versus 27.5% in 2011. Conversely, native-born adults are much more likely than foreign-born adults to be in upper- income households—21.1% versus 14.5% in 2011. The changes in income status from 2001 to 2011 were modest, but they favored the native born. Among the native born, the share in upper-income households increased two percentage points, offsetting the slight increase in the share of lower-income households. Meanwhile, among the foreign-born, the share in lower-income households increased three percentage points and there was no change in the share of those in the upper-income tier.

Chapter 7: Income and Wealth, by Income Tier

Overview

This chapter examines trends in the well-being of lower-, middle- and upper-income groups through the prisms of income and wealth.38 Income is the more widely used measure, but, due to changing economic circumstances, it is subject to sharp, short-term fluctuations. A family that is considered in the middle-income group one year may be in the lower-income group the next, or vice versa.39

Wealth, unlike income, represents a stock of assets, minus outstanding debt, accumulated over time. Among other things, wealth provides retirement income, protection against short-term economic shocks, and security and social status for future generations. There are families, such as seniors who are retired, with low incomes but high levels of wealth, and other families, such as young professionals, with high incomes and low levels of wealth. Thus, the two yardsticks together provide a more complete portrait of the economic status of families.

Trends in income for lower-, middle- and upper-tier households show that in the past four decades the United States has been a society characterized by rising prosperity and rising inequality. Income rose for all three tiers, but it increased the most for the upper-income tier and the least for the lower-income tier. As a result, upper-income households accounted for a larger share of U.S. aggregate household income in 2010 than they did in 1970.40 The increase in their share of aggregate income exceeded the increase in the share of adults that live in upper-income households.

Trends in wealth, data for which are available starting in 1983, tell a slightly different story. From 1983 to 2010, there was a notable increase in wealth only for the upper-income tier. The incomes of middle- and lower-income households may have increased, but their net worth has stagnated and their long-term security may not be as secure as suggested by the trends in income.41 Moreover, the growth in the wealth gap across income tiers easily outdistances the growth in the income gap.

The disparate trends in income and wealth emerged in the Great Recession. The recession caused income to fall by similar percentages in all three income tiers. However, the loss in wealth was much sharper for the lower- and middle-income tiers. Those setbacks were large enough to turn the clock back on the net worth of lower- and middle-income households by about two decades or more.

The steep decline in the net worth of lower- and middle-income households is a consequence of the housing boom and bust that preceded the Great Recession. These households are twice as dependent as upper-income households are on home equity as a source of wealth. Furthermore, in the run-up to the recession, they took on relatively more debt in relation to their assets than did upper-income families. Much of that new debt was secured by their primary residence. Thus, lower- and middle-income families were more vulnerable to the crash in housing values that preceded the recession.42

As in preceding chapters, the estimates of income reported below have been adjusted for household size and scaled to reflect a three-person household. However, wealth data are not adjusted for family size because it is difficult to associate a current family size with a stock of wealth. In part, that is because wealth is accumulated and “consumed” over an extended period of time during which family structure may change significantly. It is also typical for at least part of a family’s wealth to be passed on for the benefit of future generations.

The income analysis spans the 1970-2010 period and is based on the Current Population Survey. Dictated by the availability of data, the wealth trends are measured from 1983 to 2010 using the Survey of Consumer Finances. Because of the way the data are collected and reported, the unit of analysis for income is the household and the unit of analysis for wealth is the family. Families, or households, are divided into three groups based on their income level after the income has been adjusted for differences in family or household size. This process is conducted independently for the two data sources.

Major findings include:

Income

  • The median income of all U.S. households increased from $44,845 in 1970 to $63,277 in 2000, an increase of 41% (incomes in 2011 dollars). But that proved to be the peak. By 2010, the median income had fallen to $59,127, a loss of 7%.
  • Household income for all three tiers—lower, middle and upper—also peaked at the turn of the century and then reversed course. From 2000 to 2010, the median income of lower-income households fell 8%, middle-income households lost 5%, and upper-income households surrendered 6%.
  • From 1970 to 2010, the median income of middle-income households increased from $51,932 to $69,487, or by 34%. The median income of lower-income households rose from $17,853 to $23,063, or 29%. The median income of households in the upper tier increased the most (43%), from $112,651 in 1970 to $161,252 in 2010.
  • The income gap across the three tiers narrowed in the 1970s, with the incomes of lower- and middle-income households increasing at the fastest rate. However, the income gap widened in the 1980s as incomes of households in the upper tier increased at more than double the rate of lower-income households. The gap has grown at a slower pace in the past two decades.
  • The share of U.S. aggregate household income accounted for by upper-income households increased from 29% in 1970 to 46% in 2010. The share accounted for by middle-income households fell from 62% in 1970 to 45% in 2010. The share of lower-income households was unchanged at about 9%.

Wealth

  • The median wealth of all U.S. families, in 2011 dollars, increased from $73,972 in 1983 to $131,016 in 2007, a gain of 77%. However, the Great Recession eliminated almost all of this gain as median wealth plunged to $79,431 in 2010, a loss of 39%. Overall, median net worth in 2010 was 7% higher than in 1983.
  • In percentage terms, the loss in wealth from 2007 to 2010 was the greatest for lower- and middle-income families. Since the recession started, net worth fell 41% for lower-income families, 39% for middle-income families, and 17% for upper-income families.
  • From 1983 to 2010, net worth has increased by a significant amount only for upper-income families. Their median wealth rose from $307,134 in 1983 to $574,788 in 2010, or by 87%. The median wealth of middle-income families increased from $91,056 to $93,150, or by 2%. The median wealth of lower-income families decreased 7%, from $10,963 in 1983 to $10,151 in 2010.
  • There has been a sharp rise in the wealth gap and this has mostly occurred since 2001. The wealth of upper-income families was three times the wealth of middle-income families in 1983 and four times as high in 2001. By 2011, this ratio had risen to six-to-one. The ratio of the wealth of upper-income families to the wealth of lower-income families was 28-to-1 in 1983, 31-to-1 in 2001 and 57-to-1 in 2010.
  • Middle- and lower-income families derive about 45% of their net worth from equity in their homes. Upper-income families have more diversified portfolios, with three major groups of assets—housing, businesses and stocks—each contributing 20% to 25% to their total net worth.
  • Families in all three income tiers took on more debt from 1983 and 2007. But the growth in mean debt levels was highest for lower-income families (215%) and middle-income families (206%). The mean debt level for upper-income families increased by 122% over this period. From 2007 to 2010, mean debt levels retreated for upper-income families (down 6%) and middle-income families (down 11%) but not for lower-income families (up 15%).

Trends in the Income of Lower-, Middle- and Upper-Income Tiers

The median real income of U.S. households has increased markedly since 1970. In 2010, the median household income in the U.S. was $59,127 (expressed in 2011 dollars and adjusted for household size). That was 32% higher than the median income of U.S. households in 1970 ($44,845).

The increase in household income was remarkably steady from 1970 to 2000, increasing 12% each in the 1970s, the 1980s and the 1990s. However, the median household income in 2010 was less than in 2000, falling from $63,277 in 2000 to $59,127 in 2010, or a drop of nearly 7%. That is the lingering aftermath of the 2001 recession, an economic slowdown that persisted through 2003 and the Great Recession of 2007-2009.

The overall gains in income were shared by households in all three income tiers, albeit not equally. For middle-income households, the median income increased from $51,932 in 1970 to $69,487 in 2010, a gain of 34%. Over this period, the median income of lower-income households increased from $17,853 to $23,063, or by 29%. For upper-income households, the median income rose 43%, from $112,651 in 1970 to $161,252 in 2010.

Households in all three income tiers lost ground from 2000 to 2010. The median income for middle-income households fell from $72,956 to $69,487; the median for lower-income households dropped from $25,164 to $23,063; and the median income for upper-income households slid from $171,679 to $161,252.

The overall trend in income growth masks some differences across the decades and income groups. In the 1970s, income growth was the strongest for lower- and middle-income households (13% each). Incomes for upper-income households increased 10% in the 1970s.

The pattern reversed in the 1980s with the strongest gains (18%) experienced by upper-income households. That was significantly greater than the 11% growth in the median income of middle-income households. It also was more than double the increase of 8% for lower-income households. This decade marked the beginning of a widening of the income gap.

Lower-income households were among the greatest beneficiaries of the economic expansion in the 1990s. Their median income in the 1990s increased by 15%, almost double the rate of increase in the previous decade. The growth in the incomes of middle-income households (12%) and upper-income households (18%) were virtually unchanged from the 1980s.

In the “lost decade,” 2000 to 2010, previous gains in incomes for all three tiers of households eroded. In this decade, the median income of lower-income households decreased 8%, the income of middle-income households fell 5%, and the median income for upper-income households dropped 6%.

Distribution of U.S. Aggregate Household Income

The distribution of U.S. aggregate household income shifted away from the middle and lower tiers to the upper-income tier from 1970 to 2010. This is the consequence of two trends: the higher rate of growth in the incomes of upper-tier households and the decreasing share of adults who live in middle-income households.

In 2010, upper-income households accounted for 46% of U.S. aggregate household income.43 Their share in aggregate income was more than double the share of adults (20%) living in those households. Middle-income households accounted for 45% of U.S. aggregate household income in 2010, less than the share of adults (51%) living in those households. Lower-income

households had a 29% share in the adult population but accounted for only 9% of aggregate income.

In 1970, upper-income households accounted for 29% of aggregate income, middle-income households had a 62% share, and lower-income households accounted for 10% of aggregate income. For the middle, the share in income was about the same as the share in the adult population in 1970 (61%). Upper-income households accounted for 14% of the adult population in 1970, and lower-income households accounted for 25%.

From 1970 to 2010, the share of middle-income households in aggregate income fell more sharply (by 27%) than its share in the adult population (down 16%). In contrast, the share of upper-income households in aggregate income rose faster (by 60%) than its share in the adult population (up 44%). For lower-income households, the share in aggregate income fell moderately (6%), despite a 15% increase in their share of the adult population.

The net result of the trends in household incomes and the distribution of the adult population is a more uneven distribution of aggregate income in 2010 than what it was in 1970.44 The shift in the distribution is most pronounced in the 1980s and the 1990s. Those are the two decades in which income growth was more pronounced for upper-income households compared with the growth in the incomes of middle- and lower-income households.

Trends in the Wealth of Lower-, Middle- and Upper-Income Tiers

Based on wealth, the distances between lower-, middle- and upper-income families are much greater than the differences in income. Moreover, the wealth gap has increased by much more than the income gap in the past three decades. The most striking finding is that only upper-income families have experienced notable gains in wealth from 1983 to 2010; the net worth of lower- and middle-income families is virtually unchanged. This is a consequence of the housing market crash in 2006 and the Great Recession, which have seemingly erased nearly all of the wealth gains experienced by lower- and middle-income families in the two decades prior to the start of the Great Recession.

Because the Survey of Consumer Finances, the source for wealth data, is conducted triennially, estimates presented in this section cover nine-year intervals starting with 1983.45 The years 1983, 1992, 2001 and 2010 follow immediately on the heels of or represent the tail ends of recessions. Data are also presented for 2007, a business cycle peak, to highlight the impact of the Great Recession on the wealth of U.S. households.

In 1983, the median wealth of American families was $73,972 (expressed in 2011 dollars). It increased slowly in the 1980s, reaching $78,061 in 1992 for a gain of 6%. The 1990s delivered much greater gains in wealth as it climbed up by 41% to $110,195 in 2001. The housing boom that characterized the first half of the “lost decade” delivered additional large gains. By 2007, median wealth had reached $131,016, 19% higher than in 2001.

The Great Recession delivered a crushing blow to household wealth. In the space of three years, median wealth fell by 39%, to $79,431 in 2010. Thus, at the end of the last decade, the median net worth of American families was only 7% higher than what it was in 1983.

As one might expect, families’ wealth is strongly correlated with their income. In 1983, the median wealth of middle-income families was $91,056. This was much higher than the wealth of lower-income families—$10,963—but it was less than one-third the wealth of upper-income families—$307,134.

The wealth of middle-income families was unchanged from 1983 to 1992, staying rooted around $91,000. In percentage terms, the wealth of lower-income families rose the most in this period. Their wealth increased to $13,319, or by 21%. The gain for upper-income families was relatively modest, an increase of 6%, to $326,851. The wealth gap across lower- and upper-income families narrowed in this decade, and the gap between middle- and upper-income families widened somewhat from 1983 to 1992.

The wealth of all families rose sharply from 1992 to 2001, with upper-income families experiencing the largest gains. Among middle-income families, median net worth rose from $90,846 in 1992 to $129,582 in 2001, or 43%. Gains for lower-income families were similar, as their median wealth increased by 38%, from $13,319 in 1992 to $18,421 in 2001. The wealth of upper-income families rose 74% in the 1990s, from $326,851 in 1992 to $569,905 in 2001.

The advantage of upper-income families continued to stretch from 2001 to 2007. For them, wealth increased an additional 22% to stand at $693,265 in 2007. The wealth of middle-income families increased almost as much, from $129,582 in 2001 to $152,950, a gain of 18%. However, in the midst of the general gains, lower-income families slipped down the ladder. Their wealth fell from $18,421 in 2001 to $17,345 in 2007, a loss of 6%.

The Great Recession rewound the clock on household wealth accumulation by many years. For middle- and lower-income families, the clock has turned back by about two decades. Their wealth in 2010, $93,150 for the middle-income tier and $10,151 for the lower-income tier, resembles the levels from the 1980s.46 For upper-income families, the journey goes back “only” a decade. Their median wealth in 2010—$574,788—is about the same as their wealth in 2001.

Over the entire 1983 to 2010 period, only upper-income families experienced strong gains in wealth. The wealth of upper-income families increased 87% from 1983 to 2010, but it

increased only 2% for middle-income families and fell 7% for lower-income families. Thus, with respect to wealth, lower- and middle-income families have lost significant ground to upper-income families since 1983. In 1983, the net worth of upper-income families was 3.4 times the net worth of middle-income families. By 2010, that ratio had nearly doubled to 6.2. The ratio of the wealth of upper-income families to the wealth of lower-income families did double, rising from 28.0 in 1983 to 56.6 in 2010. The lion’s share of the increase in these ratios belongs to the “lost decade.”

The Composition of Assets

In addition to differences in their level of wealth, lower-, middle- and upper-income families differ in the composition of their portfolios. Generally speaking, the higher a family’s wealth and income, the more diverse its portfolio. For middle- and lower-income families, one asset stands out from the rest: their home. Among upper-income families, houses, stocks and bonds and business assets are equally important.

For lower- and middle-income families, equity in their home accounted for about 40% to 55% of the total mean value of assets in all time periods. Recently, stocks and bonds (including those owned in pension accounts) account for 15% to 20% of assets of middle-income families. Business assets account for about 15% of the portfolio of lower-income families in recent years, about double the share of business assets in the portfolios of middle-income families. For both middle- and lower-income families, a potpourri of other assets—such as vehicles, personal property and secondary properties—are the second most important component of wealth in all years.

The portfolios of upper-income families are more balanced. Houses, stocks and bonds, and business assets each account for 20% to 25% of total assets. Thus, their wealth is less dependent on home equity, the main source of wealth declines since 2006.

Overall, the asset distributions of families did not change much from 1983 to 2010. The most notable change is the growing role of stocks and bonds in middle- and lower-income family portfolios. This change occurred primarily from 1983 to 2001 with the rise of defined contribution pension plans such as 401(k) plans.

Net Worth, Assets and Liabilities

A family’s net worth is the difference between the value of its assets and the value of its liabilities. Net worth will increase as long as the value of a family’s assets, in absolute amount, increases by more than its liabilities. Thus, a family can take on more debt but still increase its net worth as long as its assets holdings increase by a sufficient amount. This section presents trends in the mean net worth, assets and liabilities of lower-, middle- and upper-income families.47 There are notable differences across income groups in this regard, especially with respect to changes in the level of debt.

From 1983 to 2001, the value of the assets owned by families in all three income tiers increased by more than the level of debt. Middle-income families, for example, experienced a gain of $149,035 in the mean value of their assets. In the same period, the value of their debt increased by $30,142. The net gain, or the increase in their mean wealth, was $118,894. The pattern of asset values increasing more than debt values repeated from 2001 to 2007.

However, even as lower- and middle-income families were accumulating wealth, their debt levels were rising at a faster rate than the values of their assets. From 1983 to 2001, middle-income family debt increased by 90% and asset values increased by 77%. Among lower-income families, debt increased by 111% from 1983 to 2001 and asset values rose by 59%. Only upper-income families experienced a greater increase in the value of their assets (87%) than in their level of debt (54%).

From 2001 to 2007, the pattern of debt rising at a faster pace than asset values became entrenched among upper-income families as well. A principal cause of this was the boom in housing values, which encouraged families to raise the level of debt secured by their primary residences.48 This trend left families in a more vulnerable position prior to the Great Recession than they might have been if the growth in debt and assets had been more balanced.

The story from 2007 to 2010 is mostly one of declining asset values and declining debt levels. The mean debt level for middle-income families fell by $11,040, a cut of 11%. The value of their assets fell even more, by $75,621 (19%). Thus, their mean net worth dropped by $64,581 with the Great Recession. Upper-income families had a similar experience from 2007 to 2010, with their asset values decreasing at a faster rate than their debt levels. Their mean net worth decreased by $390,755 in this period.

Lower-income families experienced a relatively modest loss of 2% in asset values from 2007 to 2010. However, their level of debt increased by $4,415 (15%) during this period. Thus, their net worth fell by $7,801 with the recession.

Overall, from 1983 to 2007, the amount of debt held by families in all income tiers rose significantly. The total increase in mean debt was $19,885 (215%) for lower-income families, $69,083 (206%) for middle-income families, and $135,572 (122%) for upper-income families. The reduction in debt levels from 2007 to 2010 among middle- and upper-income families has not been enough to repair the damage to their portfolios caused by the Great Recession.

References for Chapters 6 and 7

Bricker, Jesse, Arthur B. Kennickell, Kevin B. Moore, and John Sabelhaus. 2012. “Changes in U.S. Family Finances from 2007 to 2010: Evidence from the Survey of Consumer Finances.” Bulletin 98-2. Washington, DC: Federal Reserve, June.

Burkhauser, Richard V., Amy Crews Cutts, Mary C. Daly, and Stephen P. Jenkins. 1999. “Testing the Significance of Income Distribution Changes over the 1980s Business Cycle: A Cross-National Comparison.” Journal of Applied Econometrics 14(3): 253-272.

Burkhauser, Richard V., Jeff Larrimore, and Kosali I. Simon. 2011. “A ‘Second Opinion’ on the Economic Health of the American Middle Class.” Working Paper 17164. Cambridge, MA: National Bureau of Economic Research, June.

Congressional Budget Office. 2011. “Trends in the Distribution of Household Income Between 1979 and 2007.” Washington,

Congressional Budget Office. 2007. “Trends in Earnings Variability Over the Past 20 Years.” Washington, DC: April.

DeNavas-Walt, Carmen, Bernadette D. Proctor, and Jessica C. Smith. 2011. “Income, Poverty, and Health Insurance Coverage in the United States: 2010.” Current Population Reports, Consumer Income, P60-239. Washington, DC: U.S. Census Bureau, September.

Debels, Annelies, and Leen Vandecasteele. 2008. “The Time Lag in Annual Household-Based Income Measures: Assessing and Correcting the Bias.” Review of Income and Wealth 54(1): 71-88.

Dynan, Karen E., and Donald L. Kohn. 2007. “The Rise in U.S. Household Indebtedness: Causes and Consequences.” Finance and Economics Discussion Series Paper No. 2007-37, Divisions of Research & Statistics and Monetary Affairs. Washington, DC: Federal Reserve Board, August.

Garner, Thesia, Javier Ruiz-Castillo, and Mercedes Sastre. 2003. “The Influence of Demographics and Household-Specific Price Indices on Consumption-Based Inequality and Welfare: A Comparison of Spain and the United States.” Southern Economic Journal 70(1): 22-48.

Johnson, David S., Timothy M. Smeeding, and Barbara Boyle Torrey. 2005. “Economic Inequality Through the Prisms of Income and Consumption.” Monthly Labor Review, April: 11-24.

Kennickell, Arthur B., and Janice Shack-Marquez. 1992. “Changes in Family Finances from 1983 to 1989: Evidence from the Survey of Consumer Finances.” Bulletin 78. Washington, DC: Federal Reserve, January.

Kochhar, Rakesh, Richard Fry, and Paul Taylor. 2011. “Wealth Gaps Rise to Record Highs Between Whites, Blacks and Hispanics.” Washington, DC: Pew Research Center, Social & Demographic Trends project, July.

Krueger, Alan B. 2012. “The Rise and Consequences of Inequality in the United States.” Council of Economic Advisers, Speeches and Testimony. Speech given to Center for American Progress, Washington, DC, January 12.

Meyer, Bruce D., and James X. Sullivan. 2009. “Consumption and Income Inequality in the U.S.: 1960-2008.” Paper presented at IZA/OECD workshop, Paris, February 8-9.

Pew Research Center, Social & Demographic Trends project. 2008. “Inside the Middle Class: Bad Times Hit the Good Life.” Washington, DC: April.

Piketty, Thomas, and Emmanuel Saez. 2003. “Income Inequality in the United States, 1913-1998.” Quarterly Journal of Economics 118(1): 1-41.

Saez, Emmanuel. 2012. “Striking it Richer: The Evolution of Top Incomes in the United States.” Berkeley, CA: March.

Short, Kathleen, Thesia Garner, David Johnson, and Patricia Doyle. 1999. “Experimental Poverty Measures: 1990 to 1997.” Current Population Reports, Consumer Income, P60-205. Washington, DC: U.S. Census Bureau, June.

U.S. Department of the Treasury. 2007. “Income Mobility in the U.S. from 1996 to 2005.” Washington, DC: .

Wolff, Edward N., Ajit Zacharias, and Thomas Masterson. 2012. “Trends in American Living Standards and Inequality, 1959–2007.” Review of Income and Wealth 58(2): 197-232.