
In a Down Economy, Fewer Births
A sharp decline in fertility rates in the United States that started in 2008 is closely linked to the souring of the economy that began about the same time, according to a new analysis of multiple economic and demographic data sources.
Executive Summary
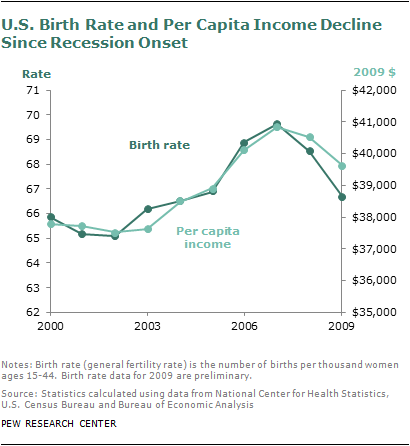
A sharp decline in fertility rates in the United States that started in 2008 is closely linked to the souring of the economy that began about the same time, according to a new analysis of multiple economic and demographic data sources by the Pew Research Center.
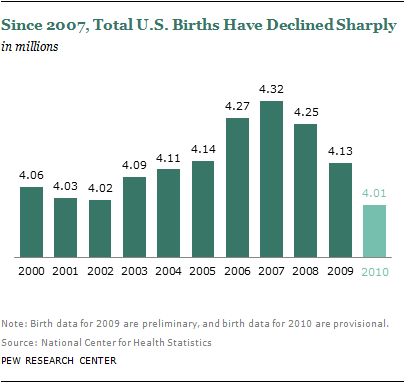
The year 2007 marked a record high number of births in the U.S.—4,316,233. Since that time, births have been declining, even as the U.S. population continues to grow. Preliminary data for 2009 indicate that the number of births dropped to 4,131,018—the lowest number since 2004. Provisional data show that in 2010 births numbered just over 4 million (4,007,000).1
A state-level look at fertility illustrates the strength of the correlation between lower birth rates and economic distress. States experiencing the largest economic declines in 2007 and 2008 were most likely to experience relatively large fertility declines from 2008 to 2009, the analysis finds. States with relatively minor economic declines were likely to experience relatively small declines.
For example, North Dakota, which experienced one of the nation’s lowest unemployment rates (3.1%) in 2008, was the only state to show even a slight increase (0.7%) in births from 2008 to 2009. All other states and the District of Columbia experienced either no change, or declines, in births during that period.
These correlations are based on fertility trends calculated using data from the National Center for Health Statistics and the U.S. Census Bureau and economic trend data from six familiar indicators (per capita income, per capita gross domestic product, employment rate, unemployment rate, initial unemployment claims, and foreclosure rates) tracked by the Bureau of Economic Analysis, the Bureau of Labor Statistics and RealtyTrac.2
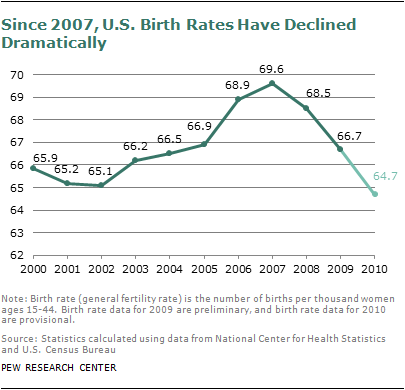
Since 2007, the U.S. fertility rate—which controls for variations in the size of the female population of childbearing age—has dropped markedly from 69.6 births per thousand women ages 15-44 to 66.7 births per thousand women ages 15-44 in 2009. Provisional data for 2010 indicate a further drop to 64.7 births per thousand women ages 15-44.
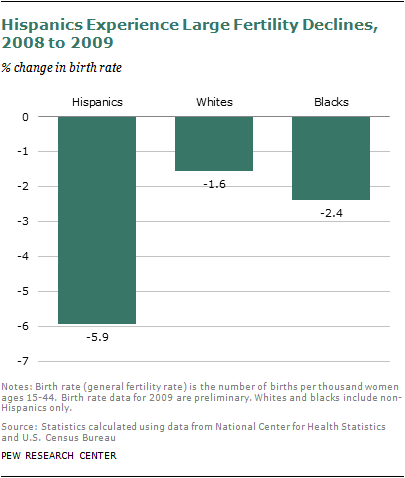
The Pew Research Center analysis also finds evidence of an association between economic hard times and fertility declines by race and ethnicity. Hispanics, whose employment levels and household wealth were particularly hard hit by the Great Recession, have experienced the largest fertility declines of the nation’s three major racial and ethnic groups. Conversely, whites have experienced smaller economic hardships, and smaller declines in fertility. From 2008 to 2009, birth rates dropped by 5.9% among Hispanic women, while birth rates dropped 2.4% among black women and 1.6% among white women.
Fertility and the Recession
The official start of the U.S. economic recession was in December 2007, according to the National Bureau of Economic Research. However, the timing and magnitude of economic declines associated with the recession have varied markedly from state to state. For instance, per capita income in Nevada declined by 4.6% from 2007 to 2008, while in West Virginia, per capita income increased by 1.6%. And in states such as Arizona, per capita income began declining by 2007, while in states such as Alaska and Montana declines did not appear until 2009.
This research capitalizes on such across-state differences to examine whether the economic downturn is associated with the sharp fertility declines that the U.S. has experienced since 2007. Six of the seven economic indicators that the Pew Research Center analyzed were strongly linked to subsequent changes in fertility at the state level. In particular, changes in per capita personal income, per capita GDP, employment rate, unemployment rate and initial unemployment claims from 2007 to 2008 were closely related to changes in fertility rates occurring from 2008 to 2009, as were 2008 state-level foreclosure rates.3 The change from 2007 to 2008 in the Home Price Index, an indicator of housing value, was not linked to subsequent fertility.
In 48 of 51 states (a number that includes the District of Columbia), fertility declines occurred within one to two years of the start of economic declines (as indicated by the percent change in personal income per capita, and the percent change in the employment rate). This does not conclusively prove that the economic changes led to fertility changes. However, the timing is consistent with the time it might take people to act upon fertility decisions.
Hispanics Hardest Hit by Recession, Show Biggest Fertility Declines
It is difficult to obtain reliable annual indicators of fertility and the economy at the state level by separate racial and ethnic groups. But an examination of national-level data shows that Hispanics, who have been hit the hardest in terms of employment and wealth, have also experienced the largest fertility declines since the onset of the recession. Conversely, the smaller birth rate declines among whites could reflect the fact that they were less hard hit by the recession than were Hispanics or blacks.
From 2008 to 2009, the birth rate among Hispanics dropped almost 6%. In comparison, blacks experienced a 2.4% decline, and whites experienced a 1.6% decline. While Hispanics continue to have birth rates that are much higher than their non-Hispanic counterparts, the 2009 Hispanic birth rate of 93.3 births per 1000 women of childbearing age is the lowest rate since 1999.
The relatively large birth rate declines among Hispanics mirror their relatively large economic declines, in terms of jobs and wealth. From 2007 to 2008, the employment rate among Hispanics declined by 1.6 percentage points, compared with declines of 1.0 percentage points for blacks and 0.7 points for whites. The unemployment rate shows a similar pattern—unemployment among Hispanics increased 2.0 percentage points from 2007 to 2008, while for blacks it increased 1.8 percentage points, and for whites the increase was 0.9 percentage points.4 A recent report from the Pew Hispanic Center revealed that Hispanics have also been the biggest losers in terms of wealth since the beginning of the recession, with Hispanic households losing 66% of their median wealth from 2005 to 2009. In comparison, black households lost 53% of their median wealth and white households lost only 16%. From 2007 to 2008, there were no statistically significant differences by race and ethnicity in per capita income.
Fertility Delayed or Fertility Foregone?
It’s typically quite difficult to determine if economic changes are causing fertility changes, since other social and cultural factors may also be at play, such as changes in women’s labor force participation, contraceptive technology, and public policy (Pison 2009). However, there is historical evidence of a link between economic cycles and fertility in the U.S.—Carl Haub of the Population Reference Bureau points to both the Great Depression and the oil bust of the early 1970s as examples. Research examining fertility across multiple industrialized countries has also shown a link between economic declines and fertility declines (Sobotka et al. 2011; Goldstein et al. 2009).
Experts suggest that much of the fertility decline that occurs during an economic decline is postponement of childbearing and does not represent a decision to have fewer children (Sobotka et al. 2011; Goldstein et al. 2009). In other words, people put off having children during the economic downturn, and then catch up on fertility once economic conditions improve.
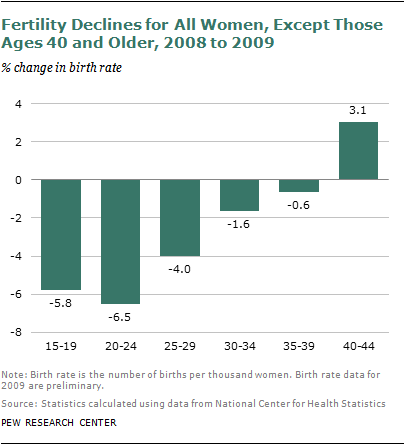
It’s too early to know if fertility will bounce back as the U.S. economy recovers,5 but preliminary evidence suggests that the fertility decline may indeed be driven by postponement. Survey findings from the Pew Research Center and vital statistics data have shown that the recession is more strongly associated with fertility declines among younger women, who presumably have the luxury of postponing fertility until better economic times prevail. Conversely, older women are less likely to say that they have postponed fertility due to economic declines. They are the only age group that has shown consistent, if not rising, fertility in recent years.


