U.S. colleges and universities resumed classes this fall with fewer international students than in recent years, according to some early projections. In the 2023-24 academic year, the United States had more than 1.1 million international students at its higher education institutions – an all-time high.
These forecasts follow the Trump administration’s temporary pause and subsequent redesign of the student visa interview process, as well as its efforts to deport some student activists, among other moves.
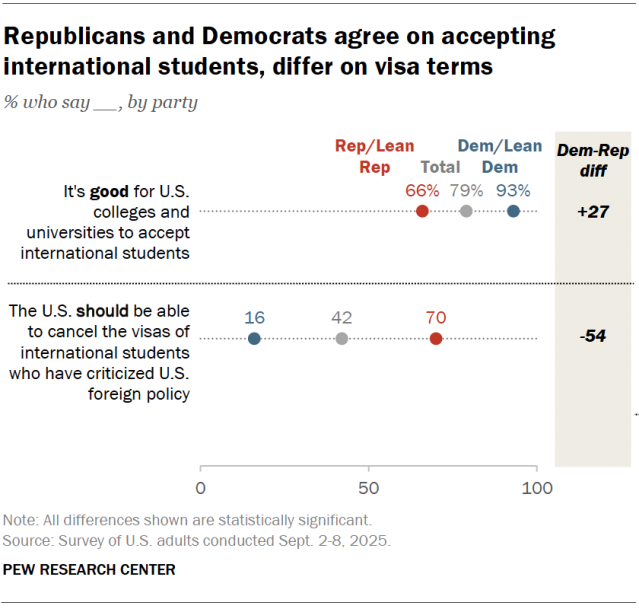
Most Americans (79%) think it’s good for U.S. colleges and universities to accept international students. That includes majorities of both Republicans and Democrats, according to a Pew Research Center survey conducted Sept. 2-8.
Still, sizable shares support certain restrictions on foreign students:
- Half support limiting the number of Chinese students coming to the U.S.
- Around four-in-ten or more support limiting the number of students from India, Nigeria and South Korea.
- 42% say the U.S. should be able to cancel the visas of international students who have criticized U.S. foreign policy.
All of these views differ along partisan lines.
More in this analysis:
- Is it good or bad for the U.S. to accept international students?
- Should the U.S. limit international students from specific countries?
- Should the government be able to cancel the visas of students who have criticized U.S. foreign policy?
- Do Americans know how many international students are enrolled in U.S. colleges?
Is it good or bad for the U.S. to accept international students?
The share of Americans who say it’s good for U.S. colleges and universities to accept international students is largely unchanged since 2021, when we last asked the question.
Views by party
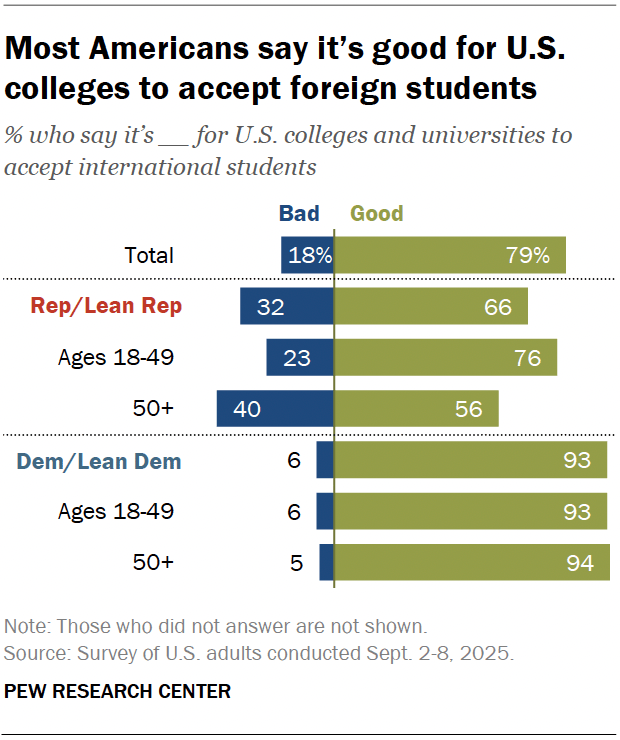
As was the case in 2021, Democrats and Democratic-leaning independents are more likely than Republicans and Republican leaners to say it’s good for U.S. universities to accept international students. Still, majorities in both parties hold this view (93% vs. 66%).
Republicans under 50 are significantly more likely than those ages 50 and older to say that it’s good for U.S. universities to accept international students (76% vs. 56%). Democrats’ views do not differ by age.
Views by education
Americans with at least a bachelor’s degree are more likely than those without to say accepting international students is good, though large majorities in both groups hold this view (87% vs. 76%).
This education gap appears within both parties.
Should the U.S. limit international students from specific countries?
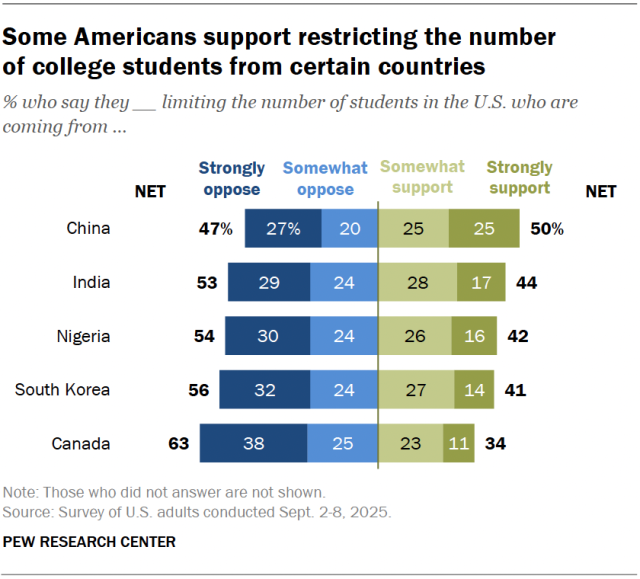
Though Americans widely support U.S. universities accepting international students, half support limiting the number of Chinese students in the U.S. Smaller shares support limiting students from:
- India (44%)
- Nigeria (42%)
- South Korea (41%)
- Canada (34%)
These countries are among those that have historically sent the most students to U.S. universities.
Views by party
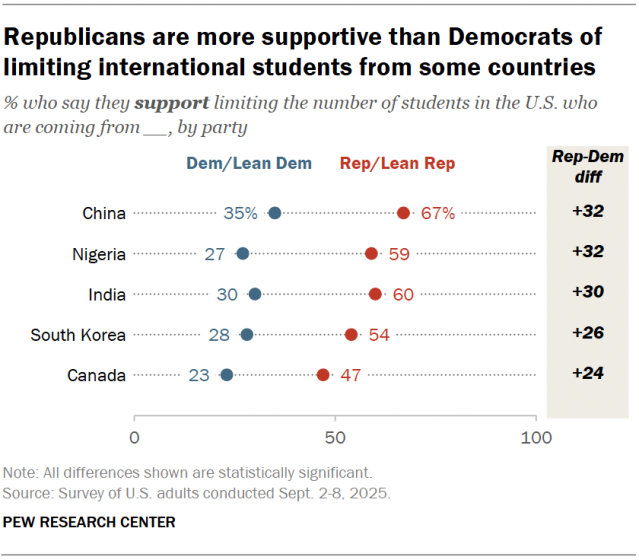
Republicans are more likely than Democrats to support limiting the number of students from each of the countries we asked about. And a majority of Republicans feel this way about students from China, Nigeria, India and South Korea.
Views by age
Adults ages 50 and older are more likely than younger adults to support restrictions on international students from each of these countries. These age differences exist among Republicans and Democrats alike.
Views by education
Adults without a bachelor’s degree are more likely than adults with bachelor’s degree or more education to support limiting foreign students. This is true within both parties for all countries asked about, with one exception: Republicans with and without a bachelor’s degree are equally likely to support limiting the number of students from China.
How views have changed over time
We also asked about limiting the number of students from China – but not students from any other country – in 2021. Support for this policy among U.S. adults overall has decreased marginally since 2021, from 55% to 50%.
This decrease is largely because Democrats have become significantly less likely to support restricting the number of Chinese students; Republicans’ support is unchanged.
Should the government be able to cancel the visas of students who have criticized U.S. foreign policy?
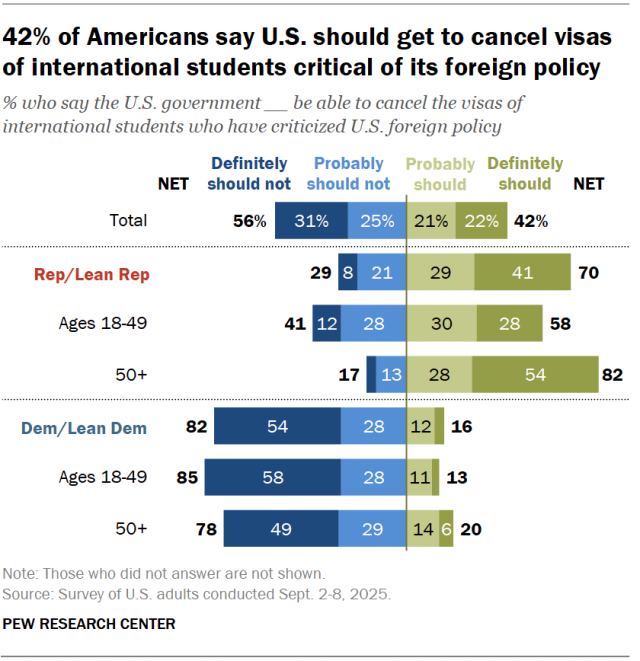
About four-in-ten Americans (42%) say the U.S. government should be able to cancel the visas of international students who have criticized U.S. foreign policy. Another 56% say the government should not be able to do this.
Views by party and age
Republicans are significantly more likely than Democrats to say the U.S. government should be able to revoke international student visas based on criticism of U.S. foreign policy (70% vs. 16%).
But younger and older Republicans diverge somewhat. While majorities of Republicans across age groups support the government having the ability to cancel student visas, Republicans ages 50 and older are more likely than those ages 18 to 49 to support this (82% vs. 58%). And older Republicans are about twice as likely as younger Republicans to say the government should definitely be able to do this.
Older Democrats are also slightly more likely than younger ones to say the government should be able to cancel visas in this situation (20% vs. 13%).
Within both parties, adults with a bachelor’s degree or more education are more likely than those without to say the U.S. should not be able to cancel student visas for this reason.
Do Americans know how many international students are enrolled in U.S. colleges?
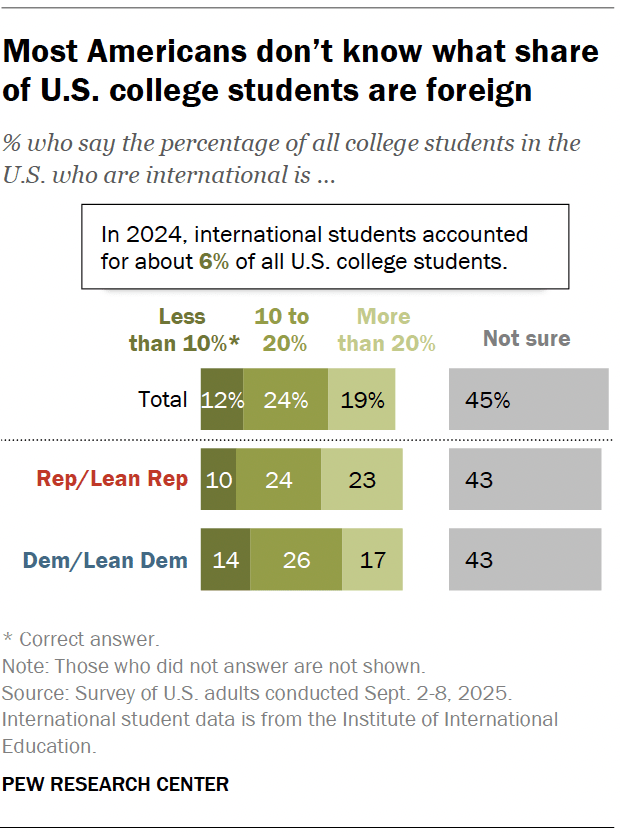
We also asked Americans what share of college students in the U.S. they think are international students. We offered three answer options: “Less than 10%,” “10% to 20%” or “More than 20%.”
As of the 2023-24 academic year, this share was around 6%. But only 12% of Americans correctly chose the option “Less than 10%.” More than four-in-ten guessed that the percentage was more than 10%. Another 45% said they were not sure.
Democrats were slightly more likely than Republicans to choose the correct answer option (14% vs. 10%), though relatively few in each party did so. Republicans were more likely than Democrats to incorrectly guess that the share of foreign college students exceeds 20% (23% vs. 17%).
Note: Here are the questions used for this analysis, the topline and the survey methodology.


