
After climbing steadily from 2000 to 2017, the share of U.S. young adults living with their parents has fallen somewhat in recent years.
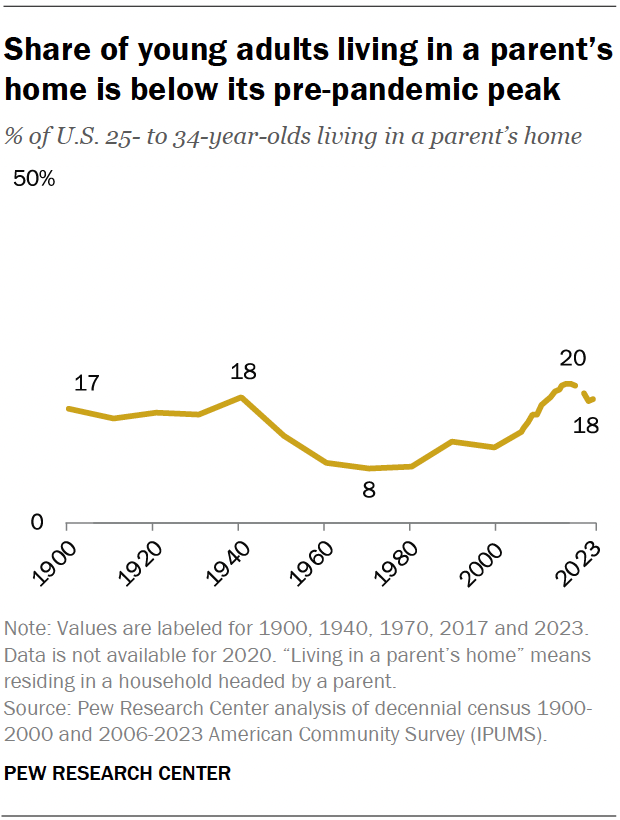
In 2023, 18% of adults ages 25 to 34 were living in a parent’s home. And young men were more likely than young women to live at home (20% vs. 15%).
A majority of young adults living with a parent say the arrangement is good for their finances, but they’re less enthusiastic about its impact on their social life.
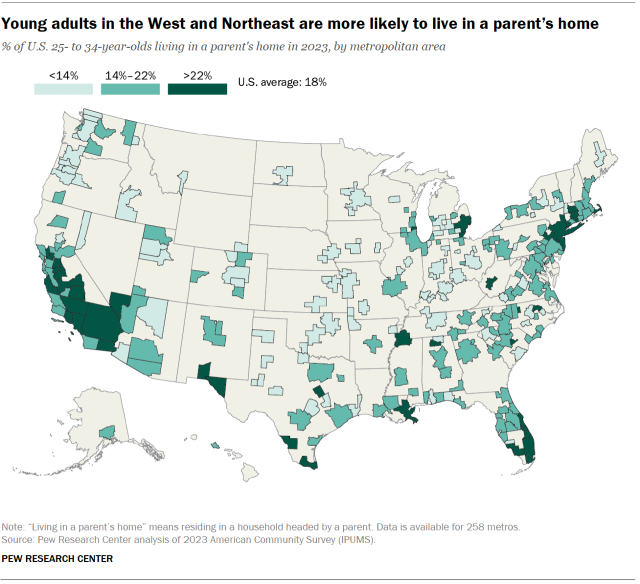
The shares of young adults living in a parent’s home also vary widely by region and metro area, according to a new Pew Research Center analysis of government data.
U.S. metro areas with the highest and lowest shares of young adults living in their parent’s home
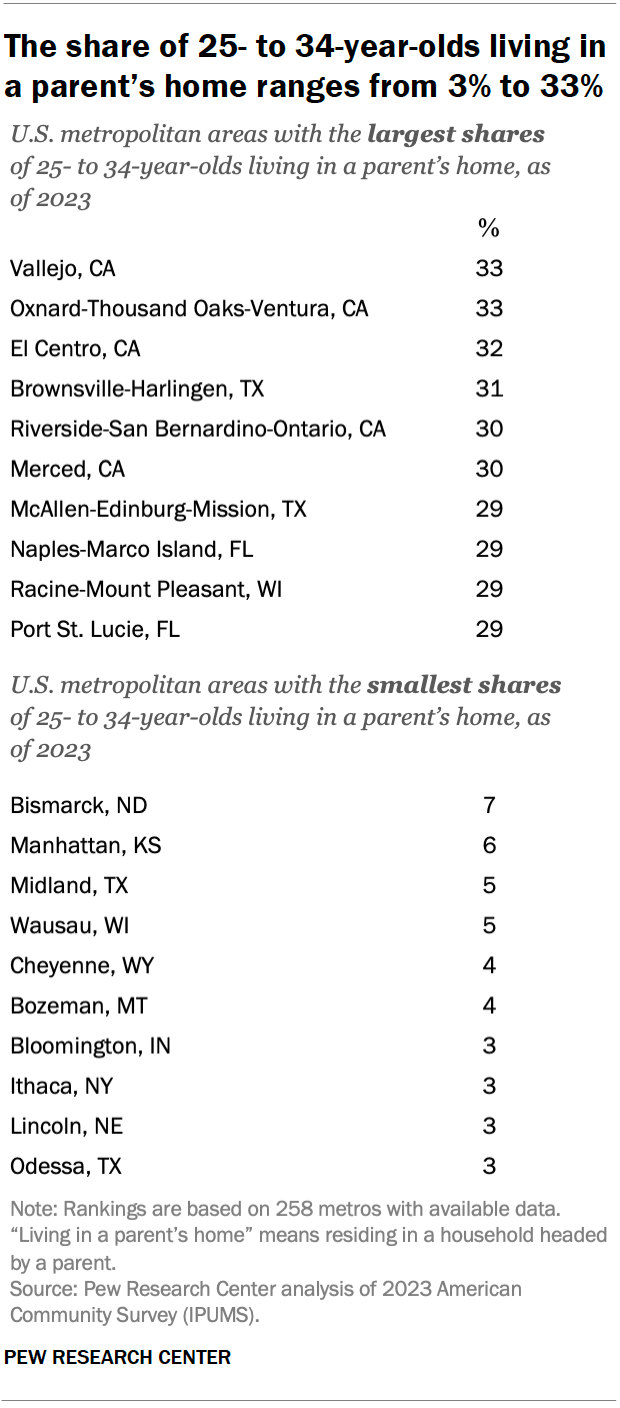
In 2023, the two U.S. metropolitan areas with the highest shares of 25- to 34-year-olds living in a parent’s home were Vallejo, California, and Oxnard-Thousand Oaks-Ventura, California, each with 33%.
At the other end of the spectrum, only about 3% of young adults lived in a parent’s home in Odessa, Texas; Lincoln, Nebraska; Ithaca, New York; and Bloomington, Indiana.
Nine of the 10 metros with the highest shares of young adults living at home were in California, Texas or Florida.
Comparing regions of the country, young adults in the Midwest were the least likely to live at home, followed by those in the South. Those in the West were more likely to live at home than their peers in the South, and young adults in the Northeast were the most likely to live at home.
How do race and ethnicity factor into young adults’ living arrangements?
White young adults are less likely than their Asian, Hispanic and Black counterparts to live in a parent’s home, according to previous Center research. And metropolitan areas with a higher-than-average share of White adults among the young adult population tend to have a lower-than-average share of young adults living in a parent’s home. This pattern holds, for the most part, in the metro areas with the highest and lowest shares of young adults living in a parent’s home.
For example, in Merced, California, 30% of 25- to 34-year-olds live in their parent’s home, and 18% of Merced’s young adults are White. This is significantly lower than the share of young adults who are White across the 258 metros where data is available (48%).
An exception is Racine-Mount Pleasant, Wisconsin, where 29% of young adults live in a parent’s home and 60% are White.
With a couple of exceptions, the 10 metros with the lowest shares of young adults living in a parent’s home have a higher-than-average share of White young adults. For example, 4% of young adults in Bozeman, Montana, live in a parent’s home, and 77% of all young adults there are White.
Among the metros with below-average shares of White young adults, the median metro has 21% of young adults living at home. In the metros with above-average shares of White young adults, the median metro has 14% of young adults living in a parent’s home.
How do employment and housing costs factor into young adults’ living arrangements?
Unemployment rates have also been linked with young adults’ living arrangements. When it is difficult to find work, young adults are more likely to live in a parent’s home. However, in this analysis of 2023 data, we did not find a strong link between unemployment and young adults’ living arrangements across metro areas.
Still, there are some examples where the pattern holds. In El Centro, California, 8.2% of young adults were unemployed in 2023, and 32% were living in a parent’s home. The overall unemployment rate that year for adults ages 25 to 34 was 4.4% across the 258 metros analyzed.
At the other end of the spectrum, 1.4% of young adults in Cheyenne, Wyoming, were looking for work and only 4% were living in a parent’s home.
Interestingly, housing costs are not associated with the rates of young adults living at home. In 2023, the share of 25- to 34-year-olds living with a parent in a metro did not vary based on the median rent in that area.
Note: For the shares of young adults living in a parent’s home and other metro characteristics for the 258 U.S. metropolitan areas included in this analysis, download this spreadsheet.
