Pew Research Center

FOR RELEASE APRIL 7, 2026

Where Do Americans Get Health Information, and What Do They Trust?

<em>Health care providers are the most common source of health information for Americans, who view them as more accurate than other sources.</em>

BY Giancarlo Pasquini, Galen Stocking, Emma Kikuchi, Isabelle Pula and Eileen Yam

FOR MEDIA OR OTHER INQUIRIES:

Communications Department
202.419.4372
www.pewresearch.org

RECOMMENDED CITATION

Pew Research Center, April 2026, "Where Do Americans Get Health Information, and What Do They Trust?"

About Pew Research Center

Pew Research Center is a nonpartisan, nonadvocacy fact tank that informs the public about the issues, attitudes and trends shaping the world. It does not take policy positions. The Center conducts public opinion polling, demographic research, computational social science research and other data-driven research. It studies politics and policy; news habits and media; the internet and technology; religion; race and ethnicity; international affairs; social, demographic and economic trends; science; research methodology and data science; and immigration and migration. Pew Research Center is a subsidiary of The Pew Charitable Trusts, its primary funder.

© Pew Research Center 2026

About this research

This Pew Research Center report looks at Americans’ views on health information and how they view their own health.

Why did we do this?

Pew Research Center does research to help the public, media and decision-makers understand important topics. This research builds on our longstanding work studying Americans’ views of medicine and health to explore how Americans view sources of health information.

Learn more about Pew Research Center, our research on medicine and health and other research on science and society.

How did we do this?

For this report, we surveyed 5,111 U.S. adults from Oct. 20 to 26, 2025. Everyone who took part in this survey is a member of the Center’s American Trends Panel. The survey represents the views of the full U.S. adult population.

Here are the survey questions used for this report, the detailed responses and the survey methodology.

Table of contents

  • About Pew Research Center
  • About this research
  • Where Do Americans Get Health Information, and What Do They Trust?
  • What do Americans want from their health information sources?
  • Users of social media and AI chatbots for health information are more likely to say they are convenient than accurate
  • Americans value their health – but many face challenges in taking care of it
  • Roughly a third of young adults have negative views of their mental health
  • Acknowledgments
  • Methodology
  • Appendix A: Supplemental tables on health information questions
  • Appendix B: Supplemental tables on health ratings

Where Do Americans Get Health Information, and What Do They Trust?

<em>Health care providers are the most common source of health information for Americans, who view them as more accurate than other sources.</em>

Key takeaways:

  • Health care providers are a key source for health information: 85% of Americans say they get health information from health care providers at least sometimes, making them the most common of seven sources we asked about. And a majority see them as providing information that is highly accurate.

  • Many Americans also want to hear people’s real-life stories. About two-thirds (66%) say they get health information at least sometimes from people experiencing a similar health issue as them.

  • Smaller shares are getting health information at least sometimes from newer sources like social media (36%) and artificial intelligence (AI) chatbots (22%).

  • Half of Americans struggle to determine the accuracy of health information: 12% say it is extremely or very difficult to know if the health information they come across is accurate, and 38% say it is somewhat difficult.

  • Most Americans say they come across conflicting health information. And when they do, 54% say it is at least somewhat difficult to know which information to trust.

In an era with unprecedented access to health information, the vast majority of Americans still turn to health care providers for health information, according to a new Pew Research Center study. Many also look to major health websites such as WebMD.

But Americans’ health sources aren’t limited to medical experts. Many Americans (66%) also learn from others going through similar health experiences. And some get health information from social media (36%) or AI chatbots (22%) at least sometimes.

Within this landscape, Americans don’t always find it easy to determine what information is trustworthy. Half of Americans say it is at least somewhat difficult to judge if health information is accurate, and a similar share (54%) has a hard time knowing what to trust when they come across conflicting health information.

Overall, however, Americans are more likely to have confidence in the accuracy of the health information they get from health care providers and major health websites compared with other sources.

These findings are from a survey of 5,111 U.S. adults conducted from Oct. 20 to 26, 2025. Building on our body of work around Americans’ views of medicine and health, we did this study to understand how Americans make sense of today’s crowded health information environment in a moment in which the number of potential sources of health information are expanding. The study explores what Americans want from their health sources and how Americans view their own health, including challenges to their health.

This study covers Americans’ views on the following topics:

  • What do Americans want from their health information sources?
  • Users of social media and AI chatbots for health information are more likely to say they are convenient than accurate
  • Americans value their health – but many face challenges in taking care of it
  • Roughly a third of young adults have negative views of their mental health

Americans’ sources of health information

Americans hear about health from a wide array of people, platforms and institutions, some beyond the medical establishment. But when asked how often they get health information from each of the seven sources we asked about, health care providers are at the top of the list.
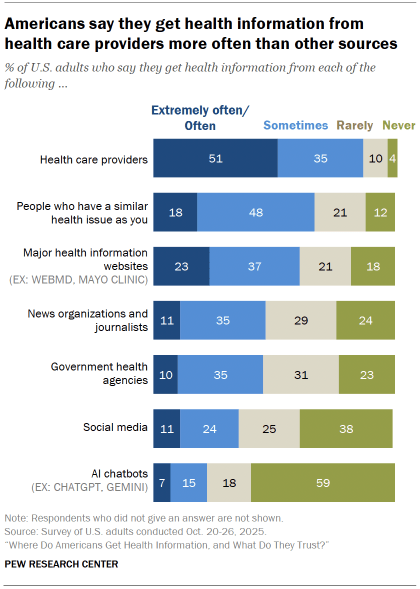
Chart shows Americans say they get health information from health care providers more often than other sources

The vast majority of Americans (85%) say they at least sometimes get health information from health care providers, including 51% who say they often or extremely often turn to doctors and other medical workers.

A majority of Americans (60%) also say they turn to major health websites, such as WebMD or Mayo Clinic at least sometimes.

But in addition to these medical sources, many Americans also learn from other people who share their health experiences. Roughly two-thirds (66%) of Americans say they at least sometimes get health information from people who are facing health issues that are similar to their own.

Just under half of Americans get health information at least sometimes from journalists and news organizations (46%) and government health agencies (45%). Meanwhile, social media and AI chatbots — two newer digital information sources – are the least common sources of health information we asked about. Still, 36% of Americans say they at least sometimes get health information from social media, and 22% say the same about AI chatbots.

For a detailed analysis of Americans’ views of the health information they get from these sources, refer to “Users of social media and AI chatbots for health information are more likely to say they are convenient than accurate.”

Overall, getting health information from multiple sources is the norm: Most Americans (73%) say they get health information at least sometimes from three or more of the seven sources we asked about.

Differences by health insurance coverage, education and age

Health insurance coverage: While large shares of Americans regardless of health insurance status say they get health information from health care providers, those with health insurance coverage are more likely to do so. But people without coverage are more likely than those with coverage to turn to social media and AI chatbots, although at much lower rates overall.

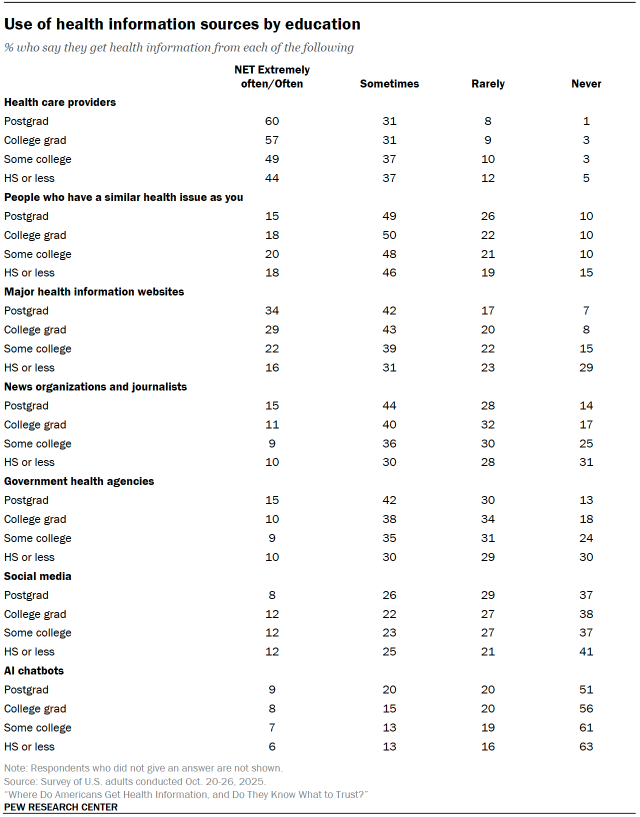
Education: Americans with more formal education are more likely than those with less formal education to get health information at least sometimes from most of the sources we asked about. These differences are widest on major health information websites. However, there are no education differences on the frequency of getting information from people with a similar health issue and from social media.

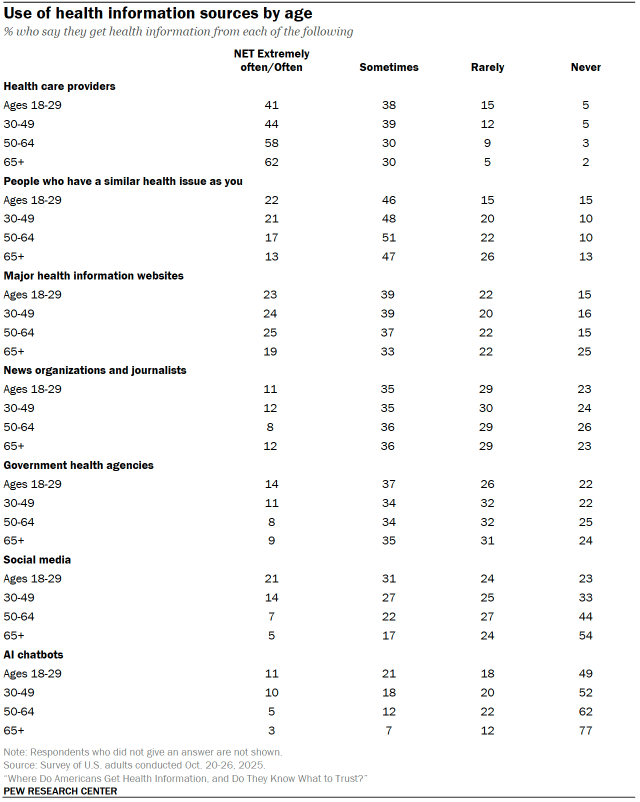
Age: Older adults are more likely than younger Americans to say they at least sometimes get health information from health care providers (though providers are the most common source across age groups). Younger adults are more likely than their older peers to turn to social media and AI chatbots at least sometimes.

Further demographic details on Americans’ health information sources are in the appendix.

How Americans view the accuracy of health information sources they use

The sheer volume of health information can be overwhelming, and it’s not always easy to decide which sources get the facts right. To get a sense of how Americans navigate this environment, we asked them to rate the accuracy of the information they get from each source.
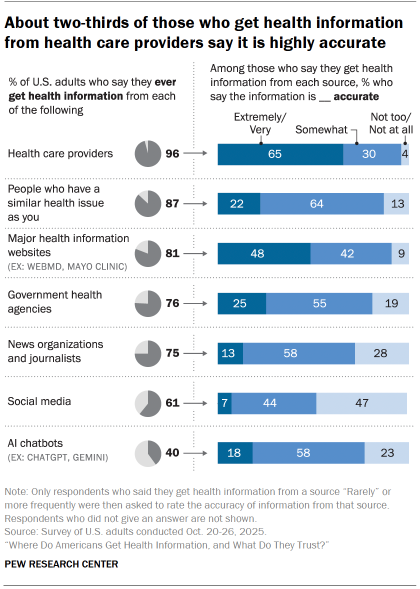
Chart shows About two-thirds of those who get health information from health care providers say it is highly accurate

Nearly all Americans get health information from health care providers, and a majority find this information highly accurate – much more than any other source.

About two-thirds (65%) of those who ever get health information from providers say the information is extremely or very accurate. Very few (4%) say it is not too or not at all accurate.

Views of the accuracy of information on websites such as WebMD or Mayo Clinic are also generally positive. About half (48%) of those who get health information from these websites say they’re highly accurate, far more than the 9% who say the information is not too or not at all accurate.

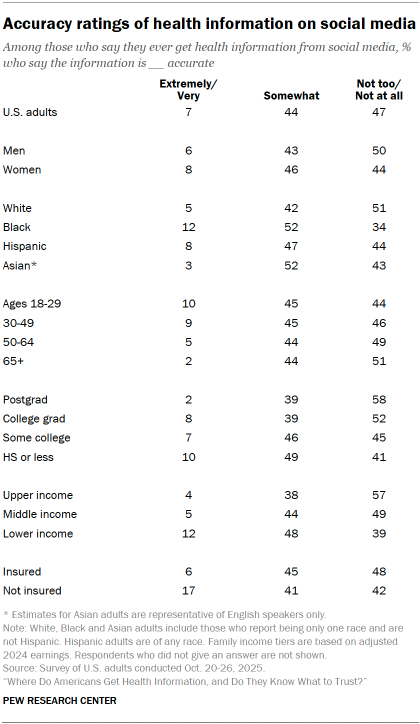
Social media stands out for the lowest ratings of accuracy. Roughly half (47%) of Americans who get health information from social media say that information is not too or not at all accurate, while just 7% say it is highly accurate. Views of health information from AI chatbots are more mixed, with a majority of those who turn to them saying the information is somewhat accurate.

Here’s our in-depth look at views of social media and AI chatbots as health information sources.

Notably, for each of the seven sources we asked about, sizable shares give mixed ratings saying the information is somewhat accurate.

Differences by education, income, party and health insurance coverage

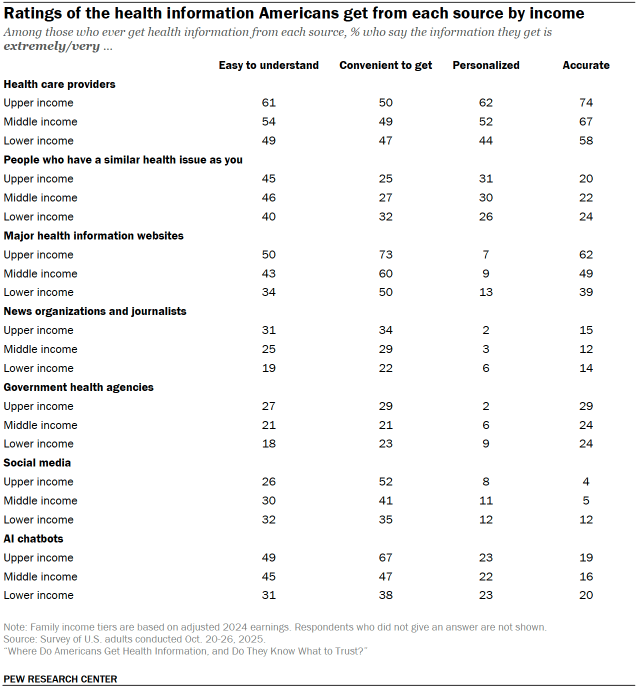
Education and income: Americans with more education or higher incomes are more likely to say information they get from health care providers and major health websites is highly accurate.

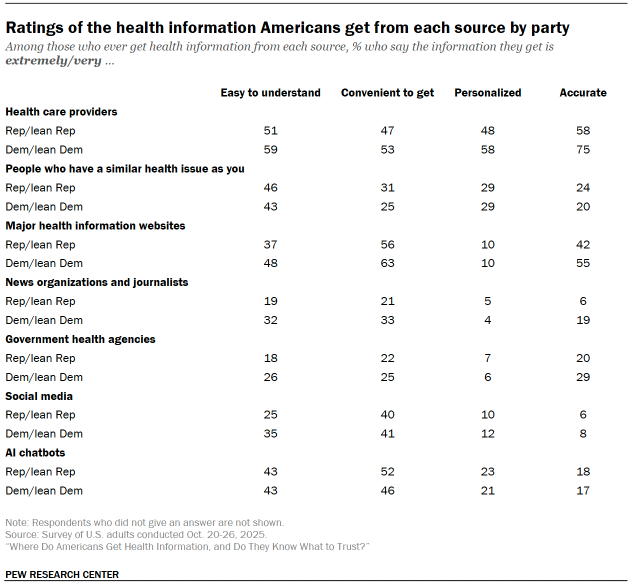
Party: Three-quarters of Democrats and Democratic-leaning independents rate the information they get from health care providers as highly accurate. This is more than the share of Republicans and leaners who say the same (58%). This pattern of Democrats having more confidence than Republicans in the accuracy of the sources they use extends to major health websites (55% vs. 42%), government health agencies (29% vs. 20%) and news organizations and journalists (19% vs. 6%).

Health insurance coverage: Those with health insurance are more likely than those without insurance to say the information they get from health care providers is highly accurate (67% vs. 47%). They are also more likely to say the same about information they get from major health websites (50% vs. 31%).

For more detailed demographic breakdowns, refer to the appendix.

Do Americans have difficulty determining if health information is accurate?

Americans have mixed experiences judging the accuracy of health information they get in general – regardless of the source.
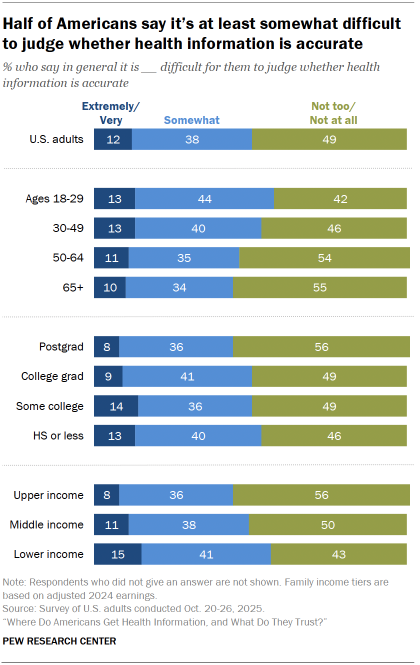
Chart shows Half of Americans say it’s at least somewhat difficult to judge whether health information is accurate

Half of Americans say it is at least somewhat difficult to judge the accuracy of health information, including 12% who say this is extremely or very difficult. On the other hand, 49% say it is not too or not at all difficult to make this judgment.

These challenges are reported across demographic groups, with at least four-in-ten adults in each age, education and income group saying judging health information accuracy is at least somewhat difficult. Still, some key differences emerge:

Younger adults are somewhat more likely than their older counterparts to have at least some difficulty evaluating accuracy. For example, 57% of adults under 30 say this, compared with 44% of those ages 65 and older.

Americans with lower incomes are also more likely to report at least some difficulty judging the accuracy of health information. And while education differences are modest, Americans with a postgraduate degree are less likely than those with lower education levels to say they find judging the accuracy of health information at least somewhat difficult.

Coming across conflicting health information

When Americans get health information, they sometimes have to weigh it against something they’ve already heard that seems contradictory. Is chocolate good or bad for you? Will a health product cure an ailment or make it worse?
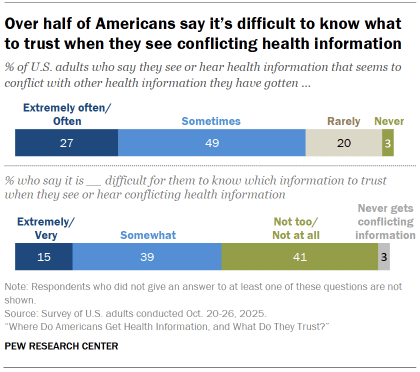
Chart shows Over half of Americans say it’s difficult to know what to trust when they see conflicting health information

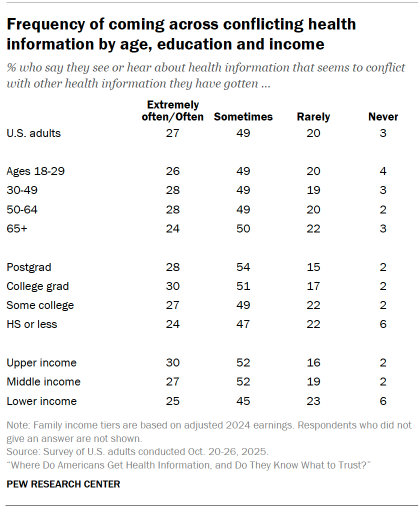
A large majority of Americans (76%) say they see this kind of conflicting health information at least sometimes, including about a quarter (27%) who see it often or extremely often.

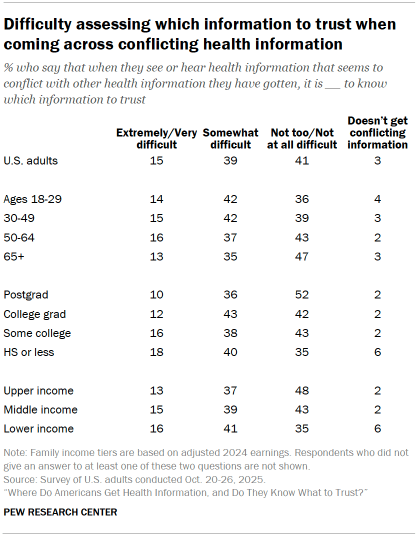
When Americans do encounter conflicting health information, just over half (54%) say they have at least some difficulty knowing which information to trust. This share is larger than the 41% of Americans who say knowing which information to trust is not too or not at all difficult.

As with judging the accuracy of health information they come across in general, older Americans and those with more income or education report fewer difficulties. For more demographic details, refer to the appendix.

Americans who see conflicting health information more frequently have more difficulty knowing which source to trust. Those who come across conflicting health information often or extremely often (71%) are more likely than those who come across it sometimes (58%) or rarely (32%) to say it is at least somewhat difficult for them to know which information to trust.
What do Americans want from their health information sources?

Key takeaways:

  • Three-quarters of Americans say it’s highly important that their health information sources have medical training. Similar shares say the same for being transparent about potential conflicts of interest (73%) and being easy to understand (72%).

  • When asked to rate sources of health information, health care providers get the best ratings overall. Roughly half or more of Americans who get health information from health care providers say it is extremely or very easy to understand (55%), personalized (52%) and convenient to get (49%).

  • Beyond health care providers, a few sources stand out as being extremely or very easy to understand: Roughly four-in-ten or more Americans who get health information from people facing similar health issues as them (44%), major health information websites (42%) and artificial intelligence (AI) chatbots (41%) say this.

  • For many of the sources we asked about, such as social media, news organizations and government health agencies, far more say the information they get is not personalized to them than say it is highly personalized.

Americans have choices for where they get their health information, but what qualities are they looking for in those sources? A Pew Research Center survey finds that most say having medical training, being transparent and easy to understand are highly important.

We also asked Americans to rate the information they get from seven common sources of health information by how understandable, personalized and convenient they are to access. Health care providers receive positive ratings on each of these qualities, consistent with Americans saying they highly value medical training. And Americans give similarly high marks to AI chatbots, major health websites and peers with similar health issues on at least one of these measures.

This is not the case when it comes to accuracy. Health care provider information consumers rate the information they get as highly accurate, but users of other sources are less likely to rate the information they get as highly accurate.

For more details about how Americans rate each source on accuracy, refer to our analysis of where Americans get health information and what they trust.
This study is part of a larger survey on Americans’ health information sources and views on their personal health, conducted Oct. 20-26, 2025, among 5,111 U.S. adults.

The characteristics Americans look for in sources of health information

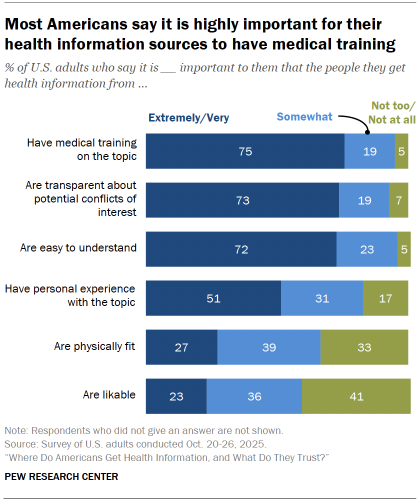
Chart shows Most Americans say it is highly important for their health information sources to have medical training

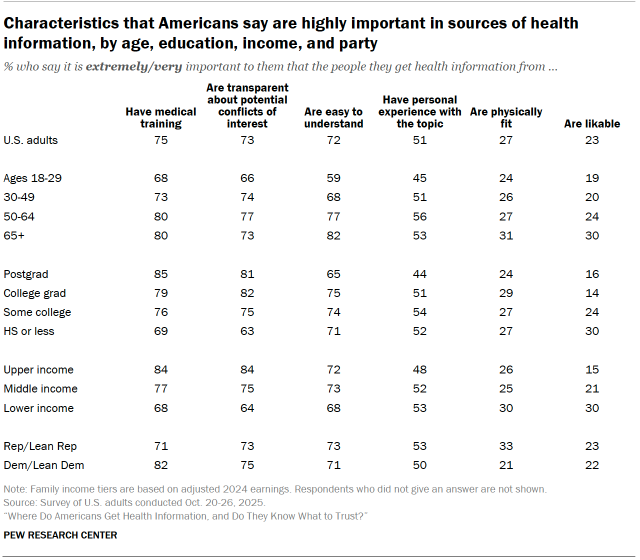
Most Americans are generally looking for expertise, transparency and clarity when they get health information. Roughly three-quarters say it is extremely or very important that the people they get health information from have relevant medical training (75%), are transparent about any conflicts of interest (73%) and are easy to understand (72%).

About half (51%) of U.S. adults place high value on their sources having personal experience with the health issue they are giving information about.

Smaller shares say these people’s physical fitness (27%) and likability (23%) are extremely or very important, while at least a third say these characteristics are not too or not at all important.

Differences by age, education, income and party

Age: Older adults are more likely than younger adults to say being easy to understand is extremely or very important in their health information sources. For example, adults ages 65 and older are more likely than those under 30 to say this is highly important (82% vs. 59%). Age differences between older and younger adults are more modest for all other characteristics we asked about.

Education and income: Adults with higher levels of formal education or income are especially likely to value transparency and medical training in their health information sources. Conversely, those with less formal education or lower incomes are more likely to say likability is extremely or very important compared with those with higher education or income.

Party: Majorities of both Republicans and Democrats say it is highly important for their sources to have medical training, but more Democrats than Republicans say this (82% vs. 71%). And while far smaller shares say it is highly important for those sources to be physically fit, more Republicans than Democrats hold this view (33% vs. 21%). For all other characteristics we asked about, there are no differences between Republicans and Democrats.

For more details on each of these differences, refer to the appendix.

Rating health information sources on ease of understanding, convenience and personalization

In addition to asking Americans about the characteristics they value in their health information sources, we also asked how often they get health information from seven sources. Each source’s health information consumers were asked to rate how easy to understand, convenient to get and personalized the information is. We also asked Americans to rate the accuracy of the sources they use for health information. (For more about ratings of accuracy, read “Where do Americans get health information, and what do they trust?”)

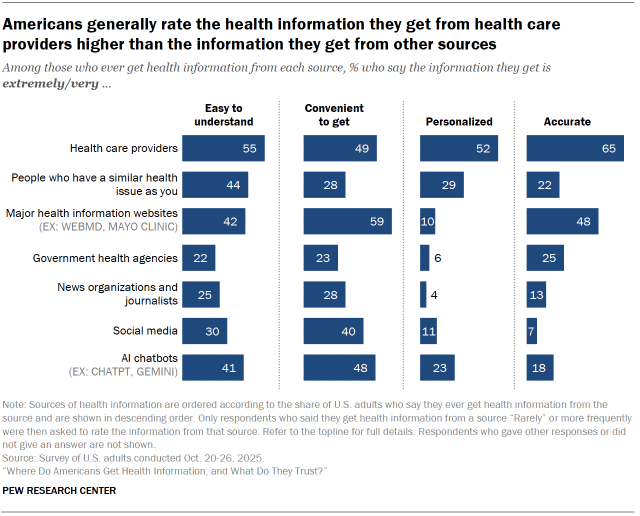
Chart shows Americans generally rate the health information they get from health care providers higher than the information they get from other sources

Roughly half or more of adults who get health information from health care providers say it is highly easy to understand, convenient to get, personalized and accurate. In general, no other sources gets as high marks across the board. And aside from health care providers, views are particularly negative when it comes to ratings of how personalized the information is.

How easy to understand are common health information sources?

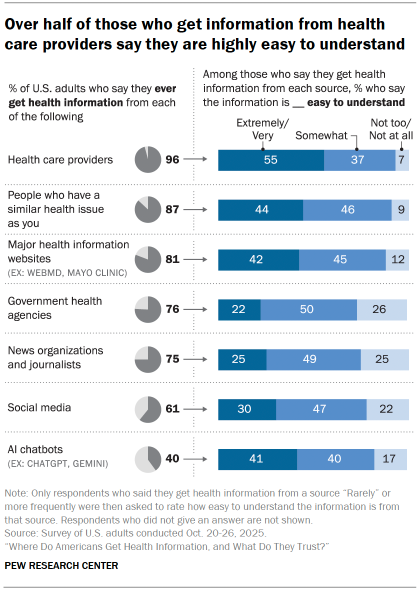
Americans rate health care providers ahead of other health information sources when it comes to how easy they are to understand. A slim majority (55%) of Americans who get health information from health care providers say it is extremely or very easy to understand.

Chart shows Over half of those who get information from health care providers say they are highly easy to understand

But at least four-in-ten also think the information they get from several other sources is easy to understand, including people with similar health issues (44%), major health websites (42%), and AI chatbots (41%). And for each of these sources, the share who say this is more than double the share who say the information is not too or not at all easy to understand.

Smaller shares of adults who get health information from social media, news organizations and journalists or government health agencies say the health information from those sources is extremely or very easy to understand. In the cases of news organizations and government health agencies, similar shares say the information is not too or not at all easy to understand.

And overall, sizable shares express mixed views on each source. Roughly four-in-ten or more health information consumers say this information is somewhat easy to understand.

Differences by age
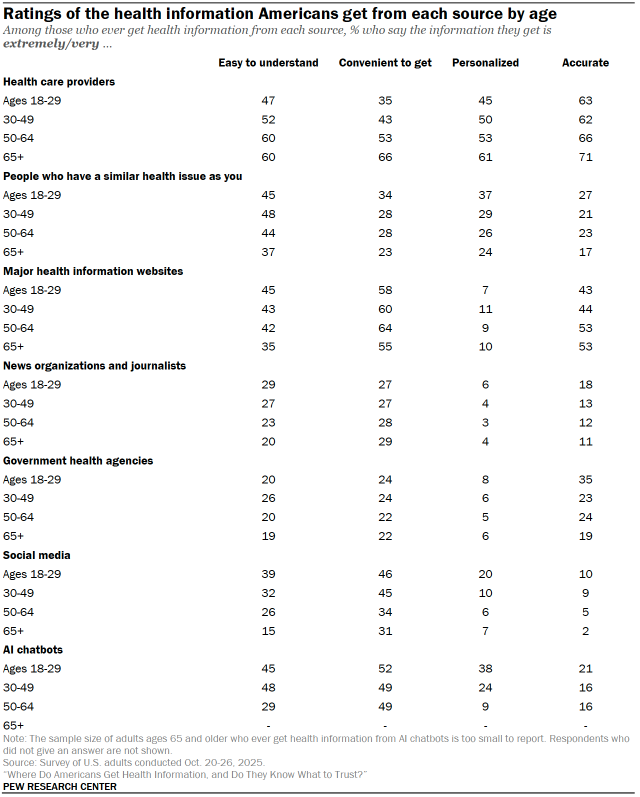
  • Among those who get health information from AI chatbots and social media, adults under 50 are more likely than those 50 and older to say the information they get from these sources is easy to understand (47% vs. 31% for AI chatbots and 35% vs. 21% for social media).
  • Among those who get health information from health care providers, adults ages 50 and older are more likely than those under 50 to say the information is extremely or very easy to understand (60% vs. 50%).
Differences by education
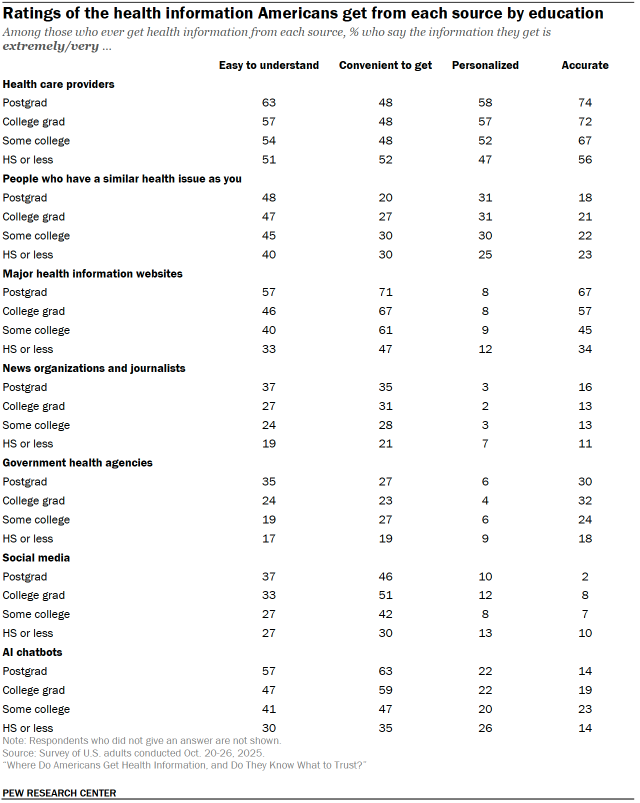
  • For each source that we asked about, adults with at least a four-year college degree are more likely than those without a four-year degree to say the information they get is extremely or very easy to understand.
  • For example, there are education gaps in ratings of understandability among those who get information from AI chatbots (52% vs. 35%) and major health information websites (50% vs. 36%).

For additional demographic details, refer to the appendix.

How convenient is it to get health information from each source?

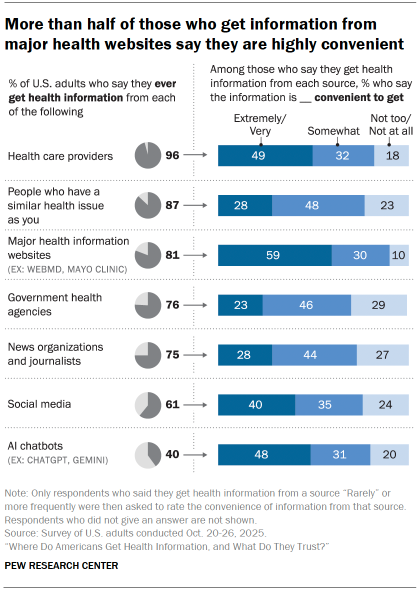
More users of major health websites find them highly convenient than any other source we asked about. A majority (59%) of Americans who get health information from this source say it is extremely or very convenient to get.

Chart shows More than half of those who get information from major health websites say they are highly convenient

Roughly half of those who get health information from health care providers (49%) and AI chatbots (48%) say it is highly convenient to get, though far more Americans get this kind of information from health care providers than chatbots.

A slightly smaller share of Americans who get health information on social media (40%) say it is highly convenient to do so.

And for each of these four sources, larger shares say the information they get is extremely or very convenient to get than say it is not too or not at all convenient.

Fewer say that news organizations (28%), people with similar health conditions (28%) and government health agencies (23%) offer health information in a highly convenient way. For these sources, similar shares say the information they get is not too or not at all convenient.

And similar to ratings of understandability, sizable shares have mixed views of each source’s convenience. At least three-in-ten say the information they get from each of these sources is somewhat convenient to get.

Differences by age
  • Among those who get health information from health care providers, adults ages 50 and older are more likely than those under 50 to say the information is extremely or very convenient to get (59% vs. 40%).
  • Among those who get health information from social media, adults under 50 are more likely than those 50 and older to say the information is highly convenient to get (45% vs. 33%).
Differences by education

Those who have a four-year college degree are more likely than those who do not to say the information they get from major health websites is highly convenient (69% vs. 54%). There’s a similar pattern for other sources we asked about:

  • AI chatbots (61% vs. 40%)
  • Social media (49% vs. 36%)
  • News organizations (33% vs. 25%)

These differences are largely driven by those with a high school degree or less education giving low ratings.

Differences by health insurance coverage
  • Adults who are covered by health insurance are more likely than those who are not covered to say the health information they get from health care providers is extremely or very convenient to get (51% vs. 31%).
  • Those without health insurance coverage are more likely than those with coverage to say the information they get from people facing a similar health issue is extremely or very convenient to get (36% vs. 27%).

For additional demographic details, refer to the appendix.

How personalized is the information from each source?

While Americans generally give more positive than negative ratings to many of the sources we asked about, this is not the case on the question of whether this information is personalized.

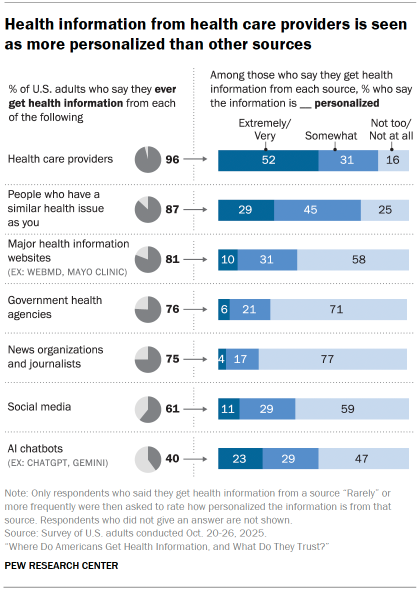
Chart shows Health information from health care providers is seen as more personalized than other sources

When it comes to news organizations, government health agencies, social media and major health websites, majorities say the health information they get is not too or not at all personalized. About one-in-ten or fewer in each case say the information is highly personalized.

AI chatbots generate unique messages in each conversation, and 23% of those who get health information this way say it is extremely or very personalized. Still, roughly half (47%) say health information they get from chatbots is not too or not at all personalized. For more on views of AI chatbots as a source of health information, refer to “Users of social media and AI chatbots for health information are more likely to say they are convenient than accurate.”

Americans view information from health care providers as much more personalized. About half (52%) of those who get information from providers say it is highly personalized, and far fewer (16%) say it is not too or not at all personalized.

Differences by age
  • Among those who get health information from health care providers, those ages 65 and older are more likely than all younger age groups to say the information they get is highly personalized (61% of those 65 and older, compared with no more than 53% of any other age group).
  • Among adults who get health information from others who are facing a similar health issue, adults under 30 (37%) are more likely than those in older age groups (e.g. 24% of those in the 65 and older group) to say the information they get is highly personalized.
  • And among those who get health information from social media and AI chatbots, adults ages 50 and older are more likely than younger adults to say the information is not too or not at all personalized.
  • For social media, 69% of those 50 and older say this compared with 58% of those 30 to 49 and 45% of those under 30.
  • For AI chatbots, 63% of those ages 50 and older say this while 47% of those 30 to 49 and 27% of those under 30 say the same.
Differences by education
  • Majorities of adults who get health information from news organizations, government health agencies, major health websites and social media say the information is not too or not at all personalized. But those with a high school degree or less education are less likely than those with at least a four-year college degree to say this.
  • Adults with a four-year degree are more likely than those with less education to say the information they get from health care providers is highly personalized (58% vs. 49%).

Users of social media and AI chatbots for health information are more likely to say they are convenient than accurate

Key takeaways:

  • About a third (36%) of Americans say they get health information from social media at least sometimes, and 22% say this about artificial intelligence (AI) chatbots.

  • Younger Americans are more likely to use social media at least sometimes for health information than their older peers. These age differences are smaller for AI chatbots.

  • Most social media and AI chatbot health information users do not rate the information they get from these sources as highly accurate or highly personalized. However, sizable shares see them as highly convenient, and for AI chatbots, extremely or very easy to understand.

  • Americans without any form of health insurance are modestly more likely to get health information at least sometimes from these sources than those who do have health insurance.

In a world where health information can come from countless sources outside of a doctor’s visit, social media and AI chatbots offer newer, digital-first avenues to health news and advice for some Americans. But these always-available alternatives don’t necessarily include guarantees of accuracy or understandability, and some of that shows in how users evaluate them.

This analysis is part of a broader Pew Research Center survey on Americans’ health information sources and views on their personal health, conducted Oct. 20-26, 2025, among 5,111 U.S. adults. For more information, refer to these sections:

  • Where do Americans get health information, and what do they trust?
  • What do Americans want from their health information sources?

How often do Americans get health information from social media and chatbots?

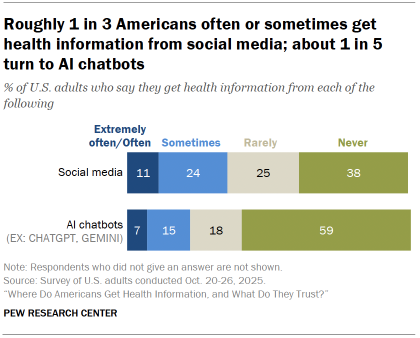
Chart shows Roughly 1 in 3 Americans often or sometimes get health information from social media; about 1 in 5 turn to AI chatbots

About a third (36%) of U.S. adults get health information from social media at least sometimes, while 22% say the same about AI chatbots. This is lower than the share of Americans who get health information at least sometimes from several other sources:

  • Health care providers (85%)
  • People who have a similar health issue as them (66%)
  • Major health information websites (60%)

For more on how frequently Americans get health information from various sources, refer to “Where do Americans get health information, and what do they trust?”

There’s also a lot of overlap between those who get health information on social media and those getting it from AI chatbots. A majority (61%) of those who at least sometimes get health information from chatbots also say they get it from social media.

This analysis is a deep dive into who gets health information on each platform, and how they feel about the accuracy, personalization, convenience, and ease of understanding of that content.

Social media health information

Who gets health information on social media?

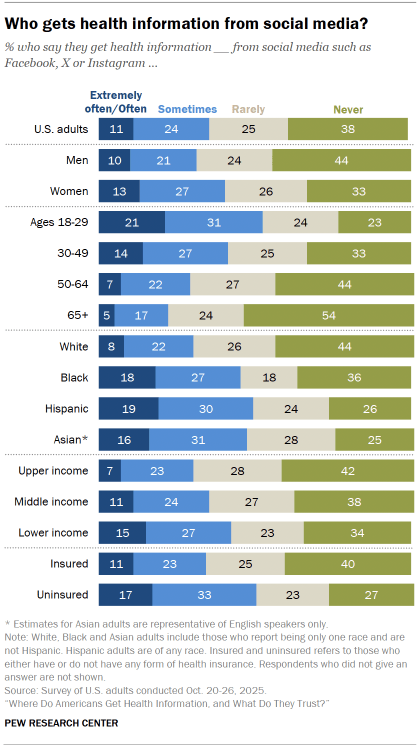
Chart shows Who gets health information from social media?

Social media offers platforms for a wide range of health messengers, from doctors explaining medical practices to government agencies posting emergency health notices to influencers offering health and wellness tips. But regardless of the messenger, Americans can get health information when scrolling through their feeds – and many do, particularly young adults.

Age: Younger Americans are much more likely than older Americans to get health information from social media. About half (52%) of adults under 30 say they get health information from social media at least sometimes, including about one-in-five who get it often or extremely often. By comparison, about one-in-five adults ages 65 and older (21%) get health information on social media at least sometimes.

Race and ethnicity: Compared with other racial and ethnic groups, White adults are notably less likely to say they get health information at least sometimes on social media.

Income and health insurance coverage: Getting health information on social media at least sometimes is more common among lower-income and uninsured Americans. (Uninsured Americans are also less likely to at least sometimes get health information from health care providers.)

What do users think of social media health information?

Social media is available at all hours and across devices, with content in a variety of formats, styles and depth of explanation. And algorithmic-driven feeds often allow users to find information without looking for it. But health experts have sounded alarms about social media as a vehicle for questionable health claims.

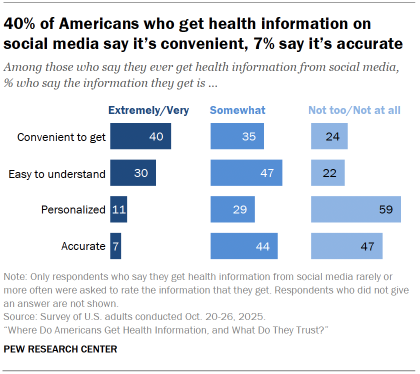
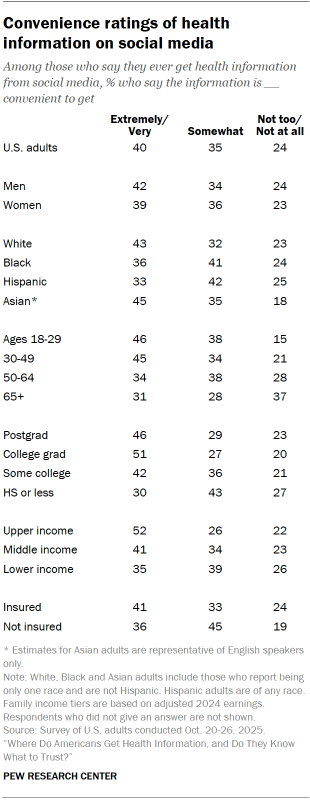
Chart shows 40% of Americans who get health information on social media say it’s convenient, 7% say it’s accurate

Americans who get health information from social media rate the information more negatively than positively when it comes to accuracy and personalization. But they do tilt more positively on its convenience and understandability:

  • Convenient: Four-in-ten say the health information they get on social media is extremely or very convenient to get. Fewer (24%) say it is not too or not at all convenient to get.
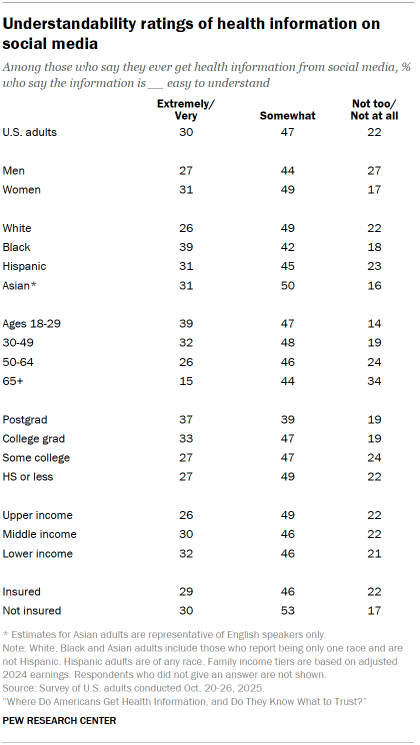
  • Easy to understand: Three-in-ten of those who get health information on social media say the information is extremely or very easy to understand, slightly more than the 22% who say it is not too or not at all easy to understand.
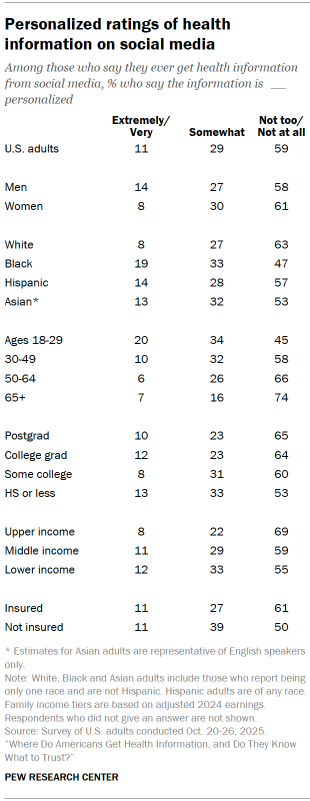
  • Personalized: A majority (59%) of those who get health information on social media say that the information they get is not too or not at all personalized. This share is far larger than the 11% who say it is highly personalized.
  • Accurate: About half (47%) say the information they get is not too or not at all accurate. Far fewer (7%) say that this content is highly accurate. In contrast, about two-thirds (65%) of those who get health information from health care providers say they are highly accurate, as do about half (48%) of those who get health information from major health websites.

For more on ratings of accuracy across seven health information sources, refer to “Where do Americans get health information, and what do they trust?”

Demographic differences

Age: Younger consumers of health information on social media have more positive views of many qualities of this content than older ones. For example, adults under 30 are more likely than those 65 and older to say that the information is highly convenient to get (46% vs. 31%) and easy to understand (39% vs. 15%).

And while there are slight age differences when it comes to accuracy, no more than 10% of any age group say the information they get is highly accurate.

Income and education: Americans with higher levels of income and formal education who get health information from social media are more likely than others to say that this information is not too or not at all accurate. But those with higher income and education levels are also more likely to say the information is highly convenient.

For further detail on views on social media health information by demographic characteristics, refer to the appendix.

Views of frequent consumers of social media health information

The most frequent users – those who get health information from social media often or extremely often – are a bit more positive about the information they get on these platforms. About two-thirds (68%) of these heavy users say the information is highly convenient to get, compared with 34% of those who get health information on social media less frequently. And about a quarter (24%) say it is highly accurate versus 3% of those who get health information on social media less frequently.

Americans tend to want medical expertise, transparency and understandability in their health information sources. But U.S. adults who frequently get health information from social media are a bit more likely than adults overall to value likeability (33% vs. 23%) and physical fitness (38% vs. 27%).

AI chatbot health information

Some AI companies now directly integrate health features into their products, and some young people have been experimenting with uses like getting mental health advice from chatbots. Overall, about two-in-ten (22%) Americans get health information from AI chatbots at least sometimes, including 7% who do so often or extremely often.

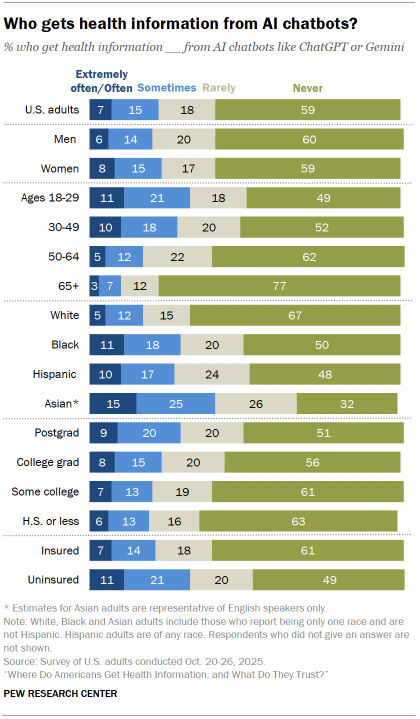
Chart shows Who gets health information from AI chatbots?

Who uses AI chatbots for health information?

Age: Similar to social media, getting health information from chatbots is more common among younger adults. About a third (32%) of adults ages 18 to 29 at least sometimes turn to AI chatbots for health information. This is higher than the share of adults ages 50 to 64 (16%) and those 65 and older (10%) who say the same. Previous Center research has found that younger Americans are also more likely to have heard a lot about AI and to have used ChatGPT for any reason.

Health insurance coverage: Americans who do not have health insurance are more likely to get chatbot health information than those who do have insurance even after accounting for age, income and other factors.

Race and ethnicity: Asian Americans are more likely than other racial and ethnic groups to say they get health information from AI chatbots at least sometimes. Black and Hispanic adults are also more likely than White adults to say they do this.

What do users think of using AI chatbots for health info?

AI chatbots promise conversation at any time, on nearly any topic, including health-related ones. And their interactive nature means that users can follow up with clarifying questions. But some experts have questioned the accuracy of the health information that chatbots provide.

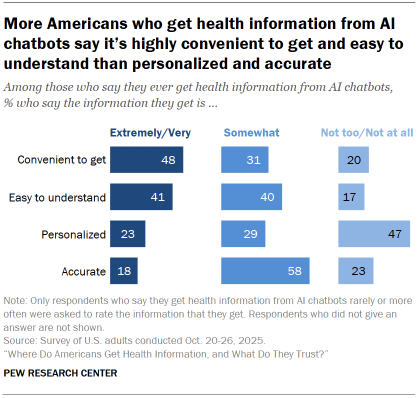
Chart shows More Americans who get health information from AI chatbots say it’s highly convenient to get and easy to understand than personalized and accurate

Americans who get health information from these chatbots tend to find them convenient and easy to understand but not very personalized. And they’re split on the accuracy of this emerging technology:

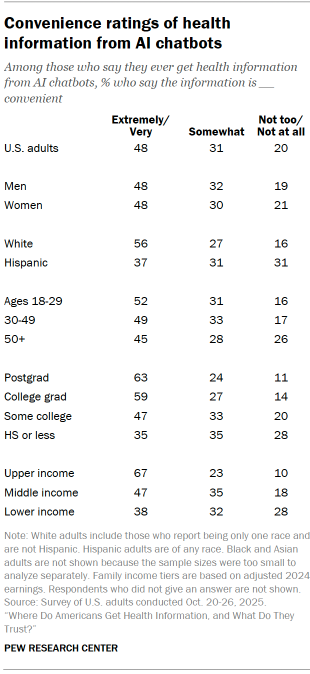
  • Convenient: About half (48%) of chatbot health information users say it is highly convenient.
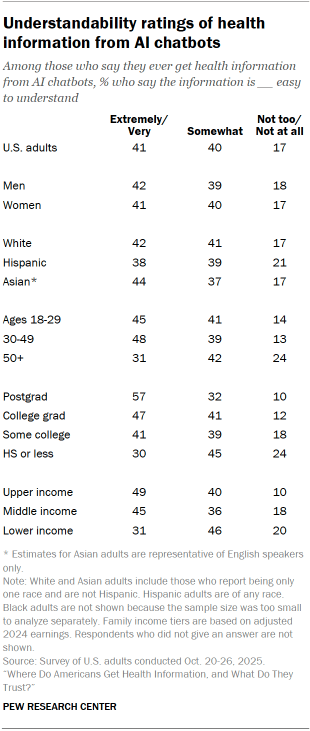
  • Easy to understand: Among those who get health information from AI chatbots, 41% say it’s extremely or very easy to understand.
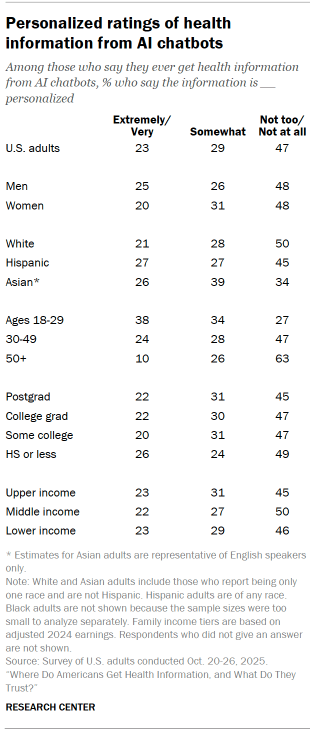
  • Personalized: About a quarter (23%) of chatbot health users say the information is highly personalized, roughly half the share who say it’s not too or not at all personalized (47%).
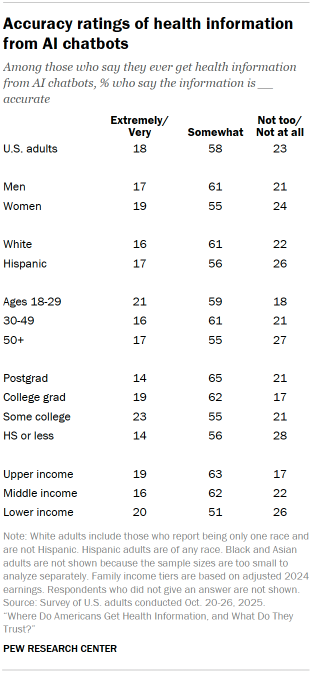
  • Accuracy: Slightly more chatbot health users say they’re not too or not at all accurate as say they’re highly accurate (23% vs. 18%). In contrast, about two-thirds (65%) of those who get health information from health care providers say they are highly accurate, as do about half (48%) of major health website users.

For more on ratings of accuracy across seven health information sources, refer to “Where do Americans get health information, and what do they trust?”

Demographic differences

Age: Among U.S. adults who get health information from AI chatbots, similar shares of older and younger people say the information is accurate and convenient to get. But adults under 50 are more likely than those ages 50 and older to say that this health information is highly personalized (30% vs. 10%) and easy to understand (47% vs. 31%).

Education: Adults with higher levels of formal education are more likely to say that health information from AI chatbots is convenient and easy to understand, similar to the pattern observed for social media.

For further details on views on chatbot health information by demographic characteristic, refer to the appendix.

How do frequent users view chatbot health information differently?

Those who frequently get health information from chatbots rate that information more highly than other users on these dimensions. For instance, among adults who use AI chatbots to get health information often or extremely often, 45% say that the information they get is highly accurate, compared with 13% of those who get health information from chatbots sometimes or rarely. Half of heavy users describe chatbot health information as highly personalized, compared with 17% of those who turn to chatbots less frequently.

Americans value their health – but many face challenges in taking care of it

Key takeaways:

  • Although Americans say many aspects of health – such as getting enough sleep and managing stress – are really important, far fewer say they’re doing a good job at them.

  • Americans face many challenges in taking care of their health, with the price of health care and stress management topping the list.
  • Americans say the biggest motivators for taking care of health are preventing future health issues and being able to go about daily life.

  • Health experiences differ vastly by income levels. Adults with lower incomes are more likely than those with upper incomes to rate their health worse and report facing challenges when taking care of their health.

Do Americans’ health priorities align with their actions? A new Pew Research Center survey finds big differences between how much importance Americans place on health behaviors – like sleeping enough, managing stress or eating healthy – and how well they say they are actually doing them. For majorities of U.S. adults, health care costs, stress, and not having enough time or motivation get in the way of taking care of their health.

This analysis looks at Americans’ challenges and motivations when it comes to maintaining their health. It builds on our previous research on Americans’ health attitudes and behaviors. These findings are based on a survey conducted Oct. 20-26, 2025, among 5,111 U.S. adults.
Click through for findings on the following topics of Americans’ personal health:

  • What’s important to maintaining health and how well are Americans doing at it?
  • What are the challenges Americans have when it comes to taking care of their health?
  • How much effort are Americans putting into taking care of their health and why?
  • How income shapes health experiences

Related: Roughly a third of young adults have negative views of their mental health

What’s important to maintaining health and how well are Americans doing at it?

We asked U.S. adults to rate the importance they place on six health-related behaviors: getting enough sleep, managing stress, eating healthy, having good relationships, exercising and getting an annual physical.

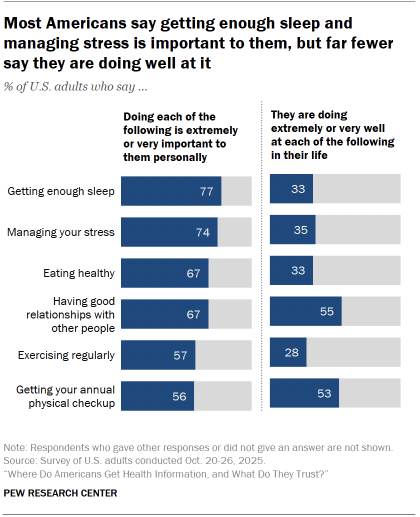
Chart shows Most Americans say getting enough sleep and managing stress is important to them, but far fewer say they are doing well at it

Majorities of Americans say doing each of the six health behaviors is extremely or very important to them personally. For example, about three-quarters of Americans say getting enough sleep and managing stress is highly important to them.

However, despite placing high importance on these healthy behaviors, many Americans express difficulty with them.

Large shares say sleep, managing stress and healthy eating are highly important. But there are large gaps – 34 to 44 percentage points – between the share who say they are highly important and those who say they are doing extremely or very well at them. For example, 77% say getting enough sleep is highly important – but only 33% do really well at getting enough.

There is also a sizable difference between the shares who highly value exercising regularly and those who say they do well at it. A majority (57%) of Americans highly value exercise but the share who say they are doing great at exercising regularly is 28%.

Getting an annual physical exam is the only behavior we don’t see a gap: 56% say it is highly important to them, and 53% report they do extremely or very well at it.

What are the challenges Americans have when it comes to taking care of their health?

It’s clear that many Americans value having a healthy lifestyle, but many face challenges in doing so.

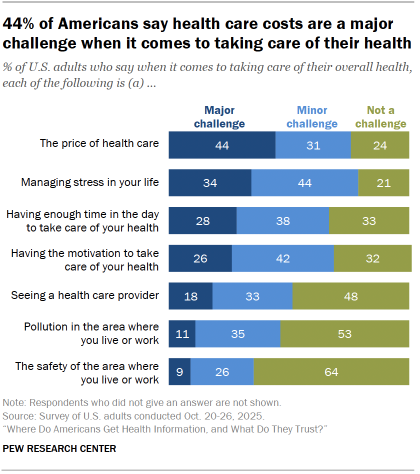
Chart shows 44% of Americans say health care costs are a major challenge when it comes to taking care of their health

Of the seven potential barriers we asked about, the largest share say the price of health care is a major challenge: 44% say this. The cost of health care also is at the top of Americans’ overall economic concerns.

About a third say managing stress is a major challenge, and roughly three-in-ten say the same about having the time and motivation.

Overall, 67% of U.S. adults say at least one of these items is a major challenge for them, while 33% say none of these items are a major challenge for them.

How much effort are Americans putting into taking care of their health and why?

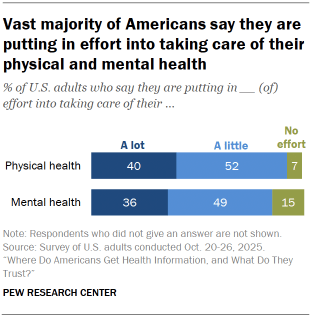
All this is not to say that Americans aren’t putting any effort in: Just 7% say they put no effort into their physical health, and 15% say that about their mental health.

Chart shows Vast majority of Americans say they are putting in effort into taking care of their physical and mental health

In fact, substantial shares say they are putting a lot of effort into taking care of their physical (40%) and mental health (36%).

Americans across racial and ethnic groups give similar ratings of their mental health, yet Black adults are more likely than other groups to say they put a lot of effort into taking care of their mental health. Over half (54%) of Black adults say they are putting a lot of effort into taking care of their mental health, compared with 32% of White, 38% of Hispanic and 29% of Asian adults. Black adults are also slightly more likely than these groups to say they are putting in a lot of effort into their physical health.

Reasons for putting in effort into taking care of their health

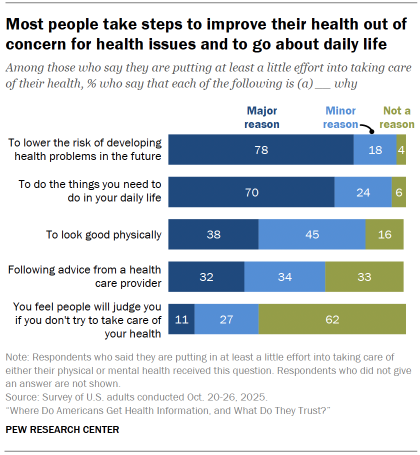
There are many reasons why someone would want to put effort into their health, from following medical advice to looking good. But the most common motivations are practical: lowering their risk of developing health problems (78% say this is a major reason) and to do the things they need to do in their daily lives (70%).

Chart shows Most people take steps to improve their health out of concern for health issues and to go about daily life

Far smaller shares point to other reasons. About four-in-ten (38%) say looking good physically is a major reason, and 32% say the same for following advice from a health care provider. Few (11%) say that concern about other people judging them is a major reason.

How income shapes health experiences

Research has shown that people with higher incomes often have better health in part due to better living conditions, greater access to nutritious food and lower barriers to health care.

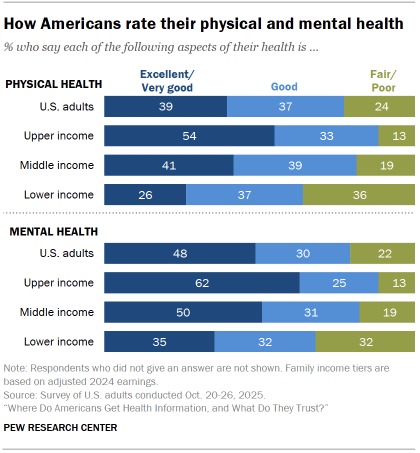
This connection between income and health comes through in this survey: higher-income Americans rate their physical and mental health better than those with lower incomes.

Chart shows How Americans rate their physical and mental health

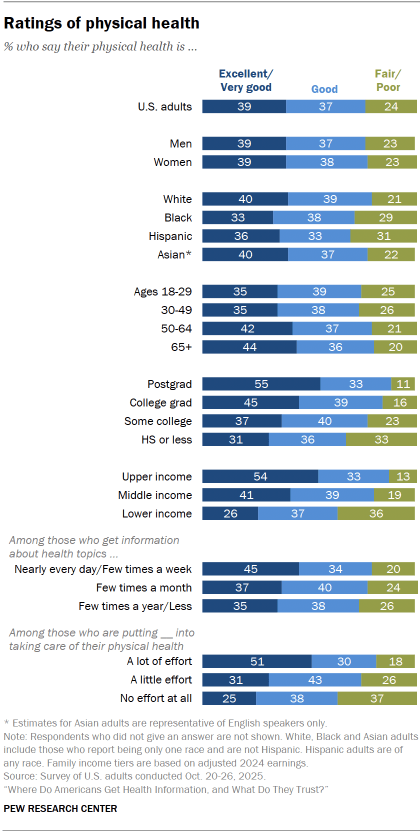
Over half (54%) of those with upper incomes rate their physical health as excellent or very good, compared with 26% of those in the lowest income tier. Adults with lower incomes are more likely to rate their physical health as just fair or poor (36%).

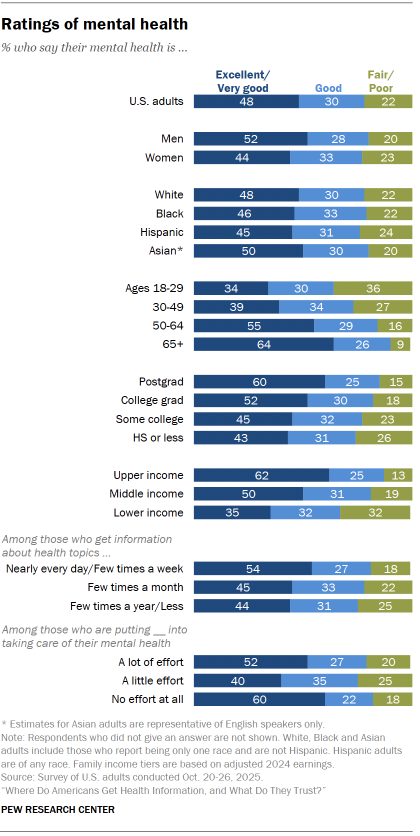
This pattern largely repeats for mental health. There is a 27 percentage point gap between adults with upper incomes compared with those with lower incomes on rating their mental health highly (62% vs. 35%).

Upper-income adults are also more likely to say they are doing extremely or very well at all six specific health behaviors surveyed. For example, 44% of adults with upper incomes say they are great at exercising regularly, compared with 28% of those with middle incomes and 20% of those with lower incomes. Refer to the appendix for more details and breaks.

Income and health challenges

Adults with lower incomes are more likely to report facing challenges when it comes to taking care of their health than adults with higher incomes.

Income gaps appear across all seven health challenges, but the largest gaps are on access to health care – both in price and provider availability. Over half (54%) of adults in the lowest income tier say the price of health care is a major challenge for them, compared with 28% among upper-income adults. Similarly, there is a 21-point gap between adults in the upper- and lower-income tiers who say seeing a health care provider is a major challenge (28% vs. 7%). Nearly all upper-income adults (97%) have health insurance, but coverage drops to 82% of those with lower incomes.

Local environments can also play an important role in health outcomes. While few across income tiers say pollution and safety in their areas are major challenges for them, those with lower incomes are much more likely than those with upper incomes to say these are at least minor challenges for them (49% vs. 20% on safety, 57% vs. 37% on pollution).

Roughly a third of young adults have negative views of their mental health

Key takeaways:

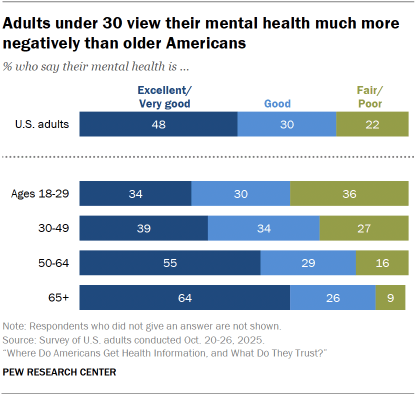
  • Adults under 30 rate their mental health much more negatively than older adults. Roughly a third (36%) say their mental health is fair or poor, while 16% of adults ages 50 to 64 and 9% of adults 65 and older say the same.

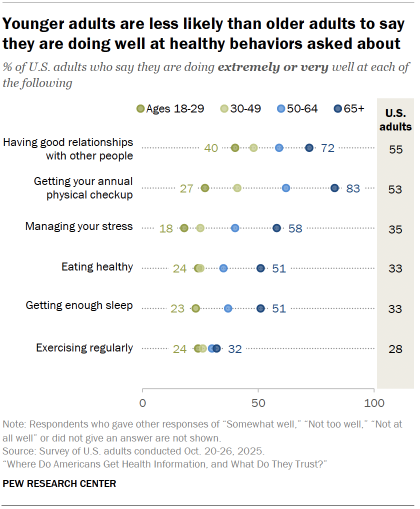
  • Four-in-ten adults under 30 say they are doing well at having good relationships with other people, and roughly two-in-ten say this about managing their stress. These shares are much smaller compared with older adults who say the same.

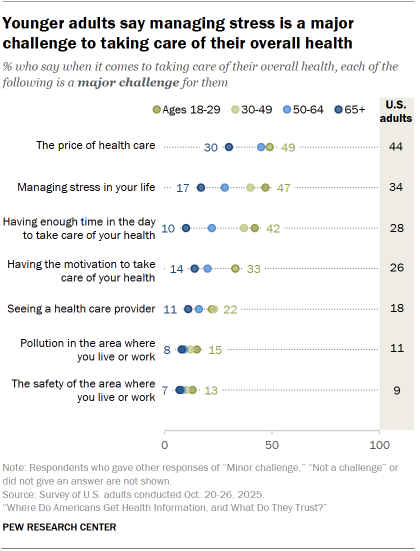
  • Roughly half (47%) of adults under 30 say managing stress in their lives is a major challenge to taking care of their health. This share is 30 percentage points higher than adults ages 65 and older who say the same.

Health experts say the United States is in the midst of a mental health crisis. According to a new Pew Research Center study, young adults fare much worse than older adults when it comes to their ratings of their mental health, social relationships and stress management.

Building on previous Center research on social connections and mental health support, this new analysis looks at how well younger adults say they’re taking care of their health and how they see their health challenges. This study is part of a larger survey on Americans’ health information sources and views on their personal health, conducted Oct. 20-26, 2025, among 5,111 U.S. adults.

For a broader look at Americans’ views of their health, read “Americans value their health – but how well do they think they’re taking care of it?”

And for more about Americans’ views of health information, read “Where do Americans get health information, and what do they trust?”

Chart shows Adults under 30 view their mental health much more negatively than older Americans

Roughly a third (36%) of adults under 30 rate their mental health as fair or poor. That share is 20 percentage points larger than the share of adults ages 50 to 64 who say the same and 27 points larger than those ages 65 and older who say this. And in the same vein, the share of these young adults who say their mental health is excellent or very good is 30 points lower than the oldest adults.

How well do young adults say they care for their health?

Consistent with their more negative rating of their mental health, adults under 30 are much less likely than older adults to say they’re doing well at managing their stress and having good social relationships.

Chart shows Younger adults are less likely than older adults to say they are doing well at healthy behaviors asked about

About one-in-five adults under 30 (18%) say they are managing their stress extremely or very well. This share is smaller than all older age groups, but the age gap is especially wide between the youngest and oldest adults. Adults under 30 are 40 percentage points less likely than those ages 65 and older to say they are doing this well (18% vs. 58%).

There is a similarly wide gap between the youngest and oldest adults in saying they are doing well at having good relationships with other people. Among adults under 30, 40% say they’re doing this extremely or very well – more than any of the behaviors asked about. Still, older adults are faring much better, with 72% of adults ages 65 and older saying the same. This age pattern echoes previous Center research showing higher levels of loneliness among younger adults.

There are also age differences in ratings of behaviors that have direct ties to physical health, but that can also impact mental health.

When it comes to eating healthy and getting enough sleep, nearly identical shares – about a quarter – of adults under 30 and those ages 30 to 49 say they are doing extremely or very well at each of these behaviors. But older adults, especially those 65 and older, are about twice as likely to say this.

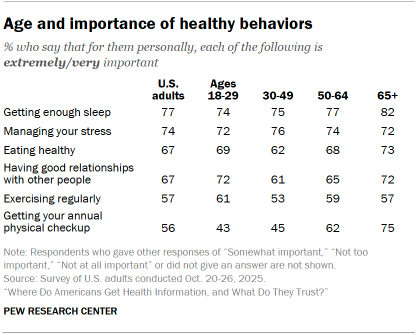
It’s not just daily health habits: Younger adults are also less likely to say they are getting an annual physical checkup, which can help prevent disease and sometimes include mental health screenings. This behavior has the widest age gap of those we asked about with 83% of adults ages 65 and older say they are doing well at this and 27% of those under 30 saying the same.

Exercising regularly doesn’t follow this pattern – but largely because older adults give themselves worse ratings than they do on other behaviors. While the share of younger adults who say they exercise regularly is in line with other behaviors, the share of older adults who say this is lower than any other behavior asked about.

And while overall there are clear age differences in the shares who say they are doing these behaviors well, large shares of adults in each age group say that each of these behaviors is highly important for them. The one behavior with large age differences in importance is getting an annual physical. Refer to the appendix for more details.

What do younger adults see as major health challenges?

Related to their ratings of how they’re managing stress, adults under 30 are more likely than older Americans to see stress management as a major challenge. Roughly half (47%) of these young adults say managing their stress is a major challenge to taking care of their overall health.Far fewer adults ages 65 and older (17%) say the same.

Chart shows Younger adults say managing stress is a major challenge to taking care of their overall health

There are also sizable age differences when it comes to having enough time and having motivation to take care of their health. About four-in-ten adults under 30 (42%) see time as a major challenge, and 33% say the same about motivation. These shares are higher than adults older than 50, especially compared with those 65 and older.

The pattern of age differences is subtly different when it comes to saying the price of health care is a major challenge. Very similar shares – roughly half or slightly less – of all age groups under 65 say this is a major challenge. Three-in-ten (30%) of those ages 65 and older – who qualify for Medicare – say this.

How much effort do young adults put into their mental health?

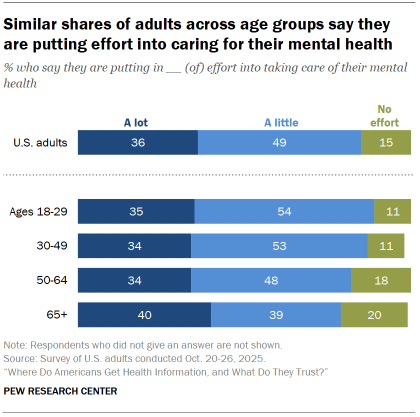
While young adults rate their mental health worse than older adults, the amount of effort Americans under 30 say they put into caring for their mental health isn’t that different from older adults.

Chart shows Similar shares of adults across age groups say they are putting effort into caring for their mental health

The share of adults under 30 who say they put a lot of effort into their mental health (35%) is nearly identical to the share of adults in older age groups who say the same and only slightly smaller than the share of oldest adults who say the same.

And in each age group, large majorities say they are putting in at least a little effort into their mental health. Adults under 50 are only slightly more likely than those ages 50 and older to say this (88% vs. 80%).

Acknowledgments

This report is made possible by The Pew Charitable Trusts. It is a collaborative effort based on the input and analysis of the following individuals. Find related reports online at: pewresearch.org/science.

Primary research team       

Eileen Yam, Director, Science and Society Research
Galen Stocking, Associate Director, Science and Society Research
Brian Kennedy, Senior Researcher
Giancarlo Pasquini, Research Associate
Emma Kikuchi, Research Analyst      
Isabelle Pula, Research Assistant      

Editorial and graphic design          

Mia Hennen, Editorial Assistant
Peter Bell, Associate Director, Design and Production        

Communications and web publishing      

Haley Nolan, Communications Manager
Ashley Loprete, Communications Associate
Reem Nadeem, Digital Producer

In addition, the project benefited greatly from the guidance of Pew Research Center’s methodology team: Courtney Kennedy, Andrew Mercer, Ashley Amaya, Dorene Asare-Marfo, Dana Popky, Anna Brown and Arnold Lau.

Methodology

The American Trends Panel survey methodology

Overview

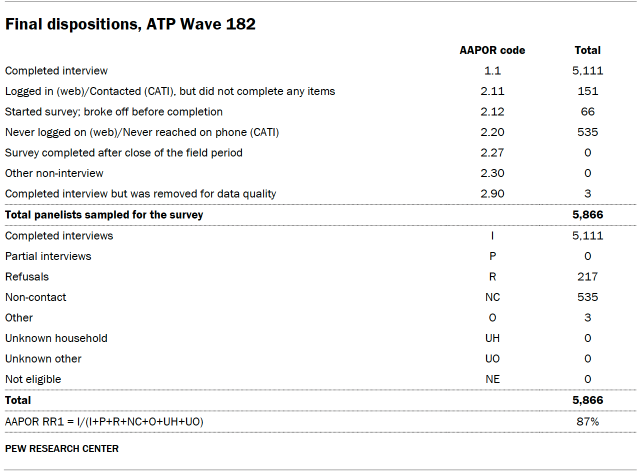
Data in this report comes from Wave 182 of the American Trends Panel (ATP), Pew Research Center’s nationally representative panel of randomly selected U.S. adults. The survey was conducted from Oct. 20 to 26, 2025. A total of 5,111 panelists responded out of 5,866 who were sampled, for a survey-level response rate of 87%.

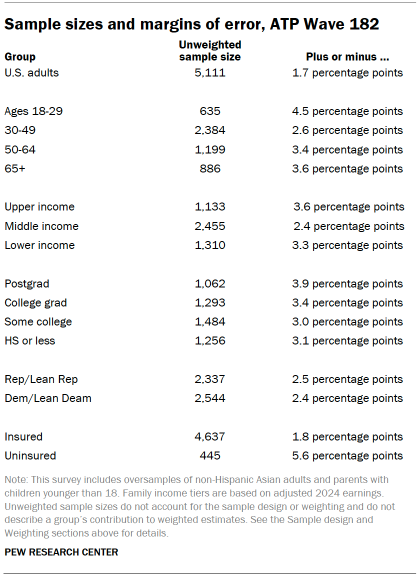
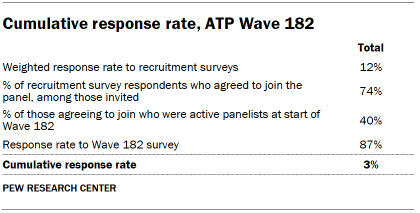
The cumulative response rate accounting for nonresponse to the recruitment surveys and attrition is 3%. The break-off rate among panelists who logged on to the survey and completed at least one item is 1%. The margin of sampling error for the full sample of 5,111 respondents is plus or minus 1.7 percentage points.

The survey includes an oversample of non-Hispanic Asian adults and parents with children younger than 18 in order to provide more precise estimates of the opinions and experiences of these smaller demographic subgroups. These oversampled groups are weighted back to reflect their correct proportions in the population.

SSRS conducted the survey for Pew Research Center via online (n=4,945) and live telephone (n=166) interviewing. Interviews were conducted in both English and Spanish.

To learn more about the ATP, read “About the American Trends Panel.”

Panel recruitment

Since 2018, the ATP has used address-based sampling (ABS) for recruitment. A study cover letter and a pre-incentive are mailed to a stratified, random sample of households selected from the U.S. Postal Service’s Computerized Delivery Sequence File. This Postal Service file has been estimated to cover 90% to 98% of the population.1 Within each sampled household, the adult with the next birthday is selected to participate. Other details of the ABS recruitment protocol have changed over time but are available upon request.2 Prior to 2018, the ATP was recruited using landline and cellphone random-digit-dial surveys administered in English and Spanish.

A national sample of U.S. adults has been recruited to the ATP approximately once per year since 2014. In some years, the recruitment has included additional efforts (known as an “oversample”) to improve the accuracy of data for underrepresented groups. For example, Hispanic adults, Black adults and Asian adults were oversampled in 2019, 2022 and 2023, respectively.

Sample design

The overall target population for this survey was noninstitutionalized persons ages 18 and older living in the United States. It featured a stratified random sample from the ATP in which non-Hispanic Asian adults and parents with children younger than 18 were selected with certainty. The remaining panelists were sampled at rates designed to ensure that the share of respondents in each stratum is proportional to its share of the U.S. adult population to the greatest extent possible. Respondent weights are adjusted to account for differential probabilities of selection as described in the Weighting section below.

Questionnaire development and testing

The questionnaire was developed by Pew Research Center in consultation with SSRS. The web program used for online respondents was rigorously tested on both PC and mobile devices by the SSRS project team and Pew Research Center researchers. The SSRS project team also populated test data that was analyzed in SPSS to ensure the logic and randomizations were working as intended before launching the survey.

Incentives

All respondents were offered a post-paid incentive for their participation. Respondents could choose to receive the post-paid incentive in the form of a check or gift code to Amazon.com, Target.com or Walmart.com. Incentive amounts ranged from $5 to $20 depending on whether the respondent belongs to a part of the population that is harder or easier to reach. Differential incentive amounts were designed to increase panel survey participation among groups that traditionally have low survey response propensities.

Data collection protocol

The data collection field period for this survey was Oct. 20 to 26, 2025. Surveys were conducted via self-administered web survey or by live telephone interviewing.

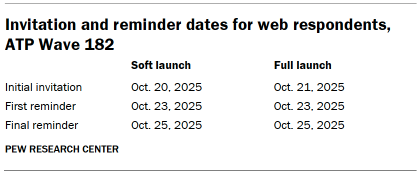
For panelists who take surveys online:3 Postcard notifications were mailed to a subset on Oct. 20.4 Survey invitations were sent out in two separate launches: soft launch and full launch. Sixty panelists were included in the soft launch, which began with an initial invitation sent on Oct. 20. All remaining English- and Spanish-speaking sampled online panelists were included in the full launch and were sent an invitation on Oct. 21.

Table shows Invitation and reminder dates for web respondents, ATP Wave 182

Panelists participating online were sent an email invitation and up to two email reminders if they did not respond to the survey. ATP panelists who consented to SMS messages were sent an SMS invitation with a link to the survey and up to two SMS reminders.

For panelists who take surveys over the phone with a live interviewer: Prenotification postcards were mailed on Oct. 17. Soft launch took place on Oct. 20 and involved dialing until a total of four interviews had been completed. All remaining English- and Spanish-speaking sampled phone panelists’ numbers were dialed throughout the remaining field period. Panelists who take surveys via phone can receive up to six calls from trained SSRS interviewers.

Data quality checks

To ensure high-quality data, Center researchers performed data quality checks to identify any respondents showing patterns of satisficing. This includes checking for whether respondents left questions blank at very high rates or always selected the first or last answer presented. As a result of this checking, three ATP respondents were removed from the survey dataset prior to weighting and analysis.

Weighting

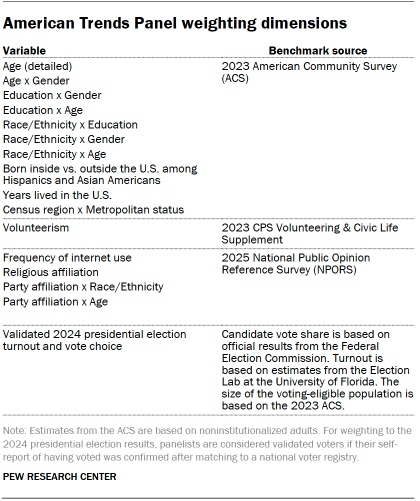
The ATP data is weighted in a process that accounts for multiple stages of sampling and nonresponse that occur at different points in the panel survey process. First, each panelist begins with a base weight that reflects their probability of recruitment into the panel. These weights are then calibrated to align with the population benchmarks in the accompanying table to correct for nonresponse to recruitment surveys and panel attrition. If only a subsample of panelists was invited to participate in the wave, this weight is adjusted to account for any differential probabilities of selection.

Among the panelists who completed the survey, this weight is then calibrated again to align with the population benchmarks identified in the accompanying table and trimmed at the 1st and 99th percentiles to reduce the loss in precision stemming from variance in the weights. Sampling errors and tests of statistical significance take into account the effect of weighting.

Table shows American Trends Panel weighting dimensions

The following table shows the unweighted sample sizes and the error attributable to sampling that would be expected at the 95% level of confidence for different groups in the survey.

Table shows Sample sizes and margins of error, ATP Wave 182

Sample sizes and sampling errors for other subgroups are available upon request. In addition to sampling error, one should bear in mind that question wording and practical difficulties in conducting surveys can introduce error or bias into the findings of opinion polls.

A note about the Asian adult sample

This survey includes a total sample size of 559 Asian adults. The sample primarily includes English-speaking Asian adults and, therefore, may not be representative of the overall Asian adult population. Despite this limitation, it is important to report the views of Asian adults on the topics in this study. As always, Asian adults’ responses are incorporated into the general population figures throughout this report.

How family income tiers are calculated

Family income data reported in this study is adjusted for household size and cost-of-living differences by geography. Panelists then are assigned to income tiers that are based on the median adjusted family income of all American Trends Panel members. The process uses the following steps:

  1. First, panelists are assigned to the midpoint of the income range they selected in a family income question that was measured on either the most recent annual profile survey or, for newly recruited panelists, their recruitment survey. This provides an approximate income value that can be used in calculations for the adjustment.
  2. Next, these income values are adjusted for the cost of living in the geographic area where the panelist lives. This is calculated using price indexes published by the U.S. Bureau of Economic Analysis. These indexes, known as Regional Price Parities (RPP), compare the prices of goods and services across all U.S. metropolitan statistical areas as well as non-metro areas with the national average prices for the same goods and services. The most recent available data at the time of the annual profile survey is from 2023. Those who fall outside of metropolitan statistical areas are assigned the overall RPP for their state’s non-metropolitan area.
  3. Family incomes are further adjusted for the number of people in a household using the methodology from Pew Research Center’s previous work on the American middle class. This is done because a four-person household with an income of say, $50,000, faces a tighter budget constraint than a two-person household with the same income.
  4. Panelists are then assigned an income tier. “Middle-income” adults are in families with adjusted family incomes that are between two-thirds and double the median adjusted family income for the full ATP at the time of the most recent annual profile survey. The median adjusted family income for the panel is roughly $77,800. Using this median income, the middle-income range is about $51,900 to $155,600. Lower-income families have adjusted incomes less than $51,900 and upper-income families have adjusted incomes greater than $155,600 (all figures expressed in 2024 dollars and scaled to a household size of three). A panelist is assigned “no answer” in the income tier variable if they did not provide all three pieces of information needed to calculate their tier (family income, household size and residential address).

Two examples of how a given area’s cost-of-living adjustment was calculated are as follows: the Pine Bluff metropolitan area in Arkansas is a relatively inexpensive area, with a price level that is 19.7% less than the national average. The San Francisco-Oakland-Berkeley metropolitan area in California is one of the most expensive areas, with a price level that is 18.2% higher than the national average. Income in the sample is adjusted to make up for this difference. As a result, a family with an income of $40,200 in the Pine Bluff area is as well off financially as a family of the same size with an income of $59,100 in San Francisco.

Dispositions and response rates

Table shows Final dispositions, ATP Wave 182
Table shows Cumulative response rate, ATP Wave 182

Appendix A: Supplemental tables on health information questions

Table shows Use of health information sources by age
Table shows Use of health information sources by education
Table shows Ratings of the health information Americans get from each source by age
Table shows Ratings of the health information Americans get from each source by education
Table shows Ratings of the health information Americans get from each source by income
Table shows Ratings of the health information Americans get from each source by party
Table shows Frequency of coming across conflicting health information by age, education and income
Table shows Frequency of coming across conflicting health information
Table shows Characteristics that Americans say are highly important in sources of health information, by age, education, income, and party
Table shows Accuracy ratings of health information on social media
Table shows Understandability ratings of health information on social media
Table shows Convenience ratings of health information on social media
Table shows Personalized ratings of health information on social media
Table shows Accuracy ratings of health information from AI chatbots
Table shows Understandability ratings of health information from AI chatbots
Table shows Convenience ratings of health information from AI chatbots
Table shows Personalized ratings of health information from AI chatbots

Appendix B: Supplemental tables on health ratings

Chart shows Ratings of physical health
Chart shows Ratings of mental health
Table shows Age and importance of healthy behaviors