
Americans’ Views on Who Influences Health Policy and Which Health Issues To Prioritize
About 7 in 10 Americans say health insurance companies have too much health policy influence; partisan disagreement about the CDC’s role in health policy
Americans are in the midst of ongoing discussion and debate about which health issues are most pressing and who should play a role in addressing them. According to a new Pew Research Center survey, a solid majority of U.S. adults (69%) say health insurance companies have too much influence on public debates about health policy.
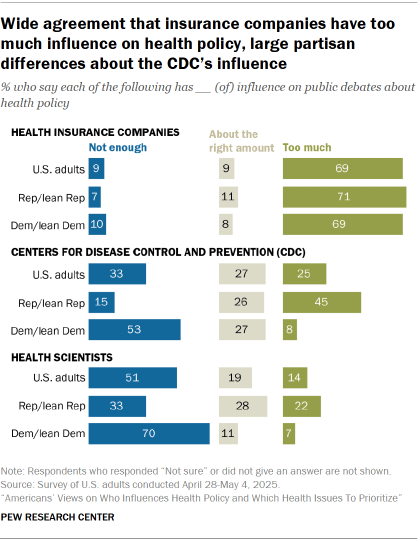
Of the eight groups and institutions we asked about in this survey – such as Congress, the general public and federal courts – health insurance companies are the one that a majority of Americans agree has too much sway in health policy. Just 9% say they have about the right amount of influence, and an equal share say they don’t have enough.
Although politics and health policy are often deeply entangled, this dim opinion of health insurance companies’ influence is an area of notable partisan agreement. Roughly equal shares of Democrats (including those who lean to the Democratic Party) and Republicans (and GOP leaners) express this view. Similar shares of Democrats and Republicans also say Congress has too much influence on health policy, although this view is less widely held than it is for health insurance companies.
In contrast, views are more mixed when it comes to the role of the Centers for Disease Control and Prevention (CDC). The agency has undergone major restructuring and cuts under the Trump administration, and the public is split about its health policy role. Overall, 33% say the agency doesn’t have enough influence over health policy, while 25% disagree and say it has too much influence. That’s about the same as the share who see the organization as having about the right amount of influence (27%).
And Republicans and Democrats express sharply opposing views on the CDC. While 53% of Democrats say the CDC doesn’t have enough policy influence, 45% of Republicans say it has too much.
In addition to government institutions and insurance companies, health scientists also play a role in shaping health policy. And on balance, the public sees them as not having enough influence. About half of Americans express this view.
The share rises to a majority among Democrats. By a 37 percentage point margin, Democrats are more likely than Republicans to see health scientists as not having enough influence (70% vs. 33%). This finding tracks with our previous polling that found that Democrats are far more supportive of scientists playing a role in policymaking than Republicans.
Still, more Republicans say health scientists don’t have enough policy influence (33%) than have too much influence (22%). And 28% say their influence is about right.
This survey, conducted from April 28 to May 4, 2025, builds on our work tracking Americans’ views on scientists and their influence on policy. We conducted the current survey to understand Americans’ views on the role of health experts and institutions on health policies and programs. The survey also explored how much of a problem they feel long-standing and emerging health issues are for the nation.
Find more details on: Which health issues are problems for the country today? | How important is the federal government’s role in health programs and policies? | How much health policy influence do different groups and institutions have?
Other key takeaways:
- About eight-in-ten or more Americans say cancer, obesity, heart disease and opioid addiction are major problems. These views are held equally by both Democrats and Republicans.
- While over half of Americans say measles and bird flu are minor problems for the country today, about one-in-four describe them as major problems. Roughly one-in-five say they’re not problems at all. (This survey was conducted amid ongoing measles outbreaks in the United States.)
- Majorities of Americans say it’s extremely important for the federal government to test drugs for safety (63%) and track the spread of contagious diseases around the country (54%).
- By a 30 percentage point margin, larger shares of Democrats than Republicans say it’s extremely important for the federal government to track the spread of contagious diseases in the U.S. (69% vs. 39%).
Which health issues are problems for the country today?
As policymakers, advocates and health care professionals are debating which health issues are most urgent, we asked Americans how much of a problem eight health issues are for the country today. These include long-standing top causes of death in the U.S. like cancer and heart disease, as well as issues that have recently made headlines, like measles and bird flu.

While eight-in-ten or more Americans say each of these is at least a minor problem, the share of Americans who say these are major problems differs across issues.
Large majorities of Americans say cancer (84%), obesity and being overweight (84%), heart disease (80%) and opioid addiction (79%) are major problems for the U.S. today. Smaller majorities say the same about Alzheimer’s disease (64%) and loneliness (55%).
Ongoing measles and bird flu outbreaks have made recent news, but far fewer Americans say these two infectious diseases are major problems. About a quarter (26%) of Americans say bird flu is a major problem for the country today and 25% say the same about measles. In contrast, about two-in-ten Americans say each of these diseases is not a problem for the country today.
Views across demographic groups
Larger shares of women (72%) than men (55%) say Alzheimer’s disease is a major problem for the country. While women are more likely than men to say most of the issues we asked about are major problems, this gender gap is largest for Alzheimer’s disease. Notably, women are more likely than men to be caregivers for someone with Alzheimer’s disease and to develop the disease themselves.
Across most of the health issues we asked about, adults ages 65 and older are more likely than adults younger than 50 to say these are major problems for the country. Loneliness is the only issue we asked about in which adults younger than 50 are more likely than those 65 and older to say it is a major problem (60% vs. 46%). Refer to the appendix for details.
Seeing loneliness as a major problem for the country also differs across education levels. For example, 69% of Americans with a postgraduate degree say this, compared with 45% of those with a high school degree or less education. For each of the other issues we asked about, differences by education level are smaller or there are no differences at all.
Partisan views

Republicans and those who lean to the Republican Party as well as Democrats and Democratic leaners have very similar views on many of the health issues we asked about.
The same shares of Republicans and Democrats say cancer (84% each) and heart disease (80% each) are major problems for the country. And nearly identical shares of Republicans and Democrats say the same about obesity and being overweight (85% and 83%, respectively), opioid addiction (79% and 78%) and Alzheimer’s disease (62% and 64%).
Yet Democrats are much more likely than Republicans to see measles and bird flu as major problems. About four-in-ten Democrats say measles is a major problem for the country, while 12% of Republicans say the same. There is a similar partisan gap for bird flu, with 35% of Democrats and 15% of Republicans saying this is a major problem for the country.
This April-May 2025 survey was conducted amid ongoing measles outbreaks in the U.S. and a continuing outbreak of bird flu mostly among animals in the country.
How important is the federal government’s role in health programs and policies?
We asked about six health-related roles the federal government can play. About nine-in-ten or more U.S. adults say each is at least somewhat important for the federal government to take on.

Still, Americans differ in which of these actions they view as extremely important for the federal government to do. A majority (63%) say testing drugs for safety is extremely important, and a slim majority (54%) say the same about tracking the spread of contagious diseases around the country.
About half of Americans say it is extremely important for the federal government to make rules about listing ingredients on food packaging (48%). Similar shares say investigating health insurance fraud (46%) and studying health issues that affect women and girls (45%) are extremely important. Fewer (31%) say developing programs to place health care workers in rural communities is extremely important.
Women (50%) are somewhat more likely than men (41%) to say it is extremely important for the federal government to study health issues that affect women and girls. This gender gap is driven by women younger than 50 being more likely to say this than older women as well as men over and under 50.
Partisan views
Majorities of both Democrats and Republicans – though slightly more Democrats – say it’s extremely important for the federal government to test drugs for safety (69% of Democrats and Democratic leaners, 56% Republicans and GOP leaners).

Similar shares of Democrats (51%) and Republicans (45%) also say it’s extremely important for the federal government to make rules about listing ingredients on food packaging.
In contrast, while 69% of Democrats say tracking the spread of contagious diseases around the country is extremely important for the federal government to do, 39% of Republicans say the same – a 30 percentage point difference.
There is a similarly sized partisan gap when it comes to the importance of studying health issues that affect women and girls – 59% of Democrats but 32% of Republicans say this is extremely important for the federal government to do.
The one federal action that larger shares of Republicans than Democrats say is extremely important is investigating health insurance fraud. About half of Republicans express this view, compared with 41% of Democrats.
How much health policy influence do different groups and institutions have?
About half of Americans say health scientists (51%) and doctors or other health care providers (47%) don’t have enough influence on public debates about health policy. These shares are far larger than those who say these groups have too much influence, and larger than the shares who say they have about the right amount of influence.

Similarly, roughly twice as many Americans say the general public does not have enough influence (40%) than say it has too much (21%) or about the right amount of influence (21%) on debates about health policy.
In contrast, a majority of Americans (69%) say health insurance companies have too much influence – far more than the 9% who say they don’t have enough influence and the 9% who say they have the right amount. Americans also tilt toward Congress, federal courts and their local elected officials having too much influence rather than not having enough influence.
Americans have mixed views on the role of the CDC. On balance, one-third say the CDC doesn’t have enough influence on health policy, while 25% say it has too much. Another 27% say they have about the right amount of influence.
Survey respondents did express notable uncertainty about some health policy influences. For example, 26% are not sure about the influence of federal courts, and 25% say the same about their local elected officials.
Partisan views
Republicans and Democrats have similar views about the amount of influence that many of the groups we asked about have.

Partisans agree that health insurance companies have too much influence on debates about health policy – 71% of Republicans and 69% of Democrats say this, including those who lean to each party. There are also relatively small partisan differences in views of how much influence the general public, local elected officials, Congress and federal courts should have.
In contrast, there are sizable partisan differences in views of how much influence the CDC should have on health policy. About half (53%) of Democrats say the CDC doesn’t have enough influence, while 45% of Republicans say it has too much influence.
Democrats are also more likely than Republicans (70% vs. 33%) to say that health scientists don’t have enough influence. Overall, these findings are consistent with our past work that has shown differences between Republicans’ and Democrats’ level of confidence in scientists as well as differences in views of the CDC overall.
Among Republicans, opinions on health scientists’ influence are mixed. One-third say health scientists don’t have enough policy influence, 28% say they have about the right amount and 22% say they have too much.
Views among Republicans on health care providers’ influence are also mixed, with similar shares saying these front-line clinicians have about the right amount of influence (36%) and not having enough (37%). Some 16% say providers have too much influence. In contrast, among Democrats, much larger shares say they don’t have enough influence (60%) than say they have about the right amount (23%) or too much influence (7%).
Additionally, views on how much influence health scientists, health care providers and the CDC should have differ across education levels. Americans with more education are generally more likely than those with less education to say these three groups should have more influence. However, this pattern is driven by education differences among Democrats, while there are no consistent education differences among Republicans.


