Pew Research Center

FOR RELEASE MAY 29, 2025

Americans’ Views on How to Address the Impacts of Extreme Weather

Most who have experienced extreme weather in the last year see a link to climate change

BY Alec Tyson and Brian Kennedy

FOR MEDIA OR OTHER INQUIRIES:

Communications Department
202.419.4372
www.pewresearch.org

RECOMMENDED CITATION

Pew Research Center, May 2025, "Americans’ Views on How to Address the Impacts of Extreme Weather"

About Pew Research Center

Pew Research Center is a nonpartisan, nonadvocacy fact tank that informs the public about the issues, attitudes and trends shaping the world. It does not take policy positions. The Center conducts public opinion polling, demographic research, computational social science research and other data-driven research. It studies politics and policy; news habits and media; the internet and technology; religion; race and ethnicity; international affairs; social, demographic and economic trends; science; research methodology and data science; and immigration and migration. Pew Research Center is a subsidiary of The Pew Charitable Trusts, its primary funder.

© Pew Research Center 2026

Table of contents

  • About Pew Research Center
  • Americans’ Views on How to Address the Impacts of Extreme Weather
  • Acknowledgments
  • Methodology
  • Appendix: Detailed chart

Americans’ Views on How to Address the Impacts of Extreme Weather

Most who have experienced extreme weather in the last year see a link to climate change

How we did this

Pew Research Center conducted this study to understand Americans’ attitudes toward and experiences with extreme weather. For this analysis, we surveyed 5,085 U.S. adults from April 28 to May 4, 2025.

Everyone who took part in the survey is a member of the Center’s American Trends Panel (ATP), a group of people recruited through national, random sampling of residential addresses who have agreed to take surveys regularly. This kind of recruitment gives nearly all U.S. adults a chance of selection. Interviews were conducted either online or by telephone with a live interviewer. The survey is weighted to be representative of the U.S. adult population by gender, race, ethnicity, partisan affiliation, education and other categories. Read more about the ATP’s methodology.

Here are the questions used for this report, the topline and the survey methodology.

As weather and climate disasters costing over $1 billion in damages become regular occurrences in the United States, a new Pew Research Center survey finds that 77% of Americans say stricter building standards are a good idea for communities at high risk of extreme weather. These findings come amid conversations about scaling back the role of the Federal Emergency Management Agency (FEMA) in setting standards and working with states to handle disaster response.
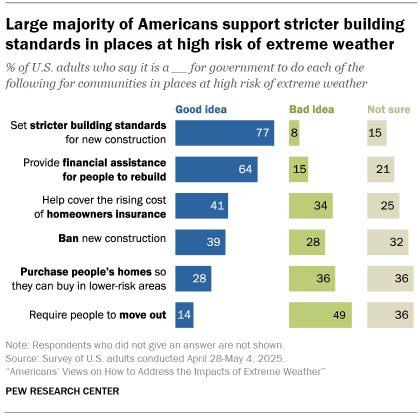
Chart shows Large majority of Americans support stricter building standards in places at high risk of extreme weather

The survey also finds that 64% of Americans think it is a good idea for government to provide financial assistance for people in high-risk communities to rebuild in the wake of extreme weather events, illustrating the multiple considerations Americans bring to conversations about how the country should deal with the growing impacts of extreme weather.

The survey conducted from April 28 to May 4, 2025, among 5,085 U.S. adults explores attitudes about the steps government could take to address extreme weather impacts, as well as the link Americans see between extreme weather and climate change. The report builds on long-standing efforts at the Center to understand how Americans think about the interrelated issues of energy, climate and extreme weather.

Key highlights:

  • Americans have mixed views on government helping homeowners cover the rising cost of insurance: 41% say this is a good idea, while 34% call it a bad idea.
  • Americans express some openness to banning new construction in areas at high risk of extreme weather (39% say good idea vs. 28% say bad idea). But few support requiring people to move out of high-risk areas (only 14% say this is a good idea). On this and other policy steps, many Americans say they are not sure, underscoring the developing nature of public views on this issue.
  • Most Americans who have experienced extreme weather in the last year say climate change played a role. Across each of the five types of extreme weather events we asked about (like intense storms or floods), at least eight-in-ten who experienced the event say climate change contributed a lot or a little.
  • Partisanship shapes perceptions of extreme weather itself, as well as the connection to climate change. Republicans are less likely to report extreme weather events than Democrats. And while most Republicans who do report experiencing extreme weather events draw a link to climate change, they are much less likely than Democrats to see a strong connection.

Views among Republicans and Democrats on extreme weather policies

On actions government could take around extreme weather, there are notable areas of common ground between Republicans and Democrats.
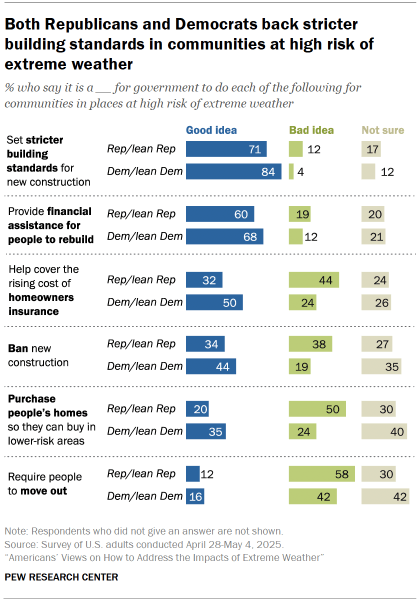
Chart shows Both Republicans and Democrats back stricter building standards in communities at high risk of extreme weather

Amid recent debates over the impacts of stricter building codes, large shares of both Democrats and Democratic-leaning independents (84%) as well as Republicans and Republican leaners (71%) say it is a good idea for government to set stricter building standards for new construction in communities at high risk of extreme weather.

Similarly, majorities of both groups also think it’s a good idea for government to provide financial assistance for people in high-risk areas to rebuild after extreme weather impacts.

Differences emerge on other potential steps. On balance, more Republicans say it is a bad idea than a good idea for government to help people with the rising cost of homeowners insurance (44% vs. 32%). By contrast, larger shares of Democrats view this as a good idea than a bad one (50% vs. 24%). Among both groups, about a quarter say they are not sure. Debates about how to handle rising premiums are taking place around the country, including in California in the wake of devastating wildfires.

When it comes to the idea of government banning new construction in high-risk areas, Republicans are split: 34% say this is a good idea, while 38% say it is a bad idea. Democrats are more open to this approach (44% say good idea vs. 19% say bad idea).

Both Republicans and Democrats express far more negative than positive sentiment when it comes to the idea of government requiring people to move out of areas at high risk of extreme weather.

Views on these six potential government actions among the general public – and partisan groups – are largely similar to those measured in a 2024 Center survey. Still, support for government providing financial assistance for people to rebuild has increased 10 percentage points among Republicans and 5 points among Democrats since last year.

Extreme weather and its link to climate change

Climate scientists have found that climate change is driving an increase in extreme weather, as documented in the Intergovernmental Panel on Climate Change report.
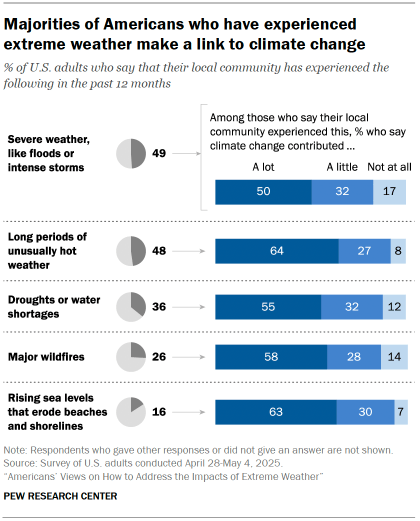
Chart shows Majorities of Americans who have experienced extreme weather make a link to climate change

Overall, 74% of Americans say they’ve experienced at least one of five forms of extreme weather in the past 12 months. Among those reporting any of these experiences, majorities view climate change as a contributor to the extreme weather.

For instance, among the roughly half of Americans who say they have experienced long periods of unusually hot weather in the last year, 91% say climate change contributed either a lot (64%) or a little (27%) to this.

Large majorities who have experienced other forms of extreme weather, including major wildfires and floods and intense storms, also say climate change contributed a lot or a little to these events.

Go to the Appendix for more details about experiences of extreme weather events across U.S. geographic regions.

Partisan differences in reporting extreme weather

Partisanship is a factor that shapes both Americans’ reporting of extreme weather events and the connection they see to climate change.
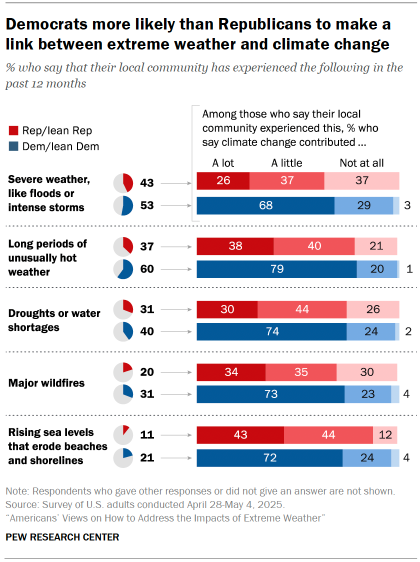
Chart shows Democrats more likely than Republicans to make a link between extreme weather and climate change

Republicans are less likely than Democrats to report experiencing extreme weather – a difference that holds even when taking into account where people live.

For instance, 60% of Democrats say they experienced long periods of unusually hot weather in the last year, compared with 37% of Republicans. Gaps for other, more specific events – like major wildfires – tend to be more modest; but the pattern holds across all five forms of extreme weather included in the survey.

Put another way, even when comparing views among Republicans and Democrats in the same geographic region, Democrats perceive more unusual or extreme weather events.

How Republicans and Democrats view the link between extreme weather and climate change

Overwhelming shares of Democrats who have experienced extreme weather in the last year say climate change played a role, including majorities who say climate change contributed a lot.

For instance, 98% of Democrats who report experiencing droughts or water shortages in the last year say climate change contributed either a lot (74%) or a little (24%).

On balance, Republicans who report extreme weather also see a link to climate change, but to a lesser extent than Democrats.

When it comes to droughts or water shortages, about three-quarters of Republicans who say they’ve experienced these events recently believe climate change contributed either a lot (30%) or a little (44%).

Similar patterns are seen between partisan groups on the four other forms of extreme weather included in the survey.
Acknowledgments

This report is made possible by The Pew Charitable Trusts. It is a collaborative effort based on the input and analysis of the following individuals. Find related reports online at: pewresearch.org/science.

Primary research team       

Eileen Yam, Director, Science and Society Research
Alec Tyson, Associate Director, Science and Society Research
Brian Kennedy, Senior Researcher
Giancarlo Pasquini, Research Associate
Emma Kikuchi, Research Assistant    
Isabelle Pula, Research Assistant      

Editorial and graphic design          

Rebecca Leppert, Copy Editor
Kaitlyn Radde, Associate Information Graphics Designer

Communications and web publishing      

Haley Nolan, Communications Manager
DeVonte Smith, Communications Associate
Reem Nadeem, Digital Producer

In addition, the project benefited greatly from the guidance of the Pew Research Center methodology team: Courtney Kennedy, Andrew Mercer, Ashley Amaya, Dorene Asare-Marfo, Dana Popky, Anna Brown and Arnold Lau.

Methodology

The American Trends Panel survey methodology

Overview

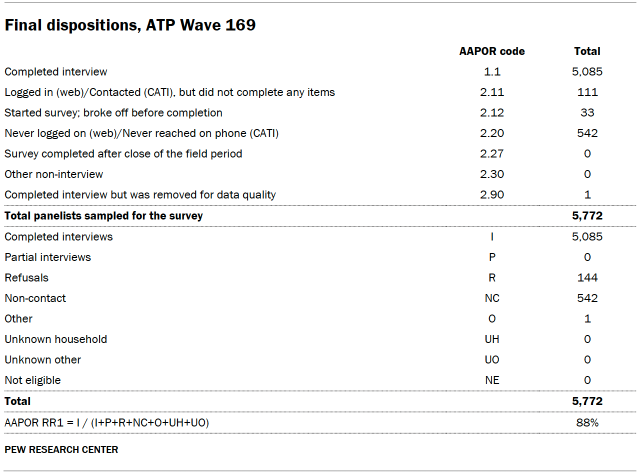
Data in this report comes from Wave 169 of the American Trends Panel (ATP), Pew Research Center’s nationally representative panel of randomly selected U.S. adults. The survey was conducted from April 28 to May 4, 2025. A total of 5,085 panelists responded out of 5,772 who were sampled, for a survey-level response rate of 88%.

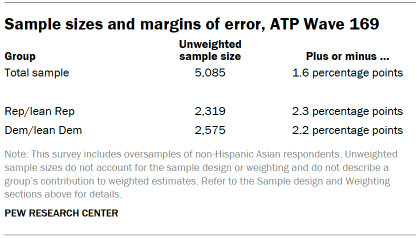
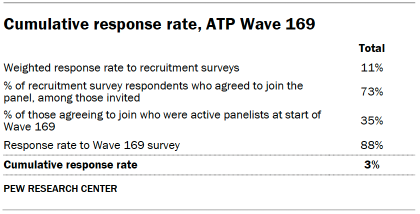
The cumulative response rate accounting for nonresponse to the recruitment surveys and attrition is 3%. The break-off rate among panelists who logged on to the survey and completed at least one item is 1%. The margin of sampling error for the full sample of 5,085 respondents is plus or minus 1.6 percentage points.

The survey includes an oversample of non-Hispanic Asian adults in order to provide more precise estimates of the opinions and experiences of these smaller demographic subgroups. These oversampled groups are weighted back to reflect their correct proportions in the population.

SSRS conducted the survey for Pew Research Center via online (n=4,895) and live telephone (n=190) interviewing. Interviews were conducted in both English and Spanish.

To learn more about the ATP, read “About the American Trends Panel.”

Panel recruitment

Since 2018, the ATP has used address-based sampling (ABS) for recruitment. A study cover letter and a pre-incentive are mailed to a stratified, random sample of households selected from the U.S. Postal Service’s Computerized Delivery Sequence File. This Postal Service file has been estimated to cover 90% to 98% of the population.1 Within each sampled household, the adult with the next birthday is selected to participate. Other details of the ABS recruitment protocol have changed over time but are available upon request.2 Prior to 2018, the ATP was recruited using landline and cellphone random-digit-dial surveys administered in English and Spanish.

A national sample of U.S. adults has been recruited to the ATP approximately once per year since 2014. In some years, the recruitment has included additional efforts (known as an “oversample”) to improve the accuracy of data for underrepresented groups. For example, Hispanic adults, Black adults and Asian adults were oversampled in 2019, 2022 and 2023, respectively.

Sample design

The overall target population for this survey was noninstitutionalized persons ages 18 and older living in the United States. It featured a stratified random sample from the ATP in which non-Hispanic Asian adults were selected with certainty. The remaining panelists were sampled at rates designed to ensure that the share of respondents in each stratum is proportional to its share of the U.S. adult population to the greatest extent possible. Respondent weights are adjusted to account for differential probabilities of selection as described in the Weighting section below.

Questionnaire development and testing

The questionnaire was developed by Pew Research Center in consultation with SSRS. The web program used for online respondents was rigorously tested on both PC and mobile devices by the SSRS project team and Pew Research Center researchers. The SSRS project team also populated test data that was analyzed in SPSS to ensure the logic and randomizations were working as intended before launching the survey.

Incentives

All respondents were offered a post-paid incentive for their participation. Respondents could choose to receive the post-paid incentive in the form of a check or gift code to Amazon.com, Target.com or Walmart.com. Incentive amounts ranged from $5 to $15 depending on whether the respondent belongs to a part of the population that is harder or easier to reach. Differential incentive amounts were designed to increase panel survey participation among groups that traditionally have low survey response propensities.

Data collection protocol

The data collection field period for this survey was April 28 to May 4, 2025. Surveys were conducted via self-administered web survey or by live telephone interviewing.

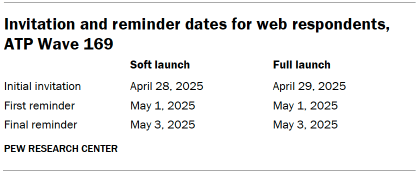
For panelists who take surveys online: Postcard notifications were mailed to a subset on April 28.3 Survey invitations were sent out in two separate launches: soft launch and full launch.

Sixty panelists were included in the soft launch, which began with an initial invitation sent on April 28. All remaining English- and Spanish-speaking sampled online panelists were included in the full launch and were sent an invitation on April 29.

Table shows Invitation and reminder dates for web respondents, ATP Wave 169

Panelists participating online were sent an email invitation and up to two email reminders if they did not respond to the survey. ATP panelists who consented to SMS messages were sent an SMS invitation with a link to the survey and up to two SMS reminders.

For panelists who take surveys over the phone with a live interviewer: Prenotification postcards were mailed on April 25. Soft launch took place on April 28 and involved dialing until a total of three interviews had been completed. All remaining English- and Spanish-speaking sampled phone panelists’ numbers were dialed throughout the remaining field period. Panelists who take surveys via phone can receive up to six calls from trained SSRS interviewers.

Data quality checks

To ensure high-quality data, Center researchers performed data quality checks to identify any respondents showing patterns of satisficing. This includes checking for whether respondents left questions blank at very high rates or always selected the first or last answer presented. As a result of this checking, one ATP respondent was removed from the survey dataset prior to weighting and analysis.

Weighting

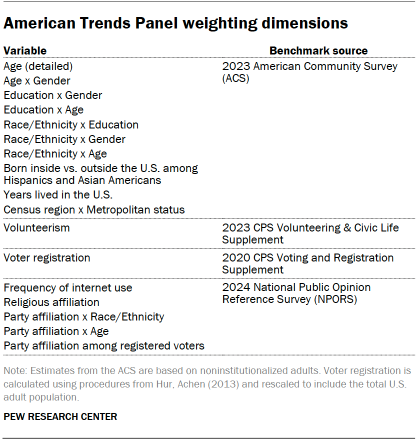
Table shows American Trends Panel weighting dimensions

The ATP data is weighted in a process that accounts for multiple stages of sampling and nonresponse that occur at different points in the panel survey process. First, each panelist begins with a base weight that reflects their probability of recruitment into the panel. These weights are then calibrated to align with the population benchmarks in the accompanying table to correct for nonresponse to recruitment surveys and panel attrition. If only a subsample of panelists was invited to participate in the wave, this weight is adjusted to account for any differential probabilities of selection.

Among the panelists who completed the survey, this weight is then calibrated again to align with the population benchmarks identified in the accompanying table and trimmed at the 1st and 99th percentiles to reduce the loss in precision stemming from variance in the weights. Sampling errors and tests of statistical significance take into account the effect of weighting.

The following table shows the unweighted sample sizes and the error attributable to sampling that would be expected at the 95% level of confidence for different groups in the survey.

Table shows Sample sizes and margins of error, ATP Wave 169

Sample sizes and sampling errors for other subgroups are available upon request. In addition to sampling error, one should bear in mind that question wording and practical difficulties in conducting surveys can introduce error or bias into the findings of opinion polls.

Dispositions and response rates

Table shows Final dispositions, ATP Wave 169
Table shows Cumulative response rate, ATP Wave 169

Appendix: Detailed chart