
How Americans View Climate Change and Policies to Address the Issue
Mixed views of how climate policies impact the U.S. economy
Pew Research Center conducted this study to understand how Americans view climate change and policies to address the issue. For this analysis, we surveyed 9,593 U.S. adults from Oct. 21 to 27, 2024.
Everyone who took part in the survey is a member of the Center’s American Trends Panel (ATP), a group of people recruited through national, random sampling of residential addresses who have agreed to take surveys regularly. This kind of recruitment gives nearly all U.S. adults a chance of selection. Surveys were conducted either online or by telephone with a live interviewer. The survey is weighted to be representative of the U.S. adult population by gender, race, ethnicity, partisan affiliation, education and other categories. Read more about the ATP’s methodology.
Here are the questions used for this report, the topline and the survey methodology.
The United States and countries around the world continue to grapple with the impacts of climate change, including record heat and more intense extreme weather events.
A Pew Research Center survey of 9,593 U.S. adults conducted Oct. 21-27, 2024, takes stock of Americans’ views on climate change, including its impact on their own lives, their support for policies to address the issue and the emotional reactions they have to climate news.
Key findings
Americans are split over the economic impact of climate policies
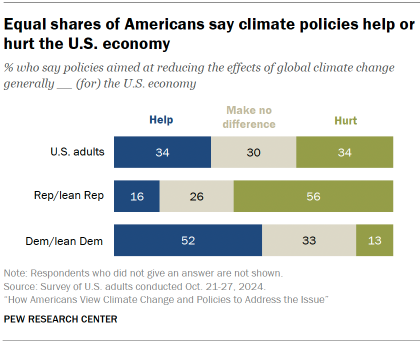
Economic issues like inflation have been front of mind for many voters in this year’s election. The survey finds that U.S. adults are just as likely to say that policies aimed at reducing the effects of climate change usually help the economy as they are to say these policies usually hurt it (34% each).
Among Republicans and those who lean to the Republican Party, 56% think climate policies usually hurt the economy. By contrast, 52% of Democrats and those who lean Democratic say they usually help.
Large businesses and corporations seen as doing too little on climate change
Overall, 69% of Americans say large business and corporations are doing too little to help reduce the effects of global climate change. Six-in-ten also say state elected officials are doing too little on climate.
Broad support for a number of policies to address climate change
Sizable majorities favor tax credits for Americans who improve their home’s energy efficiency (83%) and tax credits for businesses that develop carbon capture technologies (79%). Notably, majorities of both Republicans and Democrats support these policy actions.
Widespread frustration with political disagreement over climate change
Eight-in-ten Americans say climate news makes them feel frustrated about the level of political disagreement on the issue. A large share (73%) also say climate news has made them feel sad about what’s happening to the Earth. At the same time, 51% of U.S. adults say they’ve felt suspicious of the groups pushing for action on climate change (a view expressed by 75% of Republicans).
64% say climate change currently affects their local community either a great deal or some
Among Republicans, 41% say climate change is currently impacting their own community. For Democrats, a large majority (86%) holds this view. These wide partisan differences in perceptions exist across geographic regions.
Relatively few expect to make major sacrifices in their lifetime due to climate change
Three-quarters of U.S. adults expect they’ll have to make at least minor sacrifices in their everyday life during their lifetime because of global climate change. But the share who expect to make major sacrifices remains modest, at 23%.
Emotional reactions to climate change news
Climate change news and information sparks a mix of feelings among Americans.
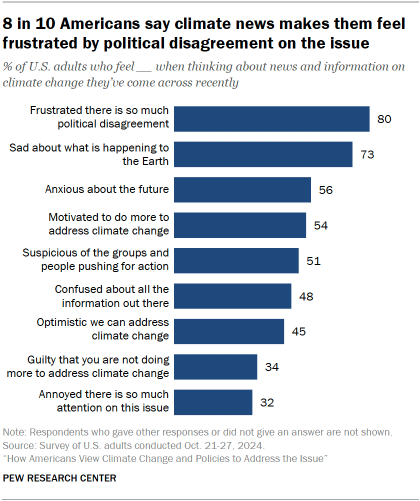
Large shares express frustration with the partisan nature of climate debate. Eight-in-ten say they’ve felt frustrated by the level of political disagreement when they’ve seen news and information about climate change.
Climate change is not an easy subject for all Americans to make sense of: 48% report feeling confused about all the information out there on the issue.
For some, climate news sparks a sense of skepticism: 51% say they have felt suspicious of the groups and people pushing for action on the issue. A 2023 Center analysis of qualitative interviews with U.S. adults who do not see climate change as an urgent issue found one theme was skepticism about the motives of those calling for more action on climate change.
Many express sadness about what’s happening to the Earth. About three-quarters (73%) say climate news has made them feel this way. A sense of anxiety about the future because of climate news also registers with 56% of Americans.
Just under half (45%) say climate news and information has made them feel optimistic we can address the issue. The share who say climate news has made them feel optimistic is 7 percentage points higher than it was in an October 2023 Center survey.
Partisan differences in reactions to climate news
There continue to be wide differences between Republicans and Democrats – including those who lean to each party – in their reactions to climate news and information.
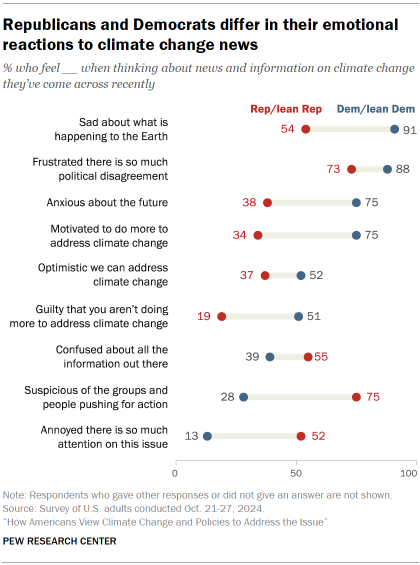
Large majorities of Democrats say climate news has made them feel sad about what’s happening to the Earth (91%), and 75% say it has made them feel anxious about the future.
At the same time, 75% of Democrats also say climate news has made them feel motivated to do more to address the issue.
For Republicans, a top reaction is a sense of suspicion toward the groups and people pushing for action on the issue (75% say they’ve felt this way). And 52% say they’ve felt annoyed there is so much attention on the issue.
Republicans are much less likely than Democrats to say climate news has made them feel sad about what’s happening to the Earth; still, 54% of Republicans say they’ve felt this way.
Large majorities of Democrats and Republicans share a sense of frustration over the level of political disagreement over climate change: 88% of Democrats and 73% of Republicans say they’ve felt frustrated there is so much political disagreement over this.
Perceptions of the local impact of climate change
Climate scientists highlight the many ways climate change can affect communities’ environments and everyday lives. Nearly two-thirds of Americans say that climate change is affecting their local community either a great deal (26%) or some (38%).

Americans’ views on local climate impacts are closely related to their partisan leanings. A large majority of Democrats (86%) say climate change is affecting their local community at least some. By contrast, fewer than half of Republicans say this (41%). A majority of Republicans (58%) say climate change is having not too much or no impact at all on their community.
There are modest differences in perceptions of climate impacts in different areas of the country. U.S. adults living in New England (Connecticut, Maine, Massachusetts, New Hampshire, Rhode Island and Vermont) (72%) and Pacific (Alaska, California, Hawaii, Oregon and Washington) (70%) states are somewhat more likely than adults living in other areas to see at least some local climate impact.
Across the country, Democrats are far more likely than Republicans to say climate change is affecting their local community. For example, among those living in Pacific states, Democrats are more than twice as likely as Republicans to say climate change is affecting their local community at least some (89% vs. 41%).
How much do Americans think humans contribute to climate change?
Overall, 45% of Americans say human activity, such as the burning of fossil fuels, contributes a great deal to climate change, while another 29% think it contributes some. A quarter say humans are contributing not too much or not at all to climate change.

Since 2019, the share of Americans who see a human contribution to climate change has not increased, despite scientific consensus on the issue and widespread media coverage.
There continues to be a sharp partisan divide in views over how much humans affect climate change. Seven-in-ten Democrats say human activity contributes a great deal to climate change; another 22% say it contributes some.
Republicans are far less likely to see a human impact: 20% say humans contribute a great deal to climate change. (A larger share of Republicans – 44% – say natural patterns in the Earth’s environment contribute a great deal to climate change.)
Majority of Americans expect to make sacrifices due to climate change – but relatively few expect them to be ‘major’
When asked if they will have to make sacrifices in their everyday lives due to climate change, 75% of Americans expect they will need to make either major or minor sacrifices. A quarter of U.S. adults expect to make no sacrifices in their daily lives.
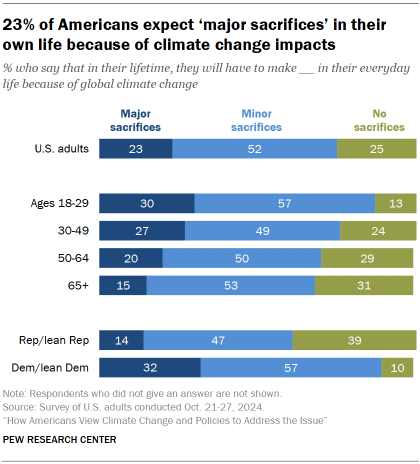
The share who expect to make major sacrifices is relatively modest: 23% think climate change impacts will require them to make this level of sacrifice in their own life.
Younger Americans are more likely to foresee having to make sacrifices in their everyday lives. Among those ages 18 to 29, 30% think they will need to make major sacrifices because of climate change, compared with 15% of those 65 and older.
Among Democrats, 89% think they’ll have to make sacrifices in their own life because of climate change, including 32% who expect major sacrifices. Among Republicans, this sense is less widely held: 60% expect to make at least minor sacrifices, including just 14% who think they’ll need to make major sacrifices. About 4-in-10 Republicans expect to make no sacrifices in their everyday life because of climate change.
Multiple actors – including large businesses and state officials – seen as doing too little on climate
About seven-in-ten Americans (69%) say large businesses and corporations are doing too little to help reduce the effects of climate change; 22% say they are doing about the right amount and only 8% say they are doing too much.
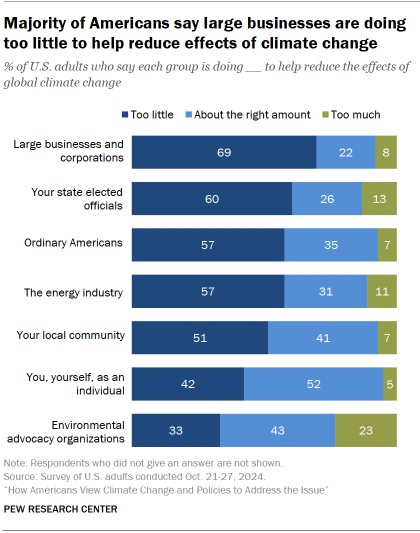
Majorities also view state elected officials (60%) and the energy industry (57%) as doing too little on climate.
The public offers some critique of the efforts of “ordinary Americans” on climate: 57% say ordinary Americans are doing too little to reduce the effects of climate change.
Asked to consider their own role, 52% of Americans think they themselves are doing about the right amount on climate change. Of those who don’t rate themselves this way, far more say they are doing too little on climate than too much (42% vs. 5%).
Democrats are much more likely than Republicans to say each of the groups included in the survey are doing too little to address climate change. For instance, 87% of Democrats say this about large businesses and corporations, compared with 51% of Republicans. For more details, refer to the Appendix.
Support for policies to address climate change
Majorities of Americans continue to support a number of proposals to address climate change.
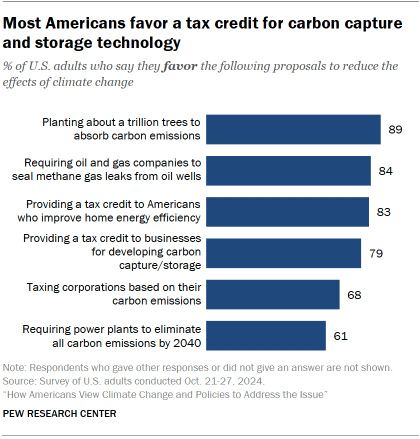
In a finding similar to a Center survey in 2023, about nine-in-ten Americans (89%) favor planting about a trillion trees to absorb carbon emissions. This was a proposal supported by Donald Trump in his first presidential term.
Large majorities also favor requiring oil and gas companies to seal methane leaks from oil and wells (84%), a tax credit to Americans who improve home energy efficiency (83%), and a tax credit to businesses for developing carbon capture and storage technology (79%).
The Biden administration recently introduced a rule requiring oil and gas companies to pay a fee if their methane emissions are above a certain level. This rule is highly likely to be rescinded in the new Trump administration.
Business tax credits for carbon capture is one climate proposal that has received support from some congressional Republicans.
Americans also are generally in favor of taxing corporations based on carbon emissions (68%) and requiring power plants to eliminate all carbon emissions by 2040 (61%) – though support is less widespread than for the other proposals included in the survey.
Large majorities of Democrats favor all proposals to address climate change included in the survey. Views among Republicans vary by the particular policy in question.

For example, three-quarters of Republicans favor providing a tax credit for improving home energy efficiency and requiring oil and gas companies to seal methane leaks from oil wells.
A slightly smaller share (69%) also favors a tax credit to businesses for developing carbon capture and storage technology.
But Republicans are less likely to favor taxing corporations based on their carbon emissions (47%) or requiring power plants to eliminate all carbon emissions by 2040 (38%).
Top considerations for climate change policies
Asked broadly about what’s important to them in climate policy, protecting the environment for future generations ranks at the top of the list for Americans. Economic factors – like keeping costs low – also register widely.
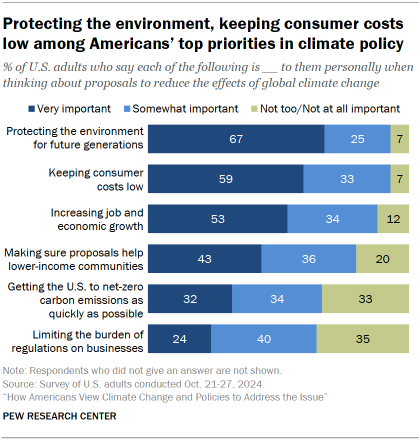
Two-thirds of U.S. adults (67%) say protecting the environment for future generations is a very important consideration to them when thinking about climate proposals. Another 25% say this is somewhat important, and just 7% place little or no importance on this.
Economic considerations also rank highly. About six-in-ten (59%) say keeping consumer costs low is a very important consideration to them in climate policy, and 53% place the highest level of importance on increasing job and economic growth.
Fewer say helping low-income communities or getting the country to net-zero carbon emissions are very important climate policy considerations. Overall views on climate policy priorities have remained fairly stable over the past several years.
Republicans and Democrats express different priorities for climate policies
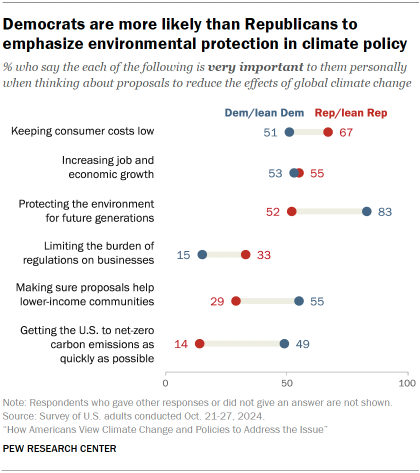
For Republicans, keeping consumer costs low is the top factor when thinking about climate-related proposals (67% call this very important to them personally). In addition, 55% say increasing job and economic growth is a very important consideration to them in climate proposals. About half of Republicans (52%) say protecting the environment for future generations is very important.
Among Democrats, protecting the environment for future generations is by far their top climate policy consideration: 83% say this is very important to them.
Slightly more than half of Democrats say making sure proposals help lower-income communities (55%) is a very important consideration to them. Directing federal climate and energy funds to disadvantaged communities has been a policy priority of the Biden administration. (Just 29% of Republicans view this as very important.)
About half of Democrats place the highest level of importance on economic factors: 53% say increasing job and economic growth is a very important consideration to them in climate policy, and 51% say this about keeping consumer costs low.
While differences between Republicans and Democrats are evident in the shares who put the highest level of priority on these considerations, large majorities of both groups say protecting the environment, keeping costs low and increasing economic growth are at least somewhat important considerations to them in climate policy. Go to the Appendix for more.
Impact of climate change policies on the economy and environment
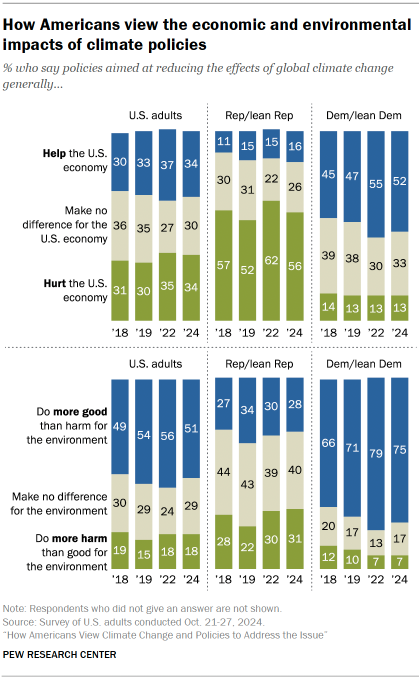
There’s ongoing debate about whether climate change policies help or hurt the economy. About one-third (34%) of Americans say climate change policies help the U.S. economy, and an equal share say they hurt the economy. Three-in-ten Americans say these policies make no difference to the economy.
When it comes to environmental impact, 51% say climate policies do more good than harm for the environment, while 18% say they do more harm than good and 29% say they make no difference. Americans are slightly less likely to say climate policies do more good than harm for the environment today than in January 2022.
Consistent with past Center surveys, Republicans and Democrats are far apart in their views of how climate policies impact the economy and the environment.
About half of Democrats (52%) say climate policies help the economy. By contrast, 56% of Republicans say climate policies hurt the economy. And while 75% of Democrats say climate policies do more environmental good than harm, just 28% of Republicans hold this view.


