Public Trust in Scientists and Views on Their Role in Policymaking
Trust moves slightly higher but remains lower than before the pandemic
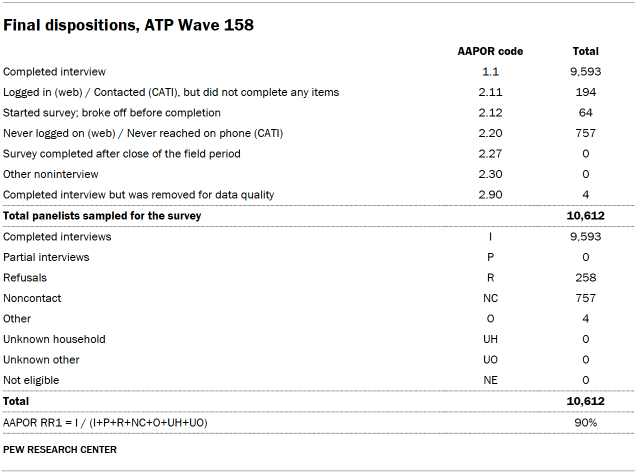
Pew Research Center conducted this study to understand how Americans view scientists and their role in making public policy. For this analysis, we surveyed 9,593 U.S. adults from Oct. 21 to 27, 2024.
Everyone who took part in the survey is a member of the Center’s American Trends Panel (ATP), a group of people recruited through national, random sampling of residential addresses who have agreed to take surveys regularly. This kind of recruitment gives nearly all U.S. adults a chance of selection. Surveys were conducted either online or by telephone with a live interviewer. The survey is weighted to be representative of the U.S. adult population by gender, race, ethnicity, partisan affiliation, education and other categories. Read more about the ATP’s methodology.
Here are the questions used for this report, the topline and the survey methodology.
A majority of Americans say they have confidence in scientists to act in the public’s best interests. Confidence ratings have moved slightly higher in the last year, marking a shift away from the decline in trust seen during the COVID-19 pandemic.

A new Pew Research Center survey of 9,593 U.S. adults conducted Oct. 21-27, 2024, takes a close look at the public image of scientists, who serve as one potential source of information for Americans navigating complex policy debates and everyday decisions around things like their personal health and wellness.
Key findings
76% of Americans express a great deal or fair amount of confidence in scientists to act in the public’s best interests.
This is up slightly from 73% in October 2023 and represents a halt to the decline seen during the COVID-19 pandemic. Scientists continue to enjoy strong relative standing compared with the ratings Americans give to many other prominent groups, including elected officials, journalists and business leaders.
Majorities view research scientists as intelligent (89%) and focused on solving real-world problems (65%).

In addition, about two-thirds (65%) view research scientists as honest and 71% view them as skilled at working in teams.
Communication is seen as an area of relative weakness for scientists.
Overall, 45% of U.S. adults describe research scientists as good communicators. A slightly larger share (52%) say this phrase does not describe research scientists well.
Another critique many Americans hold is the sense that research scientists feel superior to others; 47% say this phrase describes them well.
Americans are split over scientists’ role in policymaking.

Overall, 51% say scientists should take an active role in public policy debates about scientific issues. By contrast, nearly as many (48%) say they should focus on establishing sound scientific facts and stay out of public policy debates.
Americans also aren’t convinced scientists make better policy decisions on science issues than other people – just 43% think this is the case.
Democrats continue to express more confidence than Republicans in scientists, but ratings within the GOP have edged higher in the last year.
A larger majority of Democrats than Republicans express confidence in scientists to act in the public’s best interests (88% vs. 66%).
Though the partisan gap in trust remains sizable, Republicans’ overall level of confidence in scientists is up 5 percentage points compared with a year ago – the first uptick in trust among Republicans since the start of the pandemic.
Partisans also differ over scientists’ role in policy debates, with Democrats far more supportive than Republicans of active engagement in making policy on scientific issues.
Trends in trust in scientists
In recent years, the scientific community has engaged with the public’s declining trust directly, and there are multiple organizations working on ways to support trust in science and improve communication with wider audiences.
About three-quarters of Americans say they have either a great deal (26%) or a fair amount (51%) of confidence in scientists to act in the best interests of the public. This share is up slightly since last year. Still, levels of confidence in scientists remain lower than in April 2020 – at the outset of the COVID-19 pandemic. At that time, 87% expressed at least a fair amount of confidence in scientists, including 39% who said they had a great deal of confidence.
Trust in scientists compared with trust in other groups
In an era of low public trust in institutions, scientists continue to be held in higher regard than several other prominent groups we’ve asked about, including journalists, elected officials, business leaders and religious leaders. Confidence ratings for scientists are even slightly higher than those for public school principals and police officers – two groups that receive positive overall ratings.
Go to the Appendix for more detailed views of these groups. The Appendix also includes views of medical scientists, whose ratings are very similar to those for scientists generally.

Differences in confidence by party
Roughly nine-in-ten Democrats and Democratic-leaning independents (88%) express a great deal or fair amount of confidence in scientists to act in the public’s best interests. The share of Democrats with at least a fair amount of confidence in scientists is similar to levels seen prior to the pandemic.
However, the share of Democrats who express a great deal of confidence in scientists stands at 40%, significantly below the peak in strong trust seen during the pandemic’s first year. In April 2020, 52% of Democrats expressed a great deal of confidence in scientists, and in November 2020, that share reached 55%.
Republicans’ views follow a different pattern. Two-thirds of Republicans and Republican leaners say they have a great deal or a fair amount of confidence in scientists to act in the public’s best interest. About a third (34%) express distrust, saying they have not too much or no confidence at all in scientists. In April 2020, an 85% majority of Republicans said they had a great deal or fair amount of confidence in scientists, compared with just 14% who had little or no confidence.
While GOP ratings of scientists remain much lower than they were before the pandemic, there has been a slight improvement in trust over the last year. The share with a great deal or fair amount of confidence is up 5 points since October 2023, from 61% to 66%.
Differences in confidence by race and ethnicity
Overall, White, Black and Hispanic adults express similar levels of confidence in scientists. For instance, 78% of White adults have either a great deal (26%) or fair amount (52%) of confidence in scientists to act in the public’s best interests; among Black adults, 77% express either a great deal (26%) or fair amount (51%) of confidence.

Asian adults hold the most positive views of scientists across racial and ethnic groups: 85% have a great deal or fair amount of confidence in them.
In the years prior to the pandemic – and in early 2020, during the first few months of the coronavirus outbreak – White adults expressed somewhat higher levels of confidence in scientists than Black adults.
This gap has closed primarily due to a decline in trust among White Republicans – driving overall levels of trust among White adults lower – rather than an increase in trust among Black adults.
Differences in trust by race and ethnicity are apparent when taking partisan affiliation into account. For example, White Democrats (48%) and Asian Democrats (45%) are more likely than Hispanic Democrats (30%) and Black Democrats (29%) to have a great deal of confidence in scientists. These patterns are consistent with Center surveys conducted over the last several years.
Differences in confidence by education
There are also some differences in trust by Americans’ level of education. Strong trust in scientists is higher among four-year college graduates than among those without a college degree (34% vs. 22%).
This gap is primarily driven by differences among Democrats. Democrats with a college degree are 17 points more likely than Democrats without a college degree to say they have a great deal of confidence in scientists (51% vs. 34%). By contrast, among Republicans, similar shares of those with and without a four-year degree have strong confidence in scientists (15% vs. 11%).
For more detailed views by education and party, refer to the Appendix.
Public perceptions of scientists’ traits and characteristics
Americans associate research scientists with a number of positive characteristics – including intelligence, honesty and concern for real-world problems – which underscore the relatively high confidence ratings scientists receive.

Nearly nine-in-ten U.S. adults (89%) say “intelligent” describes most research scientists well. Majorities also view research scientists as skilled at working in teams (71%), focused on solving real-world problems (65%) and honest (65%).
Research scientists are rated less positively on their communication abilities. Fewer than half of Americans (45%) view research scientists as good communicators. This share is 9 points lower than it was in 2019.
Communication was point of frustration during the COVID-19 pandemic. In 2022 surveys, Americans gave public health officials mixed ratings for their communication efforts and 60% said they felt confused about shifting health guidance.
Some negative traits also register with many Americans in their assessments. About half of Americans (49%) say “socially awkward” describes most research scientists well, and 47% have the impression that scientists feel superior to others. Smaller shares view research scientists as cold, closed-minded or inattentive to the moral values of society.
Views of scientists’ traits by party
Democrats are more likely than Republicans to assess research scientists positively on their traits and characteristics. This is consistent with the different levels of confidence Democrats and Republicans have in scientists generally.

For instance, 80% of Democrats view research scientists as honest, compared with 52% of Republicans.
While Democrats have a broadly positive view of research scientists across most traits we asked about, communication is an area where impressions are less glowing. Slightly more than half of Democrats (54%) view research scientists as good communicators; 44% do not.
Within the GOP, the sense that research scientists feel superior to others registers with a 61% majority. Of the positive traits in the survey, communication ability ranks the lowest among Republicans, with just 37% viewing research scientists as good communicators. Republicans also express mixed views on whether research scientists are focused on solving real-world problems: 52% say this phrase describes them well, while 46% say it does not.
Across several traits, ratings among Republicans are more negative today than in 2019. For instance, there’s been a 17-point decline in the share of Republicans who view research scientists as focused on real-world problems (69% to 52%).
Views on scientists’ judgment and role in policymaking
Americans are divided over how active they want scientists to be in public policy debates over scientific issues. And Americans are not convinced that scientists make better policy decisions on science topics than other people, or that they are less biased in their decision-making.

Overall, 51% say scientists should take an active role in public policy debates about scientific issues, compared with 48% who say instead that they should focus on establishing sound scientific facts and stay out of policy debates.
When it comes to scientists’ current level of engagement, views are mixed: 41% say they don’t have enough influence in policy debates, while 37% think they have about the right amount of influence and 20% say they have too much.
Two-thirds of Democrats say scientists should be active in policy debates on scientific issues, and 61% say they currently don’t have enough influence in shaping policy.
By contrast, Republicans express a much more limited view for scientists’ policy engagement: 64% say they should stay out of policy debates. And more say they currently have too much rather than not enough policy influence (34% vs. 22%). Another 43% describe their influence as about right.
Public support for scientists’ playing an active role in policy remains lower than it was in surveys from 2019 and early 2020. In both of those surveys, 60% of Americans said scientists should take an active role in public policy debates about scientific issues. That share fell to 48% in September 2022 – well into the second year of the COVID-19 pandemic. The current survey marks a slight uptick (+3 points) in the share who support an active policy role for scientists.
For more detailed information on this question over time, go to the Appendix.
Should public opinion play a role in science policy?

In addition to debate about experts’ role in policymaking, there’s no consensus over how much public attitudes should inform science policy.
Overall, 48% say public opinion should play an important role guiding policy decisions about scientific issues; 51% say public opinion should not play an important role because scientific issues are too complex for the average person to understand.
More Republicans say public opinion should than should not play an important role guiding science policy (55% vs. 44%). Democrats lean in the opposite direction: 59% say public opinion should not guide policy on scientific issues, while 40% say it should.
Views on the quality of scientists’ policy judgments
Americans offer reserved assessments of the quality of scientists’ policy decisions.
Fewer than half of Americans (43%) think scientists are usually better than other people at making good policy decisions on scientific issues; 46% think they are neither better nor worse than others in this regard, and 10% view them as worse at making science policy than other people.
More generally, half of Americans say scientists make judgments based solely on the facts, while nearly as many (49%) take the view that scientists’ judgments are just as likely to be biased as other people’s.

As with scientists’ policy role, Republicans and Democrats express contrasting views of scientists’ judgment.
Among Democrats, 64% view scientists as making judgments based solely on the facts, and 58% think they are generally better than other people at making policy decisions about scientific issues.
Republicans are much more skeptical: 62% say scientists’ judgments are just as likely to be biased as other people’s, and only 28% think they generally make better science policy decisions than other people.