Americans’ Extreme Weather Policy Views and Personal Experiences
Majorities who have experienced extreme weather see a link to climate change
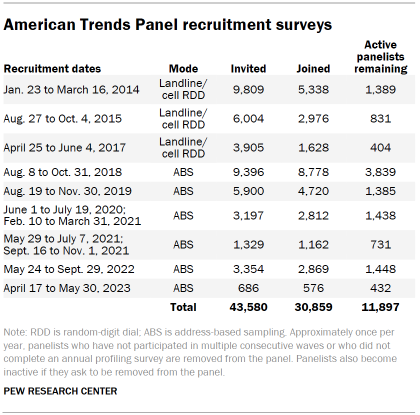
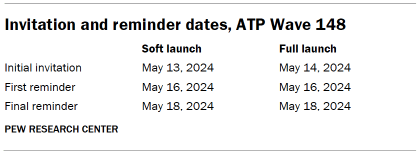
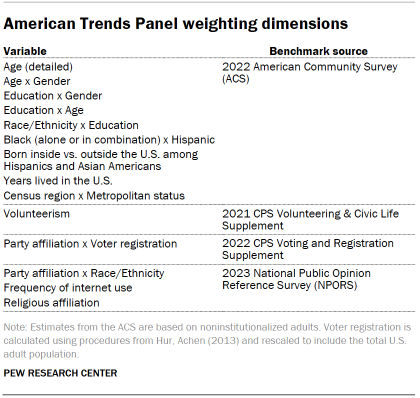
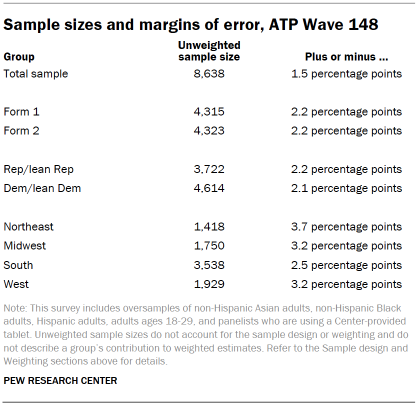
Pew Research Center conducted this study to understand Americans’ experiences with extreme weather and views on policies related to extreme weather. For this analysis, we surveyed 8,638 U.S. adults from May 13 to 19, 2024. Everyone who took part in the survey is a member of the Center’s American Trends Panel (ATP), an online survey panel that is recruited through national, random sampling of residential addresses. This way, nearly all U.S. adults have a chance of selection. The survey is weighted to be representative of the U.S. adult population by gender, race, ethnicity, partisan affiliation, education and other categories. Read more about the ATP’s methodology.
Here are the questions used for this report, along with responses, and its methodology.
The year 2023 brought record-breaking billion-dollar weather disasters, which took a tremendous financial and personal toll on Americans nationwide. As extreme weather continues to make headlines, a new Pew Research Center survey asks Americans what policies they support to address weather-related damage. We also ask people who recently lived through extreme weather events if they think climate change contributed to them, and how their lives were affected.
Key takeaways
Support for regulating construction, but not for bans or mandates. Most Americans (73%) want stricter building standards in areas vulnerable to extreme weather. But more aggressive steps, like requiring people to move out of these areas, are unpopular (just 13% approve).
Reports of extreme weather are common, though they vary by party. About seven-in-ten Americans say that in the past year, they’ve experienced at least one of five types of extreme weather we asked about: severe weather, like floods or intense storms; unusually hot weather; droughts; wildfires; or rising sea levels. Democrats are more likely to report these experiences than Republicans, across each type of extreme weather, though the size of these differences vary by type.
Climate change seen as a factor. Among those who say they’ve experienced any of these extreme weather events, a large majority say climate change contributed at least a little. Most Republicans – and nearly all Democrats – say climate change played a role.
Hardships caused by extreme weather are wide-ranging. Those who say they suffered negative impacts of extreme weather events describe a host of challenges, in their own words. These include property damage, elevated utility and insurance bills, disruptions to daily life, and anxiety.
Jump to read more about: Views on extreme weather policies for places at high risk | Personal experiences with extreme weather | Climate change’s contribution to extreme weather | Negative personal impacts of extreme weather
Views on extreme weather policies for places at high risk
In response to extreme weather, home insurers are hiking premiums and governments are weighing construction restrictions in high-risk zones, among other proposals. Our survey finds some areas of consensus around policies that respondents like – and do not like – to deal with extreme weather.
Building regulations

Respondents like more oversight of construction in areas vulnerable to weather disasters but are much less supportive of outright building bans. When asked about government setting stricter building standards in these high-risk communities, 73% say this is a good idea. In contrast, just 37% say the same of measures to ban new construction.
Financial assistance
Americans have mixed views about government financial assistance, depending on the kind of support. More than half (57%) support aid for communities to rebuild after extreme weather events, with a far smaller share (20%) saying this is a bad idea. Views on providing support to pay rising home insurance costs are more divided, with 40% saying this is a good idea and 34% saying this is a bad idea. But when asked about government buying people’s homes in high-risk areas so they can purchase ones in lower-risk areas, more say this is a bad (38%) than good (25%) idea.
Required relocation
One policy idea that is unpopular among Americans is requiring people in high-risk areas to move out of their communities: Far larger shares say this is a bad rather than good idea (51% vs. 13%).
Policy views by party
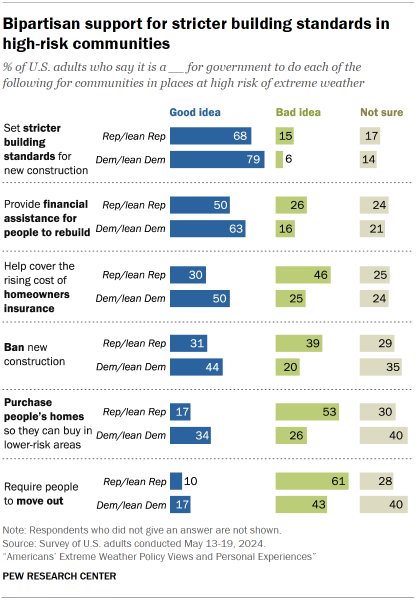
There’s general bipartisan support for policies to set higher building standards, and to help pay rebuilding costs. Majorities of both Democrats (79%) and Republicans (68%) share the view that stricter standards for new construction in high-risk areas are a good idea. Just 15% of Republicans and Republican-leaning independents and 6% of Democrats and Democratic leaners say this is a bad idea.
Similarly, across parties, when it comes to financial assistance to rebuild, larger shares say this is a good idea than bad. Half of Republicans say this is a good idea, compared with 26% who say it’s a bad idea. But the spread is much wider among Democrats, with 63% saying it’s a good idea and 16% saying it’s a bad idea.
Republicans and Democrats also are fairly united in their disapproval of requiring people to move out of high-risk areas. Very small shares of Republicans (10%) and Democrats (17%) say this is a good idea, while 61% of Republicans and 43% of Democrats say this is a bad idea.
Views differ somewhat by party when it comes to banning new construction. Larger shares of Democrats feel this is a good idea (44%) than a bad idea (20%). But among Republicans, these views are flipped, with 39% saying these bans are a bad idea and 31% saying they are a good idea.
There’s also a partisan split when it comes to helping people cover the rising cost of home insurance. Larger shares of Republicans say this is a bad idea (46%) than a good idea (30%). But for Democrats, 50% feel this is a good idea, versus 25% who say it’s a bad idea.
Related: Read our 2024 report How Americans View National, Local and Personal Energy Choices
Personal experiences with extreme weather
About seven-in-ten Americans (72%) report that their local community experienced at least one of the five types of extreme weather events we asked about in the past 12 months: severe weather, like floods or intense storms; long stretches of unusually hot weather; droughts or water shortages; rising sea levels; or major wildfires.
Regional differences
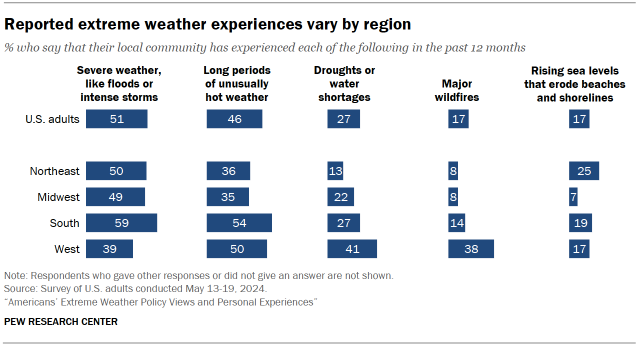
We found pronounced regional differences in reported extreme weather. Half of Westerners and 54% of Southerners say they experienced stretches of unusually hot weather in the past year, compared with roughly a third each in the Northeast or Midwest. And major wildfires are reported by 38% of respondents in the West, but only by 8% in the Northeast and Midwest.
Partisan reporting
Democrats are much more likely than Republicans to say they’ve experienced extreme weather events. For example, 57% of Democrats say they’ve lived through long periods of unusually hot weather, compared with 34% of Republicans. These partisan gaps hold even among Democrats and Republicans who live in the same region.
Climate change’s contribution to extreme weather

According to the United Nations Intergovernmental Panel on Climate Change, climate change is driving increased extreme weather. Among respondents who say they’ve lived through any of the extreme weather events we asked about, there is broad agreement that climate change is a contributor.
For instance, an overwhelming majority (91%) make this link for rising sea levels, with 57% saying climate change contributed a lot and 34% saying it contributed a little.
The same goes for long periods of unusually hot weather, with 61% saying climate change contributed a lot and 28% saying it contributed a little.
Views by party on role of climate change
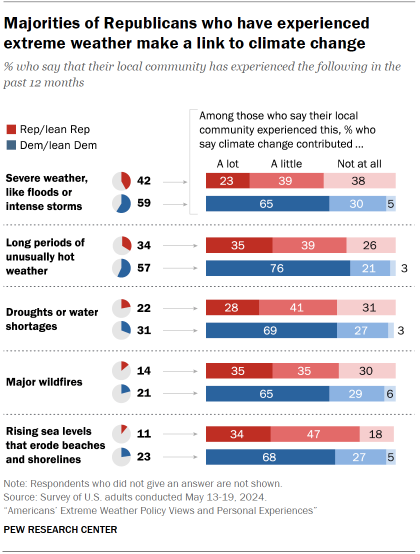
Among those who report experiencing extreme weather in the past year, large shares in both parties say that climate change contributes to these events at least a little. But while nearly all Democrats make this connection for each of the five types of extreme weather we asked about, smaller shares of Republicans share this view.
For example, 97% of Democrats see climate change as a contributor to long periods of unusually hot weather, compared with 74% of Republicans.
Democrats also hold stronger convictions than Republicans about the relationship between climate change and extreme weather. For instance, 65% of Democrats say climate change contributed a lot to the severe weather, like floods or intense storms, that they experienced, and 30% say it contributed a little. In contrast, among Republicans, 23% say that climate change contributed a lot, while 39% say it contributed a little.
Negative personal impacts of extreme weather
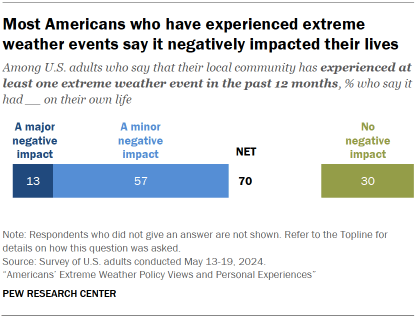
Extreme weather events can be devastating, straining household finances, damaging mental health and threatening lives. Among those who say they’ve experienced at least one of the extreme weather events asked about in our survey during the past 12 months, 70% say it had a negative impact on their own life. This includes 57% who say it had a minor negative impact and 13% who say it had a major negative impact.
Extreme weather’s impact, in their own words

We asked the respondents who said they’ve experienced negative impacts from extreme weather to answer an open-ended question about how these events negatively impacted their lives.
Here’s what they said:
Respondents whose jobs depend on reliable transportation or crop production mentioned how extreme weather events affected their livelihoods and income. One Midwestern woman in her 80s mentioned that “crops were not good so, of course, since we farm, our income was very low.”
“I’ve been earning income as a food delivery driver and, without AC, delivering during the day on a normally hot day was miserable. When it got over 90 degrees, I had to cut back to only delivering after the sun went down, which reduced the hours I was able to work by a lot.” –Woman, 40s, West
Personal property damage or construction costs were mentioned in 15% of responses, spanning damage to houses, cars and yards. An additional 19% spoke of community impacts, like road closures and power outages. One woman in her 70s from the South said, “In the summer of 2023, we had to water the foundation of our home to try to avoid foundation problems like many in our community have had.”
“Our house burned down in 2020 due to major wildfire and it is traumatic seeing it happen again and again to other people in the community and not knowing if it will happen again to us.” –Woman, 40s, West
In addition to the costs to repair personal property, 10% of respondents mentioned being hit with additional expenses like escalating utility bills or elevated home insurance premiums. One respondent noted that “the cost of home insurance, even with no claims, has tripled” (woman, 60s, South).
“Prices have skyrocketed on home insurance, water and electricity. The cost of living and working in our area has lowered our quality of life. Many locals are leaving.” –Woman, 60s, South
Lifestyle impacts were reported by 16%, with affected respondents mentioning being stuck inside due to heat or storms. One Southern woman in her 30s noted, “Major storms made it very dangerous for me [to] travel where I need to go, like to work and to medical appointments.” Relatedly, 5% said their work or schools were limited or even closed entirely.
“Every summer, we dread wildfire season. The smoke in recent years has been so bad that kids can’t go outside to play. We can’t do regular outdoor activities without using a mask.” –Man, 50s, West
Physical and mental health consequences of extreme weather were reported by 11% of affected respondents. They mentioned how hard it was to be stuck indoors and shared their anxiety about future weather disasters. One said, “It reduced my desire to get outside and exercise, which affected my (and my family’s) mood and physical health” (man, 40s, South).
“I live a block away from the ocean and have many concerns. Insurance prices are extremely high, and I worry all the time about flooding.”
–Woman, 50s, Northeast