Pew Research Center

FOR RELEASE JUNE 27, 2024

How Americans View National, Local and Personal Energy Choices

Most Americans want more renewable energy, but support has dipped. Interest in electric vehicles has also declined

BY Alec Tyson and Brian Kennedy

FOR MEDIA OR OTHER INQUIRIES:

Communications Department
202.419.4372
www.pewresearch.org

RECOMMENDED CITATION

Pew Research Center, June 2024, "How Americans View National, Local and Personal Energy Choices"

About Pew Research Center

Pew Research Center is a nonpartisan, nonadvocacy fact tank that informs the public about the issues, attitudes and trends shaping the world. It does not take policy positions. The Center conducts public opinion polling, demographic research, computational social science research and other data-driven research. It studies politics and policy; news habits and media; the internet and technology; religion; race and ethnicity; international affairs; social, demographic and economic trends; science; research methodology and data science; and immigration and migration. Pew Research Center is a subsidiary of The Pew Charitable Trusts, its primary funder.

© Pew Research Center 2026

Table of contents

  • About Pew Research Center
  • How Americans View National, Local and Personal Energy Choices
  • 1. Views on energy development in the U.S.
  • 2. Americans’ views on local wind and solar power development
  • 3. Americans’ perceptions of solar power in their own lives
  • Acknowledgments
  • Methodology
  • Appendix: Detailed charts and tables

How Americans View National, Local and Personal Energy Choices

Most Americans want more renewable energy, but support has dipped. Interest in electric vehicles has also declined

Note: For more recent findings on attitudes about energy issues, read “Americans’ Views on Energy at the Start of Trump’s Second Term.”

How we did this

Pew Research Center conducted this study to understand Americans’ views of energy issues. For this analysis, we surveyed 8,638 U.S. adults from May 13 to 19, 2024.

Everyone who took part in the survey is a member of the Center’s American Trends Panel (ATP), an online survey panel that is recruited through national, random sampling of residential addresses. This way, nearly all U.S. adults have a chance of selection. The survey is weighted to be representative of the U.S. adult population by gender, race, ethnicity, partisan affiliation, education and other categories. Read more about the ATP’s methodology.

Here are the questions used for this report, along with responses, and its Methodology.

The planet’s continued streak of record heat has spurred calls for action by scientists and global leaders. Meanwhile, in the United States, energy development policy is being hotly debated on the national and local levels this election year. How do Americans feel about U.S. energy policy options, and what steps are they willing to take in their own lives to reduce carbon emissions? A new Pew Research Center survey takes a look.

Among the major findings:

Chart shows Support for expanding wind, solar power in the U.S. has fallen since 2020

There’s been a decline in the breadth of support for wind and solar power. The shares who favor expanding solar and wind power farms are down 12 percentage points and 11 points, respectively, since 2020, driven by sharp drops in support among Republicans.

Interest in buying an electric vehicle (EV) is lower than a year ago. Today, 29% of Americans say they would consider an EV for their next purchase, down from 38% in 2023.

Still, a majority of Americans (63%) support the goal of the U.S. taking steps to become carbon neutral by 2050. When asked which is the greater priority, far more Americans continue to say the country should focus on developing renewable energy than fossil fuel sources (65% vs. 34%).

The survey, conducted May 13-19 among 8,638 U.S. adults, finds a fairly modest share of U.S. adults (25%) say it’s extremely or very important to them personally to limit their own “carbon footprint.” Far more give this middling or low priority.

These findings illustrate how large shares of Americans back more renewable energy that would decrease overall carbon emissions. Still, this general orientation does not necessarily translate into strong commitment to reducing personal carbon emissions or interest in buying an EV.

Jump to read more on: Trends in views of energy development in the U.S. | Views on wind and solar development at the local level | Perceptions of solar power in people’s own lives

What’s behind declines in support for wind and solar?

Declines in public support for renewable energy have been driven by Republicans and Republican-leaning independents, whose support started to fall sharply after President Joe Biden took office in early 2021.

  • 64% of Republicans say they favor more solar panel farms, down from 84% in 2020.
  • 56% of Republicans say they favor more wind turbine farms, a 19-point drop from 2020.
Chart shows Growing partisan divide in support for expanding wind, solar power in the U.S.

Over this same time period, views among Democrats and Democratic leaners on these measures are little changed, with large majorities continuing to support more wind and solar development.

In some cases, gaps between Republicans and Democrats over energy policy now approach the very wide partisan divides seen over the importance of climate change.

In May 2020, Democrats were 26 points more likely than Republicans to say the country’s priority should be developing renewable energy (91% vs. 65%). Four years later, that gap has ballooned to 49 points, due almost entirely to changing views among Republicans – 61% of whom now say developing fossil fuels like oil, coal and natural gas should be the more important priority.

Jump to more details on partisan differences in views of U.S. energy development.

But changes in attitudes about policies that would reduce carbon emissions are not solely the result of more negative views among Republicans. For instance, the share of Democrats who say they are very or somewhat likely to consider an EV for their next car purchase has declined from 56% to 45% in the last year. And the share of Democrats who call climate change a very big problem for the U.S. has declined from 71% in 2021 to 58% today.

Views within each party
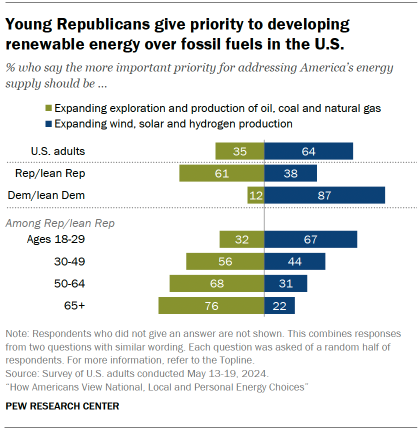
Chart shows Young Republicans give priority to developing renewable energy over fossil fuels in the U.S.

Among Republicans, age matters. Younger Republicans express much more support for renewable energy than do older Republicans. For instance, 67% of Republicans ages 18 to 29 say the country should give priority to wind, solar and hydrogen development. The oldest Republicans (ages 65 and older) take the opposite view: 76% give priority to developing oil, coal and natural gas.

By and large, Democrats are more united in their views on energy. Democrats across age groups broadly support steps that would lower carbon emissions and prioritize renewable sources. But differences emerge over the degree with which to break from fossil fuels: 45% of Democrats say the country should phase out the use of oil, coal and natural gas completely, compared with 53% who say that fossil fuels should remain part of the mix along with renewable sources.

Differences within the two major parties are explored in more detail here.

Views on increasing electric vehicles in the U.S.
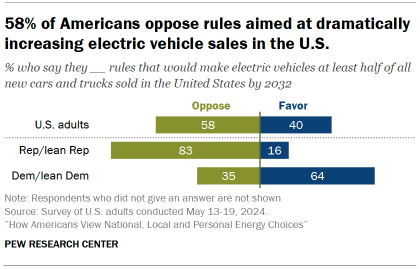
Chart shows 58% of Americans oppose rules aimed at dramatically increasing electric vehicle sales in the U.S.

Amid a major policy push at the federal level for electric vehicles, Americans are unenthusiastic about steps that would phase out gas-powered vehicles.

In March of this year, the Biden administration announced a rule aimed at dramatically expanding EV sales. Overall, 58% of Americans say they oppose these rules that would make EVs at least half of all new cars and trucks sold in the U.S. by 2032. Republicans overwhelmingly oppose this policy (83%). Among Democrats, 64% support these rules to expand EV sales, while 35% say they oppose them.
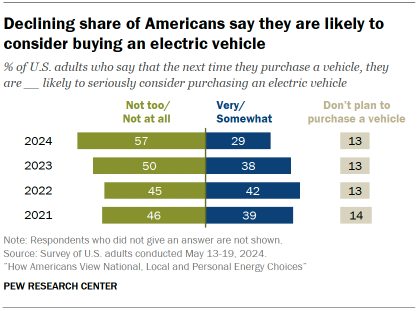
Chart shows Declining share of Americans say they are likely to consider buying an electric vehicle

Americans bought EVs in record numbers last year, but the growth rate is slowing, and interest in EVs has declined. In the current survey, 29% of Americans say they are very or somewhat likely to consider an electric vehicle the next time they purchase a car. Last year, 38% expressed this level of interest in an EV purchase.

Related: About 3 in 10 Americans would seriously consider buying an electric vehicle and the distribution of EV charging stations in the U.S.

Americans’ views on limiting their own ‘carbon footprint’

Discussions about reducing carbon emissions often include the everyday actions people can take to reduce the amount of energy they use. One-in-four Americans say it is extremely or very important to them personally to limit their own “carbon footprint.” Larger shares say this is either somewhat (42%) or not too or not at all (32%) important to them.
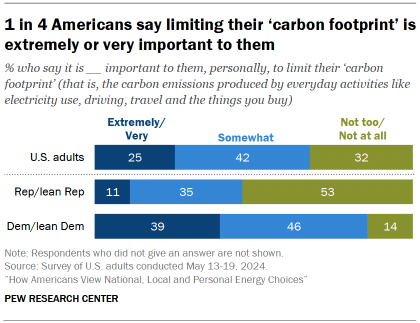
Chart shows 1 in 4 Americans say limiting their ‘carbon footprint’ is extremely or very important to them

Even among Democrats – who express broad support for renewable energy – only 39% say reducing their own carbon footprint is extremely or very important to them personally.

These findings align with a previous Center survey that shows a modest share of Americans (23%) expect to make major sacrifices in their own life because of climate change.

Simply put, the shares of Americans who place the highest priority on limiting their own carbon emissions or expect to make big changes to the way they live because of climate change remain relatively small.

Those who place a high priority on reducing their own carbon footprint – or expect major direct impacts from climate change – are far more likely than other Americans to back aggressive steps to reduce carbon emissions.

For instance, 70% of those who place high importance on reducing their own carbon footprint support rules to dramatically boost EV sales in the U.S. by 2032. Much smaller shares of those who say reducing their carbon footprint is somewhat (43%) or not too or not at all (14%) important support this policy.

1. Views on energy development in the U.S.

Asked about the state of America’s energy supply, 64% say the more important priority for the country should be expanding production of wind, solar and hydrogen power. A smaller share (35%) takes the opposite view, giving greater priority to expanding the exploration and production of oil, coal and natural gas.

Chart shows 64% of U.S. adults prioritize renewable energy over fossil fuels; only 29% want to cut fossil fuels entirely

Still, relatively few Americans think the country should break with fossil fuels entirely. About seven-in-ten (69%) say the country should use a mix of sources like wind and solar in addition to oil, coal and natural gas. By contrast, 29% say the country should phase out oil, coal and natural gas completely and rely only on renewable energy sources.

Views by party

Among Republicans and Republican leaners, 60% give priority to expanding production of oil, coal and natural gas. And 88% say fossil fuels should remain part of the country’s energy mix.

By contrast, most Democrats and Democratic leaners (87%) give priority to the production of wind, solar and hydrogen energy sources. But Democrats are more closely divided over the question of whether to break with fossil fuels altogether: 53% support using a mix of energy sources that includes both renewables and fossil fuels, compared with 45% who support phasing out the use of oil, coal and natural gas entirely.

Chart shows Declining Republican support for developing renewable energy

Over the last several years, Democrats have been consistent in their broad support for prioritizing renewable energy sources like wind and solar. At least 87% have prioritized renewable energy sources in each survey dating back to 2019.

By contrast, there was a major shift toward fossil fuels among Republicans following the 2020 election, with continued movement in this direction in the last several years. Since 2020, the share of Republicans who say they prioritize developing renewable energy over expanding fossil fuels is down 27 percentage points, from 65% to 38%. There has been a corresponding 26-point increase in the share of Republicans who give priority to developing oil, coal and natural gas (from 35% to 61%).

Chart shows Declining Republican support for developing renewable energy

Asked to consider a range of energy sources individually, majorities of Americans say they support more solar panel farms (78%) and more wind power farms (72%). A smaller majority (56%) also supports more nuclear power plants to generate electricity.

By contrast, there is less support for specific forms of fossil fuel development. Fewer than half support more offshore oil and gas drilling (48%), more hydraulic fracturing – sometimes called “fracking” – for oil and gas (44%) or more coal mining (39%).

While still broadly popular with the public, support for more solar and wind power has fallen in recent years due to major declines among Republicans.

There is greater support for nuclear power today than in 2020, with both Republicans and Democrats expressing more positive views.

Support for more offshore drilling, hydraulic fracturing and coal mining is somewhat higher today than in 2020 due to significant increases in support among Republicans. For example, 68% of Republicans now support more hydraulic fracturing, up from 56% in 2020.

Age differences among Republicans in energy attitudes

Chart shows Younger Republicans far more likely than older Republicans to prioritize renewable energy

Among Republicans, younger adults stand out for being much more supportive of renewable energy than their older counterparts.

When asked whether developing renewable energy or fossil fuel sources should be the more important priority, two-thirds of Republicans ages 18 to 29 prioritize renewable energy production. By contrast, about three-quarters of Republicans ages 65 and older (76%) prioritize developing production from oil, coal and natural gas.

Almost all Democrats, regardless of age, prioritize developing renewable energy sources such as wind and solar.

Chart shows Large majorities of young Republicans support more wind and solar energy

When it comes to specific energy sources, younger Republicans are more likely to favor expanding wind and solar power while older Republicans are more likely to favor more offshore oil and gas drilling, hydraulic fracturing and coal mining.

On wind and solar:

  • Republicans ages 18 to 29 are 30 points more likely than Republicans ages 65 and older to favor more wind power (75% vs. 45%) and 26 points more likely to favor more solar power (80% vs. 54%).

On offshore oil and gas drilling:

  • 84% of Republicans ages 65 and older favor more offshore oil and gas drilling, compared with 52% of Republicans ages 18 to 29.

Older Republicans are also more likely than the youngest Republicans to support more hydraulic fracturing and coal mining.

Chart shows Growing age gap among Republicans in support for more wind and solar power in the U.S.

The current GOP age gaps in support for wind and solar energy are a result of shifts that have taken place over the last four years. Support has fallen sharply among older Republicans, while views among those under 30 have changed only modestly. For example:

  • Among Republicans ages 65 and older, support for more solar power has declined by 25 points since 2020 and support for more wind power has fallen by 24 points.
  • Among Republicans ages 18 to 29, there have been single-digit declines in support for more solar and wind power over this timespan (down 7 points and 4 points, respectively).

2. Americans’ views on local wind and solar power development

Amid a major increase in renewable energy development across the country, some projects are facing resistance from local residents. In addition, there’s been a rise in the number of local regulations aimed at restricting or preventing renewable energy projects.

Chart shows One-third of U.S. adults say a nearby solar development would help their local economy

The Pew Research Center survey explores how Americans would feel about a wind or solar power development in their own community.

On balance, more think wind or solar development would help rather than hurt their local economy. But large shares think it would make no difference or are not sure. Respondents were asked to consider the prospect of wind and solar developments separately, but views on these two types of renewable energy development are very similar.

  • When it comes to the installation of a solar panel farm in their community, 33% think this would help their local economy while just 7% think it would hurt it. A majority of Americans don’t see a clear positive or negative impact: 30% say it would make no difference and an identical share say they are not sure.
  • Views of the local economic impact of a wind turbine farm are similar: 33% think it would help the local economy, compared with 9% who say this would hurt it. Another 27% say installing a wind turbine farm would make no difference and 31% are not sure.

Democrats are far more positive than Republicans about the local impact of solar and wind development, consistent with differences on renewable energy issues generally:

  • Among Democrats and Democratic leaners, 46% say installing a solar panel farm in their community would improve their local economy, compared with just 3% who say this would hurt it. Another 23% think it would make no difference.
  • In contrast, only 21% of Republicans and GOP leaners think a local solar development would help their local economy. Still, few Republicans (10%) think this type of development would hurt the local economy. The most common view is that it would make no difference (39%).

Younger adults are more likely than older adults to say that wind and solar developments in their community would help the local economy. For instance:

  • 45% of U.S. adults under 30 think installing a solar panel farm in their community would help the local economy. Just 24% of those ages 65 and older say the same.
  • Both Democrats and Republicans ages 18 to 29 are more likely than their older counterparts to say that wind and solar installments would have a positive effect on their local economy.
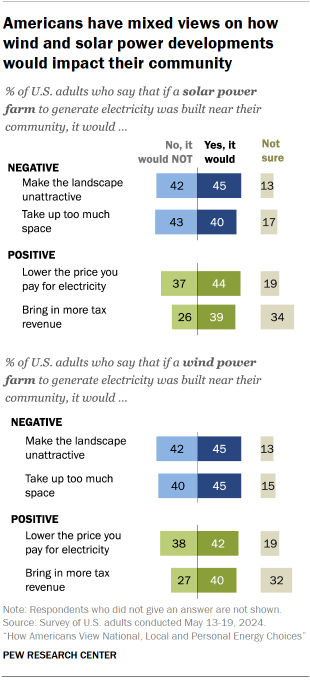
Chart shows Americans have mixed views on how wind and solar power developments would impact their community

The survey also asked Americans to consider the local impact of wind and solar developments on things like the beauty of the landscape and utility bills. Overall, the public expresses fairly mixed sentiment across the examples asked about.

For instance, 45% of U.S. adults say that the installation of a solar panel farm in their area would definitely or probably make the landscape unattractive. Almost as many (42%) say it would not do this. Four-in-ten say a solar panel farm would take up too much space, while 43% say it would not.

On balance, more Americans think a local solar development would lower the price they pay for electricity than not (44% vs. 37%). Views tilt positive on the impact on tax revenue – though many say they’re not sure.  

Opinions about the impact of wind power development follow the same general patterns as those for solar power.

Democrats hold more positive views than Republicans on the impact of local wind and solar development on tax revenue and utility prices.

Republicans are more likely than Democrats to expect that local wind and solar development will negatively impact the landscape and take up too much space.

For more details on these differences, refer to the Appendix.

Rural Americans’ views of local renewable energy development

For the U.S. to meet its goal of being carbon neutral by 2050, the country will have to vastly increase its solar and wind power developments, requiring millions of acres of land. Many of these wind and solar developments are expected to be in rural areas, where land is more available and cheaper.

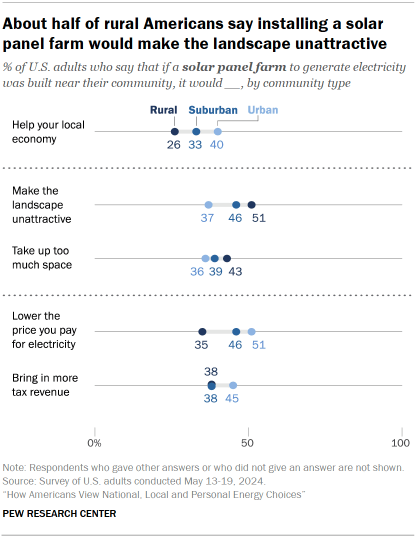
Chart shows About half of rural Americans say installing a solar panel farm would make the landscape unattractive

Funding for renewable energy projects is already flowing into rural parts of the country. For example, the Biden administration in 2023 announced $11 billion of funding for renewable energy projects in rural communities. At the same time, many of the protests against wind and solar developments have happened in rural areas.

The survey finds that rural Americans have less positive views of wind and solar developments than Americans who live in urban or suburban areas.

  • Rural Americans are less likely to say wind and solar developments would help their local economy. About a quarter of rural residents (26%) say a local solar development would help their local economy, compared with 33% of suburban residents and 40% of urban residents.
  • Rural residents are more likely to expect negative outcomes from local wind and solar development: About half say that a solar panel farm in their community would make the landscape ugly. By contrast, 37% of urban Americans say this.
  • Rural Americans are less likely to expect positive consequences from renewable energy development. For example, 35% of rural residents say a local solar panel farm would lower the price they pay for electricity, compared with 51% of urban residents.

Rural Americans are more likely to lean toward or identify with the Republican Party than Americans who live in suburban or urban areas. Still, there are some differences in views among Republicans, with rural Republicans tending to be more critical of renewable energy developments than Republicans living in urban areas.

3. Americans’ perceptions of solar power in their own lives

Large-scale solar power generates about 4% of all electricity in the U.S. Capacity has almost doubled in the last year. Smaller-scale installations – including solar panels on things like homes and public buildings – have also seen sharp growth.

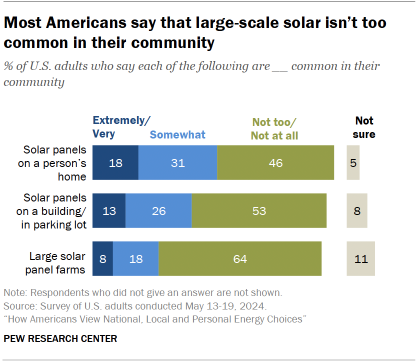
Chart shows Most Americans say that large-scale solar isn’t too common in their community

The new Center survey asked Americans how common three different types of solar panel developments are in their community: small-scale solar development on homes, somewhat larger solar developments on buildings and in parking lots, and large-scale solar panel farms.

Americans report that home solar is the most common of these three types in their community.

  • 18% of Americans say solar panels are extremely or very common on a person’s home in their community. An additional 31% say solar panels are somewhat common.
  • 13% say solar panels are extremely or very common on buildings or in parking lots in their community; 26% say this is somewhat common.
  • 8% say large solar panel farms are extremely or very common in their community and 18% say they are somewhat common. A majority (64%) say large-scale solar developments are not too or not at all common.

There are only modest differences in perceptions of solar panel development between Republicans and Democrats.

In a 2023 Pew Research Center survey, 7% of homeowners said they have installed solar panels on their home; an additional 28% said they were seriously considering it.

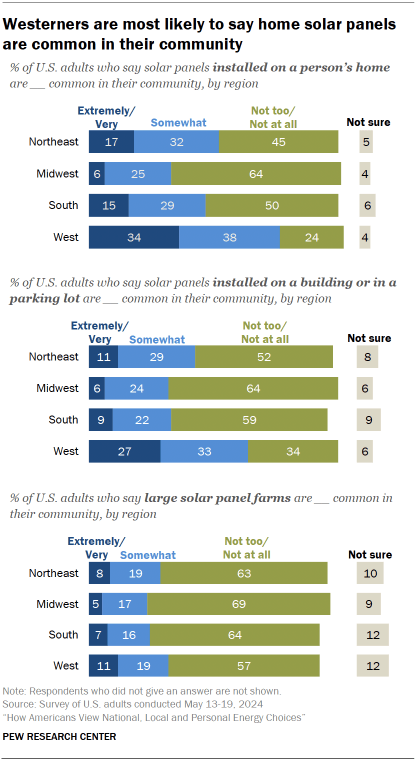
Chart shows Westerners are most likely to say home solar panels are common in their community

Westerners are most likely to report that home solar panels are common in their community. About one-third of Westerners say solar panels installed on a home are extremely or very common in their community.

In contrast, just 6% of Midwesterners say home solar panels are extremely or very common in their community. A majority (64%) say they are not too or not at all common.

The perception of solar development in the U.S. is consistent with geographic data on solar panel installation. According to the U.S. Energy Information Administration’s Residential Energy Consumption Survey, the West leads the country in small-scale solar installments, followed by the Northeast, the South and the Midwest.

The regional differences are more modest when it comes to perceptions of large-scale solar development.

Acknowledgments

This report is made possible by The Pew Charitable Trusts. It is a collaborative effort based on the input and analysis of the following individuals. Find related reports online at: pewresearch.org/science.

Primary research team       

Eileen Yam, Director, Science and Society Research
Alec Tyson, Associate Director, Science and Society Research
Brian Kennedy, Senior Researcher
Giancarlo Pasquini, Research Associate
Emma Kikuchi, Research Assistant    
Isabelle Pula, Research Assistant      

Editorial and graphic design          

Rebecca Leppert, Copy Editor
Kaitlyn Radde, Associate Information Graphics Designer

Communications and web publishing      

Haley Nolan, Communications Manager
Talia Price, Communications Associate
Reem Nadeem, Digital Producer

In addition, the project benefited greatly from the guidance of the Pew Research Center methodology team: Courtney Kennedy, Andrew Mercer, Ashley Amaya, Dorene Asare-Marfo, Dana Popky, Anna Brown and Arnold Lau.

Methodology

The American Trends Panel survey methodology

Overview

The American Trends Panel (ATP), created by Pew Research Center, is a nationally representative panel of randomly selected U.S. adults. Panelists participate via self-administered web surveys. Panelists who do not have internet access at home are provided with a tablet and wireless internet connection. Interviews are conducted in both English and Spanish. The panel is being managed by Ipsos.

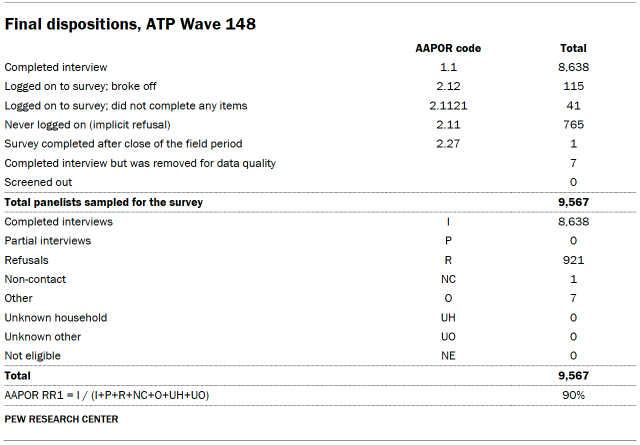
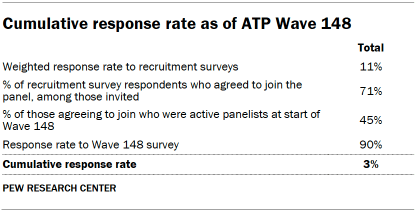
Data in this report is drawn from ATP Wave 148, conducted from May 13 to 19, 2024, and includes an oversample of non-Hispanic Asian adults, non-Hispanic Black adults, Hispanic adults, adults ages 18 to 29, and panelists who are using a Center-provided tablet, in order to provide more precise estimates of the opinions and experiences of these smaller demographic subgroups. These oversampled groups are weighted back to reflect their correct proportions in the population. A total of 8,638 panelists responded out of 9,567 who were sampled, for a response rate of 90%. The cumulative response rate accounting for nonresponse to the recruitment surveys and attrition is 3%. The break-off rate among panelists who logged on to the survey and completed at least one item is 1%. The margin of sampling error for the full sample of 8,638 respondents is plus or minus 1.5 percentage points.

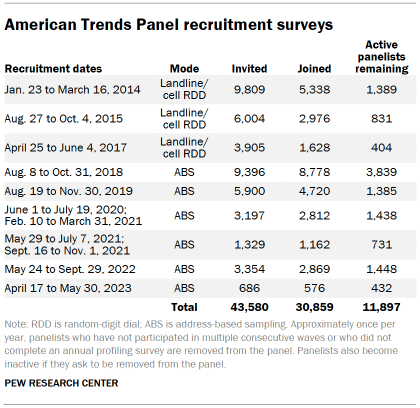
Panel recruitment

The ATP was created in 2014, with the first cohort of panelists invited to join the panel at the end of a large, national, landline and cellphone random-digit-dial survey that was conducted in both English and Spanish. Two additional recruitments were conducted using the same method in 2015 and 2017, respectively. Across these three surveys, a total of 19,718 adults were invited to join the ATP, of whom 9,942 (50%) agreed to participate.

Table shows American Trends Panel recruitment surveys

In August 2018, the ATP switched from telephone to address-based sampling (ABS) recruitment. A study cover letter and a pre-incentive are mailed to a stratified, random sample of households selected from the U.S. Postal Service’s Delivery Sequence File. This Postal Service file has been estimated to cover as much as 98% of the population, although some studies suggest that the coverage could be in the low 90% range.1 Within each sampled household, the adult with the next birthday is asked to participate. Other details of the ABS recruitment protocol have changed over time but are available upon request.2

We have recruited a national sample of U.S. adults to the ATP approximately once per year since 2014. In some years, the recruitment has included additional efforts (known as an “oversample”) to boost sample size with underrepresented groups. For example, Hispanic, Black and Asian adults were oversampled in 2019, 2022 and 2023, respectively.

Across the six address-based recruitments, a total of 23,862 adults were invited to join the ATP, of whom 20,917 agreed to join the panel and completed an initial profile survey. Of the 30,859 individuals who have ever joined the ATP, 11,897 remained active panelists and continued to receive survey invitations at the time this survey was conducted.

The American Trends Panel never uses breakout routers or chains that direct respondents to additional surveys.

Sample design

The overall target population for this survey was noninstitutionalized persons ages 18 and older living in the U.S., including Alaska and Hawaii. It featured a stratified random sample from the ATP in which Hispanic men, non-Hispanic Black men, non-Hispanic Asian adults, adults ages 18 to 29, and panelists who are using a Center-provided tablet were selected with certainty. The remaining panelists were sampled at rates designed to ensure that the share of respondents in each stratum is proportional to its share of the U.S. adult population to the greatest extent possible. Respondent weights are adjusted to account for differential probabilities of selection as described in the Weighting section below.

Questionnaire development and testing

The questionnaire was developed by Pew Research Center in consultation with Ipsos. The web program was rigorously tested on both PC and mobile devices by the Ipsos project management team and Pew Research Center researchers. The Ipsos project management team also populated test data that was analyzed in SPSS to ensure the logic and randomizations were working as intended before launching the survey.

Incentives

All respondents were offered a post-paid incentive for their participation. Respondents could choose to receive the post-paid incentive in the form of a check or a gift code to Amazon.com or could choose to decline the incentive. Incentive amounts ranged from $5 to $20 depending on whether the respondent belongs to a part of the population that is harder or easier to reach. Differential incentive amounts were designed to increase panel survey participation among groups that traditionally have low survey response propensities.

Data collection protocol

The data collection field period for this survey was May 13 to 19, 2024. Postcard notifications were mailed to a subset of ATP panelists with a known residential address on May 13.3

Invitations were sent out in two separate launches: soft launch and full launch. Seventy panelists were included in the soft launch, which began with an initial invitation sent on May 13. The ATP panelists chosen for the initial soft launch comprised of 60 known responders who had completed previous ATP surveys within one day of receiving their invitation and a random sample of 10 panelists who are using a Center-provided tablet. All remaining English- and Spanish-speaking sampled panelists were included in the full launch and were sent an invitation on May 14.

All panelists with an email address received an email invitation and up to two email reminders if they did not respond to the survey. All ATP panelists who consented to SMS messages received an SMS invitation and up to two SMS reminders.

Table shows Invitation and reminder dates, ATP Wave 148

Data quality checks

To ensure high-quality data, the Center’s researchers performed data quality checks to identify any respondents showing clear patterns of satisficing. This includes checking for whether respondents left questions blank at very high rates or always selected the first or last answer presented. As a result of this checking, seven ATP respondents were removed from the survey dataset prior to weighting and analysis.

Weighting

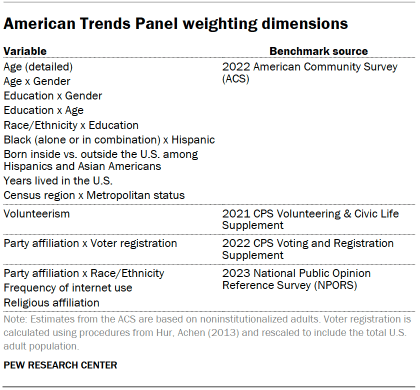
Table shows American Trends Panel weighting dimensions

The ATP data is weighted in a multistep process that accounts for multiple stages of sampling and nonresponse that occur at different points in the survey process. First, each panelist begins with a base weight that reflects their probability of selection for their initial recruitment survey. These weights are then rescaled and adjusted to account for changes in the design of ATP recruitment surveys from year to year. Finally, the weights are calibrated to align with the population benchmarks in the accompanying table to correct for nonresponse to recruitment surveys and panel attrition. If only a subsample of panelists was invited to participate in the wave, this weight is adjusted to account for any differential probabilities of selection.

Among the panelists who completed the survey, this weight is then calibrated again to align with the population benchmarks identified in the accompanying table and trimmed at the 2nd and 98th percentiles to reduce the loss in precision stemming from variance in the weights. This trimming is performed separately among non-Hispanic Black, non-Hispanic Asian, Hispanic, and all other respondents. Sampling errors and tests of statistical significance take into account the effect of weighting.

The following table shows the unweighted sample sizes and the error attributable to sampling that would be expected at the 95% level of confidence for different groups in the survey.

Table shows Sample sizes and margins of error, ATP Wave 148

Sample sizes and sampling errors for other subgroups are available upon request. In addition to sampling error, one should bear in mind that question wording and practical difficulties in conducting surveys can introduce error or bias into the findings of opinion polls.

Dispositions and response rates

Table shows Final dispositions, ATP Wave 148
Table shows Cumulative response rate as of ATP Wave 148

© Pew Research Center 2024

Appendix: Detailed charts and tables

Chart shows Share of older Republicans who say the U.S. should prioritize expanding production of fossil fuels has grown since 2020
Chart shows 29% of Americans support phasing out fossil fuel energy sources altogether
Chart shows Republicans and Democrats differ over how wind and solar development would impact their community
Chart shows Americans’ ratings of the personal importance of limiting their own ‘carbon footprint’
Chart shows 33% of U.S. adults believe installing wind power farms would help their local economy