60% of Americans Would Be Uncomfortable With Provider Relying on AI in Their Own Health Care
Yet many see promise for artificial intelligence to help issues of bias in medical care
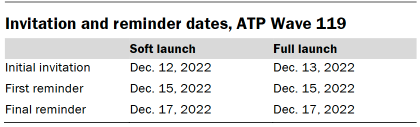
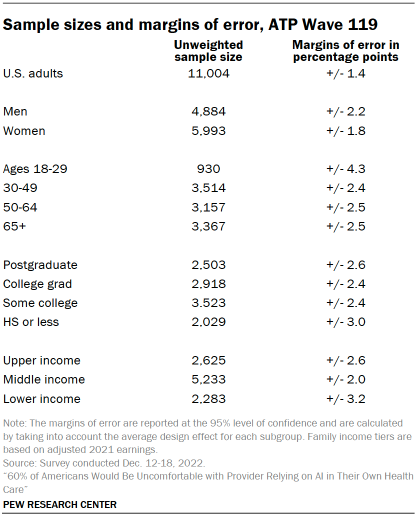
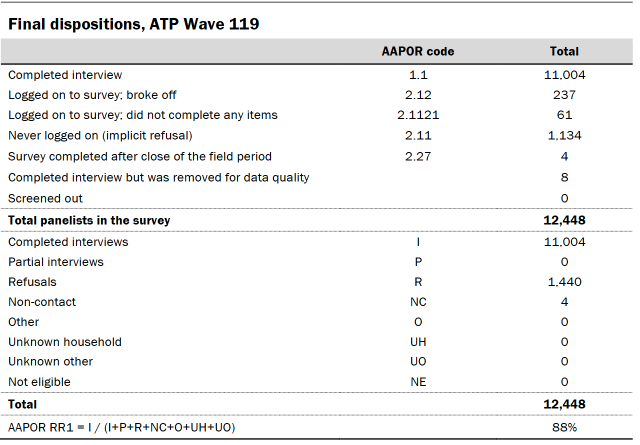
Pew Research Center conducted this study to understand Americans’ views of artificial intelligence (AI) and its uses in health and medicine. For this analysis, we surveyed 11,004 U.S. adults from Dec. 12-18, 2022.
Everyone who took part in the survey is a member of the Center’s American Trends Panel (ATP), an online survey panel that is recruited through national, random sampling of residential addresses. This way, nearly all U.S. adults have a chance of selection. The survey is weighted to be representative of the U.S. adult population by gender, race, ethnicity, partisan affiliation, education and other categories. Read more about the ATP’s methodology.
Here are the questions used for this report, along with responses, and its methodology.
This is part of a series of surveys and reports that look at the increasing role of AI in shaping American life. For more, read “Public Awareness of Artificial Intelligence in Everyday Activities” and “How Americans view emerging uses of artificial intelligence, including programs to generate text or art.”
A new Pew Research Center survey explores public views on artificial intelligence (AI) in health and medicine – an area where Americans may increasingly encounter technologies that do things like screen for skin cancer and even monitor a patient’s vital signs.

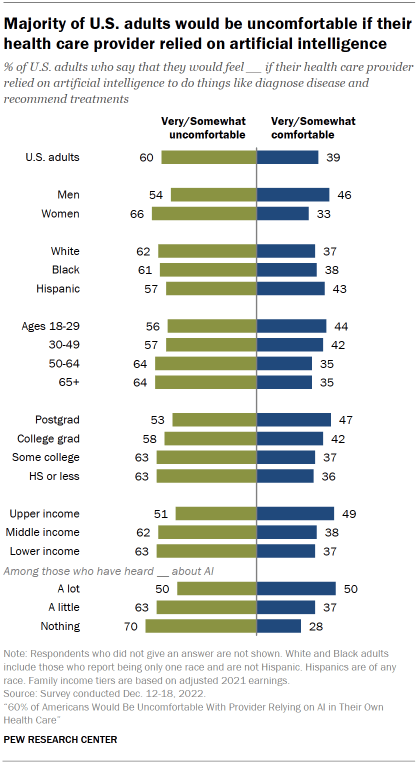
The survey finds that on a personal level, there’s significant discomfort among Americans with the idea of AI being used in their own health care. Six-in-ten U.S. adults say they would feel uncomfortable if their own health care provider relied on artificial intelligence to do things like diagnose disease and recommend treatments; a significantly smaller share (39%) say they would feel comfortable with this.
One factor in these views: A majority of the public is unconvinced that the use of AI in health and medicine would improve health outcomes. The Pew Research Center survey, conducted Dec. 12-18, 2022, of 11,004 U.S. adults finds only 38% say AI being used to do things like diagnose disease and recommend treatments would lead to better health outcomes for patients generally, while 33% say it would lead to worse outcomes and 27% say it wouldn’t make much difference.
These findings come as public attitudes toward AI continue to take shape, amid the ongoing adoption of AI technologies across industries and the accompanying national conversation about the benefits and risks that AI applications present for society. Read recent Center analyses for more on public awareness of AI in daily life and perceptions of how much advancement emerging AI applications represent for their fields.
Asked in more detail about how the use of artificial intelligence would impact health and medicine, Americans identify a mix of both positives and negatives.
On the positive side, a larger share of Americans think the use of AI in health and medicine would reduce rather than increase the number of mistakes made by health care providers (40% vs. 27%).
And among the majority of Americans who see a problem with racial and ethnic bias in health care, a much larger share say the problem of bias and unfair treatment would get better (51%) than worse (15%) if AI was used more to do things like diagnose disease and recommend treatments for patients.
But there is wide concern about AI’s potential impact on the personal connection between a patient and health care provider: 57% say the use of artificial intelligence to do things like diagnose disease and recommend treatments would make the patient-provider relationship worse. Only 13% say it would be better.
The security of health records is also a source of some concern for Americans: 37% think using AI in health and medicine would make the security of patients’ records worse, compared with 22% who think it would improve security.

Though Americans can identify a mix of pros and cons regarding the use of AI in health and medicine, caution remains a dominant theme in public views. When it comes to the pace of technological adoption, three-quarters of Americans say their greater concern is that health care providers will move too fast implementing AI in health and medicine before fully understanding the risks for patients; far fewer (23%) say they are more concerned that providers will move too slowly, missing opportunities to improve patients’ health.
Concern over the pace of AI adoption in health care is widely shared across groups in the public, including those who are the most familiar with artificial intelligence technologies.
Younger adults, men, those with higher levels of education are more open to the use of AI in their own health care
There is more openness to the use of AI in a person’s own health care among some demographic groups, but discomfort remains the predominant sentiment.
Among men, 46% say they would be comfortable with the use of AI in their own health care to do things like diagnose disease and recommend treatments, while 54% say they would be uncomfortable with this. Women express even more negative views: 66% say they would be uncomfortable with their provider relying on AI in their own care.
Those with higher levels of education and income, as well as younger adults, are more open to AI in their own health care than other groups. Still, in all cases, about half or more express discomfort with their own health care provider relying on AI.
Among those who say they have heard a lot about artificial intelligence, 50% are comfortable with the use of AI in their own health care; an equal share say they are uncomfortable with this. By comparison, majorities of those who have heard a little (63%) or nothing at all (70%) about AI say they would be uncomfortable with their own health care provider using AI.
At this stage of development, a modest share of Americans see AI delivering improvements for patient outcomes. Overall, 38% think that AI in health and medicine would lead to better overall outcomes for patients. Slightly fewer (33%) think it would lead to worse outcomes and 27% think it would not have much effect.
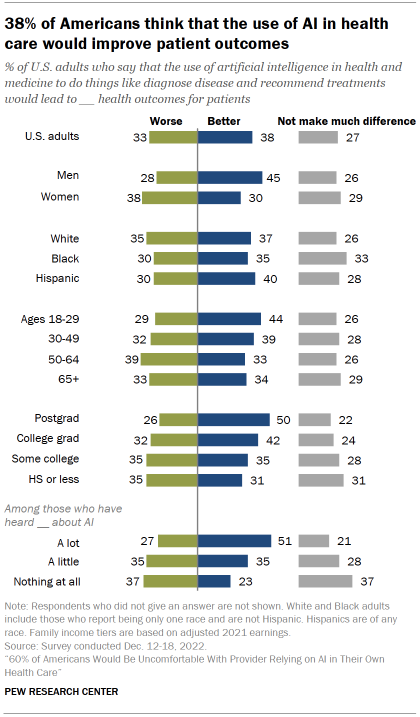
Men, younger adults, and those with higher levels of education are more positive about the impact of AI on patient outcomes than other groups, consistent with the patterns seen in personal comfort with AI in health care. For instance, 50% of those with a postgraduate degree think the use of AI to do things like diagnose disease and recommend treatments would lead to better health outcomes for patients; significantly fewer (26%) think it would lead to worse outcomes.
Americans who have heard a lot about AI are also more optimistic about the impact of AI in health and medicine for patient outcomes than those who are less familiar with artificial intelligence technology.
Four-in-ten Americans think AI in health and medicine would reduce the number of mistakes, though a majority say patient-provider relationships would suffer
Americans anticipate a range of positive and negative effects from the use of AI in health and medicine.
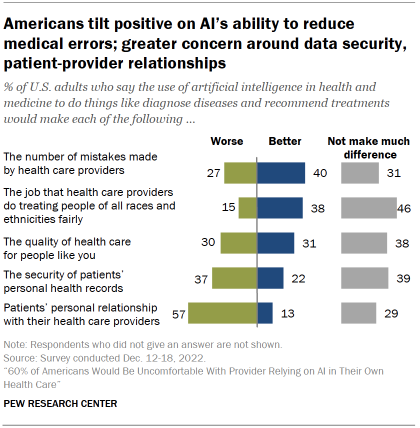
The public is generally optimistic about the potential impact of AI on medical errors. Four-in-ten Americans say AI would reduce the number of mistakes made by health care providers, while 27% think the use of AI would lead to more mistakes and 31% say there would not be much difference.
Many also see potential downsides from the use of AI in health and medicine. A greater share of Americans say that the use of AI would make the security of patients’ health records worse (37%) than better (22%). And 57% of Americans expect a patient’s personal relationship with their health care provider to deteriorate with the use of AI in health care settings.
The public is divided on the question of how it would impact the quality of care: 31% think using AI in health and medicine would make care for people like themselves better, while about as many (30%) say it would make care worse and 38% say it wouldn’t make much difference.
Americans who are concerned about bias based on race and ethnicity in health and medicine are more optimistic than pessimistic about AI’s potential impact on the issue
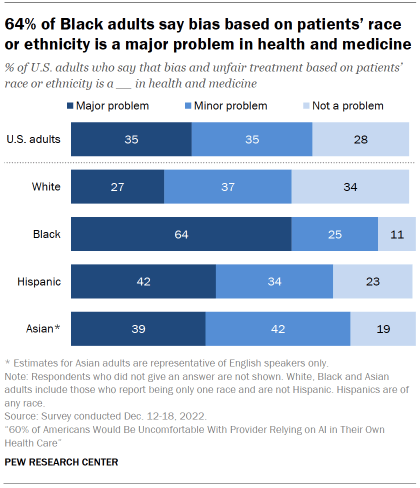
When it comes to bias and unfair treatment in health and medicine based on a patient’s race or ethnicity, a majority of Americans say this is a major (35%) or minor (35%) problem; 28% say racial and ethnic bias is not a problem in health and medicine.
There are longstanding efforts by the federal government and across the health and medical care sectors to address racial and ethnic inequities in access to care and in health outcomes.
Black adults are especially likely to say that bias based on a patient’s race or ethnicity is a major problem in health and medicine (64%). About four-in-ten Hispanic (42%) and English-speaking Asian adults (39%) also say this. A smaller share of White adults (27%) describe bias and unfair treatment related to a patient’s race or ethnicity as a major problem in health and medicine.

On balance, those who see bias based on race or ethnicity as a problem in health and medicine think AI has potential to improve the situation. About half (51%) of those who see a problem think the increased use of AI in health care would help reduce bias and unfair treatment, compared with 15% who say the use of AI would make bias and unfair treatment worse. A third say the problem would stay about the same.
Among those who see a problem with bias in health and medicine, larger shares think the use of AI would make this issue better than worse among White (54% vs. 12%, respectively), Hispanic (50% vs. 19%) and English-speaking Asian (58% vs. 15%) adults. Views among Black adults also lean in a more positive than negative direction, but by a smaller margin (40% vs. 25%).
Note that for Asian adults, the Center estimates are representative of English speakers only. Asian adults with higher levels of English language proficiency tend to have higher levels of education and family income than Asian adults in the U.S. with lower levels of English language proficiency.
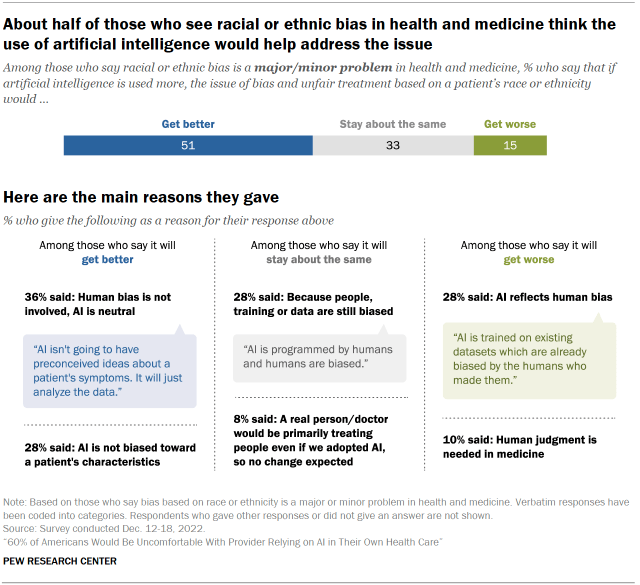
Asked for more details on their views about the impact of AI on bias in health and medicine, those who think it would improve the situation often explain their view by describing AI as more objective or dispassionate than humans. For instance, 36% say AI would improve racial and ethnic bias in medicine because it is more neutral and consistent than people and human prejudice is not involved. Another 28% explain their view by expressing the sense that AI is not biased toward a patient’s characteristics. Examples of this sentiment include respondents who say AI would be blind to a patient’s race or ethnicity and would not be biased toward their overall appearance.
Among those who think that the problem of bias in health and medicine would stay about the same with the use of AI, 28% say the main reason for this is because the people who design and train AI, or the data AI uses, are still biased. About one-in-ten (8%) in this group say that AI would not change the issue of bias because a human care provider would be primarily treating people even if AI was adopted, so no change would be expected.
Among those who believe AI will make bias and unfair treatment based on a patient’s race or ethnicity worse, 28% explain their viewpoint by saying things like AI reflects human bias or that the data AI is trained on can reflect bias. Another reason given by 10% of this group is that AI would make the problem worse because human judgment is needed in medicine. These responses emphasized the importance of personalized care offered by providers and expressed the view that AI would not be able to replace this aspect of health care.
Americans’ views on AI applications used in cancer screening, surgery and mental health support
The Center survey explores views on four specific applications of AI in health and medical care that are in use today or being developed for widespread use: AI-based tools for skin cancer screening; AI-driven robots that can perform parts of surgery; AI-based recommendations for pain management following surgery; and AI chatbots designed to support a person’s mental health.
Public awareness of AI in health and medicine is still in the process of developing, yet even at this early stage, Americans make distinctions between the types of applications they are more and less open to. For instance, majorities say they would want AI-based skin cancer detection used in their own care and think this technology would improve the accuracy of diagnoses. By contrast, large shares of Americans say they would not want any of the three other AI-driven applications used in their own care.
For more on how Americans view the impact of these four developments read, “How Americans view emerging uses of artificial intelligence, including programs to generate text or art.”
AI-based skin cancer screening
AI used for skin cancer detection can scan images of people’s skin and flag areas that may be skin cancer for testing.
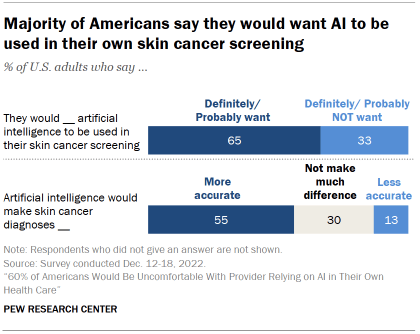
Nearly two-thirds of U.S. adults (65%) say that they would definitely or probably want AI to be used for their own skin cancer screening. Consistent with this view, about half (55%) believe that AI would make skin cancer diagnoses more accurate. Only 13% believe it would lead to less accurate diagnoses, while 30% think it wouldn’t make much difference.
On the whole, Americans who are aware of this AI application view it as an advance for medical care: 52% describe it as a major advance while 27% call it a minor advance. Very few (7%) say it is not an advance for medical care.

Majorities of most major demographic groups say they would want AI to be used in their own screening for skin cancer, with men, younger adults, and those with higher education levels particularly enthused.
A larger majority of men (72%) than women (58%) say they would want AI to be used in their screening for skin cancer.
Black adults (57%) are somewhat less likely than White (65%) and Hispanic (69%) adults to say they would want AI used for skin cancer screening. Experts have raised questions about the accuracy of AI-based skin cancer systems for darker skin tones.
Younger adults are more open to using this form of AI than older adults, and those with a college degree are more likely to say they would want this than those without a college degree.
In addition, those who have heard at least a little about the use of AI in skin cancer screening are more likely than those who have heard nothing at all to say they would want this tool used in their own care (75% vs. 62%).
AI for pain management recommendations
AI is being used to help physicians prescribe pain medication. AI-based pain management systems are designed to minimize the chances of patients becoming addicted to or abusing medications; they use machine learning models to predict things like which patients are at high risk for severe pain and which patients could benefit from pain management techniques that do not involve opioids.
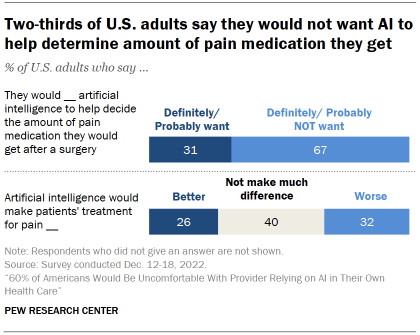
Asked to consider their own preferences for treatment of pain following surgery, 31% of Americans say they would want this kind of AI guiding their pain management treatment while two-thirds (67%) say they would not.
This reluctance is in line with people’s beliefs about the effect of AI-based pain management recommendations. About a quarter (26%) of U.S. adults say that pain treatment would get better with AI, while a majority say either that this would make little difference (40%) or lead to worse pain care (32%).
Among those who say they’ve heard at least a little about this use of AI, fewer than half (30%) see it as a major advance for medical care, while another 37% call it a minor advance. By comparison, larger shares of those aware of AI-based skin cancer detection and AI-driven robots in surgery view these applications as major advances for medical care.
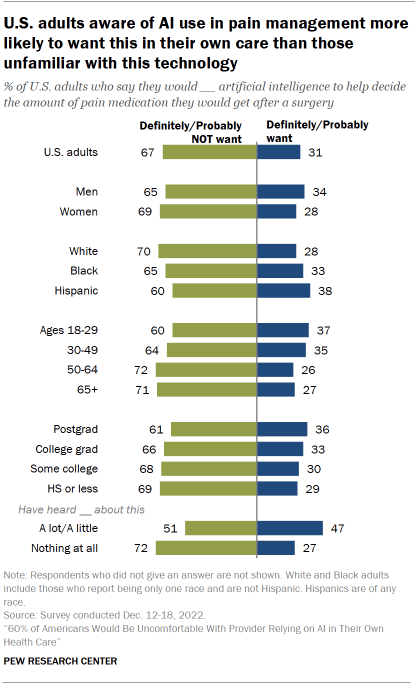
Those with some familiarity with AI-based pain management systems are more open to using AI in their own care plan. Of those who say they have heard at least a little about this, 47% say they would want AI-based recommendations used in their post-op pain treatment, compared with 51% who say they would not want this. By comparison, a large majority (72%) of those not familiar with this technology prior to the survey say they would not want this.
Demographic differences on this question are generally modest, with majorities of most groups saying they would not want AI to help decide their pain treatment program following a surgery.
Performing surgery with AI-driven robots
AI-driven robots are in development that could complete surgical procedures on their own, with full autonomy from human surgeons. These AI-based surgical robots are being tested to perform parts of complex surgical procedures and are expected to increase the precision and consistency of the surgical operation.
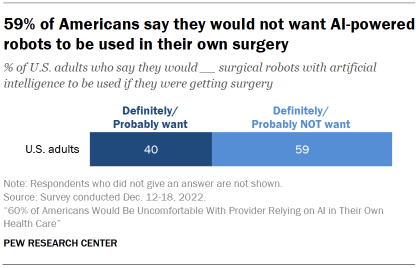
Americans are cautious toward the idea of surgical robots used in their own care: Four-in-ten say they would want AI-based robotics for their own surgery, compared with 59% who say they would not want this.
Still, Americans with at least some awareness of these AI-based surgical robots are, by and large, convinced they represent an advance for medical science: 56% of this group says it is a major advance and another 22% calls it a minor advance. (For more on how Americans view advances in artificial intelligence, read “How Americans view emerging uses of artificial intelligence, including programs to generate text or art.”) Public familiarity with the idea of AI-based surgical robots is higher than for the three other health and medical applications included on the survey; 59% say they have heard at least a little about this development.

As with other AI applications included in the survey, those unfamiliar with AI-driven robots in surgery are especially likely to say they would not want them used in their own care (74% say this). Those who have heard of this use of AI before are evenly divided: 50% say they would want AI-driven robots to be used in their surgery, while 49% say they wouldn’t want this.
Across demographic groups, men are more inclined than women to say they would want an AI-based robot for their own surgery (47% vs. 33%). And those with higher levels of education are more open to this technology than those with lower levels of education.
There is little difference between the views of older and younger adults on this: Majorities across age groups say they would not want an AI-based robot for their own surgery. This contrasts with preferences about other uses of AI in medical care in which younger adults are more likely than older adults to say they would want AI applications for skin cancer screening or pain management.
AI chatbots designed to support mental health
Chatbots aimed at supporting mental health use AI to offer mindfulness check-ins and “automated conversations” that may supplement or potentially provide an alternative to counseling or therapy offered by licensed health care professionals. Several chatbot platforms are available today. Some are touted as ways to support mental health wellness that are available on-demand and may appeal to those reluctant to seek in-person support or to those looking for more affordable options.
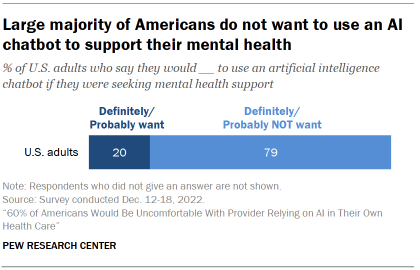
Public reactions to the idea of using an AI chatbot for mental health support are decidedly negative. About eight-in-ten U.S. adults (79%) say they would not want to use an AI chatbot if they were seeking mental health support; far fewer (20%) say they would want this.
In a further sign of caution toward AI chatbots for mental health support, 46% of U.S. adults say these AI chatbots should only be used by people who are also seeing a therapist; another 28% say they should not be available to people at all. Just 23% of Americans say that such chatbots should be available to people regardless of whether they are also seeing a therapist.
Large majorities of U.S. adults across demographic and educational groups lean away from using an AI chatbot for their own mental health support. Read the Appendix for details.

Even among Americans who say they have heard about these chatbots prior to the survey, 71% say they would not want to use one for their own mental health support.
And among those who have heard about these AI chatbots, relatively few (19%) consider these to be a major advance for mental health support; 36% call them a minor advance, while 25% say they are not an advance at all. Public opinion on this use of AI, as with many others, is still developing: 19% of those familiar with mental health chatbots say they’re not sure if this application of AI represents an advance for mental health support.