Lack of Preparedness Among Top Reactions Americans Have to Public Health Officials’ COVID-19 Response
Decline in share of fully vaccinated U.S. adults who have been recently boosted
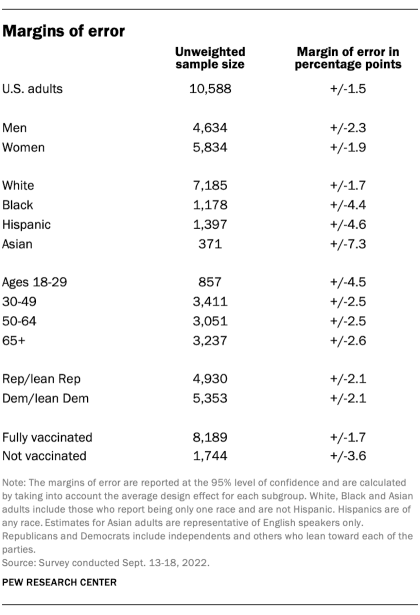
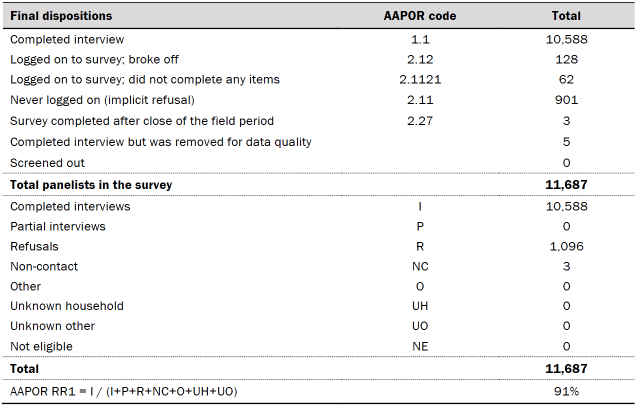
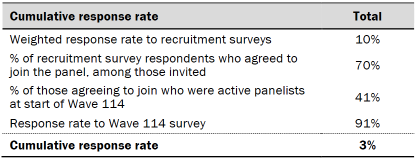
Pew Research Center conducted this study to understand how Americans are continuing to respond to the coronavirus outbreak. For this analysis, we surveyed 10,588 U.S. adults from Sept. 13-18, 2022.
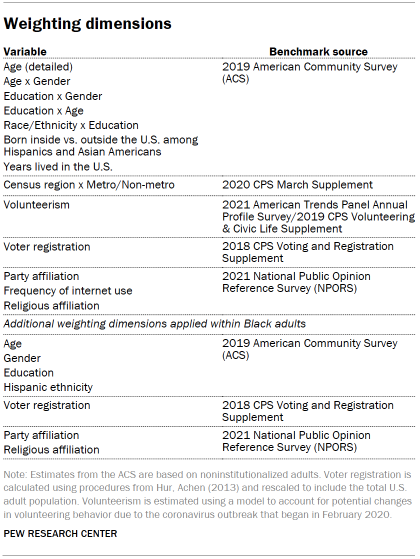
Everyone who took part in the survey is a member of the Center’s American Trends Panel (ATP), an online survey panel that is recruited through national, random sampling of residential addresses. This way, nearly all U.S. adults have a chance of selection. The survey is weighted to be representative of the U.S. adult population by gender, race, ethnicity, partisan affiliation, education and other categories. Read more about the ATP’s methodology.
Here are the questions used for this report, along with responses, and its methodology.
Amid the rollout of updated COVID-19 booster shots around the United States, a new Pew Research Center survey finds mixed views of public health officials at the forefront of the nation’s response to the outbreak.

About half of Americans (51%) say public health officials, such as those at the Centers for Disease Control and Prevention (CDC), have done an excellent or good job communicating with the public about the coronavirus outbreak; however, nearly as many (49%) say they have done an only fair or poor job. The CDC has received criticism for its COVID-19 response, prompting agency leadership to outline changes to the organization.
Asked in more detail about the response of health officials over the course of the coronavirus outbreak, a lack of preparedness is among the sentiments that registers most strongly with Americans: 46% say the statement “public health officials were unprepared for the outbreak” describes their views extremely or very well. Notably, similar shares of Republicans and Democrats express this view.
Yet many Americans also feel public health officials have been hampered in their efforts to respond to the outbreak: 45% of U.S. adults say the statement “interference from elected officials hurt public health officials’ ability to respond to the outbreak” describes their views extremely or very well.
Other sentiments about public health officials register less strongly with Americans overall, due in part to polarized views among partisans. For example, half of Republicans and those who lean toward the GOP strongly align with the statement that “the personal views of public health officials have had too much influence on policy,” while 24% of Democrats say the same. Conversely, 51% of Democrats and Democratic leaners say their views are described extremely or very well by the statement that “public health officials don’t get enough credit for the job they’ve done,” compared with just 15% of Republicans who say this.
The survey of 10,588 U.S. adults conducted from Sept. 13-18, 2022, also explores Americans’ views on the factors that have contributed to problems the country has had dealing with the coronavirus outbreak generally. Misinformation and partisanship are seen as top contributors to problems in the national response to the outbreak, ranking ahead of other factors such as the complex nature of the coronavirus and Americans failing to follow public health recommendations.
A majority (57%) of U.S. adults say false and misleading information about the coronavirus and vaccines has contributed a lot to problems the country has faced dealing with the outbreak. A similar share of Americans (54%) say disagreement between Democrats and Republicans about how to handle the outbreak has contributed a lot.
Nearly identical shares of Republicans and Democrats (57% and 58%, respectively) say false and misleading information about the coronavirus and vaccines has contributed a lot to the problems the country has faced dealing with the outbreak. The survey cannot address whether they were thinking of the same or different examples of such information. Previous Center surveys have found Republicans and Democrats express widely differing views on COVID-19 policies, the effectiveness of vaccines and the lessons they’ve taken away from the pandemic.
Other key findings include:
- Roughly seven-in-ten U.S. adults (71%) say they are fully vaccinated against the coronavirus, about the same as earlier this year. The share of U.S. adults who say they are fully vaccinated and have had a booster shot within the past six months is down from 49% in May 2022 to 38% in the new survey. As a result, a growing share of the adult population does not have the highest level of available inoculation against the disease.
- Looking ahead, among those who are fully vaccinated, about two-thirds say that they will probably get, or have already received, an updated COVID-19 booster shot designed to better protect against recent variants of the virus. Analyzing vaccination status and booster intent across all U.S. adults, 48% say they are fully vaccinated and will probably get (or have already received) an updated booster; 23% say they are fully vaccinated but will probably not get an updated booster shot; 21% say they have not been vaccinated; and 6% say they have received one dose of a COVID-19 vaccine but need one more to be fully vaccinated.
- With personal concern about getting a serious case of COVID-19 continuing to edge lower, 69% of Americans say new variants of the coronavirus will not have a major impact on the country’s efforts to contain the disease. This marks a significant shift in public outlook from February 2021, when 51% said they thought new variants would lead to a major setback for the country and 48% thought they would not.
Americans point to false and misleading information, partisan disagreements as particular problems in dealing with COVID-19 outbreak

Americans see a range of factors as contributing to the problems the country has faced in dealing with the coronavirus pandemic. Foremost among these is false and misleading information; 57% of Americans say this has contributed a lot to problems the country has faced dealing with the outbreak, while 29% say this has contributed some. Just 14% say this has contributed not too much or not at all to the country’s problems dealing with the coronavirus.
A majority of U.S. adults (54%) also see partisan disagreements about how to respond to the outbreak as contributing a lot to the country’s problems dealing with it.
Smaller shares of the public see other factors as contributing a lot to the country’s problems with the COVID-19 pandemic, including ordinary Americans not following public health recommendations (44%), the complex nature of the coronavirus (35%) and government officials overreacting to the coronavirus (31%).

Republicans and Democrats share a concern about the role of false and misleading information related to the pandemic. A majority of Republicans and those who lean to the Republican party (57%) and of Democrats and Democratic leaners (58%) say false and misleading information has contributed a lot to problems dealing with the outbreak.
Sizeable shares of both Republicans and Democrats also believe that partisan disagreement has hindered the country’s efforts to respond to the coronavirus outbreak. Overall, 48% of Republicans and 61% of Democrats say partisan disagreement over how to handle the coronavirus outbreak has contributed a lot to problems the country has faced dealing with it.
Republicans (53%) are much more likely than Democrats (12%) to say that government officials overreacting to the coronavirus outbreak contributed a lot to problems the country has faced in dealing with it.
Conversely, Democrats (64%) are much more inclined to say that ordinary Americans failing to follow public health recommendations contributed a lot to problems (versus 21% among Republicans). Democrats are also more likely than Republicans to say the complex nature of the coronavirus has contributed a lot to problems the country has faced dealing with the outbreak.
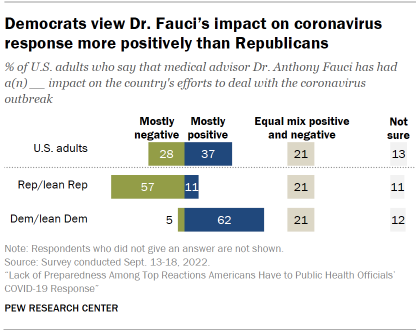
There are also wide differences between Republicans and Democrats when it comes to the impact Dr. Anthony Fauci – the chief medical advisor to the president during the outbreak – has had on the country’s efforts to deal with the coronavirus.
On balance, more Americans say that Dr. Fauci has had a mostly positive (37%) than negative (28%) impact on the country’s efforts to deal with the coronavirus outbreak. Another 21% say his efforts have had an equal mix of positive and negative effects and 13% say they are not sure of their views on this question.
Democrats and Democratic leaners have largely positive views of Dr. Fauci’s impact: 62% say it has been mostly positive. By contrast, Republicans and GOP leaners have largely negative views of Dr. Fauci’s impact (57% say it has been mostly negative).
Americans’ ratings of public health officials edged up from earlier in the year; wide partisan differences remain
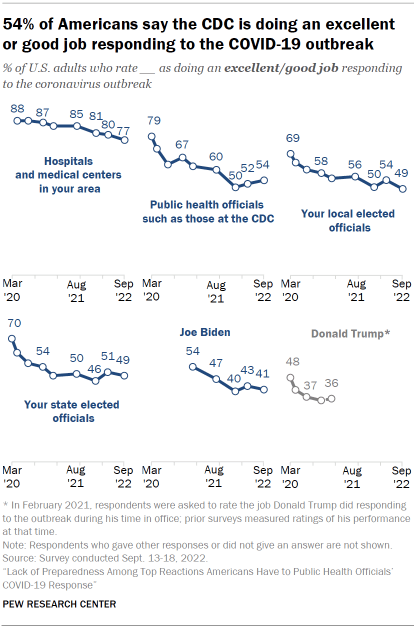
Ratings of the job hospitals and medical centers are doing responding to the outbreak continue to be higher than for any other group considered in the Center survey, though they have drifted down to 77% from 81% at the start of the year.
About four-in-ten U.S. adults (41%) say that President Joe Biden is doing an excellent or good job responding to the coronavirus, roughly the same as in January of this year.
About half of Americans say their state and local elected officials are doing an excellent or good job responding to the pandemic (49% each).
Ratings of state and local elected officials’ handling of the outbreak remain considerably lower than in March 2020, early in the outbreak.
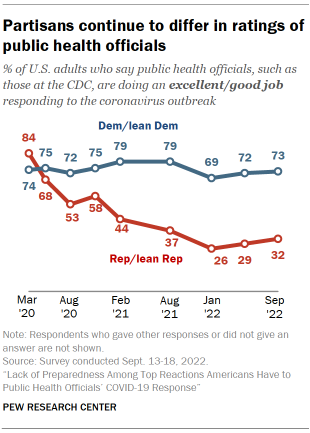
Views of the performance of public health officials, such as those at the CDC, now tilt positive with 54% of Americans saying they are doing an excellent or good job responding to the outbreak. Positive ratings of public health officials have edged up from 50% in January of this year. Still, they remain far lower than they were during the early stages of the outbreak.
Republicans continue to be critical of how public health officials are responding to the outbreak, though the share saying they are doing an excellent or good job has increased from 26% in January to 32% in the new survey. A majority of Democrats (73%) continue to rate public health officials positively in the new survey, up 4 percentage points from January.

Americans’ views about the job public health officials have done communicating with the public over the course of the outbreak are closely divided: 51% say public health officials have done an excellent or good job communicating, while 49% say they have done an only fair or poor job in this regard.
Nearly two-thirds of Democrats (64%) say that public health officials have done an excellent or good job communicating with the public. Republicans take the opposite view: 65% say that they have done an only fair or poor job.
Americans offer mixed reactions to public health officials’ COVID-19 response
As Americans evaluate how public health officials have responded to the coronavirus outbreak, they acknowledge some difficulty public health officials have faced but also tend to say officials were unprepared for the outbreak.

Overall, 46% of U.S. adults say that the statement “public health officials were unprepared for the outbreak” describes their views extremely or very well. Another 31% say it describes their views somewhat well, while 21% say it describes their views not too or not at all well.
At the same time, 45% of Americans also say the statement “interference from elected officials hurt public health officials’ ability to respond to the outbreak” describes their views at least very well.
When it comes to statements that reflect positively on public health officials’ response, 34% of Americans say the statement “public health officials don’t get enough credit for the job they’ve done” describes their views extremely or very well. And 31% say that “public health officials did as well as can be expected” in dealing with the coronavirus outbreak describes their views at least very well.
However, several statements critical of health officials’ response resonate with similar shares of Americans. Overall, 36% of U.S. adults say the statement that “the personal views of public health officials have had too much influence on policy” describes their views extremely or very well and 34% say “public health officials were too quick to dismiss views that challenged their scientific understanding.” Roughly three-in-ten Americans say public health officials were too slow to respond to changes in the outbreak (32% say this describes their views very or extremely well) or that these officials got the facts wrong about the coronavirus (29% say this describes their view very or extremely well.)
Republicans and Democrats tend to agree that public health officials were unprepared for the coronavirus outbreak

Republicans and Democrats offer competing descriptions of public health officials’ performance, though there are a few areas of general agreement.
Similar shares of Republicans (47%) and Democrats (46%) say the statement that public health officials “were unprepared for the outbreak” describes their views extremely or very well.
And roughly a third of each group sees public health officials as too slow to respond to changes in the outbreak (31% of Republicans and 33% of Democrats say this describes their views at least very well.)
Republicans are much more critical of public health officials than Democrats in other regards. About half of Republicans and Republican leaners see public health officials’ judgments as biased, and they strongly align with the statements that health officials’ personal views have had too much influence on policy and that they “were too quick to dismiss views that challenged their scientific understanding.” In addition, 45% of Republicans express strong agreement with the view that public health officials got the facts wrong about the coronavirus. Much smaller shares of Democrats say each of these three critiques describe their views well, including just 15% who say public health officials got the facts wrong.
In contrast, a 54% majority of Democrats and Democratic leaners say their views are described extremely or very well by the statement that public health officials’ ability to respond to the outbreak was hurt by interference from elected officials. About half of Democrats (51%) say that the statement public health officials “don’t get enough credit for the job they’ve done” describes their views at least very well; just 15% of Republicans say this.
Most Americans don’t expect major setback for country from coronavirus variants; personal concern over coronavirus continues to fall

The Center survey finds that a majority of Americans (69%) think new variants of the coronavirus will not have a major impact on the country’s efforts to contain the disease; far fewer (29%) believe that new variants will lead to a major setback for the country’s efforts to contain the coronavirus.
Concern about new variants of the coronavirus is down significantly from February 2021 when about half of the public (51%) thought new variants of the disease would lead to a major setback for the country.

Personal concern about getting a serious case of the coronavirus has continued to fall throughout the year. In the new survey, 30% of U.S. adults say they are at least somewhat concerned they will get COVID-19 and require hospitalization, down 10 points from the start of the year. A majority of the public say they are not too or not at all concerned about this.
Americans are relatively more likely to say they are at least somewhat concerned they might unknowingly spread the coronavirus to others (49%).
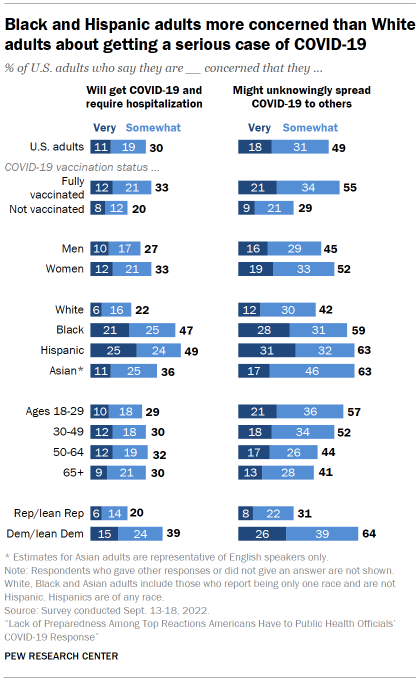
Concern about getting a serious case of COVID-19 remains higher among Black and Hispanic Americans. About half of each group (47% of Black and 49% of Hispanic Americans) say they are at least somewhat concerned about this. This compares with 22% of White Americans and 36% of English-speaking Asian Americans.
Women are slightly more concerned than men about getting a serious case of the coronavirus: 33% of women and 27% of men say they are at least somewhat concerned about this.
And despite the protections COVID-19 vaccines offer against getting the disease, Americans who are fully vaccinated express more concern over getting or spreading COVID-19 than unvaccinated adults.
No rise in the share of Americans who are vaccinated for COVID-19; 48% expect to get an updated booster for omicron variants, or already have
The survey finds 71% of Americans say they are fully vaccinated against the coronavirus. (Fully vaccinated is defined by the Centers for Disease Control and Prevention as having received two doses of Pfizer or Moderna vaccines or one dose of the Johnson & Johnson vaccine.)
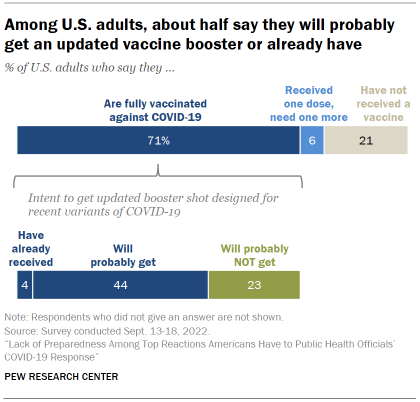
Center surveys find no increase in the share of U.S. adults who say they are fully vaccinated against COVID-19 since the start of the year. And the share now saying they have had a booster shot within the past six months is down from 49% in May to 38% in the current survey, resulting in a smaller share of the general public that has the highest level of available protection against the disease.
Uptake of a new booster shot, targeting recent variants of the coronavirus, has been slower than expected. The survey, conducted shortly after updated booster shots first became available, finds about half of Americans say they will probably get an updated vaccine booster or that they already have (44% and 4%, respectively); 23% of Americans say they will probably not get an updated booster shot. The question about updated booster shots was only asked of adults who are fully vaccinated. About two-in-ten adults (21%) have not received a COVID-19 vaccine and 6% say they have received one dose but need one more to be fully vaccinated.
As with vaccines generally, older adults are more inclined than younger adults to get an updated booster shot. Among adults ages 65 and older, 56% say they will probably get an updated booster shot and 6% have done so already. Among adults under 30, four-in-ten say they will probably get one and 5% have already done so.

Vaccination status continues to vary by age, party affiliation and other characteristics.
As in previous Center surveys, an overwhelming majority of Democrats (85%) say they are fully vaccinated, compared with 58% of Republicans.
Older adults continue to be more likely than younger adults to say they are fully vaccinated against the coronavirus. A large majority of adults ages 65 and older – including 74% of older Republicans and 93% of older Democrats – say they are fully vaccinated.
Americans living in urban areas (76%) are more likely than those living in rural areas (60%) to be fully vaccinated as well.
White evangelical Protestants remain less likely than other major religious groups to be fully vaccinated against the coronavirus; 57% of this group says they are fully vaccinated against the coronavirus. Among White evangelical Protestants, 27% say they will probably get an updated booster shot and 2% have already done so. See the Appendix for more details.