Americans Divided Over Direction of Biden’s Climate Change Policies
Several climate policies receive bipartisan support, despite Republicans and Democrats differing on overall approach
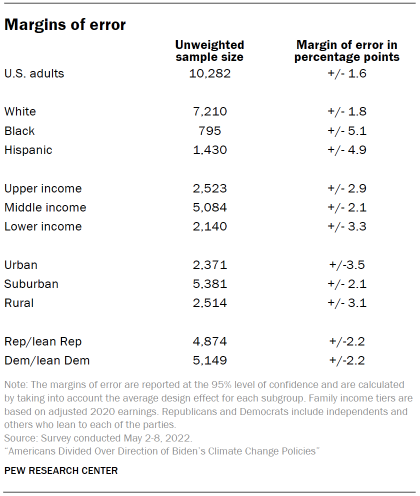
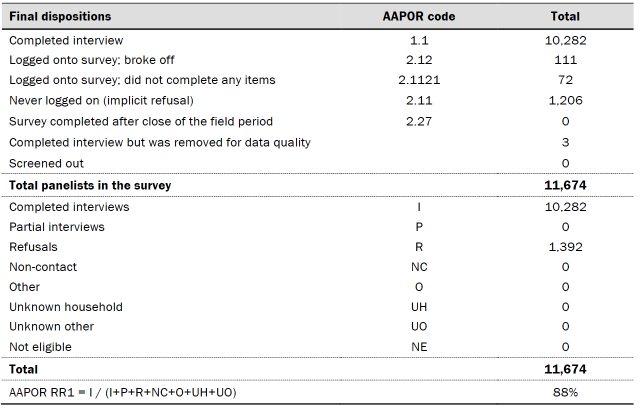
Pew Research Center conducted this study to understand how Americans view climate, environmental and energy issues. For this analysis, we surveyed 10,282 U.S. adults from May 2 to 8, 2022.
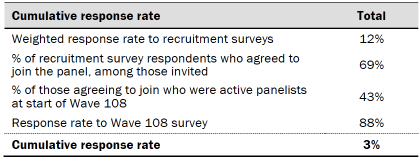
Everyone who took part in the survey is a member of the Center’s American Trends Panel (ATP), an online survey panel that is recruited through national, random sampling of residential addresses. This way, nearly all U.S. adults have a chance of selection. The survey is weighted to be representative of the U.S. adult population by gender, race, ethnicity, partisan affiliation, education and other categories. Read more about the ATP’s methodology.
Here are the questions used for this report, along with responses, and its methodology.
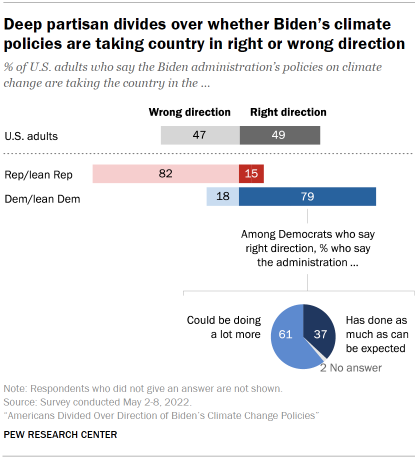
More than a year into Joe Biden’s presidency, the public is divided over the administration’s approach to climate change: 49% of U.S. adults say the Biden administration’s policies on climate change are taking the country in the right direction, while 47% say these climate policies are taking the country in the wrong direction.
Climate change has been among the top priorities of the Biden administration, whose actions on the issue include rejoining the Paris Climate Agreement and passage of an infrastructure bill with funding for renewable energy. More recent legislative efforts on climate have stalled in Congress, and a Supreme Court decision in June curtailed the ability of the Environmental Protection Agency to regulate power plant emissions.
Ratings of Biden’s approach to climate change – and the federal government’s role dealing with the issue – are deeply partisan. A majority of Republicans and independents who lean to the GOP (82%) say Biden’s climate policies are taking the country in the wrong direction. Among Democrats and Democratic leaners, most say Biden is moving the country in the right direction on climate policy (79%).
But in a sign of Democratic frustration with progress tackling climate change, there’s discontent within the party even among those who say Biden’s policies are taking the country in the right direction. Among Democrats who back the direction of the administration’s climate policies, 61% say the administration could be doing a lot more on climate; far fewer (37%) say they are doing about as much as can be expected.
While the public is divided over Biden’s approach to climate change, a majority of Americans continue to see room for more federal action on the issue: 58% say the federal government is doing too little to reduce the effects of global climate change, compared with just 18% who say it is doing too much (22% say it is doing about the right amount). Here again, partisan differences are wide, with Democrats much more likely than Republicans to say the federal government is doing too little to reduce the effects of climate change (82% vs. 28%).
Despite these polarized attitudes, the Pew Research Center survey of 10,282 U.S. adults conducted from May 2 to 8, 2022, finds broad public agreement on some specific policies to address climate change. A large majority of Americans (90%) say they favor planting about a trillion trees to absorb carbon emissions to help reduce the effects of climate change, and 79% favor providing a tax credit to encourage businesses to develop technology to capture and store carbon emissions. Both of these policies are backed by sizable majorities of Republicans and Democrats alike.
The survey, fielded before the Supreme Court’s decision limiting the EPA’s authority to regulate power plant emissions, finds 72% of Americans favor requiring power companies to use more energy from renewable sources, like wind and solar, and 68% back taxing corporations based on the amount of carbon emissions they produce. Partisan gaps are more pronounced on these approaches to reduce the effects of climate change, but they are not absolute. About half of Republicans – including majorities of moderate Republicans – say they favor these approaches to limiting emissions, as do most Democrats.
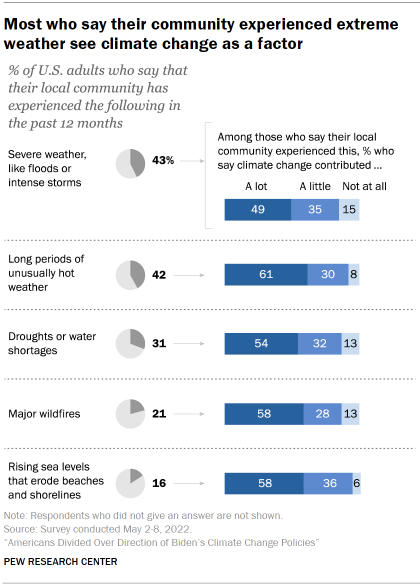
Climate change is making extreme weather events more frequent and severe. A majority of Americans (71%) say their community has experienced at least one of five forms of extreme weather in the past year, including severe weather such as floods or intense storms (43%), long periods of unusually hot weather (42%), droughts or water shortages (31%), major wildfires (21%), or rising sea levels that erode shorelines (16%).
Large shares of Americans who say their communities have been impacted see climate change as contributing to these extreme weather events. For example, among the 42% of Americans who say they have experienced unusually hot weather in the last year, 61% say climate change contributed a lot and 30% think it contributed a little. Across all five forms of extreme weather included in the survey, more than eight-in-ten of those who say they’ve been impacted view climate change as having contributed a lot or a little to the event.
Other key findings include:
A 55% majority opposes phasing out the production of new gasoline cars and trucks by 2035, while 43% are in favor. Opposition is slightly higher today than it was in April 2021, when 51% opposed and 47% favored this idea. Partisans remain far apart on this proposal: 82% of Republicans and those who lean to the GOP say they oppose phasing out the production of new gas-powered vehicles by 2035, while 65% of Democrats and Democratic leaners say they favor this.
42% of U.S. adults say they are very or somewhat likely to seriously consider purchasing an electric vehicle (EV). About as many (45%) say they are not too or not at all interested in an EV. Interest in purchasing an EV is about the same as it was in the spring of 2021, before gas prices in the U.S. rose sharply from an average of $2.95 in April 2021 to $4.55 in May 2022. Roughly seven-in-ten of those at least somewhat likely to consider an EV in the future cite saving money on gas as well as helping the environment as reasons why.
By 53% to 45%, Americans are more likely to view stricter environmental laws as worth the cost than to say they cost too many jobs and hurt the economy. However, this view is less widely held today than it was in September of 2019, when about two-thirds (65%) said stricter environmental laws and regulations were worth the cost. Partisan divisions on this measure have widened over the last few years. Three-quarters of Republicans now say stricter environmental laws hurt the economy, up 20 percentage points from 2019. Among Democrats, 21% now say stricter environmental laws and regulations hurt the economy, up from 14% in 2019.
Younger Democrats are more likely than older Democrats to express frustration with the administration on climate change. Among Democrats ages 18 to 29, 26% say the Biden administration’s climate policies are taking the country in the wrong direction, compared with just 9% of Democrats 65 and older. And among Democrats who say the Biden administration is taking things in the right direction, those ages 18 to 29 are also more likely than those 65 and older to say the Biden administration could be doing a lot more on climate change (73% vs. 54%).
Lower-income adults as well as Black and Hispanic adults are especially likely to report environmental problems in their communities. A majority of Americans see at least one of the environmental issues mentioned in the survey, such as water pollution and excessive waste and landfills, as a problem in their area. Lower-income adults and Black and Hispanic adults are more likely to see these problems in their communities than others in the U.S. For instance, 61% of lower-income adults say air pollution is a big or moderate problem in their local community, compared with smaller shares of middle- (45%) and higher-income adults (38%).
Within the GOP, younger adults are more likely than older adults to see a need for federal government action or offer policy support on environmental and climate issues. About two-thirds (64%) of Republicans ages 18 to 29 favor requiring power companies to use more energy from renewable sources; Republicans 65 and older are much less likely to support this policy (42%). This general pattern of greater support among younger Republicans is seen across many – but not all – climate and environmental policy questions.
Large majorities of Americans remain broadly supportive of several policies to address climate change
While Americans have mixed reactions to the Biden administration’s overall approach to climate policies, there continues to be broad public support for a range of specific proposals aimed at reducing the effects of climate change.
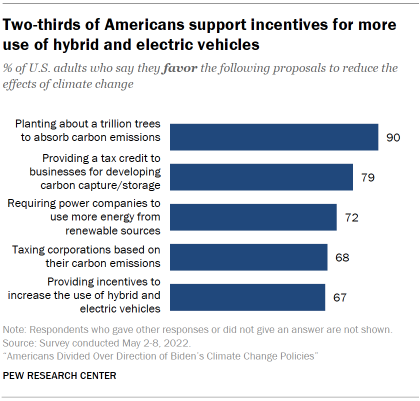
An overwhelming majority of U.S. adults (90%) support planting about a trillion trees to absorb carbon emissions. Majorities of Americans also support tax credits to businesses for developing carbon capture and storage technologies (79%) and requiring power companies to use more renewable energy (72%). About two-thirds favor taxing corporations based on their carbon emissions (68%) and incentives to increase the use of hybrid and electric vehicles (67%).
There is near consensus among both Democrats and Republicans in favor of planting large numbers of trees to help absorb carbon emissions (91% and 89%, respectively).
Majorities from both parties also support providing tax credits to businesses for developing carbon capture and storage technologies (88% of Democrats and 70% of Republicans).

Democrats and Republicans are more divided over other climate measures. For example, 90% of Democrats favor requiring power companies to use more energy from renewable sources. In comparison, about half of Republicans favor this idea (49%), while an equal share say they oppose it.
Overwhelming majorities of Democrats also favor taxing corporations based on their carbon emissions and providing incentives for the use of electric vehicles. Slightly fewer than half of Republicans support these two measures (46% each).
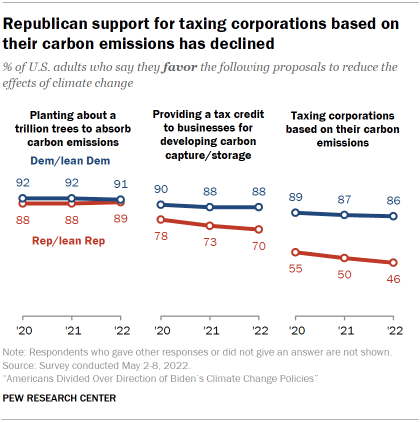
Republican support for both measures has fallen since 2020. The share of Republicans who support taxing corporations based on the amount of carbon emissions they produce is down from 55% to 46% today. Support for providing tax credits to businesses for developing carbon capture technology is down 8 points, from 78% to 70%. See Appendix for more details.
Majorities of Americans say the federal government is doing too little to protect water and air quality, address climate change
On balance, Americans think the federal government is doing too little to address several key areas of environmental protection, such as air and water quality, and to reduce the effects of climate change.
A majority (63%) says the federal government is doing too little to protect water quality of rivers, lakes and streams. About half as many (31%) say the federal government is doing about the right amount in this area; a very small share (5%) say it is doing too much.
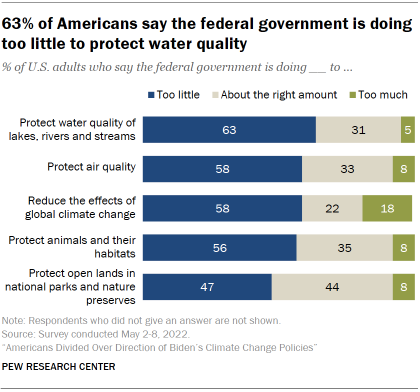
Majorities also think the federal government is doing too little to protect air quality (58%), reduce the effects of climate change (58%) and protect animals and their habitats (56%). For each of these areas of environmental protection, significantly smaller shares say the federal government is doing about the right amount.
When it comes to protecting open lands in national parks and nature preserves, opinion is more evenly divided: 47% say the federal government is doing too little, while 44% say it is doing about the right amount in this area.
Small shares say the federal government is doing too much across these five areas of environmental protection, though the share who say this about reducing the effects of climate change (18%) is slightly higher than for other areas.
Republicans and Democrats disagree over how much the federal government is doing to protect key aspects of the environment
Democrats remain much more likely than Republicans to say the federal government is doing too little across key aspects of the environment.
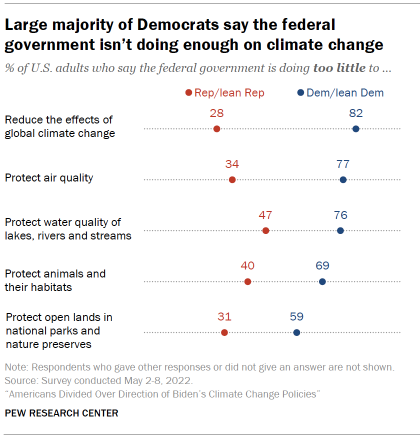
On climate change, about eight-in-ten Democrats (82%) say the federal government is doing too little, while just 13% say it is doing the right amount and few (4%) say it is doing too much. By contrast, larger shares of Republicans say the federal government is doing too much to address climate change than say it is doing too little (37% to 28%); 33% say it is doing about the right amount.
Large partisan differences also are seen across other areas of environmental protection. When it comes to protecting air quality, 77% of Democrats think the federal government is doing too little, compared with 34% of Republicans.
For more details on these views over time, see the Appendix.
On balance, Americans think stricter environmental laws are worth the cost – but a growing share see too much economic downside
When asked for their overall views, slightly more Americans say stricter environmental laws and regulations are worth the cost (53%) than say they cost too many jobs and hurt the economy (45%).

The share of Americans who say stricter environmental laws and regulations cost too many jobs and hurt the economy is up 12 percentage points since 2019, when 33% expressed this view.
Rising concern about the economic impact of environmental laws has primarily grown among Republicans (though this view has also grown somewhat among Democrats).
Three-quarters of Republicans now say stricter environmental laws hurt the economy, up 20 points from 2019. Among Democrats, 21% now say stricter environmental laws and regulations hurt the economy, up from 14% in 2019.
About seven-in-ten Americans say their local community has experienced extreme weather in past year
Most Americans report that their local community has experienced some form of extreme weather in the past year. The most common experiences are severe weather, like floods or intense storms (43% say their community has experienced this in the past year) and long periods of unusually hot weather (42%). Smaller shares say that in the past 12 months their local community has experienced droughts or water shortages (31%), major wildfires (21%) or rising sea levels that erode beaches and shorelines (16%). In all, 71% of Americans say they experienced at least one of these five kinds of weather events in the past year.
There are pronounced regional differences in experiences with extreme weather. Those living in the West are especially likely to say their local community has faced droughts or water shortages (68%), long periods of unusually hot weather (62%) and major wildfires (59%). Among Westerners, those living in the Mountain states (77% in this region stretching from Idaho to New Mexico) are more likely to report droughts in their local community in the past year than those in the Pacific states (63% of those in California, Oregon and Washington).
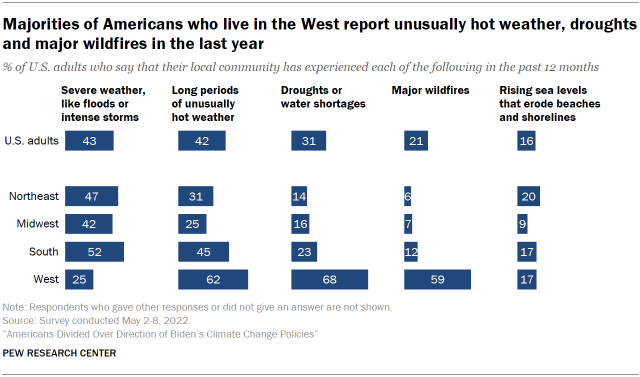
Those in the Northeast, Midwest and South are more likely than those in the West to say their local community has experienced severe weather events such as floods and intense storms in the past year.
In general, partisanship shapes how people view their weather experiences, but the size of the partisan gap depends on the type of weather event. Democrats are 25 percentage points more likely than Republicans to report their local community experienced long periods of unusually hot weather (54% vs. 29%). There are more modest gaps between the shares of Democrats and Republicans who say their local community experienced droughts (34% and 27%, respectively) and major wildfires (24% vs. 19%).
These partisan differences tend to hold across regions. However, there are some notable exceptions. For instance, in the West, similar majorities of Republicans (67%) and Democrats (68%) say their local community has experienced droughts or water shortages in the last year. See Appendix for more details.
Most Americans who say their local community has experienced extreme weather in the last year believe climate change was a contributing factor

Among the 42% of Americans who say their local community has experienced long periods of unusually hot weather, 61% say climate change contributed a lot to this event, while another 30% say climate change contributed a little. Just 8% do not see climate change as having played a role.
Similarly, among those who say their local community experienced major wildfires, 58% think climate change contributed a lot and 28% say climate change contributed a little.
In fact, large shares of those who report experiencing any of these five forms of extreme weather in the past year – including droughts, floods or intense storms, and rising sea levels – believe climate change contributed either a lot or a little.
Black and Hispanic Americans are particularly likely to report local environmental problems
Broad shares of Americans report environmental problems in their local area. A majority (59%) say too much garbage, waste and landfills is a big or moderate problem in their own community. About as many (56%) say pollution of lakes, rivers and streams is a big or moderate problem in their community.
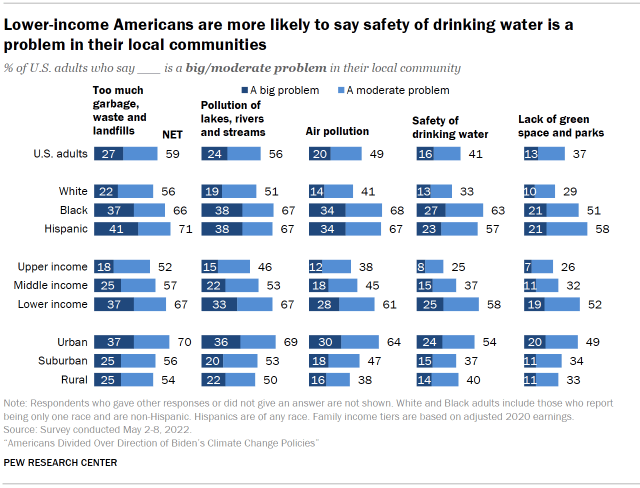
Roughly half of U.S. adults (49%) say air pollution is at least a moderately big problem in their communities. Fewer say that access to safe drinking water (41%) and lack of green space (37%) in their communities are problems.
Black and Hispanic Americans continue to be more likely than White Americans to report each of these environmental problems in their communities. For example, 63% of Black Americans and 57% of Hispanic Americans say safety of drinking water is at least a moderate problem in their local community, compared with only 33% of non-Hispanic White Americans. There are significant gaps by race and ethnicity when it comes to other environmental problems, including air pollution.
Studies on environmental pollution have found that Black and Hispanic Americans are exposed to air pollution from a wide variety of sources, including construction and industry, more than White Americans.
Firsthand experiences with environmental problems also differ across levels of family income. Those with lower incomes are more likely to report environmental issues in their communities than those in middle- and upper-income families. For instance, a majority of lower-income Americans (58%) say the safety of drinking water is at least a moderate problem in their local community, compared with 37% of those in middle-income and 25% of those in upper-income families. Lower-income communities are among those at the greatest risk for unsafe drinking water.
Those who live in urban areas are more likely than those in rural or suburban areas to say that these environmental issues affect their communities. The divide between rural and urban Americans is widest on the problem of air pollution. More than six-in-ten of those who live in urban areas (64%) say air pollution is a big or moderate problem for their communities, compared with 47% of those in suburban areas and 38% of those who live in rural areas.
55% of U.S. adults oppose phasing out gasoline cars by 2035
Americans lean against the idea of phasing out gas-powered vehicles by 2035: 55% say they oppose phasing out the production of new gasoline cars and trucks by 2035, compared with 43% who support this proposal.

The Biden administration has proposed regulatory efforts on emission standards that would increase the sale of electric vehicles so that half of all new cars and trucks sold in the U.S. are electric by 2030. Last month, the European Parliament supported a proposal to effectively ban new gas cars and trucks by 2035.
Support for phasing out gas-powered vehicles in the U.S. is down slightly from last year, when 47% of Americans favored this idea and 51% were opposed.
Democrats and Republicans continue to be deeply divided over whether to end the production of cars and trucks with internal combustion engines. About two-thirds of Democrats favor phasing out gasoline-powered cars and trucks by 2035 (65%). In contrast, just 17% of Republicans support this idea, while an overwhelming majority (82%) oppose it.
Among Democrats, a large majority of liberals (77%) favor phasing out the production of new gas-powered cars and truck by 2035. Moderate and conservative Democrats are more closely divided: 55% favor this idea, while 44% oppose it.
About four-in-ten Americans would seriously consider an electric car for their next purchase
When asked how likely they would be to seriously consider purchasing an electric vehicle (EV), 42% of Americans say they would be very or somewhat likely to seriously consider purchasing an electric vehicle. A slightly larger share (45%) say they would be not too or not at all likely to do this (13% say they do not plan to purchase a vehicle in the future).
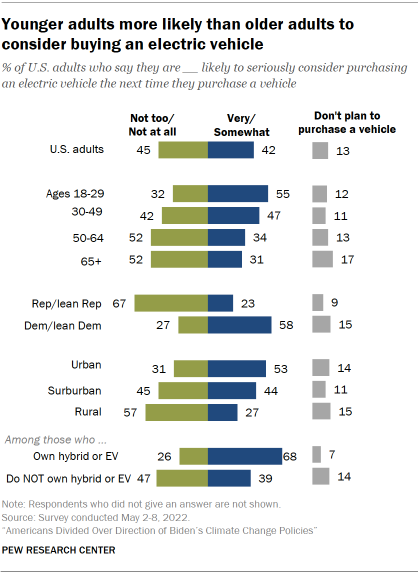
The share of Americans who are very or somewhat interested in purchasing an electric car or truck is about the same as in April 2021, the last time this question was asked. Gas prices are up sharply since then, from an average of $2.95 in April 2021 to $4.55 in May 2022.
Those most inclined to consider an EV purchase in the future include younger adults, urban dwellers, Democrats and those who already own a hybrid or all-electric vehicle.
Across age groups, a majority of adults ages 18 to 29 (55%) say they are very or somewhat likely to consider an electric vehicle the next time they buy a vehicle. Smaller shares of adults ages 50 to 64 (34%) or 65 and older (31%) say the same.
Democrats are more inclined than Republicans to say they are at least somewhat likely to consider purchasing an EV. Younger adults within each party are more inclined than older adults to say this.
Those living in urban areas (53%) are more likely than those in suburban areas (44%) to report interest in purchasing an electric vehicle. Those living in rural areas are among the least likely to say this (27%).

The survey asked Americans who say they are at least somewhat likely to consider an electric vehicle about the reasons for their interest.
Among this group, large majorities say helping the environment (73%) and saving money on gas (71%) are major reasons why they would seriously consider purchasing an electric car. Those considering an electric car are far less likely to say keeping up with the latest trends in vehicles is a major reason they would be likely to purchase an electric vehicle (10%).
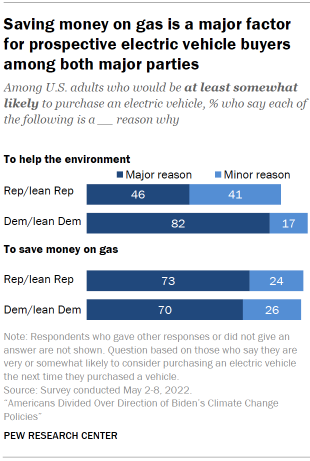
Among those who say they would seriously consider purchasing an electric vehicle, most Democrats (82%) say helping the environment is a major reason they would consider doing this; 17% say this is a minor reason and just 1% say this is not a reason. Among Republicans, a far smaller share of those interested in electric vehicles (46%) say helping the environment is a major reason why they would buy an electric vehicle, 41% say this is a minor reason and 13% say this is not a reason.
However, Republicans and Democrats agree that saving money on gas is a major reason to buy an electric car. Among those who would seriously consider purchasing an electric car, 73% of Republicans and 70% of Democrats say saving money on gas is a major reason why.
Younger Republicans more open to federal action, policy proposals to address climate change than older Republicans

Across a range of questions about climate, energy and the environment, younger Republicans tend to be more supportive of federal government action and policy measures in these areas than older Republicans.
Republican adults under 30 are far more likely than older Republicans, ages 50 and older, to say the federal government is doing too little on key aspects of the environment. The age divide is widest when it comes to how much the government is doing on climate change: 47% of Republicans ages 18 to 29 say the federal government is doing too little to reduce the effects of climate change, compared with just 18% of Republicans 65 and older.
Republicans under 30 are also about twice as likely as Republicans 65 and older to say the federal government is doing too little to protect air quality (47% vs. 23%).
In addition, younger Republicans are more likely than older Republicans to support a range of policies aimed at reducing the effects of climate change. A 58% majority of Republicans ages 18 to 29 say they favor providing incentives to increase the use of hybrid and electric vehicles, compared with 35% of Republicans 65 and older. And younger Republicans are 22 points more likely than older Republicans to say they support requiring power companies to use more energy from renewable sources (64% vs. 42%).
Similarly, there are large age differences among Republicans over energy priorities. A majority of Republicans under 30 say that developing alternative energy sources such as wind, solar and hydrogen technology should be the more important priority for addressing America’s energy supply; a majority of Republicans 65 and older instead say that expanding exploration and production of oil, coal and natural gas should be the more important priority. For more on these patterns, see “Gen Z, Millennials Stand Out for Climate Change Activism, Social Media Engagement With Issue.”