Pew Research Center

FOR RELEASE MAY 12, 2022

A Majority of Americans Favor Expanding Natural Gas Production To Export to Europe

Yet renewable sources, like wind and solar, remain Americans’ overall priority for domestic production

BY Alec Tyson and Alison Spencer

FOR MEDIA OR OTHER INQUIRIES:

Communications Department
202.419.4372
www.pewresearch.org

RECOMMENDED CITATION

Pew Research Center, May 2022, "A Majority of Americans Favor Expanding Natural Gas Production To Export to Europe"

About Pew Research Center

Pew Research Center is a nonpartisan, nonadvocacy fact tank that informs the public about the issues, attitudes and trends shaping the world. It does not take policy positions. The Center conducts public opinion polling, demographic research, computational social science research and other data-driven research. It studies politics and policy; news habits and media; the internet and technology; religion; race and ethnicity; international affairs; social, demographic and economic trends; science; research methodology and data science; and immigration and migration. Pew Research Center is a subsidiary of The Pew Charitable Trusts, its primary funder.

© Pew Research Center 2026

Table of contents

  • About Pew Research Center
  • A Majority of Americans Favor Expanding Natural Gas Production To Export to Europe
  • Acknowledgments
  • Methodology
  • Appendix: Detailed charts and tables

A Majority of Americans Favor Expanding Natural Gas Production To Export to Europe

Yet renewable sources, like wind and solar, remain Americans’ overall priority for domestic production

How we did this

Pew Research Center conducted this study to understand how Americans view climate and energy issues. For this analysis, we surveyed 10,282 U.S. adults from May 2 to 8, 2022.

Everyone who took part in the survey is a member of the Center’s American Trends Panel (ATP), an online survey panel that is recruited through national, random sampling of residential addresses. This way, nearly all U.S. adults have a chance of selection. The survey is weighted to be representative of the U.S. adult population by gender, race, ethnicity, partisan affiliation, education and other categories. Read more about the ATP’s methodology.

Here are the questions used for this report, along with responses, and its methodology.

As much of Europe grapples with how to reduce its dependence on Russian oil and gas, 61% of Americans say they would favor the United States expanding production to export large amounts of natural gas to European countries. A smaller share (37%) say they would oppose expanding natural gas production to export to countries in Europe.
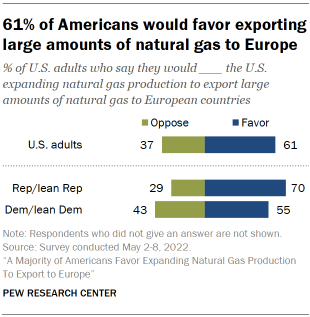
Chart shows 61% of Americans would favor exporting large amounts of natural gas to Europe

Seven-in-ten Republicans and Republican-leaning independents favor exporting large amounts of natural gas to European countries, as do a somewhat smaller majority of Democrats and Democratic leaners (55%), a new Pew Research Center survey finds.

In response to Russia’s invasion of Ukraine, European countries, including Germany and Italy, have announced plans to phase out oil and gas imports from Russia – the largest supplier of energy to Europe. The Biden administration has pledged to increase natural gas exports to the European Union, though a large increase in natural gas exports could face challenges, including production timelines and existing pipeline and export terminal capabilities.

While the survey finds broad support for exporting natural gas to Europe, the findings also underscore how potential impacts on domestic prices are front-of-mind for large shares of Americans.

Two-thirds (67%) say the impact on natural gas prices in the U.S. should be a major consideration when it comes to whether the U.S. should export large amounts of natural gas to European countries. Both those in favor of and opposed to exporting U.S. natural gas to Europe agree that the impact on domestic prices should be a major consideration.

Prices rank ahead of other considerations, including the impact on climate change and the Russian economy. About half (51%) say the impact on climate change should be a major consideration when it comes to whether the U.S. should export large amounts of natural gas to Europe. Those who oppose increasing natural gas exports to Europe are more likely than those who favor this to say that climate impacts should be a major consideration (64% vs. 44%). Climate experts have raised concerns about the effects that President Joe Biden’s plan to increase natural gas exports might have on the administration’s climate goals.

Chart shows prices in U.S. are a major consideration for Americans when it comes to whether the U.S. should export natural gas to Europe

The impact on the Russian economy is seen as less of a factor for Americans: 33% say it should be a major consideration when it comes to whether the U.S. should increase natural gas exports to European countries. A separate Pew Research Center report released this week finds that 75% of Americans approve of the U.S. placing strict economic sanctions on Russia.

The Pew Research Center survey of 10,282 U.S. adults conducted from May 2 to 8, 2022, finds that Americans’ broader priorities for domestic energy production remain largely stable since earlier in the year, despite uncertainty in global energy markets driven by the war in Ukraine and rising oil and gas prices in the U.S.

A large majority of U.S. adults (67%) continue to say developing alternative energy sources, such as wind and solar, should be the more important priority for addressing America’s energy supply; roughly half as many (32%) say the more important priority should be expanding the production of oil, coal and natural gas. These views are little different than they were in January.

And when it comes to specific sources of energy production, large majorities say they favor more solar panel farms (86%) and more wind turbine farms (79%), consistent with the overall emphasis on renewable domestic sources of production.

However, partisan differences over the country’s energy priorities are now as wide as they have been in recent years, largely reflecting a shift among Republicans toward greater emphasis on fossil fuels during the Biden administration. Within the last year, the shares of Republicans who support more offshore oil and gas drilling as well as more hydraulic fracturing for oil and gas have both increased.

Impact on climate change a higher consideration for Democrats than Republicans
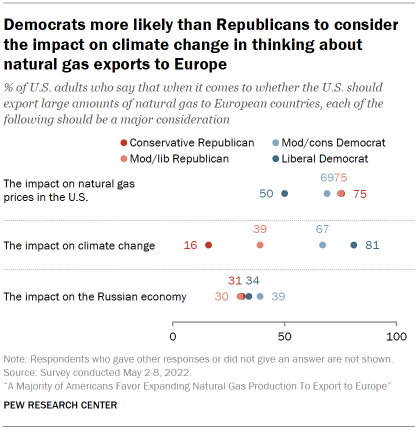
Chart shows Democrats more likely than Republicans to consider the impact on climate change in thinking about natural gas exports to Europe

Majorities of both Republicans and Democrats say the impact on natural gas prices in the U.S. should be a major consideration when it comes to whether to export natural gas to countries in Europe: 75% of Republicans say this, as do a somewhat smaller 60% majority of Democrats.

By comparison, Democrats (73%) are much more likely than Republicans (24%) to say that the impact on climate change should be a major consideration when it comes to whether the U.S. should export large amounts of natural gas to European countries.

Differences in views are especially wide between those at the ends of the political spectrum: 81% of liberal Democrats say climate change should be a major factor in such a decision, compared with just 16% of conservative Republicans.

Relatively smaller shares of both Democrats (37%) and Republicans (30%) say that the impact on the Russian economy should be a major consideration when it comes to whether to increase natural gas exports to Europe.

Americans continue to prioritize the development of alternative energy over fossil fuels
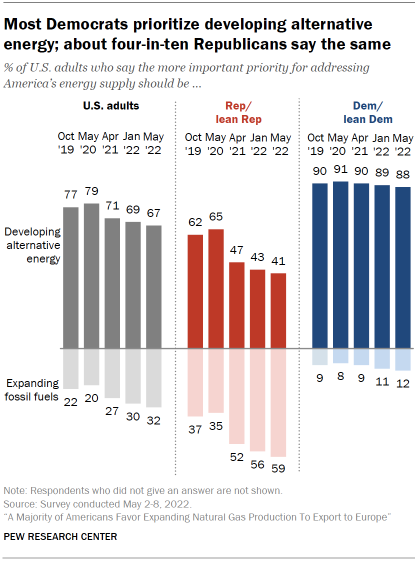
Chart shows most Democrats prioritize developing alternative energy; about four-in-ten Republicans say the same

A majority of Americans (67%) say that the more important priority for the country is to develop alternative energy sources, such as wind and solar. A smaller share (32%) say that the more important priority is to expand the production of oil, coal and natural gas. These views are about the same as they were in January, when 69% said developing alternative energy sources such as wind and solar should be the more important priority for the country.

About nine-in-ten Democrats and Democratic leaners (88%) continue to say the U.S. should prioritize the production of alternative energy sources, consistent with views expressed in recent years.

Among Republicans and Republican leaners, more say the U.S. should prioritize the production of oil, coal and natural gas rather than alternative sources such as wind and solar (59% vs. 41%). This balance of opinion is about the same as it was in January. However, support for prioritizing the development of alternative energy sources remains much lower among Republicans than in May 2020, during the last year of the Trump administration. At that time, about two-thirds (65%) of Republicans said developing alternative sources like wind and solar should be the more important priority for the U.S.
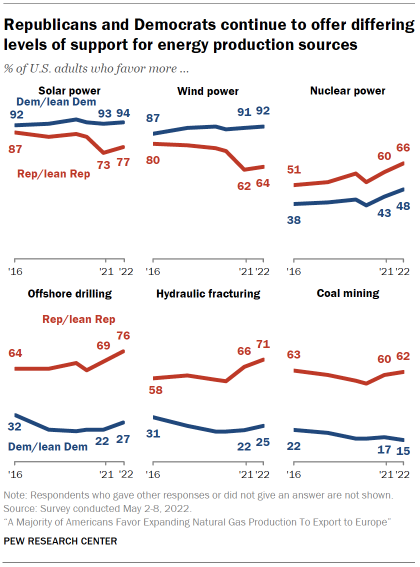
Chart shows Republicans and Democrats continue to offer differing levels of support for energy production sources

When asked about specific sources of energy individually, Americans continue to express the broadest support for expanding wind and solar energy production – consistent with the greater priority they assign to developing alternative energy generally.

Overall, 86% say they favor more solar panel farms and 79% favor more wind turbine farms.

A slight majority of Americans (54%) favor more nuclear power plants, while 44% are opposed.

Smaller shares of Americans favor more offshore oil and gas drilling (48%) or more hydraulic fracturing for oil and gas (45%). However, the shares of Americans who support more offshore drilling and fracking are both up slightly from April of 2021 (by 5 and 4 percentage points, respectively). See the Appendix for details.

Majorities of both Republicans and Democrats favor increasing the use of solar and wind energy, although support for doing so remains lower among Republicans than Democrats.

Partisan differences over expanding oil and gas drilling and hydraulic fracturing have edged wider in recent years. In the new survey, 76% of Republicans favor more offshore oil and gas drilling, compared with 27% of Democrats.

Support for the increased use of nuclear power is up modestly among both party groups over the last year, though Republicans remain more likely to favor increasing the use of nuclear power (66%) than Democrats (48%).

Few Americans know that the U.S. produces most of the energy it uses
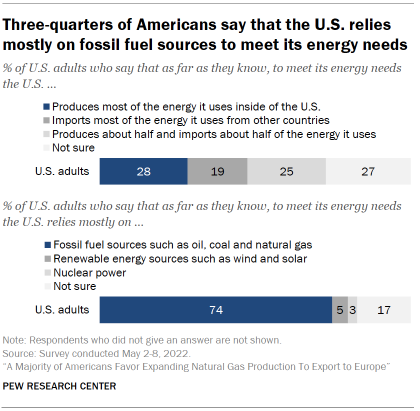
Chart shows three-quarters of Americans say that the U.S. relies mostly on fossil fuel sources to meet its energy needs

Most Americans are aware that the U.S. relies primarily on fossil fuels to meet its energy needs. However, relatively few Americans know that the U.S. produces most of the energy it uses within the country.

Overall, 28% of Americans say correctly that the U.S. produces most of the energy it uses inside of the U.S. Roughly a quarter (27%) say they’re not sure where most of the energy that the U.S. uses is produced. The remainder say either that the U.S. imports most of its energy (19%) or that it produces about half and imports about half of the energy it uses (25%).

The public is much more familiar with the type of energy the country relies on. About three-quarters of Americans (74%) say correctly that the U.S. relies mostly on fossil fuel sources such as oil, coal and natural gas to meet its energy needs. Much smaller shares think the U.S. relies mostly on renewable energy sources (5%) or nuclear power (3%); 17% say they are not sure.
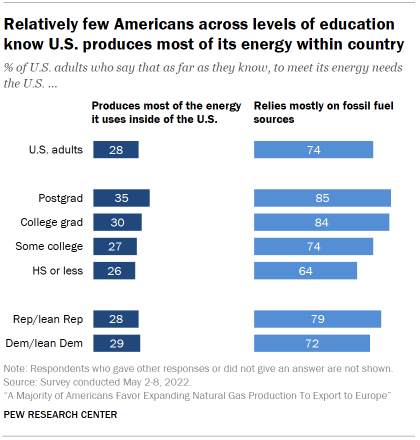
Chart shows relatively few Americans across levels of education know U.S. produces most of its energy within country

Americans with higher levels of formal education are more likely to know that the U.S. produces most of the energy it uses inside of the U.S. Still, this fact is not widely known even among those with the highest levels of education. About a third (35%) of adults with a postgraduate degree correctly say the U.S. produces most of the energy it uses within the country, compared with 26% of those with a high school or less education.

When it comes to U.S. reliance on fossil fuel sources, majorities across all levels of education are aware that the country relies mostly on fossil fuels. Those with a college degree or more education are somewhat more likely than those with some college experience or less education to know this.

Acknowledgments

This report is made possible by The Pew Charitable Trusts. It is a collaborative effort based on the input and analysis of the following individuals. Find related reports online at pewresearch.org/pewresearch-org/science.

Primary research team       

Cary Funk, Director, Science and Society Research  
Alec Tyson, Associate Director, Science and Society Research
Brian Kennedy, Senior Researcher
Giancarlo Pasquini, Research Associate
Alison Spencer, Research Assistant
Emily Saks, Research Assistant

Editorial and graphic design          

David Kent, Senior Copy Editor
Margaret Porteus, Information Graphics Designer

Communications and web publishing      

Haley Nolan, Communications Associate
Reem Nadeem, Associate Digital Producer

Methodology

The American Trends Panel survey methodology

Overview

The American Trends Panel (ATP), created by Pew Research Center, is a nationally representative panel of randomly selected U.S. adults. Panelists participate via self-administered web surveys. Panelists who do not have internet access at home are provided with a tablet and wireless internet connection. Interviews are conducted in both English and Spanish. The panel is being managed by Ipsos.

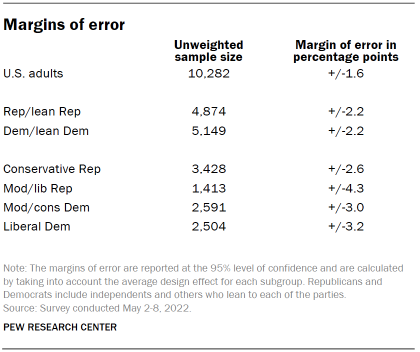
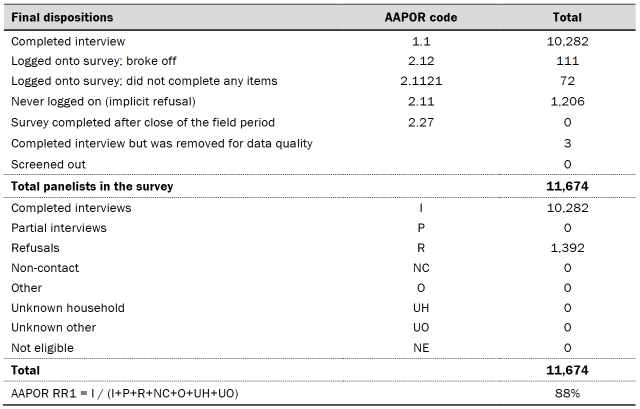
Data in this report is drawn from the panel wave conducted from May 2 to May 8, 2022. A total of 10,282 panelists responded out of 11,674 who were sampled, for a response rate of 88%. The cumulative response rate accounting for nonresponse to the recruitment surveys and attrition is 3%. The break-off rate among panelists who logged on to the survey and completed at least one item is 1%. The margin of sampling error for the full sample of 10,282 respondents is plus or minus 1.6 percentage points.

Panel recruitment

Chart shows American Trends Panel recruitment surveys

The ATP was created in 2014, with the first cohort of panelists invited to join the panel at the end of a large, national, landline and cellphone random-digit-dial survey that was conducted in both English and Spanish. Two additional recruitments were conducted using the same method in 2015 and 2017, respectively. Across these three surveys, a total of 19,718 adults were invited to join the ATP, of whom 9,942 (50%) agreed to participate.

In August 2018, the ATP switched from telephone to address-based recruitment. Invitations were sent to a stratified, random sample of households selected from the U.S. Postal Service’s Delivery Sequence File. Sampled households receive mailings asking a randomly selected adult to complete a survey online. A question at the end of the survey asks if the respondent is willing to join the ATP. Starting in 2020 another stage was added to the recruitment. Households that do not respond to the online survey are sent a paper version of the questionnaire, $5 and a postage-paid return envelope. A subset of the adults returning the paper version of the survey are invited to join the ATP. This subset of adults receive a follow-up mailing with a $10 pre-incentive and invitation to join the ATP.

Across the four address-based recruitments, a total of 19,822 adults were invited to join the ATP, of whom 17,472 agreed to join the panel and completed an initial profile survey. In each household, the adult with the next birthday was asked to go online to complete a survey, at the end of which they were invited to join the panel. Of the 27,414 individuals who have ever joined the ATP, 11,674 remained active panelists and continued to receive survey invitations at the time this survey was conducted.

The U.S. Postal Service’s Delivery Sequence File has been estimated to cover as much as 98% of the population, although some studies suggest that the coverage could be in the low 90% range.1 The American Trends Panel never uses breakout routers or chains that direct respondents to additional surveys.

Sample design

The overall target population for this survey was non-institutionalized persons ages 18 and older, living in the U.S., including Alaska and Hawaii. All active panel members were invited to participate in this wave.

Questionnaire development and testing

The questionnaire was developed by Pew Research Center in consultation with Ipsos. The web program was rigorously tested on both PC and mobile devices by the Ipsos project management team and Pew Research Center researchers. The Ipsos project management team also populated test data that was analyzed in SPSS to ensure the logic and randomizations were working as intended before launching the survey.

Incentives

All respondents were offered a post-paid incentive for their participation. Respondents could choose to receive the post-paid incentive in the form of a check or a gift code to Amazon.com or could choose to decline the incentive. Incentive amounts ranged from $5 to $20 depending on whether the respondent belongs to a part of the population that is harder or easier to reach. Differential incentive amounts were designed to increase panel survey participation among groups that traditionally have low survey response propensities.

Data collection protocol

The data collection field period for this survey was May 2 to May 8, 2022. Postcard notifications were mailed to all ATP panelists with a known residential address on May 2. 

Invitations were sent out in two separate launches: Soft Launch and Full Launch. Sixty panelists were included in the soft launch, which began with an initial invitation sent on May 2. The ATP panelists chosen for the initial soft launch were known responders who had completed previous ATP surveys within one day of receiving their invitation. All remaining English- and Spanish-speaking panelists were included in the full launch and were sent an invitation on May 3.

All panelists with an email address received an email invitation and up to two email reminders if they did not respond to the survey. All ATP panelists that consented to SMS messages received an SMS invitation and up to two SMS reminders.

Chart shows invitation and reminder dates

Data quality checks

To ensure high-quality data, the Center’s researchers performed data quality checks to identify any respondents showing clear patterns of satisficing. This includes checking for very high rates of leaving questions blank, as well as always selecting the first or last answer presented. As a result of this checking, three ATP respondents were removed from the survey dataset prior to weighting and analysis.

Weighting

Table shows weighting dimensions

The ATP data is weighted in a multistep process that accounts for multiple stages of sampling and nonresponse that occur at different points in the survey process. First, each panelist begins with a base weight that reflects their probability of selection for their initial recruitment survey. The base weights for panelists recruited in different years are scaled to be proportionate to the effective sample size for all active panelists in their cohort and then calibrated to align with the population benchmarks in the accompanying table to correct for nonresponse to recruitment surveys and panel attrition. If only a subsample of panelists was invited to participate in the wave, this weight is adjusted to account for any differential probabilities of selection.

Among the panelists who completed the survey, this weight is then calibrated again to align with the population benchmarks identified in the accompanying table and trimmed at the 1st and 99th percentiles to reduce the loss in precision stemming from variance in the weights. Sampling errors and tests of statistical significance take into account the effect of weighting.

Some of the population benchmarks used for weighting come from surveys conducted prior to the coronavirus outbreak that began in February 2020. However, the weighting variables for panelists recruited in 2021 were measured at the time they were recruited to the panel. Likewise, the profile variables for existing panelists were updated from panel surveys conducted in July or August 2021.

This does not pose a problem for most of the variables used in the weighting, which are quite stable at both the population and individual levels. However, volunteerism may have changed over the intervening period in ways that made their 2021 measurements incompatible with the available (pre-pandemic) benchmarks. To address this, volunteerism is weighted using the profile variables that were measured in 2020. For all other weighting dimensions, the more recent panelist measurements from 2021 are used.

For panelists recruited in 2021, plausible values were imputed using the 2020 volunteerism values from existing panelists with similar characteristics. This ensures that any patterns of change that were observed in the existing panelists were also reflected in the new recruits when the weighting was performed.

The following table shows the unweighted sample sizes and the error attributable to sampling that would be expected at the 95% level of confidence for different groups in the survey.

Table shows margins of error

Sample sizes and sampling errors for other subgroups are available upon request. In addition to sampling error, one should bear in mind that question wording and practical difficulties in conducting surveys can introduce error or bias into the findings of opinion polls.

Dispositions and response rates

Table shows dispositions
Table shows response rates

Appendix: Detailed charts and tables