
Pew Research Center

FOR RELEASE FEBRUARY 15, 2022

Americans’ Trust in Scientists, Other Groups Declines

Republicans’ confidence in medical scientists down sharply since early in the coronavirus outbreak

BY Brian Kennedy, Alec Tyson and Cary Funk

FOR MEDIA OR OTHER INQUIRIES:

Communications Department
202.419.4372
www.pewresearch.org

RECOMMENDED CITATION

Pew Research Center, February 2022, "Americans’ Trust in Scientists, Other Groups Declines"

About Pew Research Center

Pew Research Center is a nonpartisan, nonadvocacy fact tank that informs the public about the issues, attitudes and trends shaping the world. It does not take policy positions. The Center conducts public opinion polling, demographic research, computational social science research and other data-driven research. It studies politics and policy; news habits and media; the internet and technology; religion; race and ethnicity; international affairs; social, demographic and economic trends; science; research methodology and data science; and immigration and migration. Pew Research Center is a subsidiary of The Pew Charitable Trusts, its primary funder.

© Pew Research Center 2026

Table of contents

  • About Pew Research Center
  • Americans’ Trust in Scientists, Other Groups Declines
  • Acknowledgments
  • Methodology
  • Appendix

Americans’ Trust in Scientists, Other Groups Declines

Republicans’ confidence in medical scientists down sharply since early in the coronavirus outbreak

How we did this

Pew Research Center conducted this study to understand how much confidence Americans have in groups and institutions in society, including scientists and medical scientists. We surveyed 14,497 U.S. adults from Nov. 30 to Dec. 12, 2021.

The survey was conducted on Pew Research Center’s American Trends Panel (ATP) and included an oversample of Black and Hispanic adults from the Ipsos KnowledgePanel. A total of 3,042 Black adults (single-race, not Hispanic) and 3,716 Hispanic adults were sampled.

Respondents on both panels are recruited through national, random sampling of residential addresses. This way nearly all U.S. adults have a chance of selection. The survey is weighted to be representative of the U.S. adult population by gender, race, ethnicity, partisan affiliation, education and other categories. Read more about the ATP’s methodology.

Here are the questions used for this report, along with responses, and its methodology.

This is made possible by The Pew Charitable Trusts, which received support from Chan Zuckerberg Initiative DAF, an advised fund of Silicon Valley Community Foundation.

Americans’ confidence in groups and institutions has turned downward compared with just a year ago. Trust in scientists and medical scientists, once seemingly buoyed by their central role in addressing the coronavirus outbreak, is now below pre-pandemic levels.
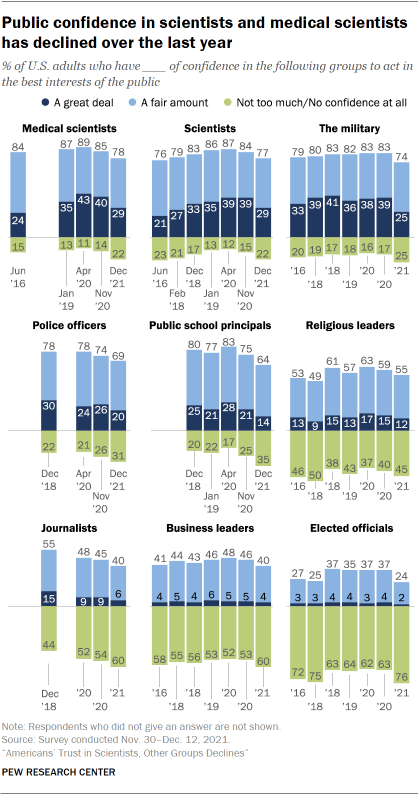
Chart shows public confidence in scientists and medical scientists has declined over the last year

Overall, 29% of U.S. adults say they have a great deal of confidence in medical scientists to act in the best interests of the public, down from 40% who said this in November 2020. Similarly, the share with a great deal of confidence in scientists to act in the public’s best interests is down by 10 percentage points (from 39% to 29%), according to a new Pew Research Center survey.

The new findings represent a shift in the recent trajectory of attitudes toward medical scientists and scientists. Public confidence in both groups had increased shortly after the start of the coronavirus outbreak, according to an April 2020 survey. Current ratings of medical scientists and scientists have now fallen below where they were in January 2019, before the emergence of the coronavirus.

Scientists and medical scientists are not the only groups and institutions to see their confidence ratings decline in the last year. The share of Americans who say they have a great deal of confidence in the military to act in the public’s best interests has fallen 14 points, from 39% in November 2020 to 25% in the current survey. And the shares of Americans with a great deal of confidence in K-12 public school principals and police officers have also decreased (by 7 and 6 points, respectively).

Large majorities of Americans continue to have at least a fair amount of confidence in medical scientists (78%) and scientists (77%) to act in the public’s best interests. These ratings place them at the top of the list of nine groups and institutions included in the survey. A large majority of Americans (74%) also express at least a fair amount of confidence in the military to act in the public’s best interests. Roughly two-thirds say this about police officers (69%) and K-12 public school principals (64%), while 55% have at least a fair amount of confidence in religious leaders.

The public continues to express lower levels of confidence in journalists, business leaders and elected officials, though even for these groups, public confidence is tilting more negative. Four-in-ten say they have a great deal or a fair amount of confidence in journalists and business leaders to act in the public’s best interests; six-in-ten now say they have not too much or no confidence at all in these groups. Ratings for elected officials are especially negative: 24% say they have a great deal or fair amount of confidence in elected officials, compared with 76% who say they have not too much or no confidence in them.

The survey was fielded Nov. 30 through Dec. 12, 2021, among 14,497 U.S. adults, as the omicron variant of the coronavirus was first detected in the United States – nearly two years since the coronavirus outbreak took hold. Recent surveys this year have found declining ratings for how President Joe Biden has handled the coronavirus outbreak as well as lower ratings for his job performance – and that of Congress – generally.

Partisan differences over trust in medical scientists, scientists continue to widen since the coronavirus outbreak

Democrats remain more likely than Republicans to express confidence in medical scientists and scientists to act in the public’s best interests.

Chart shows Democrats remain more confident than Republicans in medical scientists; ratings fall among both groups

However, there has been a significant decline in public confidence in medical scientists and scientists among both partisan groups.

Among Democrats and Democratic-leaning independents, nine-in-ten express either a great deal (44%) or a fair amount (46%) of confidence in medical scientists to act in the public’s best interests. However, the share expressing strong confidence in medical scientists has fallen 10 points since November 2020.

There has been a similar decline in the share of Democrats holding the strongest level of confidence in scientists since November 2020. (Half of the survey respondents were asked about their confidence in “medical scientists,” while the other half were asked about “scientists.”)

Still, ratings for medical scientists, along with those for scientists, remain more positive than those for other groups in the eyes of Democrats and independents who lean to the Democratic Party. None of the other groups rated on the survey garner as much confidence; the closest contenders are public school principals and the military. About three-quarters (76%) of Democrats and Democratic leaners have at least a fair amount of confidence in public school principals; 68% say the same about the military.

There has been a steady decline in confidence in medical scientists among Republicans and Republican leaners since April 2020. In the latest survey, just 15% have a great deal of confidence in medical scientists, down from 31% who said this in April 2020 and 26% who said this in November 2020. There has been a parallel increase in the share of Republicans holding negative views of medical scientists, with 34% now saying they have not too much or no confidence at all in medical scientists to act in the public’s best interests – nearly three times higher than in January 2019, before the coronavirus outbreak.

Republicans’ views of scientists have followed a similar trajectory. Just 13% have a great deal of confidence in scientists, down from a high of 27% in January 2019 and April 2020. The share with negative views has doubled over this time period; 36% say they have not too much or no confidence at all in scientists in the latest survey.

Republicans’ confidence in other groups and institutions has also declined since the pandemic took hold. The share of Republicans with at least a fair amount of confidence in public school principals is down 27 points since April 2020. Views of elected officials, already at low levels, declined further; 15% of Republicans have at least a fair amount of confidence in elected officials to act in the public’s best interests, down from 37% in April 2020.

Race and ethnicity, education, partisan affiliation each shape confidence in medical scientists

People’s assessments of scientists and medical scientists are tied to several factors, including race and ethnicity as well as levels of education and partisan affiliation.

Chart shows confidence in medical scientists declines among White, Black and Hispanic adults since April 2020

Looking across racial and ethnic groups, confidence in medical scientists declined at least modestly among White and Black adults over the past year. The decline was especially pronounced among White adults.

There is now little difference between how White, Black and Hispanic adults see medical scientists. This marks a shift from previous Pew Research Center surveys, where White adults were more likely than Black adults to express high levels of confidence in medical scientists.

Among White adults, the share with a great deal of confidence in medical scientists to act in the best interests of the public has declined from 43% to 29% over the past year. Ratings are now lower than they were in January 2019, before the coronavirus outbreak in the U.S.

Among Black adults, 28% say they have a great deal of confidence in medical scientists to act in the public’s best interests, down slightly from November 2020 (33%).

The share of Hispanic adults with a strong level of trust in medical scientists is similar to the share who expressed the same level of trust in November 2020, although the current share is 16 points lower than it was in April 2020 (29% vs 45%), shortly after measures to address the coronavirus outbreak began. Ratings of medical scientists among Hispanic adults continue to be lower than they were before the coronavirus outbreak. In January 2019, 37% of Hispanic adults said they had a great deal of confidence in medical scientists.

While the shares of White, Black and Hispanic adults who express a great deal of confidence in medical scientists have declined since the early stages of the coronavirus outbreak in the U.S., majorities of these groups continue to express at least a fair amount of confidence in medical scientists, and the ratings for medical scientists compare favorably with those of other groups and institutions rated in the survey.
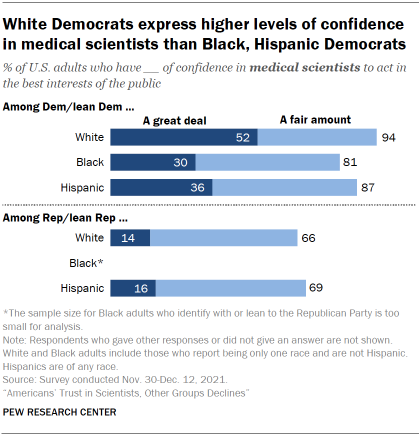
Chart shows White Democrats express higher levels of confidence in medical scientists than Black, Hispanic Democrats

Confidence in scientists tends to track closely with confidence in medical scientists. Majorities of White, Black and Hispanic adults have at least a fair amount of confidence in scientists. And the shares with this view continue to rank at or above those for other groups and institutions. For more on confidence in scientists over time among White, Black and Hispanic adults, see the Appendix.

Confidence in medical scientists and scientists across racial and ethnic groups plays out differently for Democrats and Republicans.

White Democrats (52%) are more likely than Hispanic (36%) and Black (30%) Democrats to say they have a great deal of confidence in medical scientists to act in the public’s best interests. However, large majorities of all three groups say they have at least a fair amount of confidence in medical scientists.

Among Republicans and Republican leaners, 14% of White adults say they have a great deal of confidence in medical scientists, while 52% say they have a fair amount of confidence. Views among Hispanic Republicans are very similar to those of White Republicans, in contrast to differences seen among Democrats.

There are similar patterns in confidence in scientists. (However, the sample size for Black Republicans in the survey is too small to analyze on these measures.) See the Appendix for more.

Americans with higher levels of education express more positive views of scientists and medical scientists than those with lower levels of education, as has also been the case in past Center surveys. But education matters more in assessments by Democrats than Republicans.

Chart shows college-educated Democrats express high levels of confidence in medical scientists

Democrats and Democratic leaners with at least a college degree express a high level of confidence in medical scientists: 54% have a great deal of confidence and 95% have at least a fair amount of confidence in medical scientists to act in the public’s interests. By comparison, a smaller share of Democrats who have not graduated from college have confidence in medical scientists.

Among Republicans and Republican leaners, college graduates are 9 points more likely than those with some college experience or less education to express a great deal of confidence in medical scientists (21% vs. 12%).

There is a similar difference between those with higher and lower education levels among Democrats when it comes to confidence in scientists. Among Republicans, differences by education are less pronounced; there is no significant difference by education level in the shares holding the strongest level of confidence in scientists to act in the public’s interests. See the Appendix for details.

Acknowledgments

This report is made possible by The Pew Charitable Trusts, which received support from Chan Zuckerberg Initiative DAF, an advised fund of Silicon Valley Community Foundation. It is a collaborative effort based on the input and analysis of the following individuals. Find related reports online at pewresearch.org/pewresearch-org/science.

Primary research team       

Cary Funk, Director, Science and Society Research 
Alec Tyson, Associate Director, Science and Society Research
Brian Kennedy, Senior Researcher
Alison Spencer, Research Assistant   
Emily Saks, Research Assistant

Editorial and graphic design          

Janakee Chavda, Editorial Assistant
Margaret Porteus, Information Graphics Designer

Communications and web publishing      

Haley Nolan, Communications Associate
Reem Nadeem, Associate Digital Producer

Methodology

The American Trends Panel survey methodology

Overview

The American Trends Panel (ATP), created by Pew Research Center, is a nationally representative panel of randomly selected U.S. adults. Panelists participate via self-administered web surveys. Panelists who do not have internet access at home are provided with a tablet and wireless internet connection. Interviews are conducted in both English and Spanish. The panel is being managed by Ipsos.

Data in this report is drawn from the panel wave conducted from Nov. 30 to Dec. 12, 2021. A total of 14,497 panelists responded out of 22,612 who were sampled, for a response rate of 65%. This includes 9,964 respondents from the ATP and an oversample of 4,533 Black or Hispanic Americans from Ipsos’ KnowledgePanel. The cumulative response rate accounting for nonresponse to the recruitment surveys and attrition is 2%. The break-off rate among panelists who logged on to the survey and completed at least one item is 3%. The margin of sampling error for the full sample of 14,497 respondents is plus or minus 1.2 percentage points.

Panel recruitment

Chart shows American Trends Panel recruitment surveys

The ATP was created in 2014, with the first cohort of panelists invited to join the panel at the end of a large, national, landline and cellphone random-digit-dial survey that was conducted in both English and Spanish. Two additional recruitments were conducted using the same method in 2015 and 2017, respectively. Across these three surveys, a total of 19,718 adults were invited to join the ATP, of whom 9,942 (50%) agreed to participate.

In August 2018, the ATP switched from telephone to address-based recruitment. Invitations were sent to a stratified, random sample of households selected from the U.S. Postal Service’s Delivery Sequence File. Sampled households receive mailings asking a randomly selected adult to complete a survey online. A question at the end of the survey asks if the respondent is willing to join the ATP. Starting in 2020 another stage was added to the recruitment. Households that do not respond to the online survey are sent a paper version of the questionnaire, $5 and a postage-paid return envelope. A subset of the adults returning the paper version of the survey are invited to join the ATP. This subset of adults receive a follow-up mailing with a $10 pre-incentive and invitation to join the ATP.

Across the four address-based recruitments, a total of 19,822 adults were invited to join the ATP, of whom 17,472 agreed to join the panel and completed an initial profile survey. In each household, the adult with the next birthday was asked to go online to complete a survey, at the end of which they were invited to join the panel. Of the 27,414 individuals who have ever joined the ATP, 11,704 remained active panelists and continued to receive survey invitations at the time this survey was conducted.

The U.S. Postal Service’s Delivery Sequence File has been estimated to cover as much as 98% of the population, although some studies suggest that the coverage could be in the low 90% range.1 The American Trends Panel never uses breakout routers or chains that direct respondents to additional surveys.

About the Ipsos KnowledgePanel

The Ipsos KnowledgePanel is an online probability-based panel representative of the U.S. adult population. Households without internet connection are provided with a web-enabled device and free internet service. KnowledgePanel’s recruitment process was originally based on a national RDD sampling methodology. In 2009, the panel switched to using an ABS methodology. Additional information about the recruitment, sampling and weighting procedures for the Ipsos KnowledgePanel are available here.

Sample design

The overall target population for this survey was non-institutionalized persons ages 18 and older, living in the U.S., including Alaska and Hawaii. It featured a stratified random sample from the ATP in which panelists were assigned to the first matching stratum in the following order: tablet households, foreign-born Hispanics, U.S.-born Hispanics, people not registered to vote, people with a high school education or less, foreign-born Asians, people ages 18 to 34, non-Hispanic Blacks, people who use the internet weekly or less, non-volunteers and a final stratum comprised of any remaining panelists not assigned to any of the above. Panelists recruited Sept. 16 to Nov. 1, 2021, were selected with certainty. The remaining strata were sampled at rates designed to ensure that the share of respondents in each stratum is proportional to its share of the U.S. adult population to the greatest extent possible. Respondent weights are adjusted to account for differential probabilities of selection as described in the Weighting section below.

The ATP was supplemented with an oversample from the KnowledgePanel, in which all panelists who had previously identified as Black or African American, or Hispanic (including those who identify as Hispanic or Black in combination with another race) were included in the sample.

Questionnaire development and testing

The questionnaire was developed by Pew Research Center in consultation with Ipsos. The web program was rigorously tested on both PC and mobile devices by the Ipsos project management team and Center researchers. The Ipsos project management team also populated test data that was analyzed in SPSS to ensure the logic and randomizations were working as intended before launching the survey.

Incentives

All respondents were offered a post-paid incentive for their participation. Respondents could choose to receive the post-paid incentive in the form of a check or a gift code to Amazon.com or could choose to decline the incentive. Incentive amounts ranged from $5 to $20 depending on whether the respondent belongs to a part of the population that is harder or easier to reach. Differential incentive amounts were designed to increase panel survey participation among groups that traditionally have low survey response propensities.

Ipsos operates an ongoing modest incentive program for KnowledgePanel to encourage participation and create member loyalty. The incentive program includes special raffles and sweepstakes with both cash rewards and other prizes to be won. Typically, panel members are assigned no more than one survey per week. On average, panel members complete two to three surveys per month with durations of 10 to 15 minutes per survey. An additional incentive is usually provided for longer surveys.

Data collection protocol

The data collection field period for this survey was Nov. 30 to Dec. 12. 2021. Postcard notifications were mailed to all ATP panelists with a known residential address on Nov. 30, 2021.

Invitations were sent out in two separate launches: Soft Launch and Full Launch. Sixty ATP panelists and 526 KP panelists were included in the soft launch, which began with an initial invitation sent on Nov. 30, 2021. The ATP panelists chosen for the initial soft launch were known responders who had completed previous ATP surveys within one day of receiving their invitation. All remaining English- and Spanish-speaking panelists were included in the full launch and were sent an invitation on Dec. 1, 2021.

All panelists with an email address received an email invitation and up to four email reminders if they did not respond to the survey. All ATP panelists that consented to SMS messages received an SMS invitation and up to four SMS reminders.

Table shows invitation and reminder dates

Data quality checks

To ensure high-quality data, the Center’s researchers performed data quality checks to identify any respondents showing clear patterns of satisficing. This includes checking for very high rates of leaving questions blank, as well as always selecting the first or last answer presented. As a result of this checking, five ATP and three KP respondents were removed from the survey dataset prior to weighting and analysis.

Weighting

The data was weighted in a multistep process that accounts for multiple stages of sampling and nonresponse that occur at different points in the survey process. First, each panelist begins with a base weight that reflects their probability of selection for their initial recruitment survey. These weights were then adjusted to account for each panelist’s probability of being sampled to participate in this wave.

Table shows weighting dimensions

Next, respondents were placed into groups defined by the cross-classification of panel (ATP vs. KnowledgePanel), Black identification and Hispanic identification. Within each group, the weights for each respondent were scaled to be proportional to that group’s effective sample size. The groups were then recombined and the weights were poststratified so that the weighted proportions of non-Hispanic Black, Hispanic Black and other Hispanic adults matched that of the U.S. adult population.

The weights were then further calibrated to align with the population benchmarks identified in the accompanying table and trimmed at the 1st and 99th percentiles to reduce the loss in precision stemming from variance in the weights. In a final step, the trimmed weights were again poststratified to ensure that the weighted proportion of non-Hispanic Black, Hispanic Black and other Hispanic adults matched that of the U.S. adult population. Sampling errors and test of statistical significance take into account the effect of weighting.

Some of the population benchmarks used for weighting come from surveys conducted prior to the coronavirus outbreak that began in February 2020. However, the weighting variables for ATP members recruited in 2021 were measured at the time they were recruited to the panel. Likewise, the profile variables for existing panelists were updated from panel surveys conducted in July or August 2021. For KnowledgePanel respondents, many of the weighting variables were measured on this wave.

This does not pose a problem for most of the variables used in the weighting, which are quite stable at both the population and individual levels. However, volunteerism may have changed over the intervening period in ways that make their 2021 measurements incompatible with the available (pre-pandemic) benchmarks. To address this, volunteerism is weighted to an estimated benchmark that attempts to account for possible changes in behavior.

The weighting parameter is estimated using the volunteerism profile variable that was measured on the full American Trends Panel in 2021 but weighted using the profile variable that was measured in 2020. For all other weighting dimensions, the more recent panelist measurements were used. For ATP panelists recruited in 2021, the 2020 volunteerism measure was imputed using data from existing panelists with similar characteristics.

The following table shows the unweighted sample sizes and the error attributable to sampling that would be expected at the 95% level of confidence for different groups in the survey.

Table shows unweighted sample sizes and error attributable

Note: White and Black adults include those who report being only one race and are not Hispanic. Hispanics are of any race. This survey includes oversamples of Black and Hispanic respondents. Unweighted sample sizes do not account for the sample design or weighting and do not describe a group’s contribution to weighted estimates. See the Sample design and Weighting sections above for details. 

Sample sizes and sampling errors for other subgroups are available upon request. In addition to sampling error, one should bear in mind that question wording and practical difficulties in conducting surveys can introduce error or bias into the findings of opinion polls.

Dispositions and response rates

Table shows dispositions
Table shows response rates

Appendix

Chart shows about half of White Democrats have a great deal of confidence in scientists
Chart shows college-educated Democrats especially likely to have a great deal of confidence in scientists