How the Global Religious Landscape Changed From 2010 to 2020
Muslims grew fastest; Christians lagged behind global population increase
BYConrad Hackett, Marcin Stonawski, Yunping Tong, Stephanie Kramer, Anne Shi and Dalia Fahmy
About Pew Research Center
Pew Research Center is a nonpartisan, nonadvocacy fact tank that informs the public about the issues, attitudes and trends shaping the world. It does not take policy positions. The Center conducts public opinion polling, demographic research, computational social science research and other data-driven research. It studies politics and policy; news habits and media; the internet and technology; religion; race and ethnicity; international affairs; social, demographic and economic trends; science; research methodology and data science; and immigration and migration. Pew Research Center is a subsidiary of The Pew Charitable Trusts, its primary funder.
How the Global Religious Landscape Changed From 2010 to 2020
Muslims grew fastest; Christians lagged behind global population increase
How we did this
This report describes the world’s religious makeup in 2020 and how it changed from 2010. We focus on seven categories: Christians, Muslims, Hindus, Buddhists, Jews, people who belong to other religions, and those who are religiously unaffiliated.
The “other religions” category includes Baha’is, Daoists, Jains, Shintoists, Sikhs, Wiccans, Zoroastrians and many small groups, some of which can be described as folk or traditional religions. The religiously unaffiliated category – sometimes called “nones” – consists of people who do not identify with any religion.
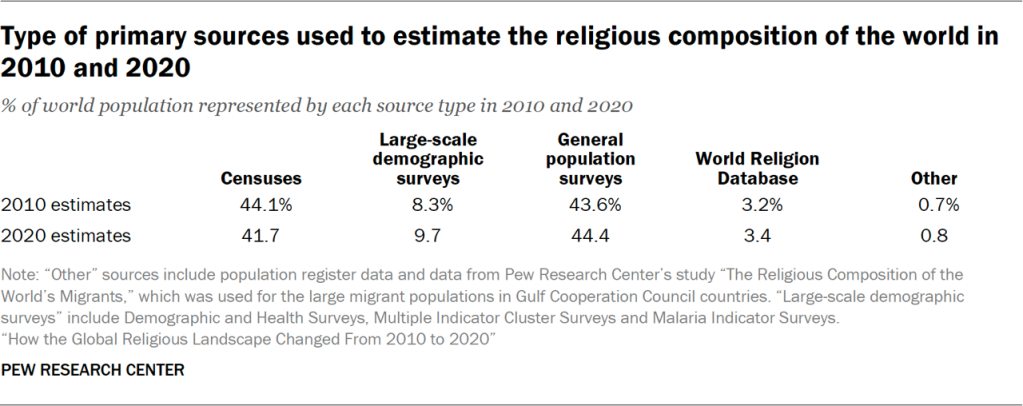
This analysis is based on more than 2,700 sources of data, including national censuses, large-scale demographic surveys, general population surveys and population registers. The COVID-19 pandemic caused widespread delays in the collection of census and survey data, and some estimates for 2020 in this report are based on data that was not made public until 2024. At least 65 countries delayed their censuses, most of which originally were planned for 2020 or 2021.
Many censuses and surveys ask respondents a question like, “What is your religion, if any?” However, the exact wording of the question and the response options vary. We sorted a wide range of responses into the seven categories listed above. For example, the “Religiously unaffiliated” category includes people who say they are atheist, agnostic or “nothing in particular” in response to a Pew Research Center survey question about religious identity, as well as people who choose a “No religion” or “None” option in other surveys and national censuses.
To help explain the demographic dynamics that drove religious change between 2010 and 2020, we looked at religion-specific data on fertility rates and the age distribution of religious groups in each country, as well as mortality patterns for the overall population of each country.
In addition, we analyzed survey data about respondents’ childhood religions and their current religious identities (as adults) to estimate rates of religious “switching” – how many people have left or joined each religious group, including how many have left religion altogether.
Our estimates cover 201 countries and territories that had populations of at least 100,000 people in 2010 or 2020. Collectively, these places are home to 99.98% of the world’s population. Data on country population totals and general demographic characteristics come from the 2024 revision of the United Nations’ World Population Prospects.
This is the latest in an ongoing series of reports produced by Pew Research Center as part of the Pew-Templeton Global Religious Futures project, which analyzes religious change and its impact on societies around the world. Funding for the Global Religious Futures project comes from The Pew Charitable Trusts and the John Templeton Foundation (grant 62287). This publication does not necessarily reflect the views of the John Templeton Foundation.
The world’s population expanded from 2010 to 2020, and so did most religious groups, according to a Pew Research Center analysis of more than 2,700 censuses and surveys.
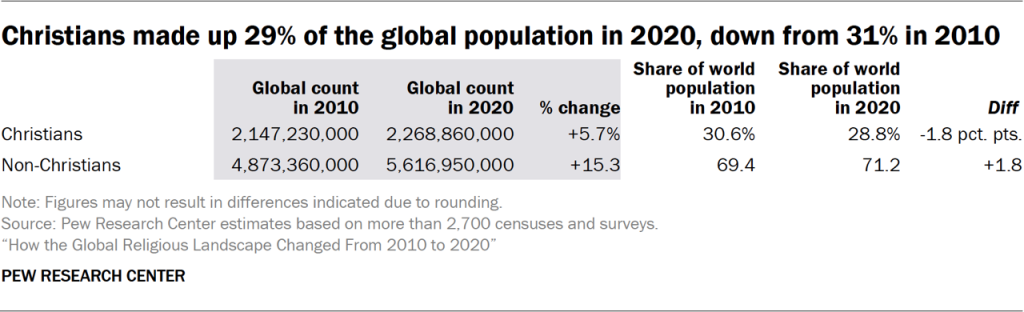
Christians remained the world’s biggest religious group. But Christians (of all denominations, counted as one group) did not keep pace with global population growth from 2010 to 2020.
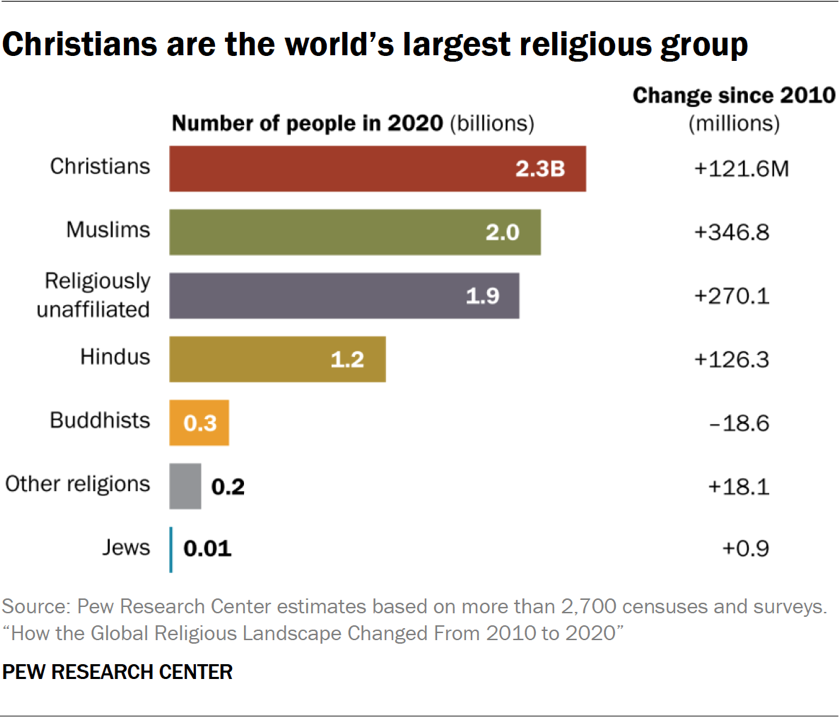
The number of Christians rose by 122 million, reaching 2.3 billion.
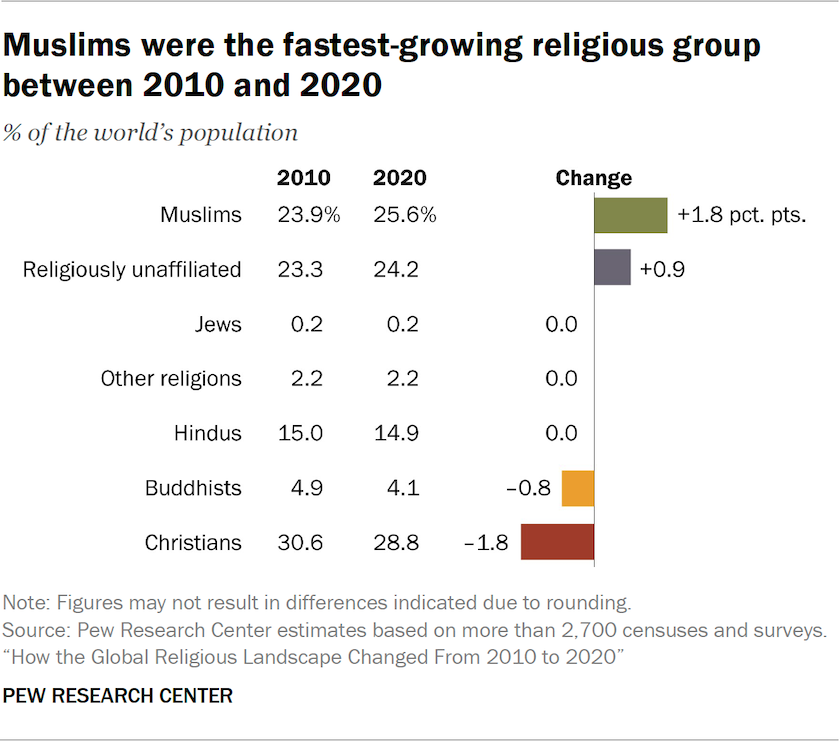
Yet, as a share of the world’s population, Christians fell 1.8 percentage points, to 28.8%.
Muslims were the fastest-growing religious group over the decade.
The number of Muslims increased by 347 million – more than all other religions combined.
The share of the world’s population that is Muslim rose by 1.8 points, to 25.6%.
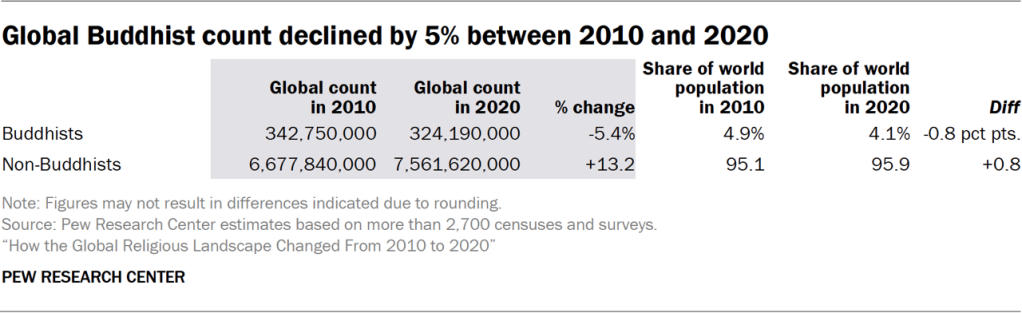
Buddhists were the only major religious group that had fewer people in 2020 than a decade earlier.
The number of Buddhists worldwide dropped by 19 million, declining to 324 million.
As a share of the global population, Buddhists slipped by 0.8 points, to 4.1%.
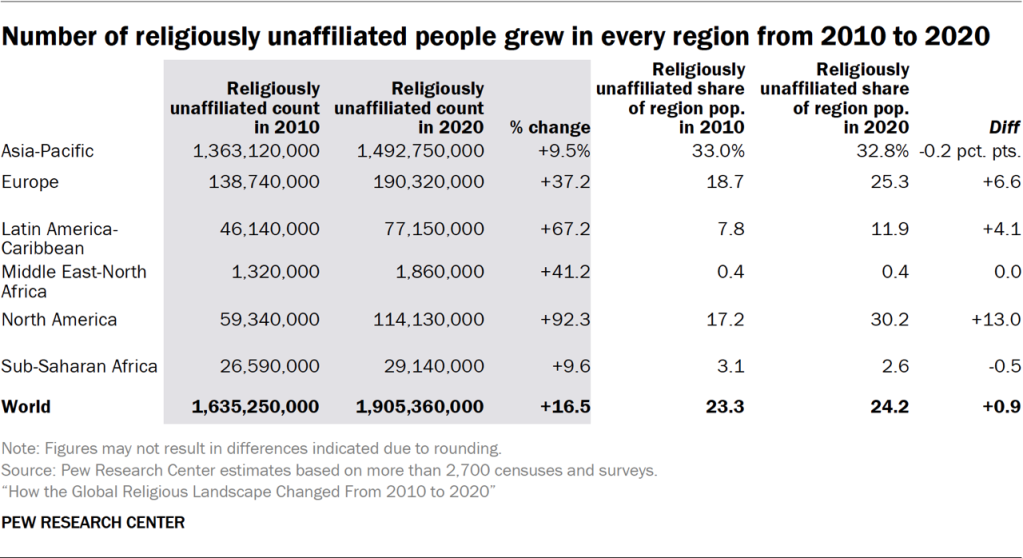
People with no religious affiliation – who are sometimes called “nones” – were the only category aside from Muslims that grew as a percentage of the world’s population.1
The number of religiously unaffiliated people rose by 270 million, reaching 1.9 billion.
The share of “nones” climbed nearly a full percentage point, to 24.2%.
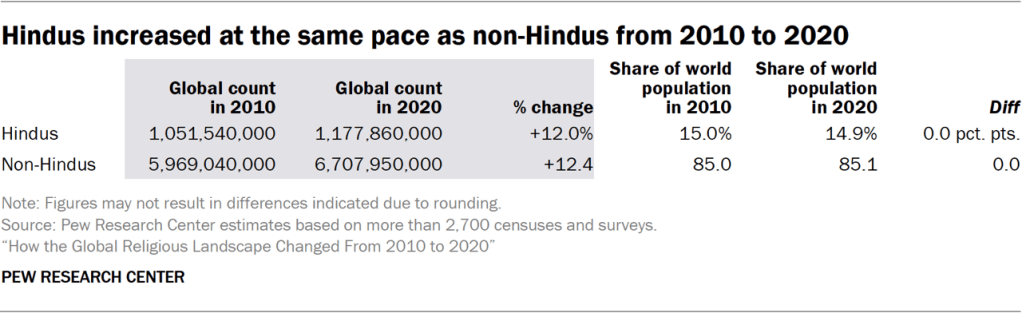
Hindus grew at about the same rate as the world’s overall population.
The number of Hindus rose by 126 million, reaching 1.2 billion.
As a proportion of the global population, Hindus held steady at 14.9%.
Jews also held steady as a share of the world’s population.2
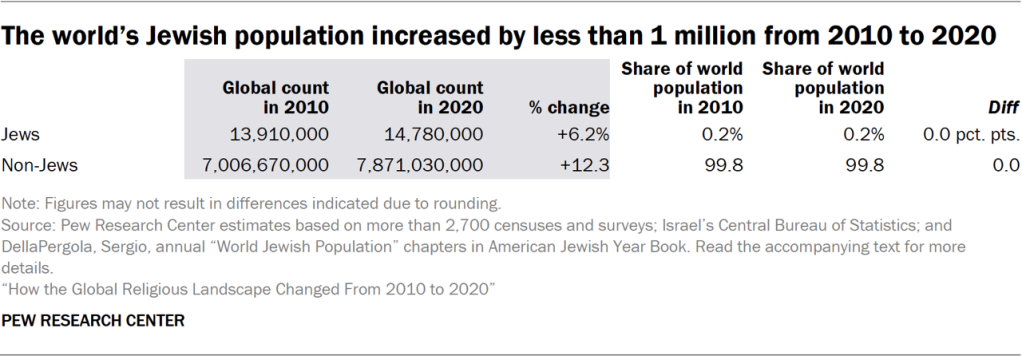
The number of Jews worldwide grew by nearly 1 million, reaching 14.8 million.
In percentage terms, Jews were the smallest group in the study, representing about 0.2% of the world’s population.
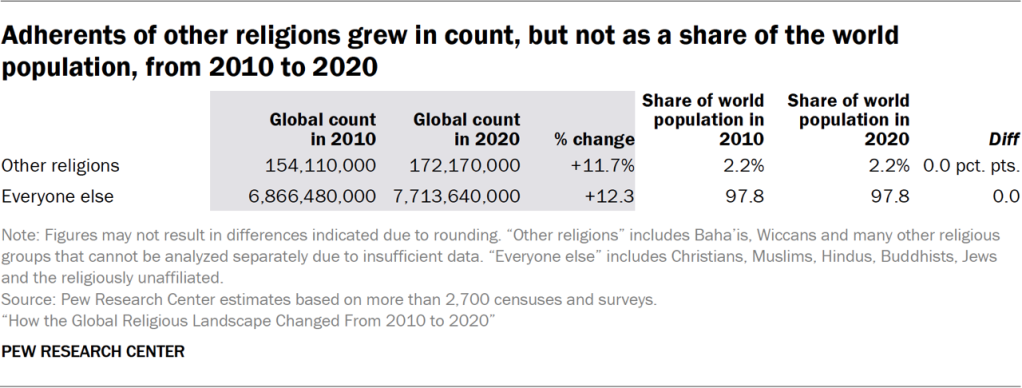
All other religions combined (including Baha’is, Daoists, Jains, Sikhs, adherents of folk religions and numerous other groups) expanded in tandem with the rest of the world. Their share of the global population held steady at 2.2%.
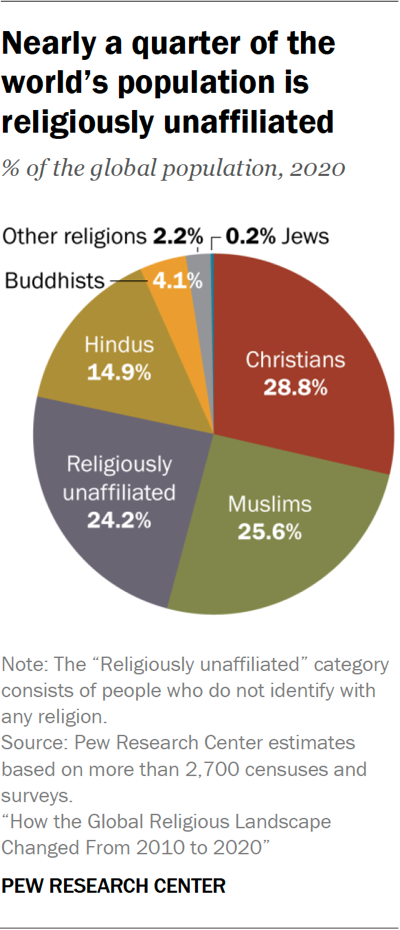
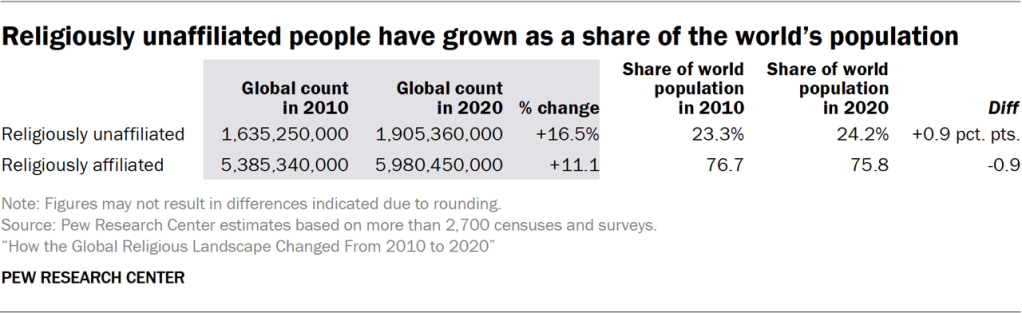
Collectively, 75.8% of the world’s people identified with a religion as of 2020. The remaining 24.2% did not identify with any religion, making people with no religious affiliation the third-largest group in this study, after Christians and Muslims.
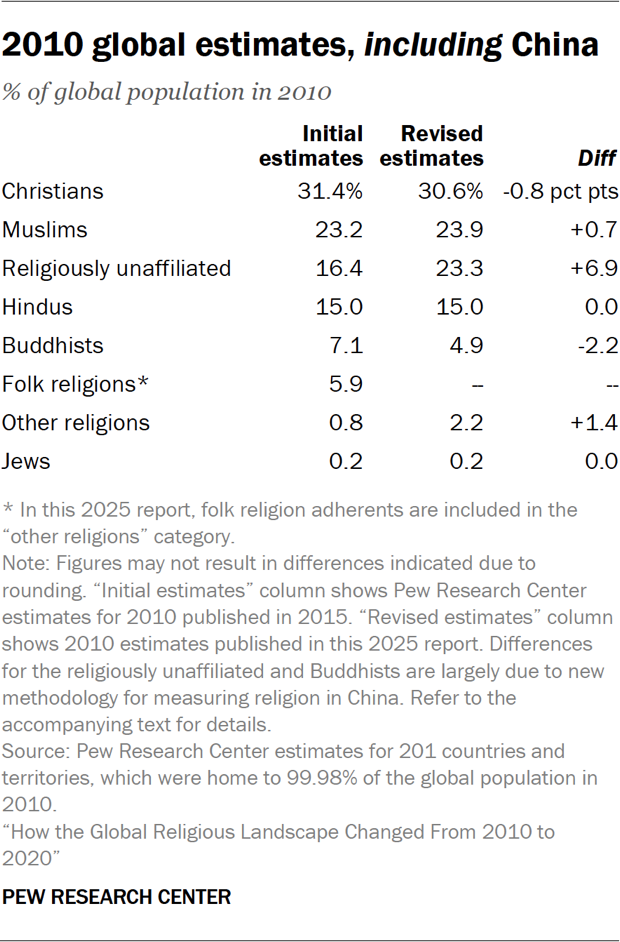
Since 2010, the share of the global population that has any religious affiliation has declined by nearly 1 percentage point (from 76.7%) while the share without an affiliation has risen by the same amount (from 23.3%).
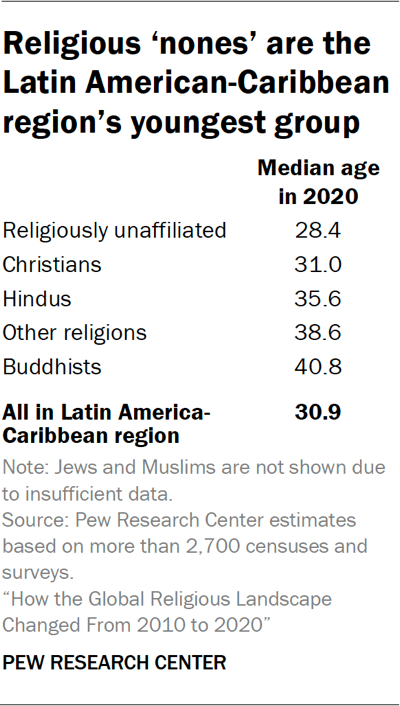
The growth of religious “nones” is striking because they are at a “demographic disadvantage” – their population is relatively old, on average, with relatively low fertility rates. However, unaffiliated people continued to grow as a share of the global population because many affiliated people around the world – primarily Christians – are “switching” out of religion.
How religious ‘nones’ grew despite their demographic disadvantage
Typically, change in population sizes is driven by demographic factors, including differences in groups’ fertility and mortality patterns, as well as their age distribution (also called “age structure”). Populations that are relatively young, on average, and have more children typically expand more quickly than those that are relatively old or have large numbers of people who die prematurely due to wars, diseases or famines.
When growth occurs because more babies are being born than people are dying, demographers call it “natural increase.” But the growth of the religiously unaffiliated population is not simply the result of natural increase. Indeed, at the global level, the “nones” population is older and has a lower fertility rate than Christians, Muslims and Hindus.3
The growth in the share of people around the world who are religiously unaffiliated is striking because low fertility and an older age structure put religiously unaffiliated people at what demographers call a disadvantage compared with the higher fertility and younger age of religiously affiliated people, globally.
So why did the world’s religiously unaffiliated population grow faster than the affiliated? Religious “switching” – especially people shedding their religious identity after having been raised as Christians – explains much of the unaffiliated population’s growth between 2010 and 2020.4
In other words, the large number of people leaving religion helped religiously unaffiliated people expand as a share of the global population, even though the growth of religiously unaffiliated people is slowed by demographic disadvantages such as being older and having fewer children, on average.
Regional change
Between 2010 and 2020, the share of the global population living in sub-Saharan Africa increased to 14.3% (up 2 percentage points), and the share living in the Middle East-North Africa region rose to 5.6% (up 0.5 points).
Every other region held a smaller share of the world’s population in 2020 than in 2010. These shifts are reflected in the geographic distribution of some religious groups, including Christians.
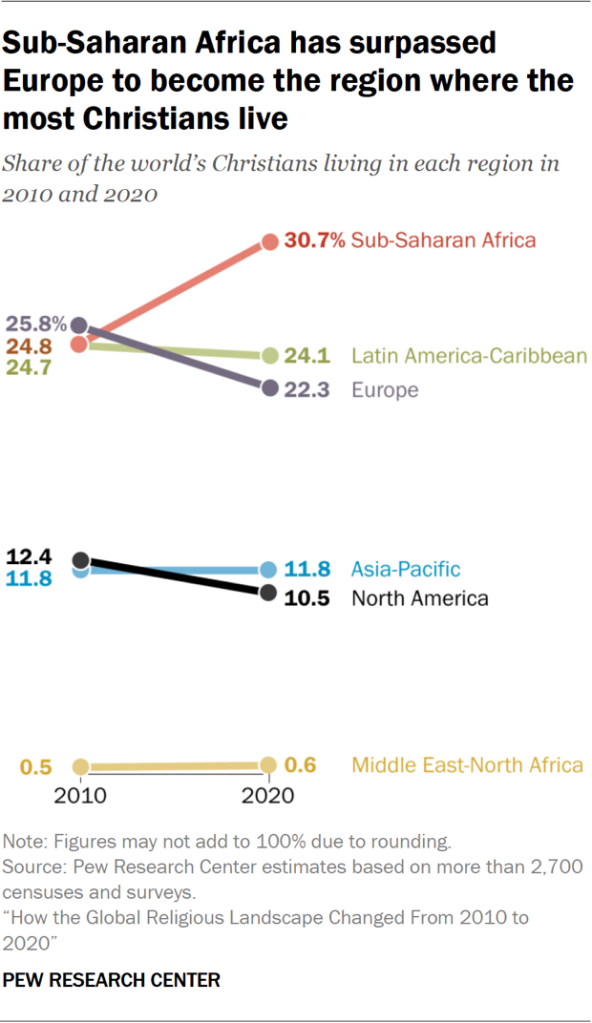
Sub-Saharan Africa is now home to the largest number of Christians, surpassing Europe. As of 2020, 30.7% of the world’s Christians live in sub-Saharan Africa, compared with 22.3% in Europe. This change was fueled by differences in the two regions’ rates of natural increase (with much higher fertility rates in Africa than in Europe), as well as by widespread Christian disaffiliation in Western Europe.
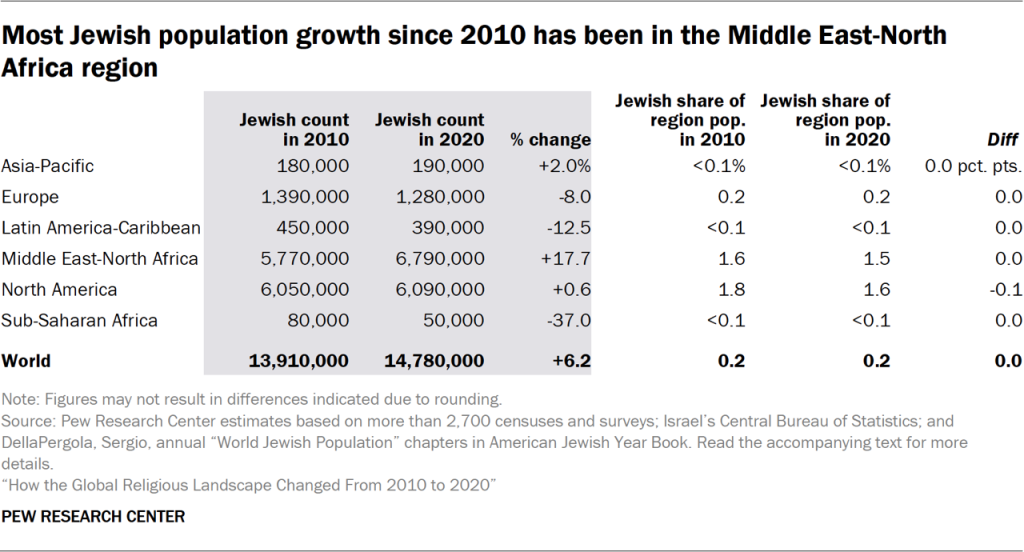
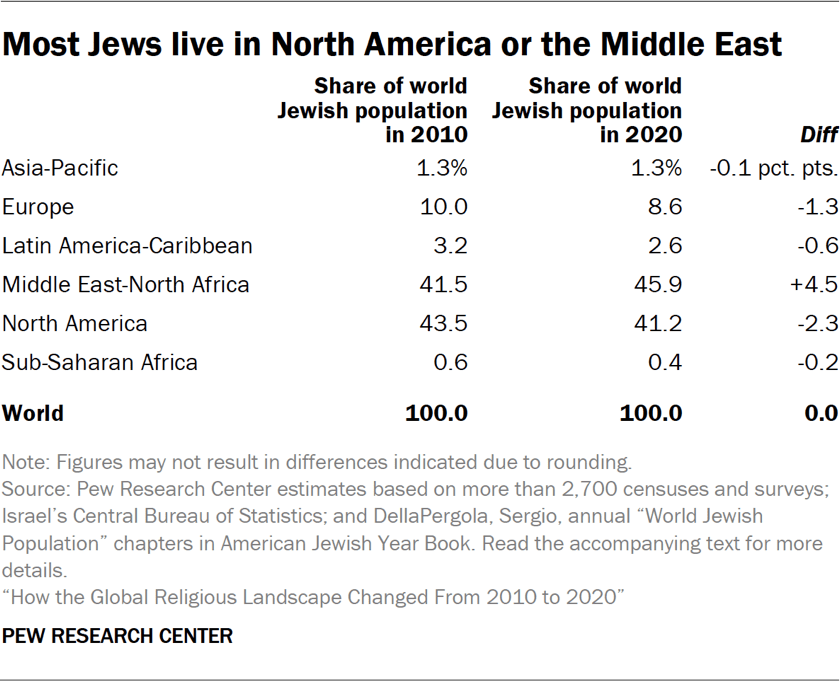
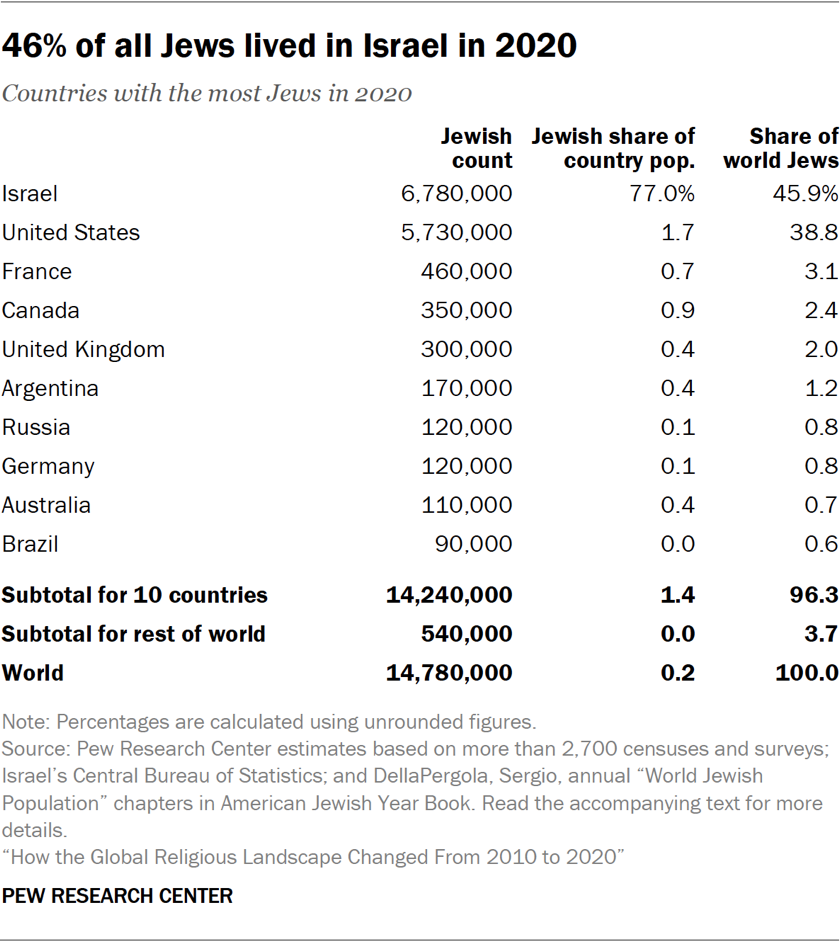
The regional concentration of Jews also has changed. As of 2020, 45.9% of Jews live in the Middle East-North Africa region, while 41.2% reside in North America. In 2010, North America was the region where the largest number of Jews lived. This shift was primarily the result of Israel’s Jewish population growing from 5.8 million to 6.8 million between 2010 and 2020, through a combination of natural increase and migration.5
Changes within countries
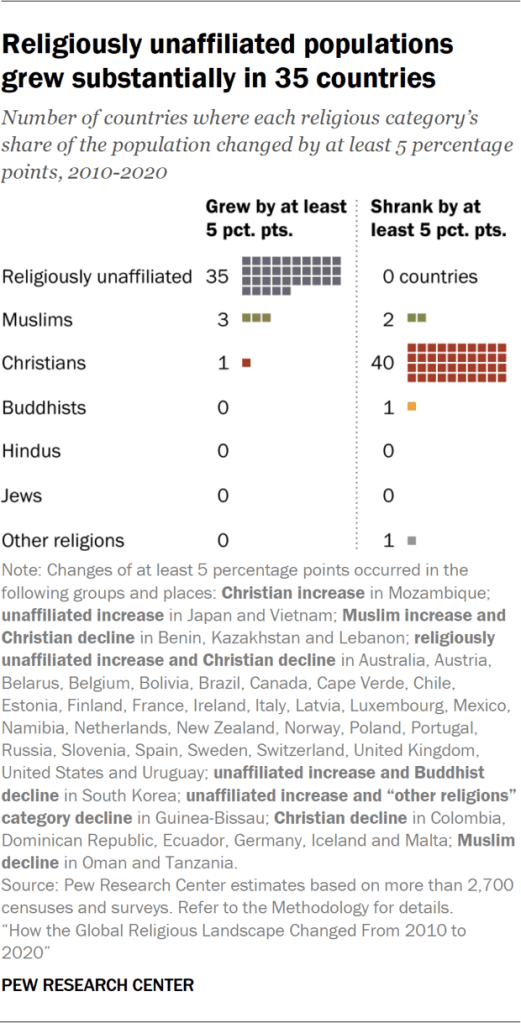
Another way to assess religious change is to look at how many countries and territories experienced a substantial shift in their religious makeup. In this section, we focus on places where a religious group’s share of the overall population grew or shrank by at least 5 percentage points between 2010 and 2020. (For a discussion of the challenge of measuring the statistical significance of changes in religious composition, refer to the Methodology.)
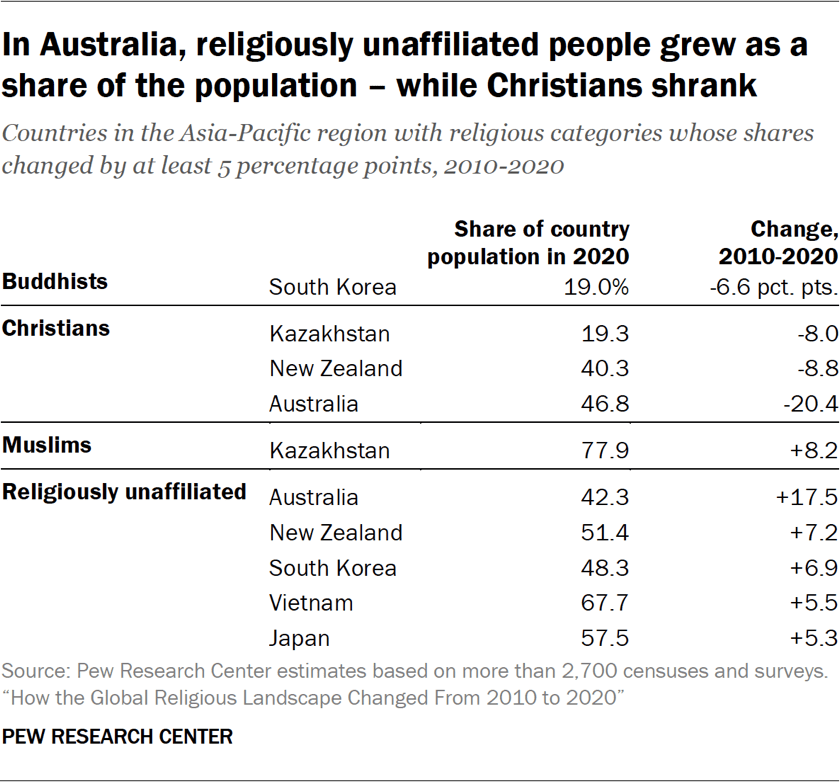
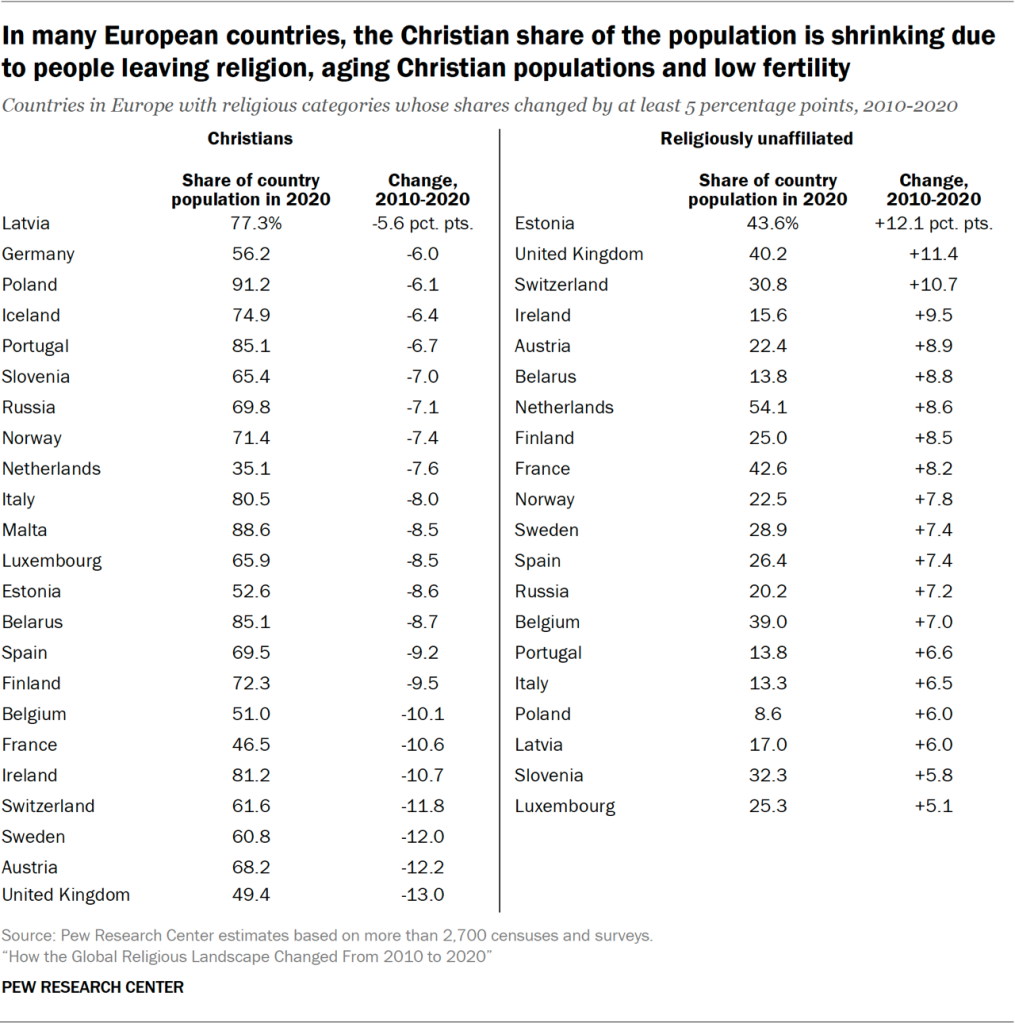
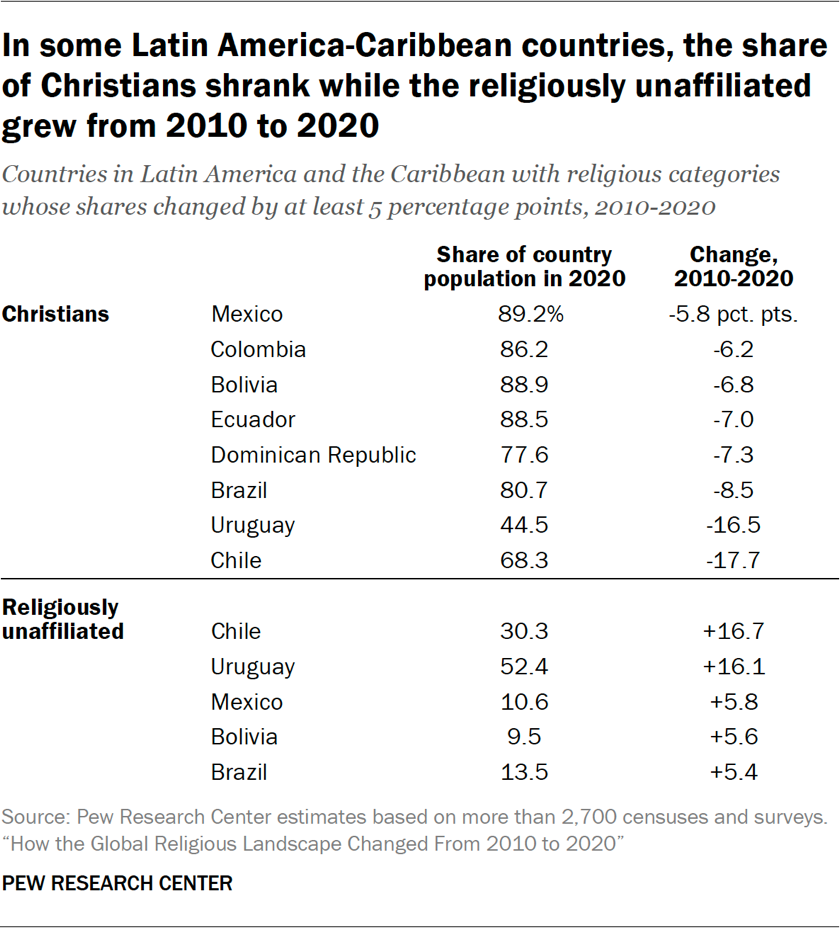
Christians experienced a substantial change, as defined above, in more countries (41) than any other religious group. In all but one case, Christians shrank as a share of the population. Most of the countries experiencing declines were in the Americas and Europe. The decreases ranged from a 5-point drop in Benin to a 14-point drop in the U.S. and a 20-point drop in Australia.
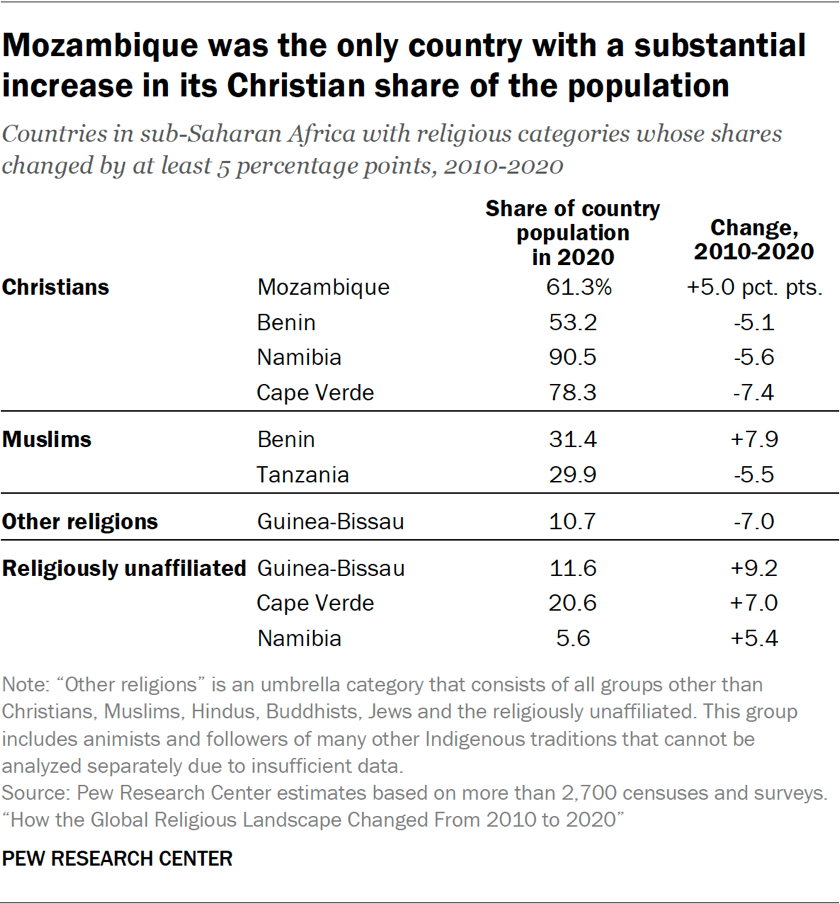
Only in Mozambique did the share of the population that is Christian grow substantially between 2010 and 2020, rising by 5 percentage points.
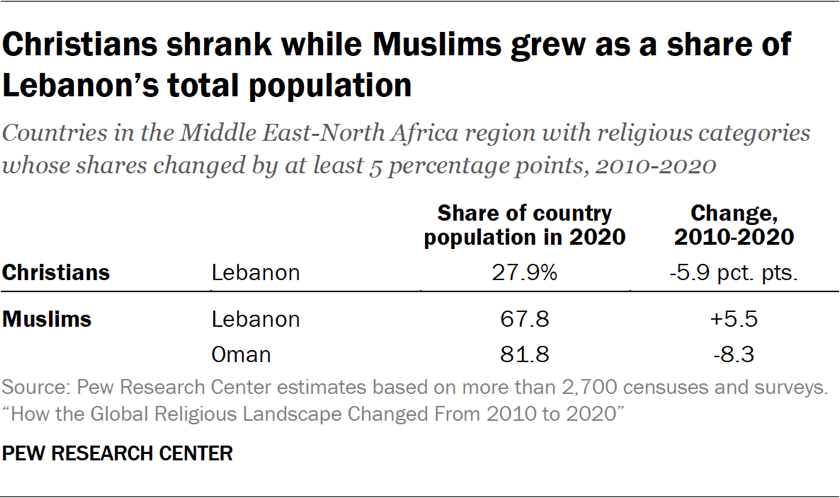
Few countries experienced substantial changes in the percentage of Muslims in their populations. Although the global Muslim population grew at a faster rate than any other major religion between 2010 and 2020, this was largely because of overall population growth in the countries where Muslims are concentrated. Muslim shares are estimated to have risen by at least 5 points in Kazakhstan, Benin and Lebanon, and to have dropped by at least 5 points in Tanzania and Oman.
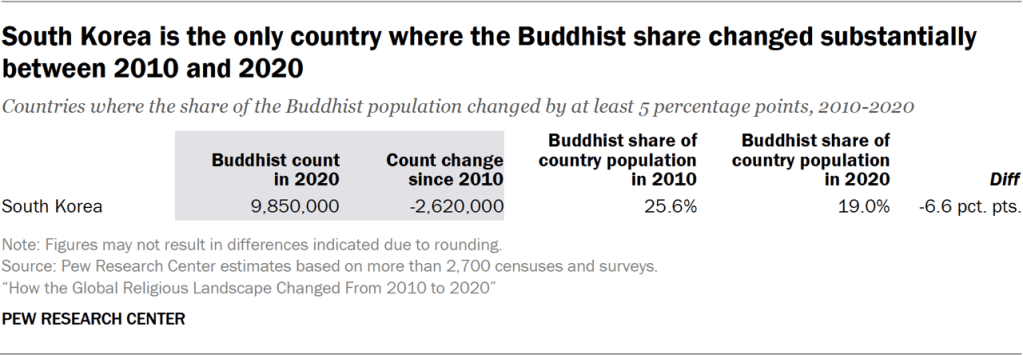
In addition, there were declines of 7 points in the Buddhist share of South Korea’s population and in the share that people of other religions made up of Guinea-Bissau’s population.
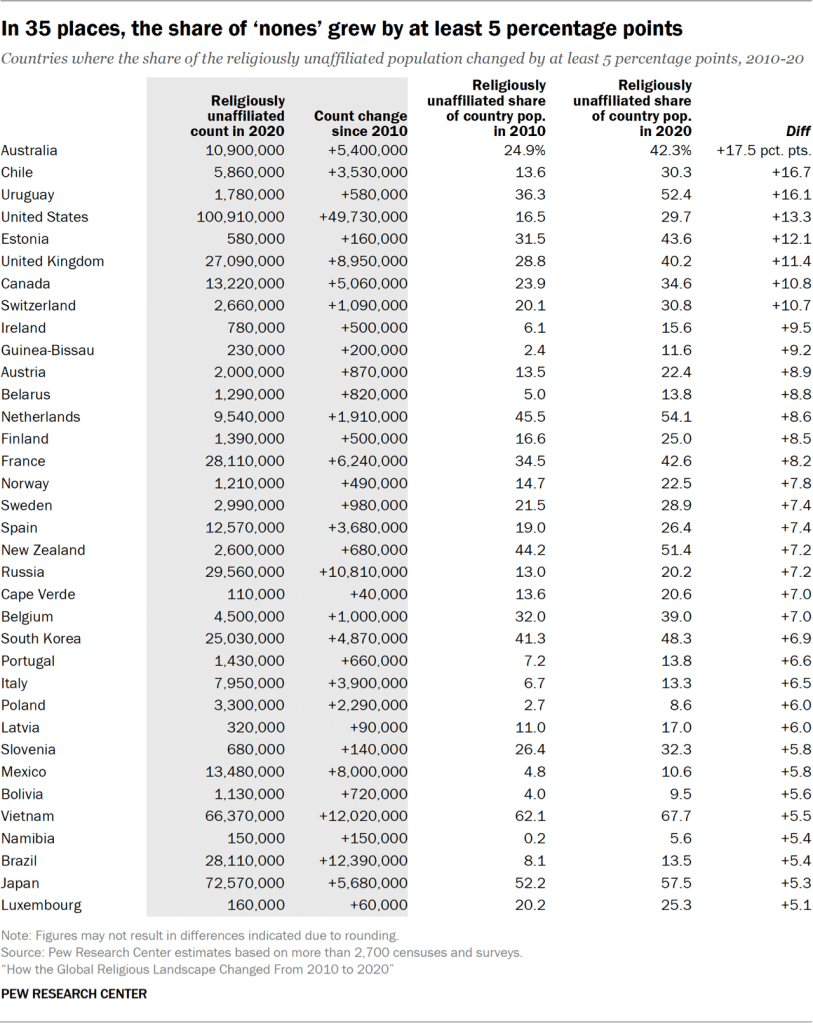
Religiously unaffiliated people experienced the largest number of substantial increases. People of no religion gained at least 5 percentage points in 35 countries spread across the globe. The unaffiliated grew the most (as a share of each country’s total population) in the U.S. (up 13 points), Uruguay (up 16 points), Chile (up 17 points) and Australia (up 17 points).
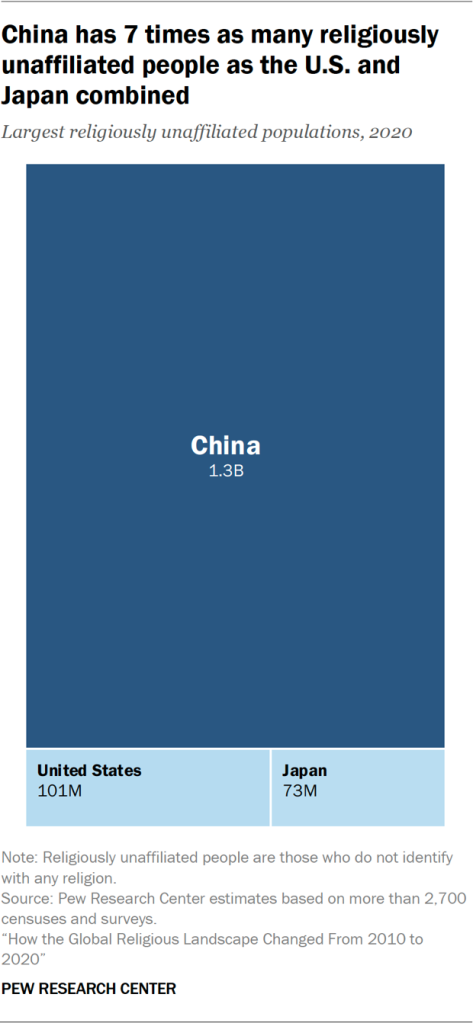
The United States, as of 2020, is the country with the world’s second-largest number of religiously unaffiliated people (after China), surpassing Japan.
The U.S. had roughly 101 million religious “nones” in 2020 (up 97% from a decade earlier), while Japan had 73 million (up 8%). However, the unaffiliated category continues to account for a much larger share of the total population in Japan – 57% of all Japanese are religiously unaffiliated – than in the U.S., where 30% identify as atheist, agnostic or “nothing in particular.”
In both 2010 and 2020, China had more religiously unaffiliated people than any other country. China’s 1.3 billion unaffiliated people made up 90% of its total population in 2020.6
Most countries still have Christian majorities
Due to disaffiliation from Christianity, there now are fewer Christian-majority countries and more countries with a religiously unaffiliated majority than there were in 2010.
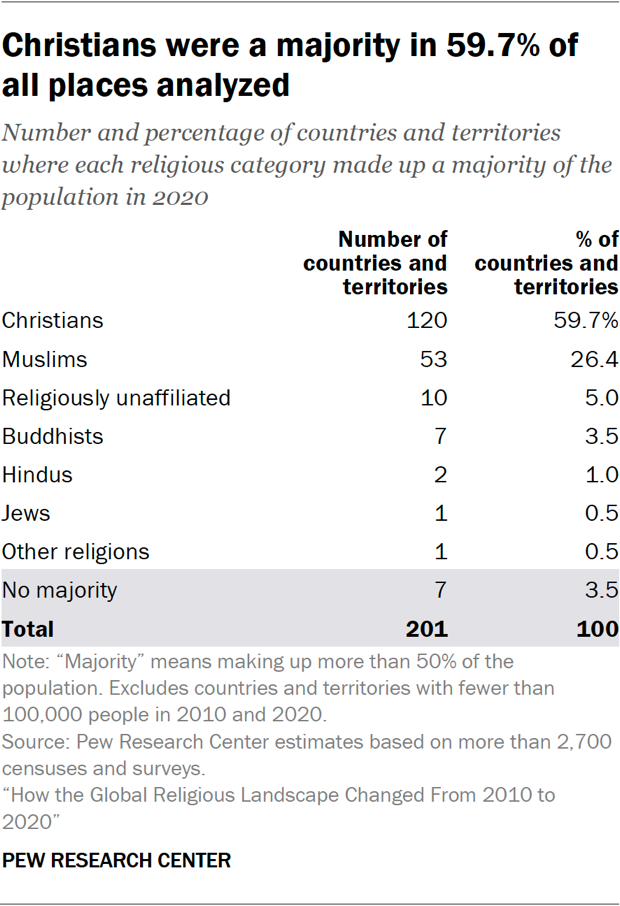
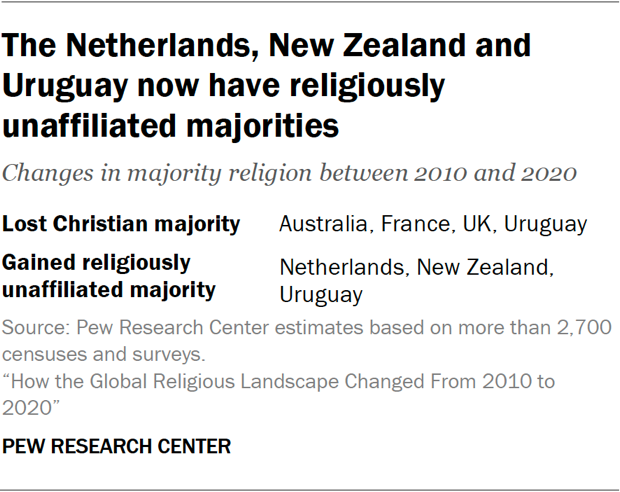
As of 2020, Christians were a majority in 120 countries and territories, down from 124 a decade earlier. Christians dropped below 50% of the population in the United Kingdom (49%), Australia (47%), France (46%) and Uruguay (44%). In each of these places, religiously unaffiliated people now account for 40% or more of the population, and smaller religious groups such as Muslims, Hindus, Buddhists, Jews or adherents of other religions (combined) account for 11% or less.
Over the same period, religiously unaffiliated people became a majority in the Netherlands (54%), Uruguay (52%) and New Zealand (51%), raising the number of places with an unaffiliated majority from seven to 10. (These countries joined China, North Korea, the Czech Republic, Hong Kong, Vietnam, Macao and Japan, which already had religiously unaffiliated majorities in 2010.)
There was no change in the number of places in which the majority of the population are Muslim (53), Buddhist (7), Jewish (1) or followers of other religions (1).7
These are among the key findings of a Pew Research Center of more than 2,700 censuses and surveys, including census data releases that were delayed due to the coronavirus pandemic. The study is part of the Pew-Templeton Global Religious Futures project, which seeks to understand global religious change and its impact on societies.
Global change in the size of religious populations is the result of two primary mechanisms: religious “switching” and natural increase (i.e., the difference between births and deaths). The latter is influenced by several demographic factors: age structure, fertility and mortality (or life expectancy).
How much change each mechanism creates varies by religion:
Religious disaffiliation is the main driver of the decline in the Christian share of the global population.
Religious disaffiliation – primarily of people leaving Christianity – also is the main driver of the growth of religiously unaffiliated populations.
Increases in the global Muslim population are largely due to Muslims having a relatively young age structure and high fertility rate, two characteristics that result in natural population growth.
In addition, migration is a source of religious change within some regions and countries. But migration does not affect religious group sizes at the global level (as long as people remain bound to this planet). For more about the regional and country-level impact of migration, read Chapter 1.
Religious ‘switching’
Although most people around the world still identify with the religion in which they were raised, religious switching is pervasive. Overall, there’s been a net movement of people switching into the religiously unaffiliated category.
This Pew Research Center study is the first to report on observed patterns of switching into and out of religious groups at the global level.8 In many countries, this change has followed a generational pattern: Each new generation of young adults has contained a larger share of people who are religiously unaffiliated, either because they were not raised in any religion or because they have switched away from the religion in which they were raised.
What is religious ‘switching’?
Throughout this report, religious switching refers to a change between the religious group in which a person says they were raised (during their childhood) and their religious identity now (in adulthood).
We use the term “switching” rather than “conversion” because many people who switch identities leave religion to become religiously unaffiliated.
We count changes between seven large religious categories (such as from Buddhist to Christian, or from Hindu to religiously unaffiliated) but not switching within each category (such as from Catholic to Protestant).
Many more people grew up with a religion than grew up with no religion. And most people, as adults, still identify with a religion. But the balance between the groups is changing.
Using surveys from 117 countries and territories, we analyzed data from adult respondents and compared the religion they say they were raised in (as children) with their current religious identity (as adults).9
To capture switching that has occurred in more recent years, we use data from adults ages 18 to 54. Religious switching is more common earlier in life, though it can happen at any age.
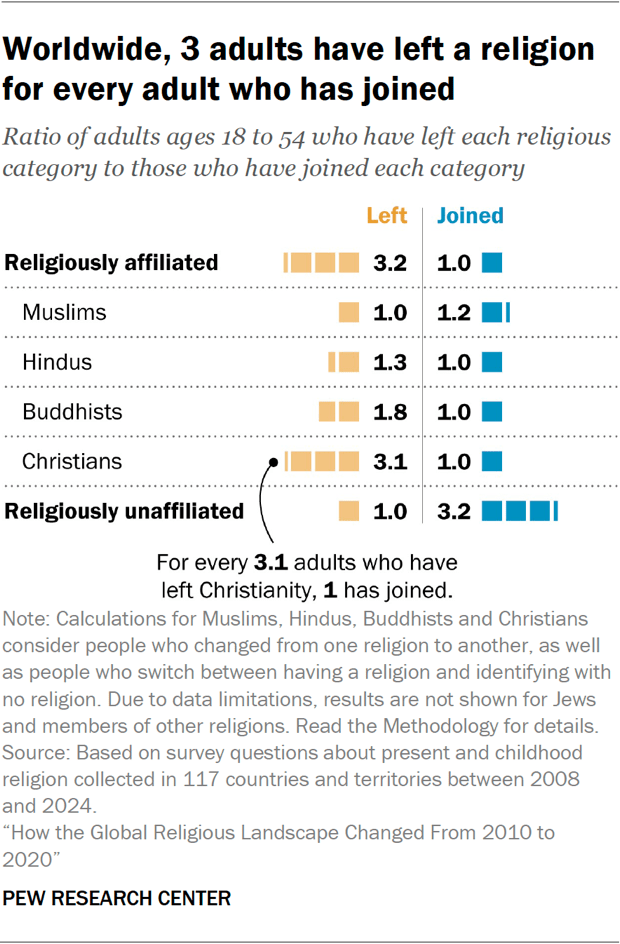
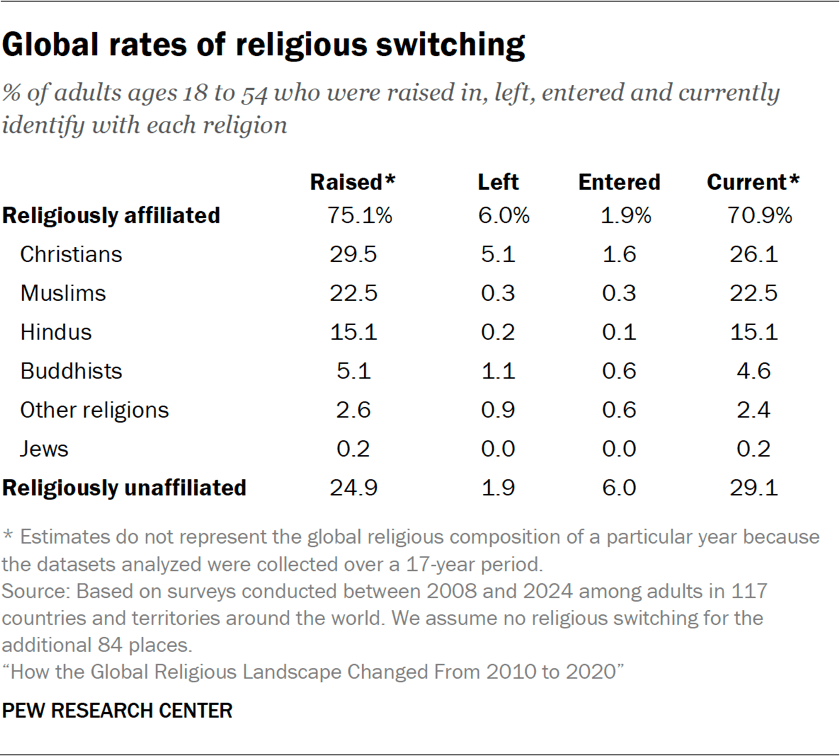
We found that for every adult in that age group who says they joined a religion after having been raised without a religion, 3.2 moved in the other direction – they left religion altogether after having been raised in one.
As a result, based on this set of measures, the religiously unaffiliated category has had the largest net gain due to switching.
Christians have experienced the biggest net losses from switching (3.1 have left for every 1.0 who has joined). Most former Christians no longer identify with any religion, but some now identify with a different religion.
Buddhists also have had more people leave than join (1.8 left, 1.0 joined).
Hindus have had more people leave than join, while the reverse is true for Muslims. However, religious switching into or out of these two groups is relatively uncommon, so the modest differences in the ratio of leavers to joiners has a small overall effect on the size of Hindu and Muslim populations.
For more details about religious switching, read Chapter 1.10
Religious ‘switching’ out of Christianity in the United States
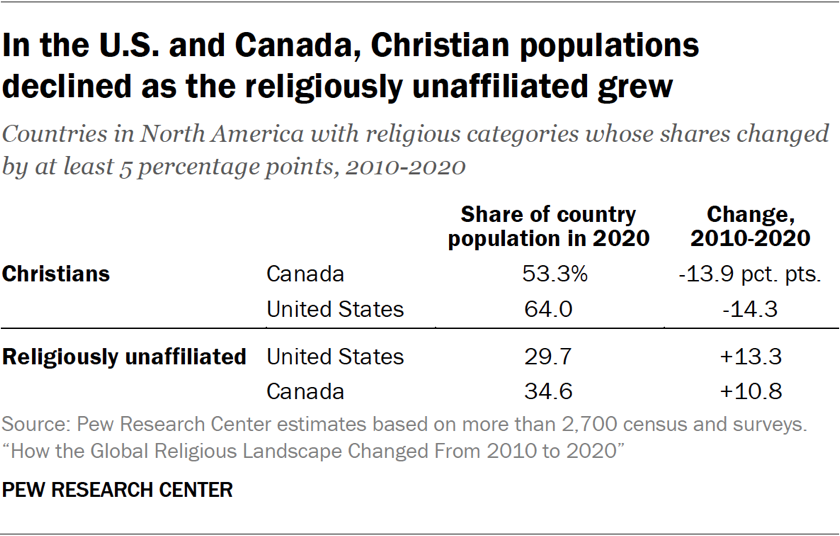
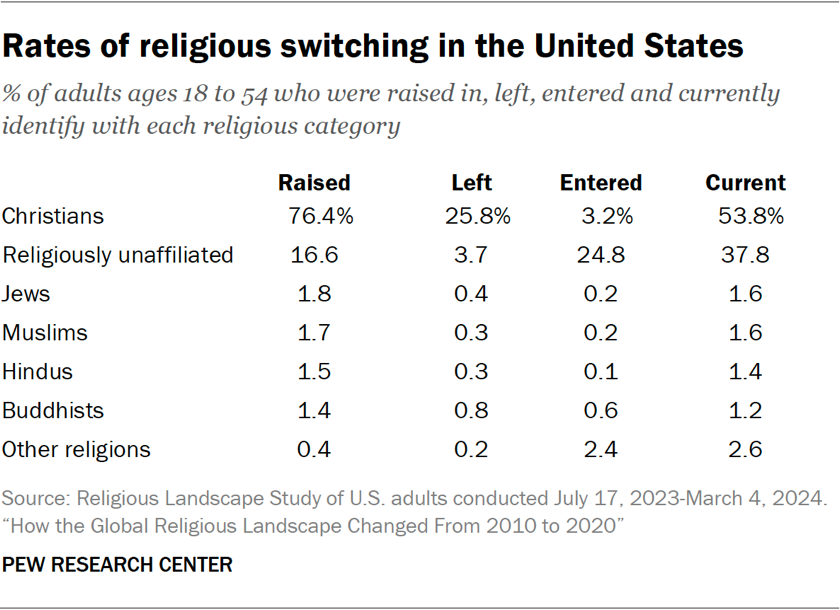
The share of the U.S. population – including children – who are Christian dropped from 78.3% in 2010 to 64.0% in 2020, while the share who are religiously unaffiliated rose from 16.5% to 29.7%, according to our analysis. (These estimates for people of all ages differ slightly from the figures for U.S. adults ages 18 and older that Pew Research Center published in the 2023-24 U.S. Religious Landscape Study, or RLS.)
The United States is one of many countries where large numbers of Christians have become religiously unaffiliated. Moreover, younger generations in the U.S. are less likely than older generations to identify as Christian.
If these switching patterns and generational differences persist, then in the long term, the share of Christians in the U.S. population will continue to fall and the share of unaffiliated people will continue to rise. However, our surveys since 2020 indicate that the percentage of Americans who identify as Christians may have leveled off, at least temporarily. Read more in the 2023-24 RLS.
Natural increase
Natural population growth – the extent to which births outnumber deaths – is greater for religious groups that have higher fertility rates and lower mortality rates.
In a report published in 2017, we modeled the number of births and deaths that occurred globally between 2010 and 2015. We estimated that Muslims gained the most via natural increase, followed by Christians. By contrast, natural growth among the religiously unaffiliated was modest.
Groups’ varied rates of natural increase are partly the result of geographic distribution. Religions that are concentrated in parts of the globe with relatively high overall population growth (such as the Middle East-North Africa region and sub-Saharan Africa) naturally would expand more quickly than those concentrated in low-growth regions (such as North America, the Asia-Pacific region and Europe).
Muslims and Christians have a large presence in the rapidly growing region of sub-Saharan Africa, but many Christians also live in the slower-growth regions of Europe and the Americas. Religiously unaffiliated people and Buddhists are heavily concentrated in countries that have shrunk as a share of the world’s population, including China and Japan.
Nevertheless, religious differences sometimes appear to play a role in fertility, even after accounting for geography. For example, Nigerian Muslims have a higher average birth rate than Nigerian Christians, and Hindus in India have a higher fertility rate than Buddhists in India. These differences also may be related to other factors, such as education, access to birth control and women’s workforce participation rates.
For more details about natural growth patterns, read Chapter 1.
Economic development and religious affiliation
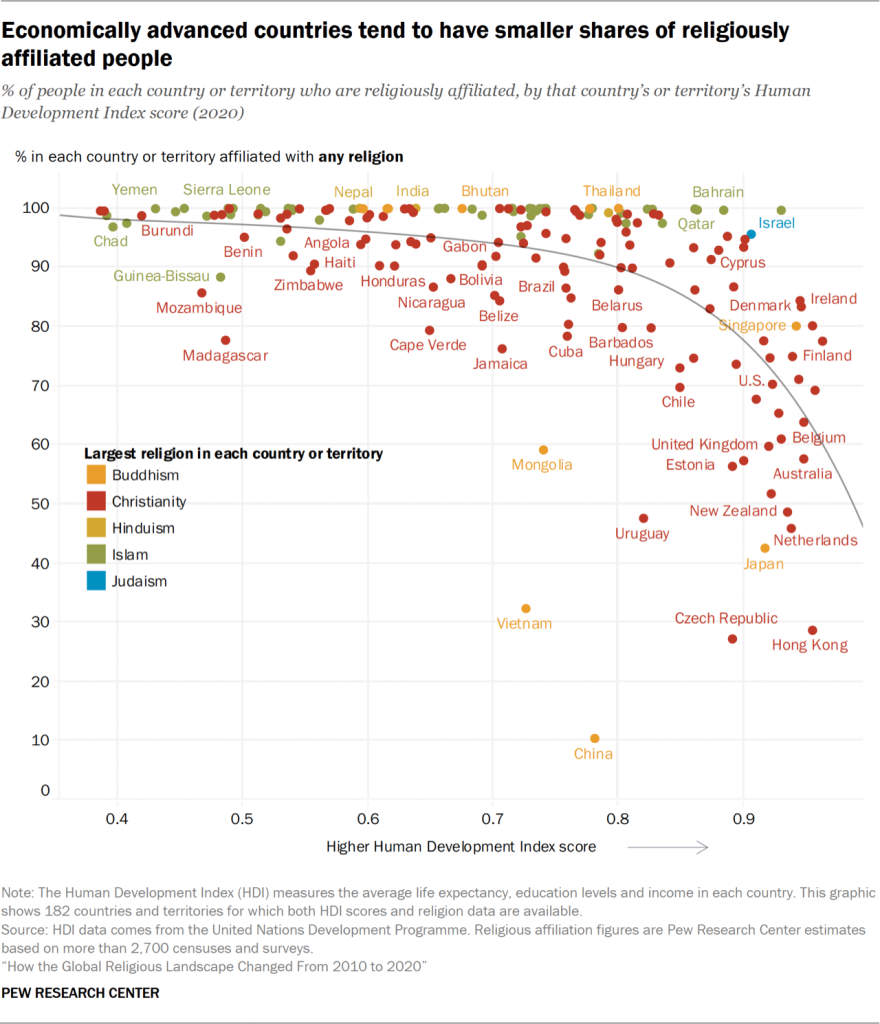
People in wealthier parts of the world are, on average, less religious than those in societies with less advanced economies. This pattern holds true across many different measures of religion – such as rates of daily prayer and belief in god – and across many indicators of economic development. For example, Pew Research Center in 2018 found that people in countries with higher life expectancy at birth are less likely to attend religious services weekly.11
To get a more general sense of this pattern, it helps to look at country scores on the United Nations’ Human Development Index (HDI), which combines data on life expectancy, education and income.
We find that countries with high HDI scores (i.e., those that are more developed) tend to have lower rates of religious affiliation. In many of these countries, Christianity is the most common religion. In a few Asian countries with high HDI scores and low affiliation rates, Buddhism is the largest religion. In some countries, the religiously unaffiliated category is approaching or already exceeds the largest religious group in size.
Countries with low HDI scores, on the other hand, tend to have high rates of religious affiliation.
Economic development is not perfectly correlated with religion, and there are some countries with high rates of religious affiliation across the range of HDI scores. This includes many Muslim-majority countries, Hindu-majority India and Nepal, and Jewish-majority Israel.
Geographic distribution of religious groups in 2020
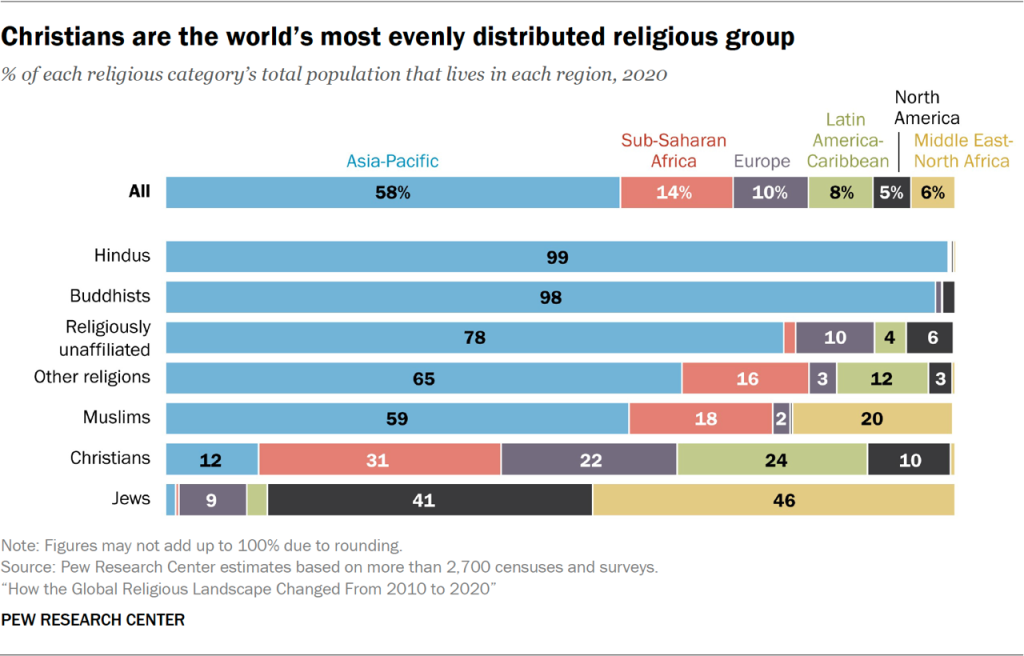
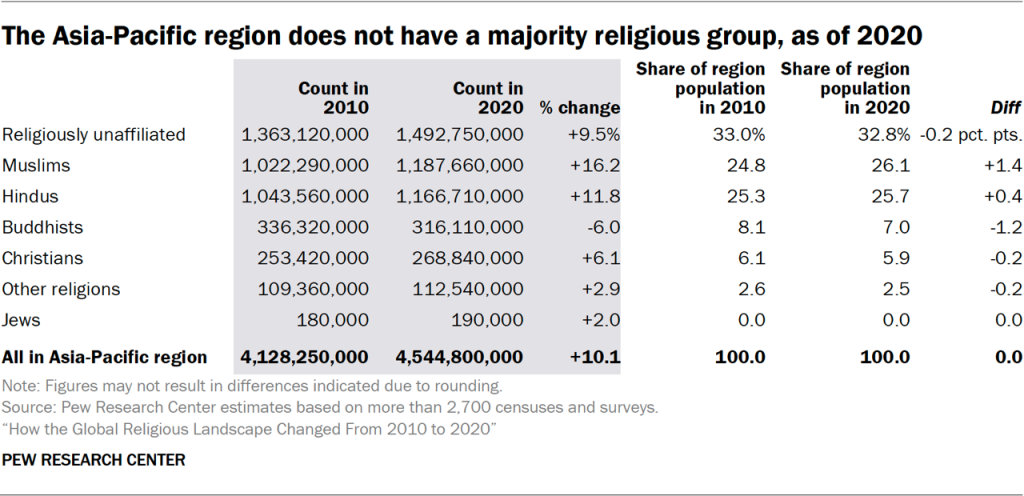
Nearly six-in-ten people worldwide live in the Asia-Pacific region, including most people in five religious categories: 99% of Hindus, 98% of Buddhists, 78% of the religiously unaffiliated, 65% of followers of other religions, and 59% of Muslims.
Christians are the most geographically dispersed group. The largest share of Christians live in sub-Saharan Africa (31%), followed by the Latin America-Caribbean region (24%) and Europe (22%). This is a major geographic change since the early 1900s, when Christians in sub-Saharan Africa made up 1% of the global Christian population and two-thirds of Christians lived in Europe.
Most Jews live either in the Middle East-North Africa region or in North America.
Age profile of religious groups in 2020
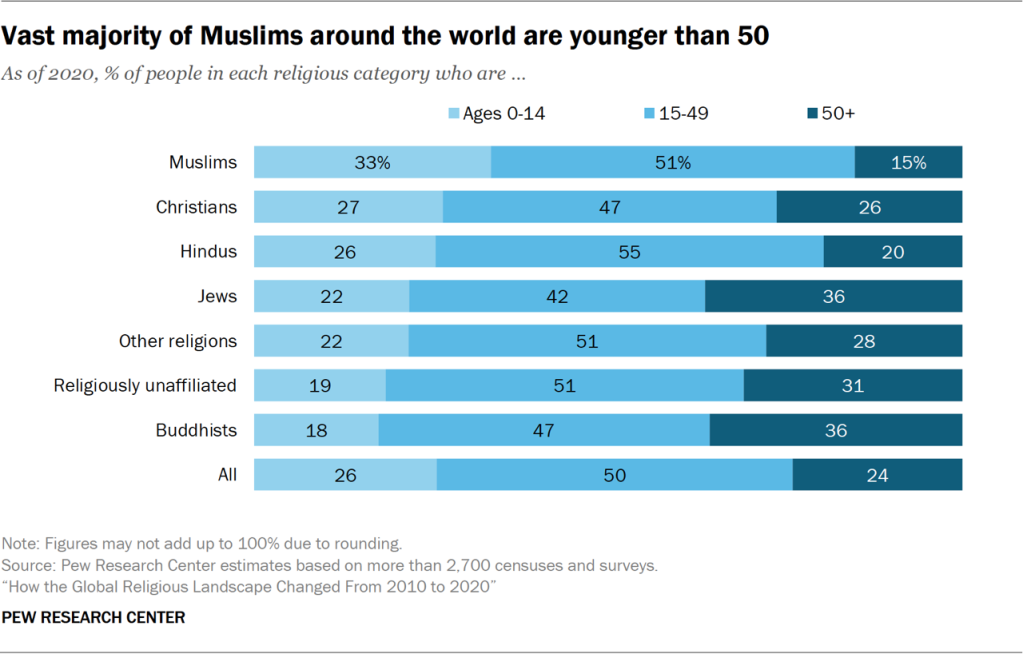
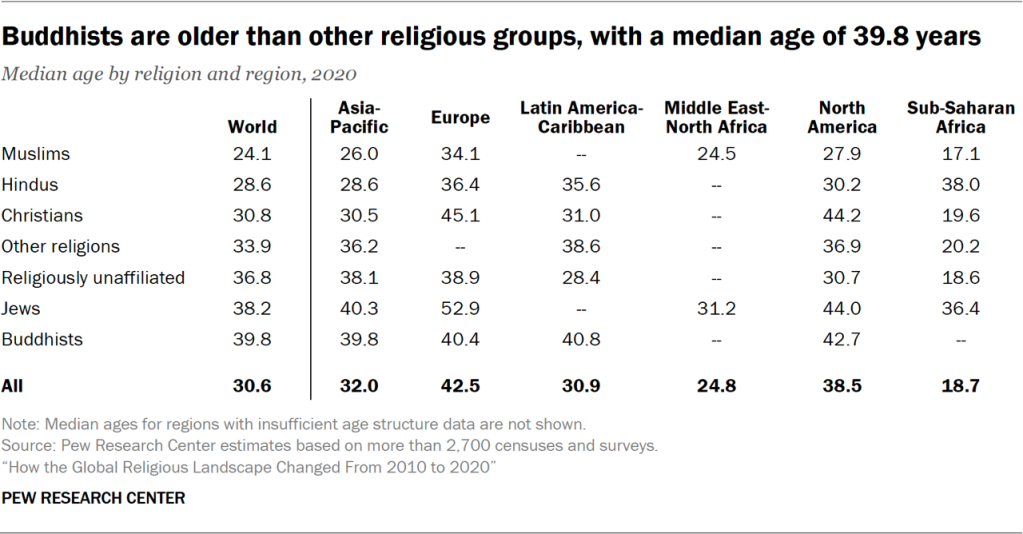
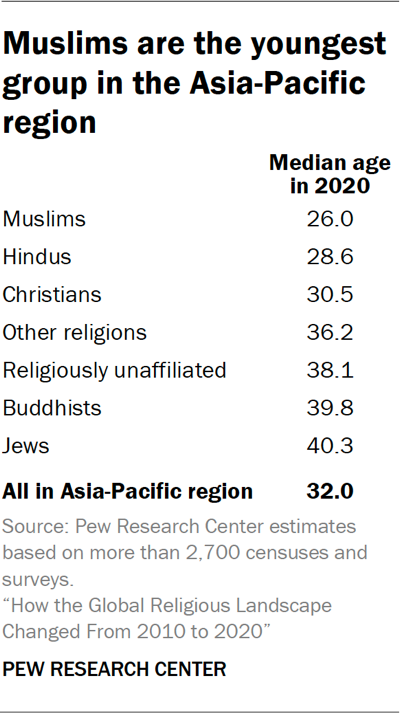
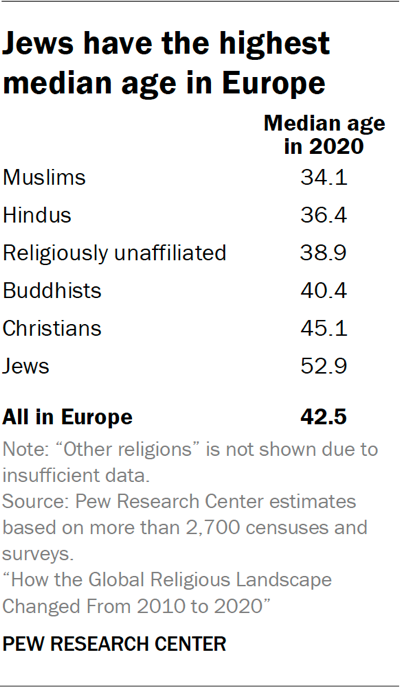
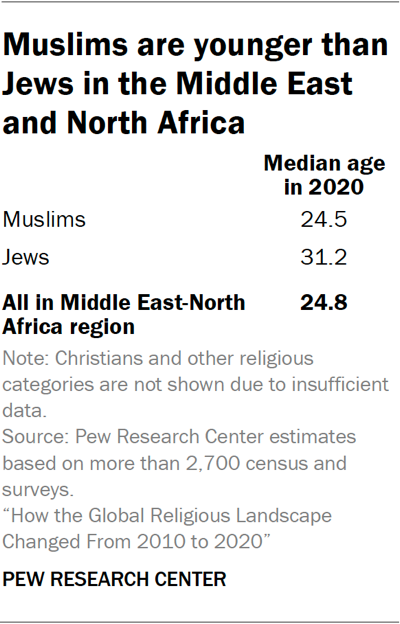
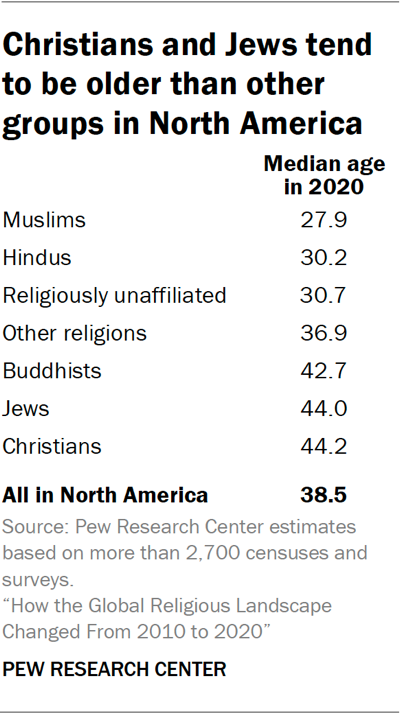
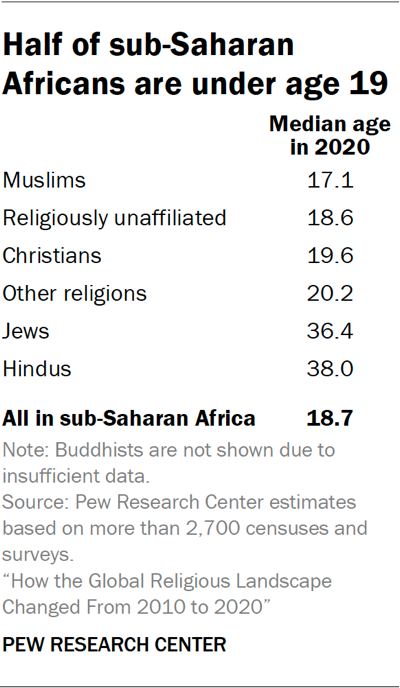
As of 2020, Muslims have the highest proportion of children in their population (33% of all Muslims worldwide are under 15). Jews and Buddhists have the highest proportion of older adults; 36% in each group are ages 50 and older.
Much of the variation in the age structure of religious groups is driven by their geographic concentration. For example, about half of the world’s Jews live in North America and Europe, regions that have relatively old populations.
The youthfulness of Muslims is tied to the fact that nearly four-in-ten of the world’s Muslims live in sub-Saharan Africa and the Middle East-North Africa region – places with relatively young populations.
Christians have a large presence in many regions, from the most youthful (sub-Saharan Africa) to the least (Europe). Among religious groups, Christians have the median age (30.8 years) closest to the world’s overall median age (30.6).
If religious groups are heavily clustered in just one country, their global age structure reflects that country’s characteristics. For instance, the global age distribution of Hindus mirrors the age distribution of India, which is home to 95% of the world’s Hindus. Similarly, the age profile of religiously unaffiliated people resembles that of China, which is home to 67% of all unaffiliated people.
Do people mostly live as religious majorities or minorities?
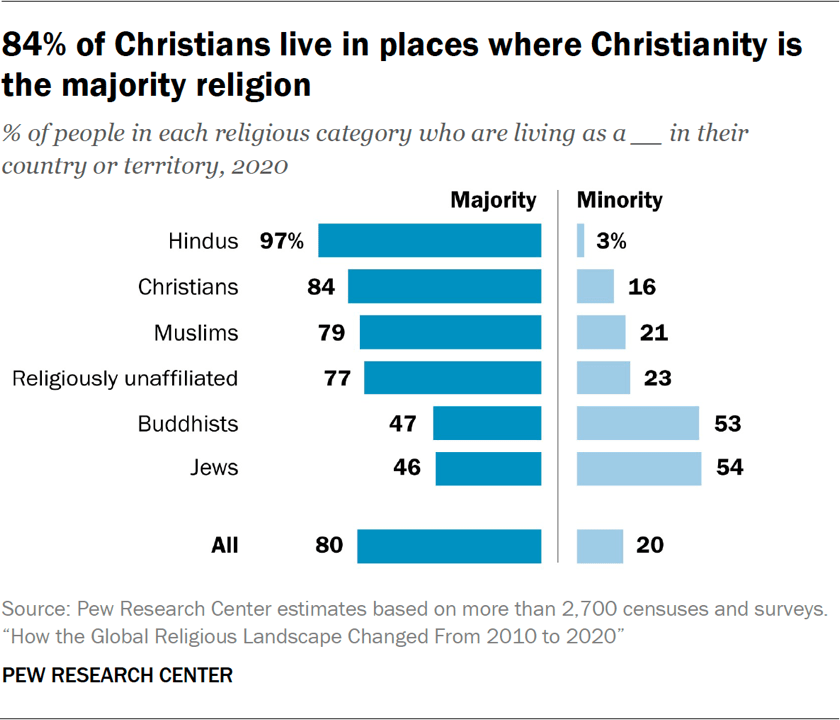
Around the world, 80% of all people live in a place in which most other people share their religious identity. People living as a religious minority in their country make up 20% of the world’s population.
This analysis does not divide the seven major religious categories into subgroups, so Protestants living in Catholic-majority countries or Shiite Muslims living in Sunni-majority countries, for example, are considered to be living in a place where their broader faith is in the majority.
Hindus are most likely to live as a religious majority, with 97% living in the world’s two Hindu-majority countries, India and Nepal. About eight-in-ten Muslims are part of a religious majority, as are similar shares of Christians and religiously unaffiliated people. Slightly fewer than half of all Buddhists and Jews live as a majority.
The world’s seven Buddhist-majority countries (Cambodia; Thailand; Myanmar, also known as Burma; Bhutan; Sri Lanka; Laos; and Mongolia) are home to 47% of all Buddhists. Israel, the sole Jewish-majority country, is home to 46% of all Jews. Taiwan is the only place where members of other religions are in the majority, and 7% of all people in the “other religion” category, worldwide, live in Taiwan. (Many Taiwanese people practice Daoism and traditional folk religions. Read more about Taiwan’s religious beliefs and practices in our report “Religion and Spirituality in East Asian Societies.”)
Revising previous estimates
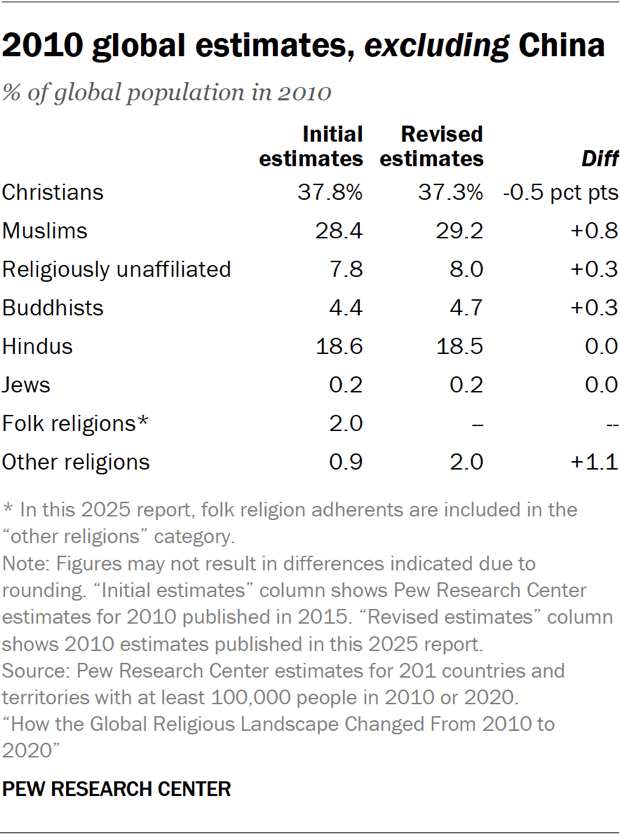
The 2010 estimates in this report differ from what we have published in the past. We adjusted our data sources and methods to make our estimates for 2010 and 2020 as reliable and comparable as possible.
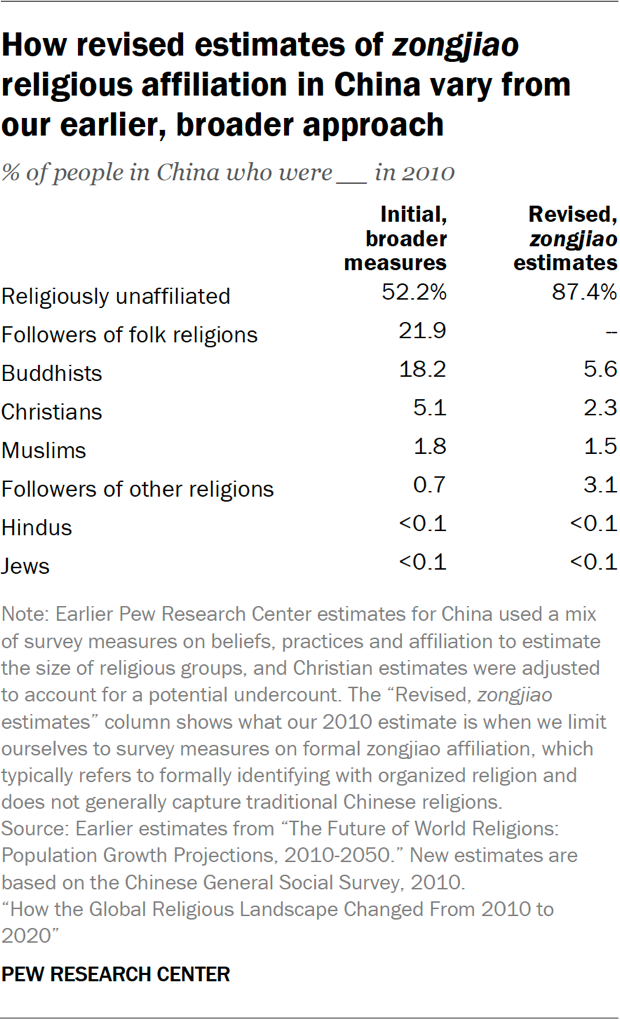
Most consequentially, we changed how we measure China’s religious composition. In the past, we used custom estimates for China to adjust for the fact that surveys in China often do not fully capture people’s religious identity. This report relies on measures of zongjiao religious identity, as these are the most comparable with what we use in every other country, as well as the most readily comparable over time in China. (The measure of formal zongjiao religious identity commonly used in Chinese surveys excludes people who engage in religious or spiritual beliefs and practices but do not consider themselves affiliated with any religion.)
According to our new approach, 10% of China’s population identified with a religion in 2020, the lowest share of any country in the study. Since China has such a large population, this new approach has increased our estimate of the religiously unaffiliated share of the world’s population.
On a global level, religious groups expand and shrink due to a mix of factors.
Demographic factors, such as age structure, fertility and mortality (or life expectancy), tell us whether people in various religious categories are generally young and bearing many children, or whether they are older and likely past their prime childbearing years. Younger groups with relatively high fertility and longer life expectancies have a demographic advantage because of their greater potential for “natural increase.”
Another factor that causes groups to change in size is religious “switching” – people moving into and out of religious groups, including people who choose to switch out of religion altogether.12
The changes in religious composition that happened between 2010 and 2020 resulted from a combination of these factors. The importance of each factor varies by religion:
Christians are shrinking as a share of the global population due to widespread switching out of religion. This “religious disaffiliation” among Christians overrides their demographic advantage (high fertility).
Conversely, the growth of the religiously unaffiliated is the result of large numbers of people – mostly Christians – switching into the ranks of the unaffiliated (overcoming that population’s demographic disadvantages of an older age structure and relatively low fertility).
Muslim population growth is largely driven by Muslims’ relatively young age structure and high fertility rate.
Hindus remain a stable share of the world’s population because their fertility resembles the global average, and surveys indicate that Hindus rarely switch out of their religion.
Buddhists are declining not only due to their demographic disadvantages (such as older age structure and low fertility), but also because many people who were raised Buddhist are switching out of the group.
Jews lag behind global population growth – despite having fertility rates on par with the global average – due to their older age structure.
In addition to the demographic dynamics that affect religious change globally, migration is a large source of religious change within a few regions and countries. (Migration does not affect the size of religious groups at the global level.)
Age structure and fertility
All else being equal, a younger population has a demographic “advantage” for growth. That’s because a young population has a relatively large percentage of women who are in – or soon will enter – their childbearing years, and a relatively small percentage of older adults nearing the end of their lives.
The effect of a group’s age structure may be amplified or muted by its fertility rate. To understand religious change since 2010, it helps to look at where each of these indicators stood at the start of the decade.
Age structure
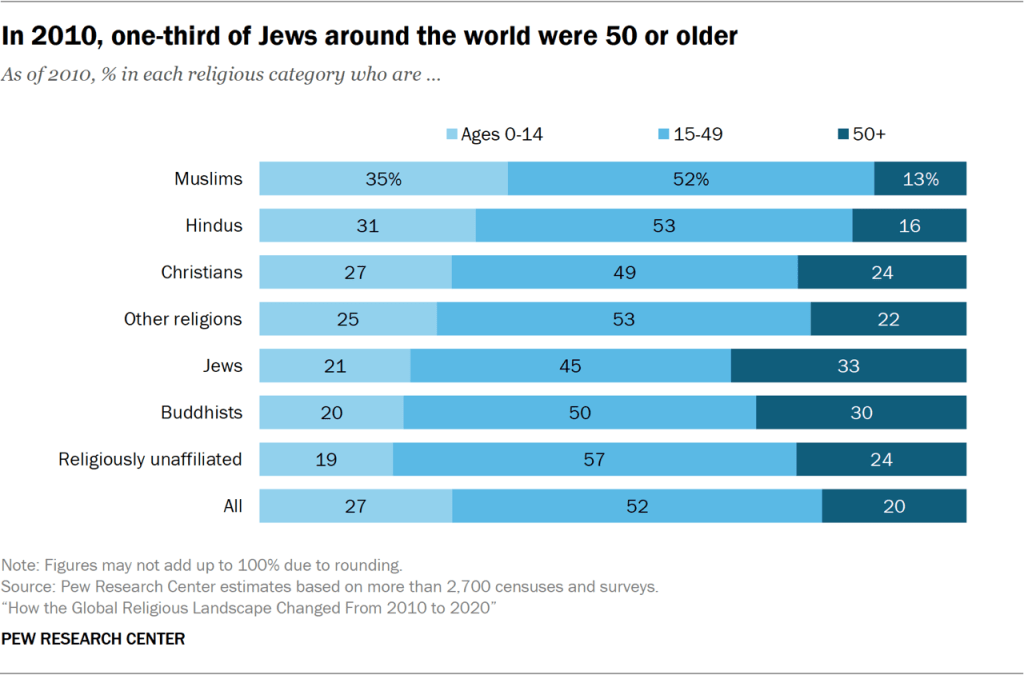
In 2010, Muslims had a relatively advantageous age structure, while Jews, Buddhists and the religiously unaffiliated were at a demographic disadvantage. (Hindus are relatively young, but they are concentrated in countries with relatively low life expectancy.)
Muslims had the highest proportion of children in 2010 (35% of the world’s Muslims were under the age of 15), followed by Hindus (31%).
Jews had the highest proportion of older adults (33% of the world’s Jews were 50 or older in 2010), followed by Buddhists (30%).
The religiously unaffiliated had the smallest share of people under 15 (19%) while Muslims had the smallest share of adults ages 50 and older (13%).
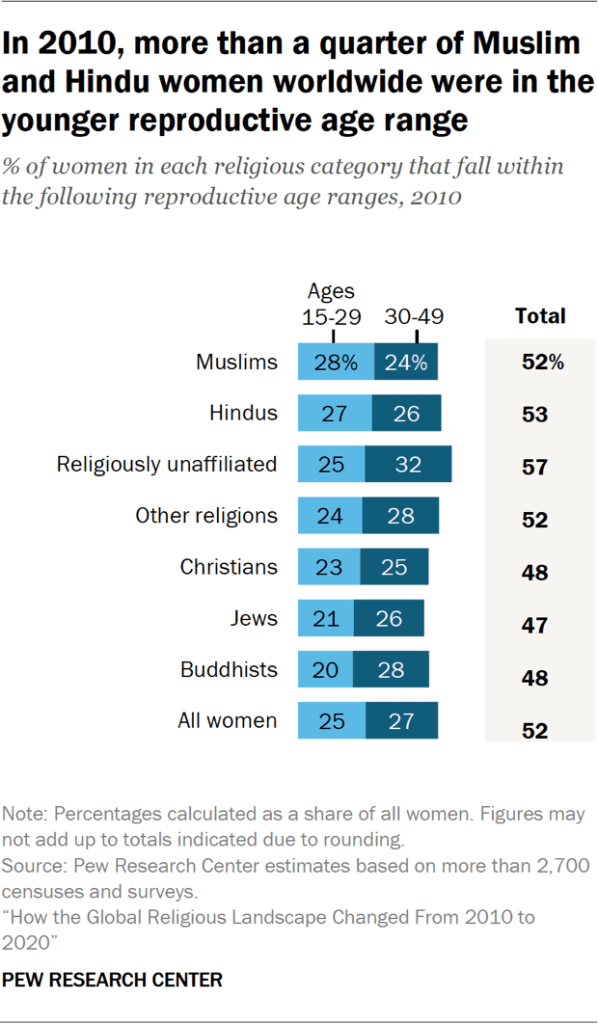
In most religious groups, about half of all women are in the broad reproductive age range of 15 to 49. But there is substantial variation in the share of women in the younger reproductive age range of 15 to 29.13
In 2010, Muslims had a relatively large share of women in these younger reproductive years, followed by Hindus. On the other hand, Buddhists and Jews had smaller shares of women between the ages of 15 and 29.
Fertility
When religion is transmitted from mother to child, and child mortality rates are low, groups with higher fertility rates will generally grow faster. (In this report, we focus on the total fertility rate, i.e., the average number of children a woman is expected to have in her lifetime.)14
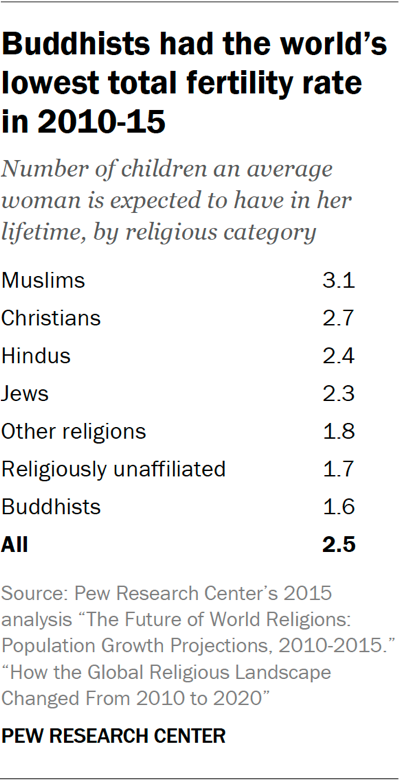
Muslims were estimated to have the highest total fertility rate, with an average of 3.1 children per woman in the 2010-15 period, according to a previous Pew Research Center study. Christians followed with 2.7 children.
Buddhists (1.6 children per woman), religiously unaffiliated people (1.7) and members of other religions (1.8) had the lowest fertility rates.
In the absence of change from migration, a group typically must have a total fertility rate of at least 2.1 (“replacement level”) to maintain its size. However, it can take considerable time for below-replacement-level fertility rates to lead to population decline. For example, fertility rates in China dropped below the replacement level in the early 1990s, but China’s population did not begin to shrink until three decades later.
Religious ‘switching’
If demographic factors were the only drivers of change, young groups with high fertility would usually grow more quickly than groups that are older and have fewer children. As of 2010, Christians around the world were younger and had more children, on average, than religiously unaffiliated people.
But demographic factors can be amplified or offset by another mechanism: religious “switching” (i.e., people leaving one religion and joining another, or leaving religion altogether). Religious switching explains why Christian populations shrank between 2010 and 2020, while religiously unaffiliated populations grew. Christians have a high fertility rate, but they have been losing adherents as people switch out of Christianity to become religiously unaffiliated.
What is religious ‘switching’?
Throughout this report, religious switching refers to a change between the religious group in which a person says they were raised (during their childhood) and their religious identity now (in adulthood).
We use the term “switching” rather than “conversion” because many people who switch identities leave religion to become religiously unaffiliated.
We count changes between seven large religious categories (such as from Buddhist to Christian, or from Hindu to religiously unaffiliated) but not switching within the same category (such as from Protestant to Catholic).
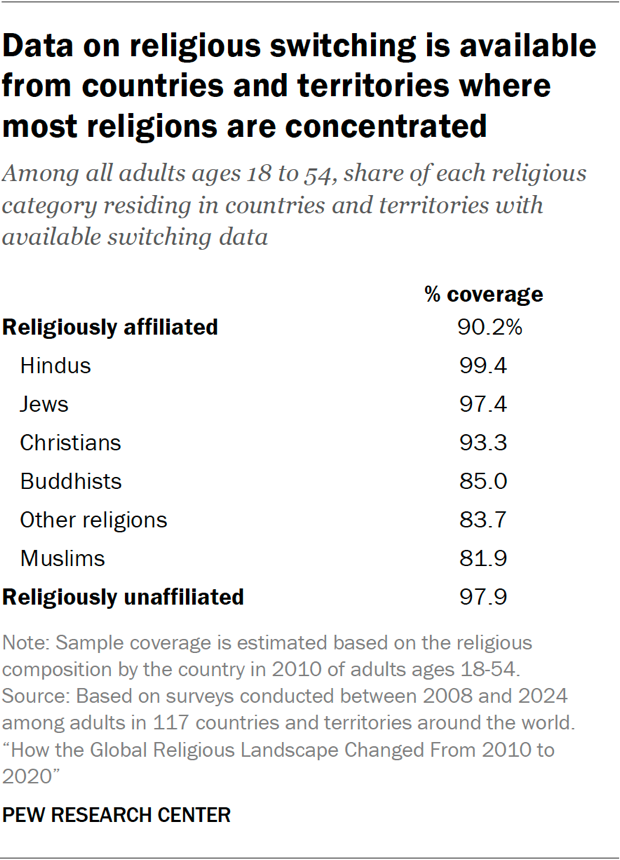
Pew Research Center previously has analyzed religious switching rates at the country level, within 102 countries and territories. In the current report, we conducted a new analysis to understand how switching within countries impacted the size of religious groups on a global level.15
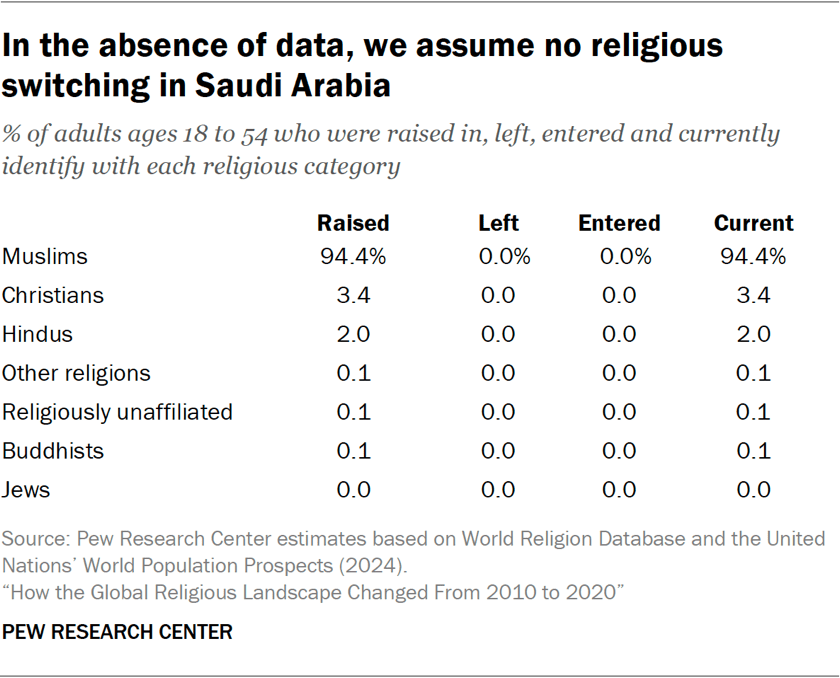
For this analysis, we aggregated rates of religious switching from 117 countries and territories that cover 92% of the 2010 global population.16 For the remaining 8%, or 84 countries and territories (with population sizes above 100,000 in either 2010 or 2020), we assume that no switching took place because we have no data measuring religious switching in this slice of the world.
Research on religious switching generally finds that if people move away from their childhood religion, they tend to do so by the end of their young adult years. For example, in the American Enterprise Institute’s American National Family Life Survey, 75% of respondents ages 65 and older who had left their childhood religion reported that they had done so by the time they were 30.
To capture recent religious switching and exclude more of the switching that happened during the last century, this analysis focuses on the experiences of survey respondents ages 18 to 54.
The surveys we analyze do not allow us to isolate the religious switching that took place exclusively between 2010 and 2020. Rather, they provide an overview of switching patterns that have shifted religious landscapes in recent decades.
(Read the Methodology for more on our data and methods used to compute rates of religious switching.)17
This analysis focuses on quantifying how common switching in and out is for each religious category. We find that, globally:
The religiously unaffiliated population has experienced the most growth from religious switching. On average, for every 100 people ages 18 to 54 who were raised with no religion, 7.5 people have left and 24.2 have joined the ranks of the unaffiliated, resulting in a net gain of 16.7 people.
Christians and Buddhists have experienced the greatest overall losses due to religious switching. For every 100 adults in the 18- to 54-year-old age range who were raised Christian, there was a net loss of 11.6 people (17.1 left and 5.5 joined). Buddhists have lost 9.8 people for every 100 raised Buddhist (22.1 left and 12.3 joined).
Muslims and Hindus have been the least likely to gain or lose adherents from religious switching. About one in every 100 adults raised Muslim (or Hindu) has left their childhood religion, and a similar number from a different religious category have switched into Islam (or Hinduism).18
Since Jewish populations are relatively small in most countries, survey data measuring Jewish switching patterns typically comes from a small number of respondents. However, we do have sufficient data to measure movement into and out of Judaism in Israel and the U.S. In our 2024 Israel survey, rates both of entering and of leaving Judaism were very low. In the U.S. Religious Landscape Studies we conducted in 2014 and in 2023-24, leaving Judaism was slightly more common than joining the religion, though the difference was within the margins of error.
An additional complication is that many people who cease to identify religiously as Jewish may continue to identify as Jewish in some other way, such as culturally, ethnically, or by family background. In our analyses of religious switching, we use the term “Jewish” to refer only to religious identity, because the survey questions ask about a person’s current religion and what religious group they were raised in (their childhood religion).
The “other religions” category also makes up a small share of respondents in most countries. Due to concerns about the small sample sizes for Jews and members of other religions in many surveys, global rates of switching for these groups are not shown in this report. For more details, read the Methodology.
Mortality (life expectancy)
There can be more growth in a population if death rates decline and people gradually live longer lives. We can describe mortality patterns with statistics about the number of deaths experienced for every 1,000 people in various age groups over a given period. However, it is often simpler to consider what these death rates suggest about the expected longevity of human life.
Life expectancy at birth – an approximate estimate of the expected lifespan of an average newborn child – is a convenient snapshot of the mortality rates at a moment in time.19 If all other factors were equal, groups with higher life expectancies in 2010 would live longer and have larger populations by 2020.
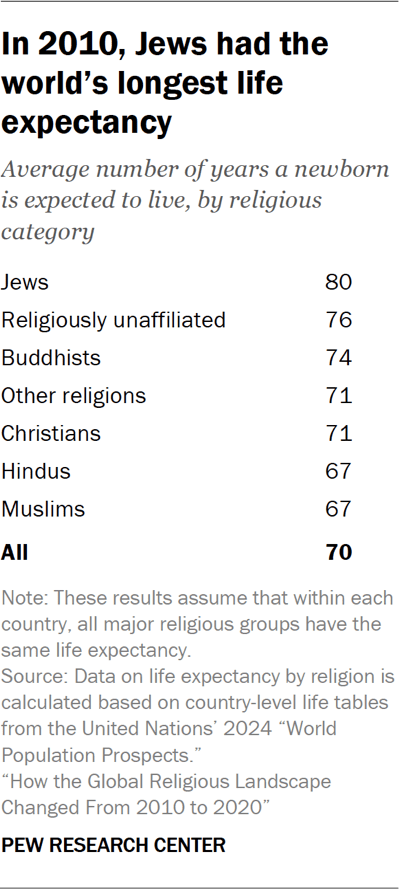
Among all religious groups, Jews were concentrated in countries with the highest life expectancy at birth in 2010, with an estimated global average of 80 years, followed by the religiously unaffiliated (76) and Buddhists (74). Hindus and Muslims were concentrated in countries with the lowest life expectancy, 67 years for each, well below the global average of 70 years.
How we approximate life expectancy by religion
Because no global data is available on how life expectancy varies by religion within countries, we estimate global life expectancy for each religious group by assuming that people in all religious groups have the average life expectancy of the country in which they live.
Therefore, global differences between religious groups reflect their differences in geographic concentration patterns. For instance, the high life expectancy among Jews reflects the fact that the vast majority of the world’s Jews live in either the United States or Israel, where life expectancy for 2010 was well above the global average, at 79 and 82 years, respectively.
Migration cannot change the size of global religious populations, but it is a primary driver of change in the size of some religious groups in certain parts of the world. Migration contributes especially to the growth of non-Muslims in the Gulf Cooperation Council (GCC) countries and the growth of Muslims in North America and Europe.
Between 2010 and 2020, the number of people living outside their country of birth rose by more than 50 million (about the size of Italy’s total population), according to the United Nations’ migrant stock estimates. In addition to the ongoing movement of people to wealthy nations in search of economic opportunities, much of the surge in migrants during this period can be attributed to Syrians fleeing civil war (about 7.5 million) and Venezuelans fleeing economic and political instability (roughly 5 million).
Generally, migration has a limited impact on a country’s religious makeup because migrants often constitute a small fraction of a society’s total population, and migrants often move to countries where their religious identity is already prevalent. For instance, the vast majority of Syrian refugees arriving in Turkey over the past decade are Muslims, and Venezuelans moving to the nearby countries of Colombia, Peru and Ecuador are predominantly Christians. In these places, the surge of migrants itself was not the cause of much religious change between 2010 and 2020.
Still, migration did affect the religious mix in some places between 2010 and 2020. For example, in Lebanon, which was 62% Muslim in 2010, the large influx of Syrian refugees contributed to a 5 percentage point increase in the share of Lebanon’s population that was Muslim in 2020.
Among the GCC countries, Oman experienced a large increase in the share of its population that is not Muslim. Non-Muslims – mostly Christians and Hindus – now comprise 19% of Oman’s population (up 8 points), as of 2020. In Kuwait, the United Arab Emirates and Saudi Arabia, the share of non-Muslims rose by 2 points each.
The six GCC countries (Bahrain, Kuwait, Oman, Qatar, Saudi Arabia and the United Arab Emirates) have some of the world’s largest shares of foreign-born residents. And unlike native-born GCC residents (who almost always identify as Muslim), about a quarter of migrants living in GCC countries (who mostly originate from South Asia) are estimated to be Christians and Hindus, according to Pew Research Center’s 2024 study of the religious composition of the world’s migrants.
Europe’s Muslim population growth since 2010 also has been driven largely by migration. In 2020, Muslims made up 6% of Europe’s population, up about 1 point from 2010. Growth was concentrated in Sweden, Austria and Germany, which took in large numbers of Syrian war refugees. The region’s total Muslim count increased by 6.2 million during the decade, including an estimated 3.5 million Muslims who were born outside Europe. Nearly 1 million came from Syria.
Migration accounted for a large portion of the increase in North America’s Muslim population, which grew to make up 1.6% of the region’s residents in 2020 (up 0.4 points). Muslim migrants to North America came primarily from South Asia and the Middle East-North Africa region. Migration also fueled the growth of Hindus in North America, whose share increased to 1.0% (up 0.3 points).
Christians are the world’s largest religious group, and they are a majority in every region except the Asia-Pacific and Middle East-North Africa regions. But they are shrinking as a share of the global population, as large numbers of Christians around the world “switch” out of religion to become religiously unaffiliated. Sub-Saharan Africa has surpassed Europe as the region with the largest number of Christians.
Global change
The number of Christians worldwide grew by 6%, from 2.1 billion in 2010 to 2.3 billion in 2020, while non-Christians grew by 15%. As a result, Christians shrank as a percentage of the global population, with their share falling from 31% to 29%.
Regional change
Christian population change varied widely by region between 2010 and 2020.
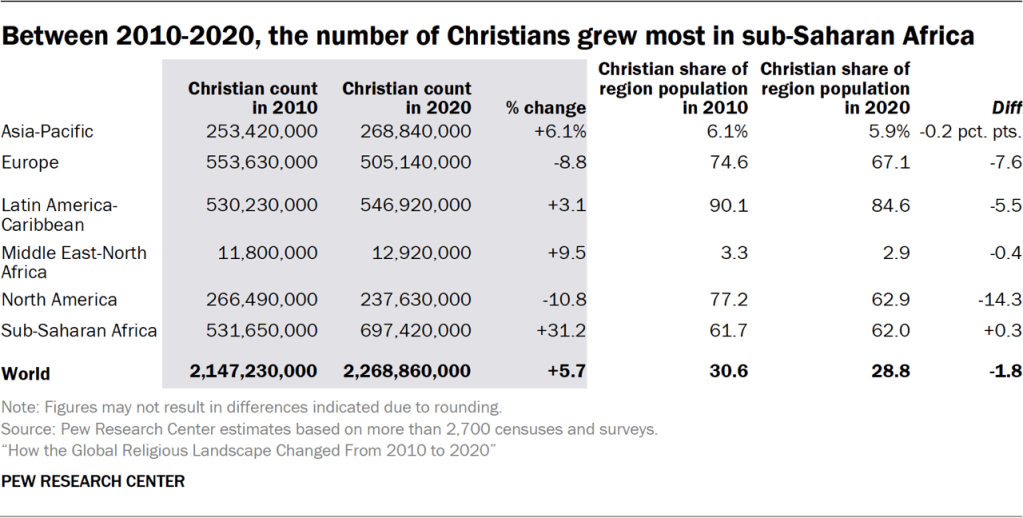
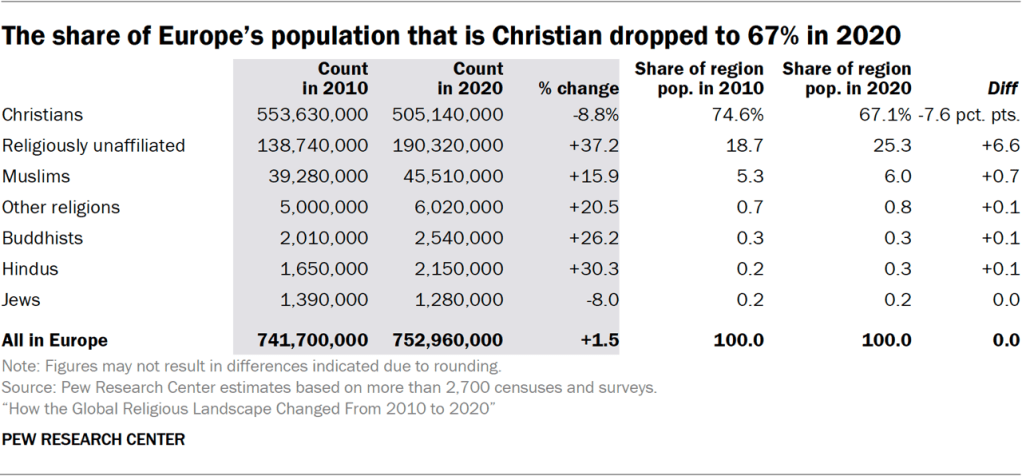
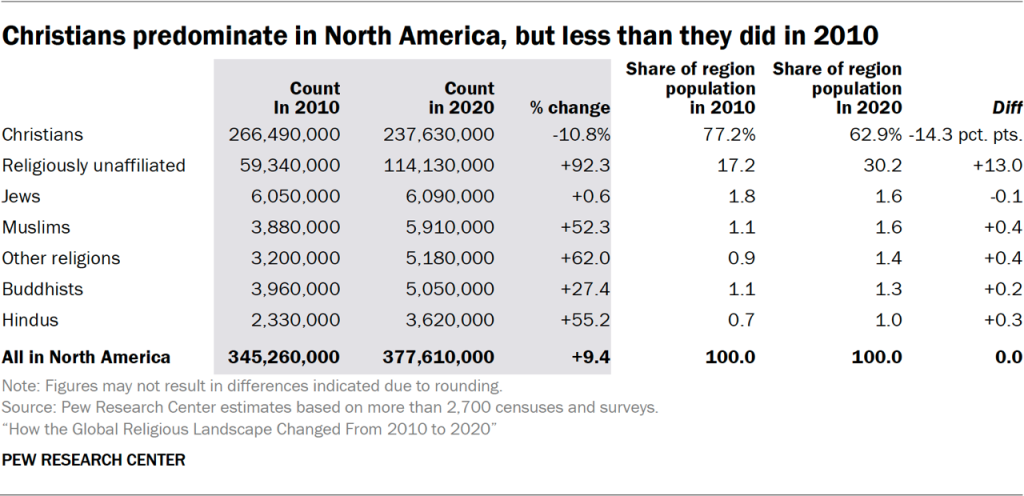
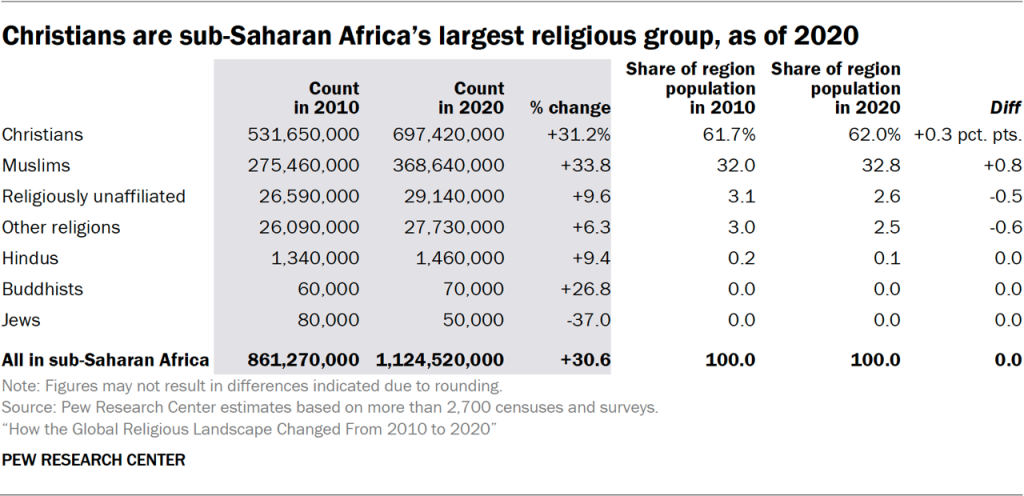
The number (or count) of Christians fell in two regions. In Europe, Christians declined to 505 million (down 9%). In North America, they shrank to 238 million (down 11%). In every other region, the number of Christians grew. The count increased most in sub-Saharan Africa, to 697 million (up 31%).
The percentage of residents who are Christian fell in five regions and rose only in sub-Saharan Africa. Percentages dropped most in the regions that had large Christian populations to begin with.
In North America, Christians now make up 63% of the population (down 14 percentage points), while in Europe they make up 67% (down 8 points). In the Latin America-Caribbean region, Christians make up 85% of the population (down 5 points).
Christians made up less than 10% of the total population in both the Asia-Pacific and the Middle East-North Africa regions in 2010; that share has since dropped by less than 1 point in each region.
Sub-Saharan Africa was the only region where Christians expanded as a share of the population, though they grew by less than 1 point, to 62% in 2020.
Regional distribution of Christians
Over the past century, the world’s Christian population has become increasingly concentrated in sub-Saharan Africa.
Between 2010 and 2020, sub-Saharan Africa surpassed Europe as the region with the largest Christian population. As of 2020, sub-Saharan Africa was home to 31% of all the Christians in the world (up 6 points since 2010), while Europe held 22% of the global Christian population (down 4 points).
Many Christians also live in the Latin America-Caribbean region (24% of all Christians, down 1 point from 2010 to 2020) and North America (10%, down 2 points).
Countries with the highest Christian counts
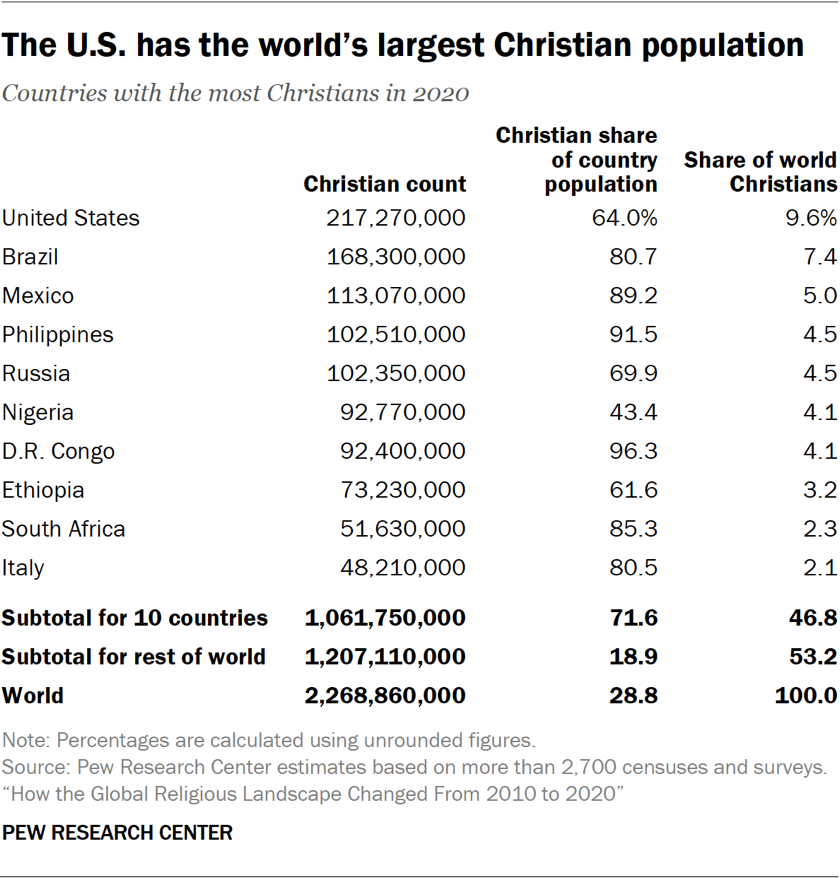
The United States has more Christian residents than any other country. About one-tenth of the world’s total Christian population lives in the U.S., where an estimated 64% of people (of all ages) were Christian in 2020.
The 10 countries with the largest numbers of Christians are home to a combined 1.1 billion, or 47% of the world’s Christians.
While media stories in the 2010s often suggested that China was on the cusp of having the largest Christian population in the world, surveys indicate that China’s Christian population remains outside the 10 largest in the world. Based on religious self-identification measured in surveys, we estimate there were roughly 25 million Chinese Christians in 2020. For an in-depth analysis of Christianity in China, refer to the Christianity chapter of our 2023 report “Measuring Religion in China.”
Where did the Christian share of the population change the most?
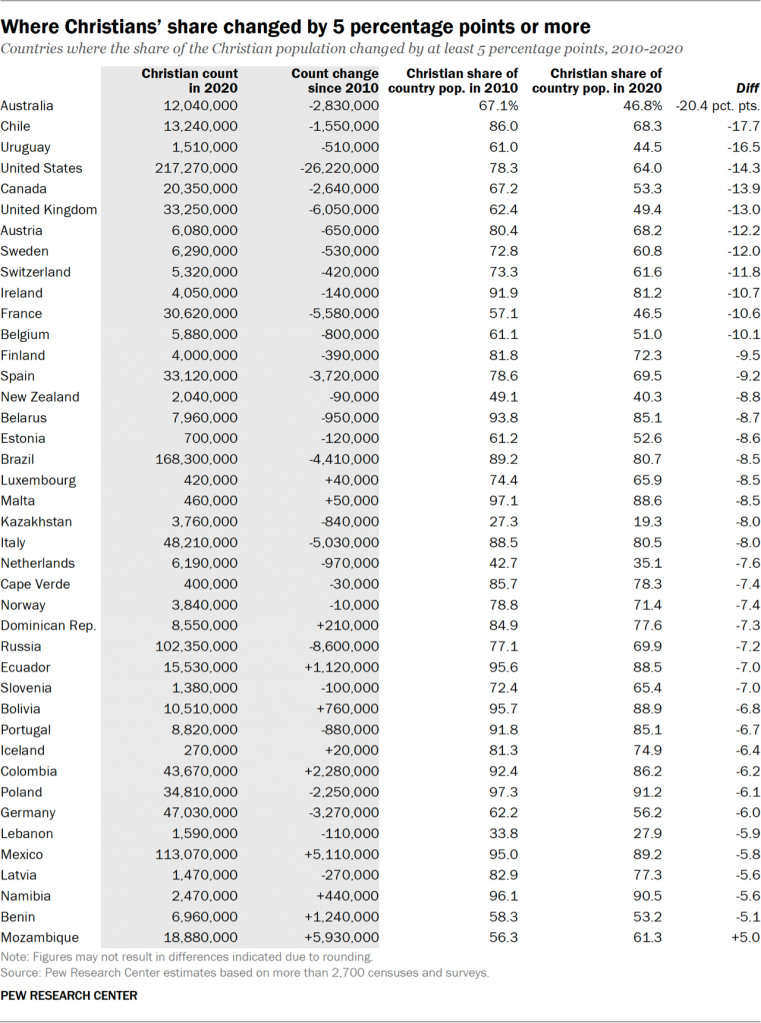
In 41 countries, the share of the population identifying as Christian changed substantially (by at least 5 percentage points). In all but one of these countries – Mozambique – the Christian population share declined.
How is ‘substantial change’ defined?
This section highlights countries that experienced substantial change in the size of their religious populations between 2010 and 2020. We focus on cases where a religious group’s share of a country’s population grew or shrank by at least 5 percentage points. We set that threshold because wide variations in data sources make it difficult to test the statistical significance of differences in population estimates in 2010 and 2020. Refer to the Methodology for details.
Countries where the share of Christians fell are scattered throughout every region of the world, but many are in Europe and other Western or English-speaking places where Christian majorities have been shrinking for decades. This change is largely driven by high rates of Christian disaffiliation – i.e., by people becoming religiously unaffiliated as adults after having been raised as Christians in childhood.
The largest drop in the Christian share of a country’s population occurred in Australia (down 20 points), where Christians made up a little less than half of the population in 2020.
Christians also declined steeply in Chile and Uruguay (down 18 points and 16 points, respectively).
Christians in the U.S. and Canada declined at similar rates (down 14 points in each place).
The only country where Christians increased substantially was Mozambique (up 5 points), and they accounted for 61% of the country’s population in 2020. A governmental anti-religious campaign in Mozambique officially ended in the 1980s, and the share of Christians in that country has been increasing since.
3. Muslim population change
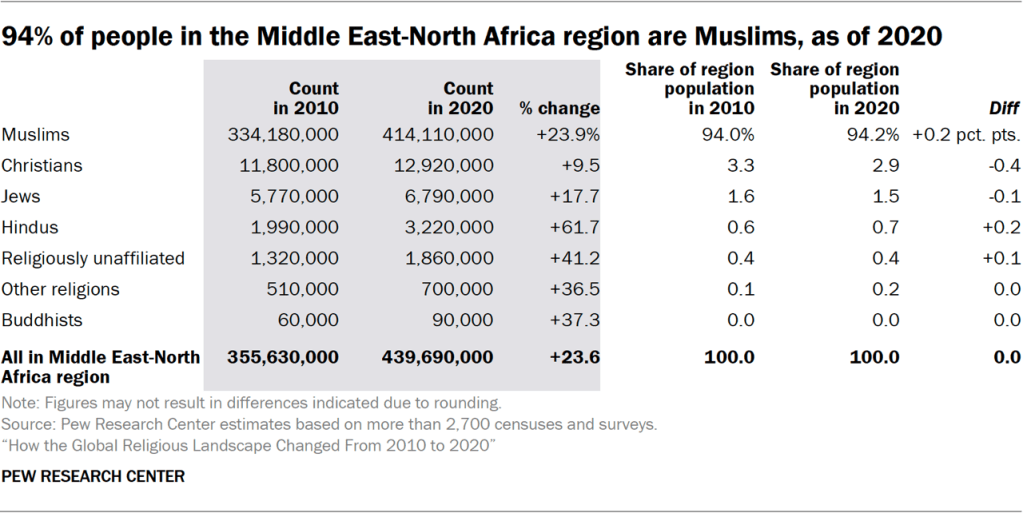
Muslims are the world’s second-largest religious group and the fastest-growing major religion. They make up the vast majority of the population in the Middle East-North Africa region. In all other regions, Muslims are a religious minority, including in the Asia-Pacific region, which is home to the greatest number of Muslims.
Global change
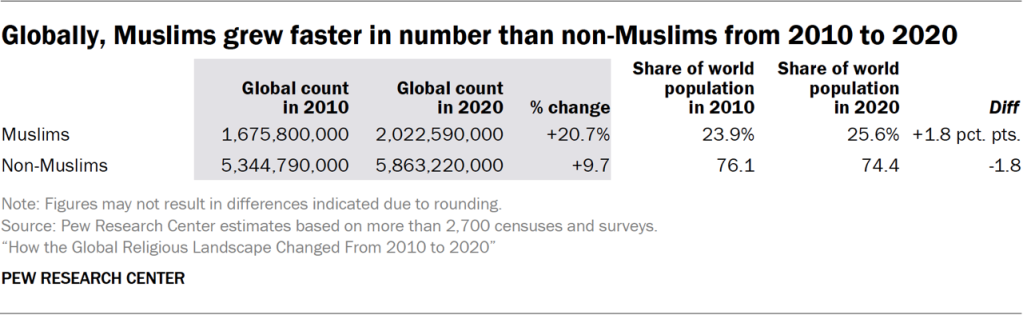
The number of Muslims around the world grew 21% between 2010 and 2020, from 1.7 billion to 2.0 billion. Muslims grew twice as fast as the rest of the world’s population, which expanded by 10% during the same decade. As a result, Muslims grew as a share of the global population, from 24% to 26%.
Regional change
The number (or count) of Muslims grew in all geographic regions between 2010 and 2020, but the extent of the increase varied widely.
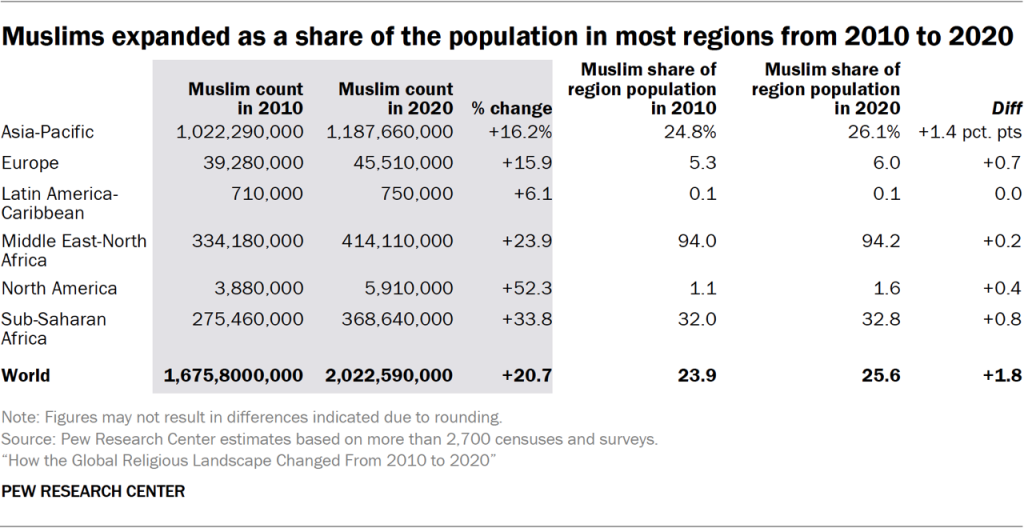
The rate of Muslim growth was the highest in North America, where Muslims numbered 5.9 million in 2020 (up 52%), followed by sub-Saharan Africa, where Muslims grew to 369 million (up 34%).
In every region, Muslims grew at a faster rate than the non-Muslim population, with one exception. In the Latin America-Caribbean region, which has the smallest Muslim population, the number of Muslims increased by 6%, while the region’s non-Muslim population grew by 10%.
As a result, the percentage of Muslims rose in all regions outside of Latin America and the Caribbean. The Muslim share of the population increased the most in the Asia-Pacific region, where Muslims rose to 26% of the population in 2020 (up 1.4 percentage points). Meanwhile, Muslims grew to make up 33% of all residents in sub-Saharan Africa (up 0.8 points) and 6% of Europe’s population (up 0.7 points).
Regional distribution of Muslims
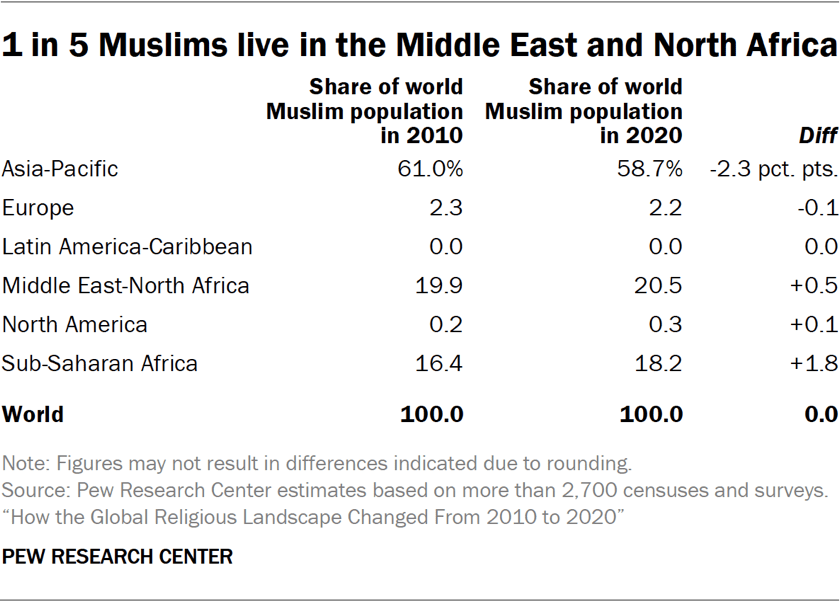
Since 2010, the world’s Muslim population has become slightly more concentrated in sub-Saharan Africa, which is now home to 18% of the world’s Muslims (up 2 points).
Muslims have become slightly less concentrated in the Asia- Pacific region, which is home to 59% of all Muslims as of 2020 (down 2 points).
Countries with the highest Muslim counts
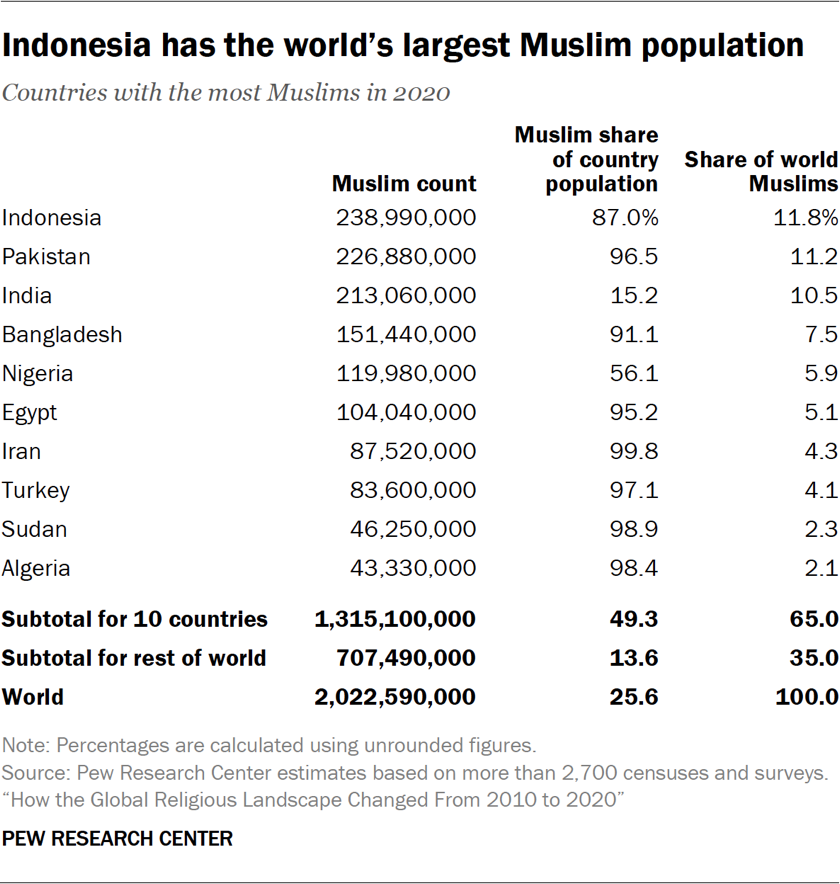
A third of Muslims live in Indonesia, Pakistan or India. Indonesia’s count is slightly ahead of the others: Roughly 240 million Muslims – around 12% of the world’s Muslims – are in Indonesia, as of 2020.
The 10 countries with the largest number of Muslims are home to a combined 1.3 billion Muslims, or 65% of the world’s total Muslim population.
In nine of these countries, Islam is the majority religion. India is an exception. The 213 million Muslims living in India as of 2020 make up only 15% of the country’s overall population.
Where did the Muslim share of the population change the most?
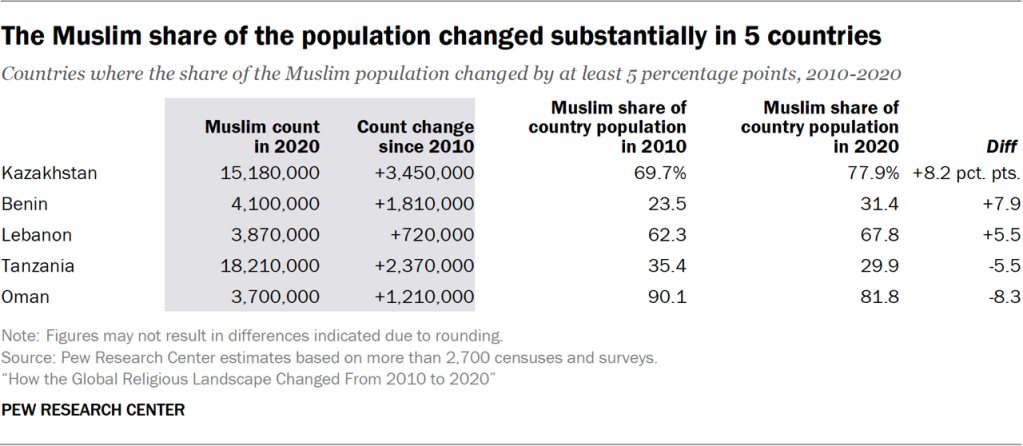
In five countries, the estimated share of the population identifying as Muslim changed substantially (by at least 5 percentage points). In Kazakhstan, Benin and Lebanon, the Muslim share of the population increased, while in Tanzania and Oman, the share of Muslims decreased.
How is ‘substantial change’ defined?
This section highlights countries that experienced substantial change in the size of their religious populations between 2010 and 2020. We focus on cases where a religious group’s share of a country’s population grew or shrank by at least 5 percentage points. We set that threshold because wide variations in data sources make it difficult to test the statistical significance of differences in population estimates in 2010 and 2020. Refer to the Methodology for details.
In these countries, changes in the Muslim share of the population were often related to migration.
Kazakhstan experienced the biggest increase in the Muslim share of its population (up 8 points). This change was partially driven by the departure of some Christians, as the share of Christians in Kazakhstan’s population fell from 27% in 2010 to 19% in 2020. (Kazakhstan is a Muslim-majority country that tightly restricts religious activity.)
We estimate that Benin also had an increase in the Muslim share of its population (up 8 points). However, some data sources suggest Muslim growth there could be more modest.20
Lebanon also saw a substantial rise in the share of its population that is Muslim (up 5 points), fueled by refugees fleeing the Syrian civil war.21
Oman experienced the largest drop in the share of Muslim residents (down 8 points) because many people migrated to the country, and these migrants were less likely to be Muslim than the native-born population. Between 2010 and 2020, Oman’s foreign-born population rose from 30% to about half of the country’s total inhabitants.22
In Tanzania, Muslims have lower fertility rates than non-Muslims, which contributed to a decline in the share of the country’s population that is Muslim (down 6 percentage points). Between 2010 and 2015, Muslims in Tanzania had an average of 4.6 children per woman, nearly one child fewer than Tanzanian women overall (5.5).
In Europe, several countries saw the Muslim share of their population grow due to a combination of immigration and higher-than-average fertility among Muslims. However, these increases did not pass the 5-point threshold in any European country. For example, the influx of Syrian war refugees contributed to modest growth in the percentage of Muslims in the populations of Sweden (up 4 points), Austria (up 3 points) and Germany (up 1 point).
4. Religiously unaffiliated population change
The religiously unaffiliated population – often called religious “nones” – is the world’s third-largest religious category, after Christians and Muslims. This group includes people who in surveys and censuses answer a religious identity question by saying they do not have any religion or that they are atheist or agnostic.23
Between 2010 and 2020, religiously unaffiliated people grew more than any group except Muslims. The unaffiliated made up a majority of the population in 10 countries and territories in 2020, up from seven a decade earlier.
Many religiously unaffiliated people were raised with a religion but no longer identify with it in adulthood. This pattern is common in European and North American countries, as well as in Australia and New Zealand, where many people who were raised Christian no longer claim any religious affiliation.
What do the religiously unaffiliated believe?
The religiously unaffiliated aren’t necessarily devoid of religious beliefs and practices. Research shows that many people who don’t belong to a religious group may still hold religious or spiritual beliefs and participate in religious or spiritual activities.
In China, where only 10% of people have any religious identity, 21% of religiously unaffiliated adults burn incense to worship deities at least a few times a year, and the same share say they visited a site to pray for good luck at least once in the prior year, according to a previous Pew Research Center analysis of Chinese academic surveys fielded in 2016 and 2018.
Still, in the United States, China and other countries, religiously unaffiliated adults typically engage in religious and spiritual practices at lower rates than religiously affiliated people do.
Global change
Around the world, the number of people who say they have no religious affiliation grew by 17%, from 1.6 billion in 2010 to 1.9 billion in 2020. This outpaced the 11% increase among the religiously affiliated. Therefore, the religiously unaffiliated expanded as a share of the world’s total population, increasing from 23% in 2010 to 24% a decade later.
Regional change
Between 2010 and 2020, the number (or count) of religiously unaffiliated people grew in every region, and they grew faster than the religiously affiliated in every region except for the Asia-Pacific region and sub-Saharan Africa.
In North America, the unaffiliated population nearly doubled in size to 114 million (up 92%) between 2010 and 2020, while their numbers rose to 77 million in Latin America and the Caribbean (up 67%).
Over the same period, the number of people who claim no religious affiliation grew to 1.5 billion in the Asia-Pacific region and to 29 million in sub-Saharan Africa, up about 10% in both regions, slightly lagging behind the religiously affiliated population in these areas.
The percentage of people with no religious affiliation grew the most in North America, where religiously unaffiliated people make up 30% of the population (up 13 points), as of 2020. At the same time, the unaffiliated rose to a quarter of all Europeans (up 7 points) and 12% of residents of Latin America and the Caribbean (up 4 points). The share of the population that is religiously unaffiliated fell slightly in the Asia-Pacific region (down 0.2 points) and sub-Saharan Africa (down 0.5 points). It did not change in the Middle East-North Africa region.
Regional distribution of the religiously unaffiliated
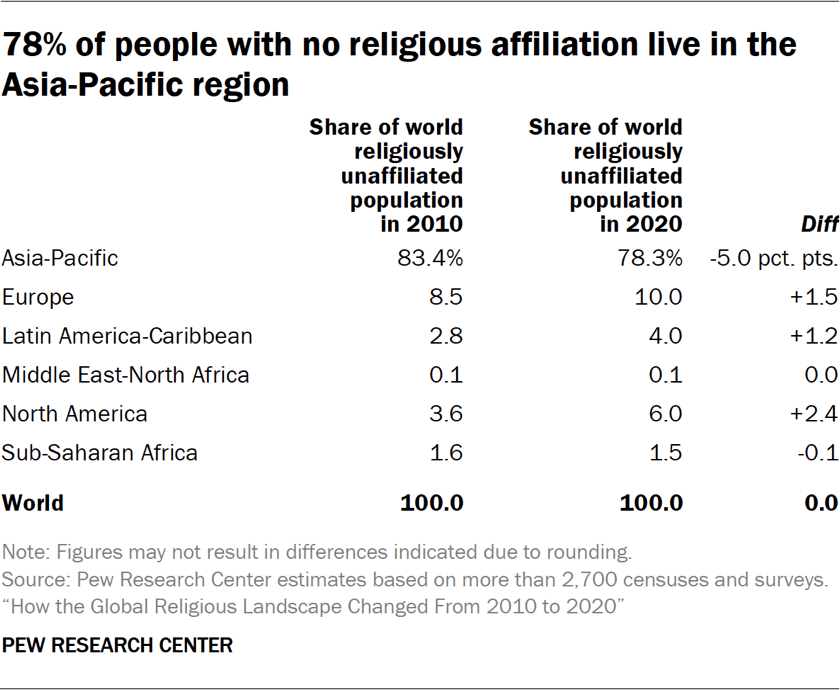
As of 2020, the majority of people with no religious affiliation live in the Asia-Pacific region, mostly in China. (The Chinese government promotes atheism. Read about non-religion in China in our report “Measuring Religion in China.”)
About 78% of all religiously unaffiliated people worldwide reside in the Asia-Pacific region, down from 83% in 2010. This 5-point change was the largest among all regions and the only regional decrease larger than 0.1 point.
Europe now is home to 10% of the world’s “nones,” followed by North America (6%) and the Latin America-Caribbean region (4%).
Countries with the highest religiously unaffiliated counts
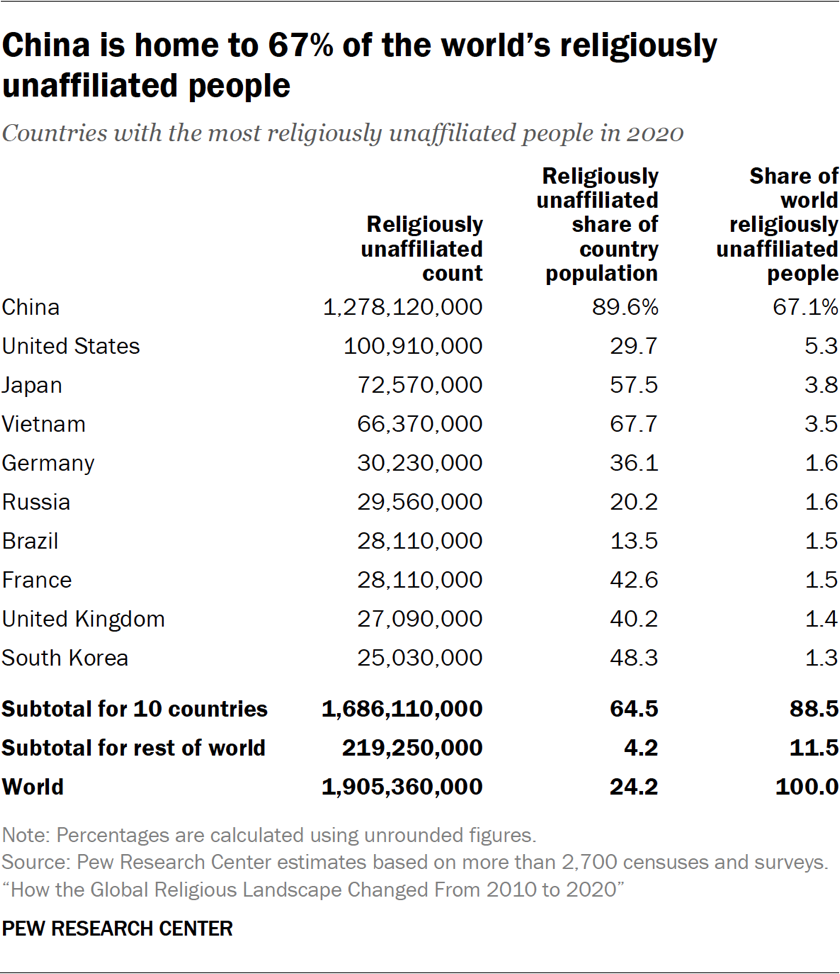
With nearly 1.3 billion religiously unaffiliated residents, China is home to about two-thirds of all the religiously unaffiliated people in the world. (China had the world’s largest total population in 2020, though it has since been surpassed by India.)
The United States has the second-largest unaffiliated population, yet the 101 million unaffiliated people in the U.S. make up only 5% of the global population of people with no religion.
Nearly 90% of all religious “nones” reside in 10 countries.
Where did the unaffiliated share of the population change the most?
The share of the population with no religious affiliation rose substantially (by at least 5 percentage points) in 35 countries. It did not decrease by 5 points or more anywhere in the world.
How is ‘substantial change’ defined?
This section highlights countries that experienced substantial change in the size of their religious populations between 2010 and 2020. We focus on cases where a religious group’s share of a country’s population grew or shrank by at least 5 percentage points. We set that threshold because wide variations in data sources make it difficult to test the statistical significance of differences in population estimates in 2010 and 2020. Refer to the Methodology for details.
Countries that saw substantial increases in their religiously unaffiliated populations are found in every region except the Middle East and North Africa. Most are European nations that once had large Christian majorities and experienced corresponding decreases among Christians between 2010 and 2020. Disaffiliation from Christianity is a widespread, decades-long pattern seen in many places.
The steepest growth occurred in Australia (up 17 points), followed by Chile (up 17 points) and Uruguay (up 16 points).
The religiously unaffiliated population also rose substantially in the U.S. (up 13 points).
Substantial increases gave religiously unaffiliated people majority status in a few countries and territories. Ten places had an unaffiliated majority in 2020, up from seven in 2010. Most people in Uruguay, the Netherlands and New Zealand had no religious affiliation in 2020 – joining China, North Korea, the Czech Republic, Hong Kong, Vietnam, Macao and Japan, which were in this category in 2010.
5. Hindu population change
Hindus are the fourth-largest religious category, after Christians, Muslims and religiously unaffiliated people. The Asia-Pacific region is home to 99% of the global Hindu population, with around 95% of all Hindus living in India. Hindus are the largest religious group in India, Nepal and Mauritius.
Global change
The number of Hindus worldwide grew 12% from 2010 to 2020, rising from a little less than 1.1 billion to nearly 1.2 billion. Since non-Hindus grew at about the same rate, Hindus remained stable as a percentage or share of the global population.
Regional change
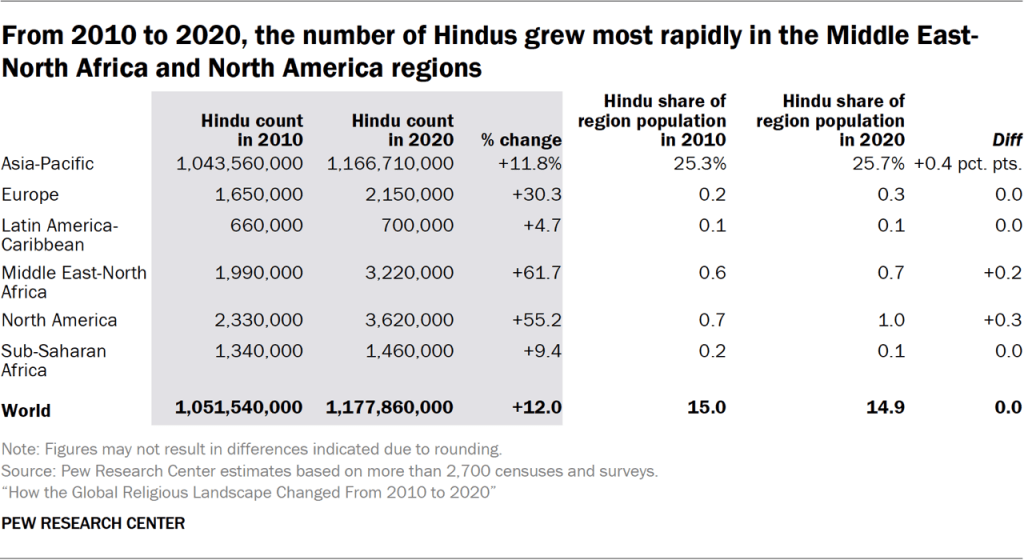
Over the decade from 2010 to 2020, the number (or count) of Hindus grew most quickly in the Middle East-North Africa region, to 3.2 million (up 62%). In North America, the Hindu population rose to 3.6 million (up 55%).
In these regions, Hindus grew at a faster rate than the non-Hindu population, and growth was primarily driven by migrants moving to wealthy countries – such as the United States and the United Arab Emirates – for economic opportunities. Europe also saw a considerable increase, to 2.2 million (up 30%).
As a share of regional populations, Hindus grew modestly in the Asia-Pacific region (up 0.4 points) and in North America (up 0.3 percentage points). Hindus made up roughly one-quarter of the total population of Asia and the Pacific at the end of the decade.
Regional distribution of Hindus
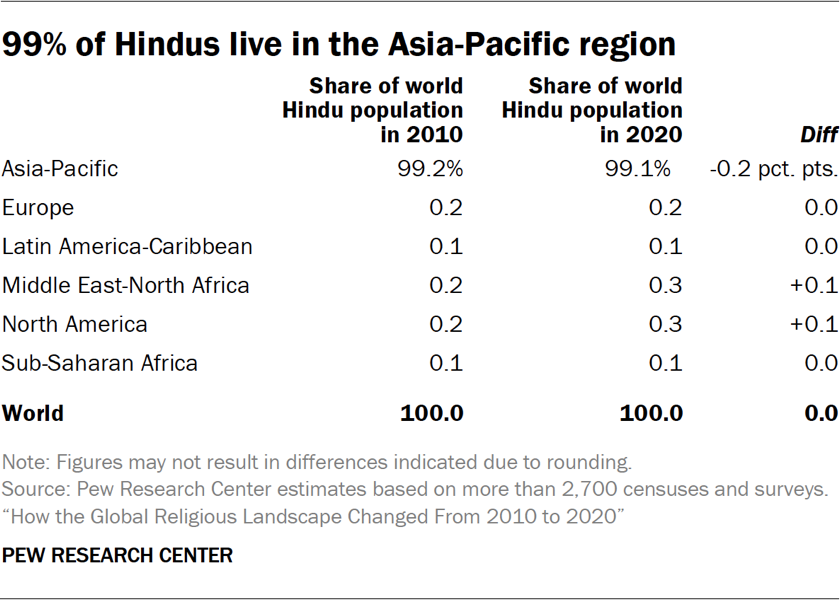
As of 2020, the Asia-Pacific region continues to be home to the vast majority of the world’s Hindus (99%). The remaining Hindus live mostly in North America or the Middle East-North Africa region, where they make up 0.3% in each region.
There was a subtle shift in the geographic concentration of Hindus between 2010 and 2020. The share of the world’s Hindus living in Asia and the Pacific fell slightly (down 0.2 points), while the percentage of Hindus residing in North America and the Middle East-North Africa region inched up, each by 0.1 point.
Countries with the highest Hindu counts
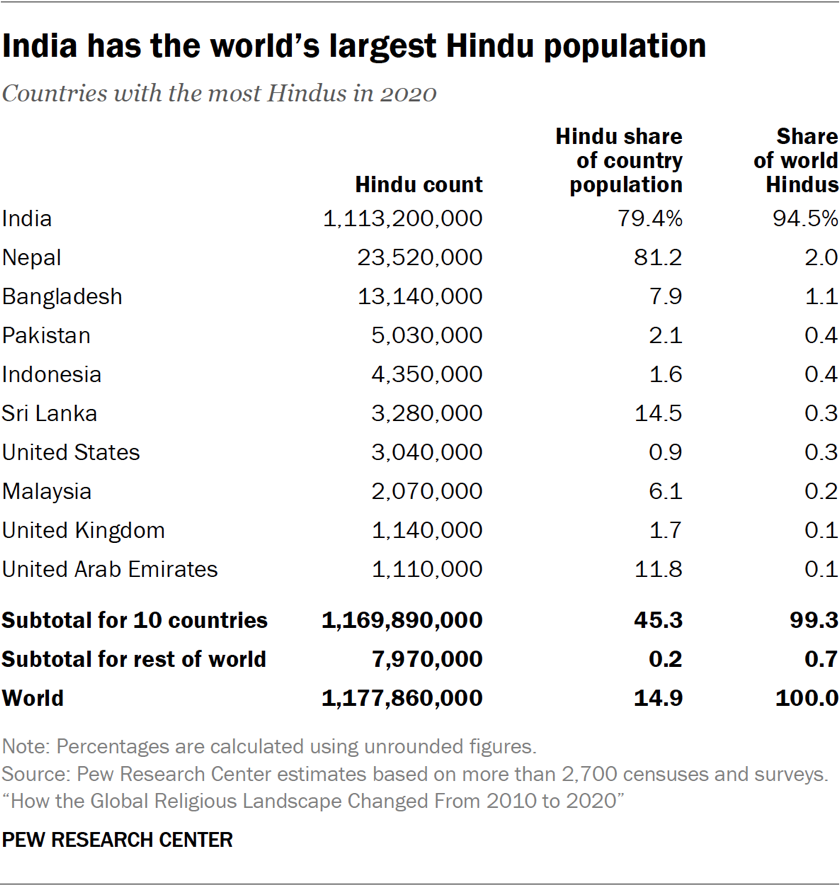
India – the birthplace of Hinduism – has more Hindu residents than any other country, with 95% (or 1.1 billion) of the global Hindu population.
As of 2020, Hindus make up a majority in two countries, India (79%) and Nepal (81%). They are a religious minority in eight of the 1o countries with the largest numbers of Hindus.
Outside the Asia-Pacific region, the U.S. has the largest number of Hindus (3.0 million), followed by the United Kingdom (1.1 million) and the UAE (1.1 million).
Aside from India and Nepal, the only other country in which Hindus are the largest group is Mauritius, where 48% of the population is Hindu. However, Mauritius’ Hindu population of 620,000 isn’t enough to make the list of the 10 countries with the most Hindus.
Where did the Hindu share of the population change the most?
The share of the population identifying as Hindu did not increase or decrease substantially (by at least 5 percentage points) in any country or territory. Migration fueled modest changes in some countries, including an exodus of ethnic Indians from Fiji and an influx of Hindu migrants to Oman. Hindu shares of the population also declined slightly in the South Asian nations of India, Nepal, Pakistan and Bangladesh. But none of these changes reached the 5-point threshold.
6. Buddhist population change
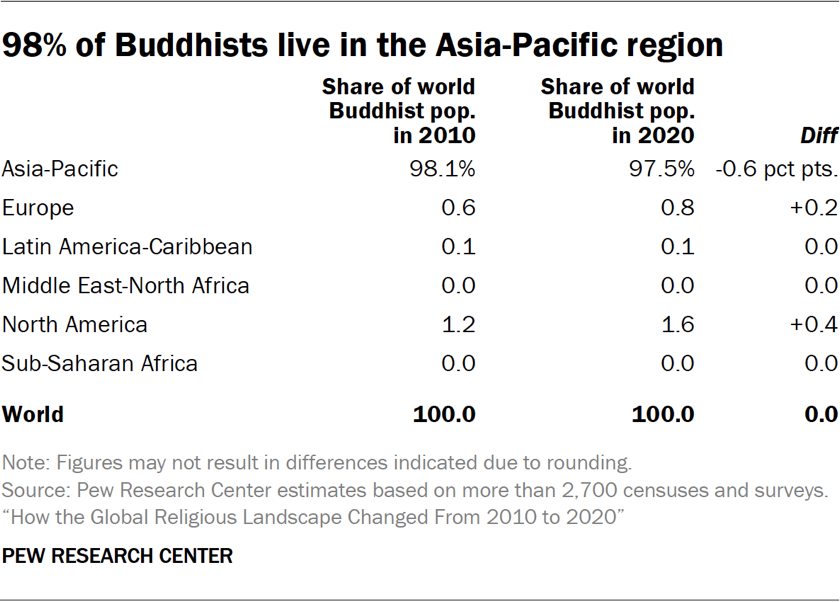
Buddhists are the only group in this report whose number declined worldwide between 2010 and 2020. This was due both to religious disaffiliation among Buddhists in East Asia and to a relatively low birth rate among Buddhists, who tend to live in countries with older populations. Most of the world’s Buddhists (98%) reside in the Asia-Pacific region, the birthplace of Buddhism. Outside Asia, only North America and Europe have more than 1 million Buddhists each.
Challenges of measuring Buddhist identity
Estimating the global size of the Buddhist population is challenging because our standard measure of religious affiliation does not work as well in East Asian societies – where Buddhism is prevalent – as it does in other parts of the world.
Size estimates in this report are based primarily on censuses and surveys that ask about religious identity, typically with the question, “What is your religion, if any?” In several East Asian places, common translations of “religion” often are understood to refer to organized, hierarchical forms of religion, such as Christianity, and some people who engage in Buddhist beliefs and practices may not consider themselves to be “Buddhist” in the formal sense.
Moreover, in places like China and Hong Kong, Japan, South Korea, Taiwan and Vietnam, Buddhism tends to be deeply embedded with local folk religions, and the lines between Buddhism and other religious traditions are blurry – both to practitioners of these traditions and the scholars who study them.
In other words, our Buddhist estimates do not reflect the full influence of Buddhism, as they exclude people who do not formally consider themselves Buddhist, even though they may engage in Buddhist beliefs or practices. But our estimates do capture respondents who feel formally affiliated with Buddhism and are actively engaged in Buddhist beliefs and practices. (For more on the characteristics of self-identified Buddhists, read our reports “Measuring Religion in China” and “Religion and Spirituality in East Asian Societies.”)
Global change
The number of Buddhists around the world declined 5%, from 343 million in 2010 to 324 million in 2020. No other major religious group shrank in absolute numbers during this period. The decrease in Buddhists was largely due to declines in East Asian countries, such as China (down 23 million) and Japan (down 7 million).
During this decade, the rest of the world’s population grew by 13%. As a result, Buddhists declined as a share of the world’s population, from just under 5% in 2010 to just over 4% in 2020.
Regional change
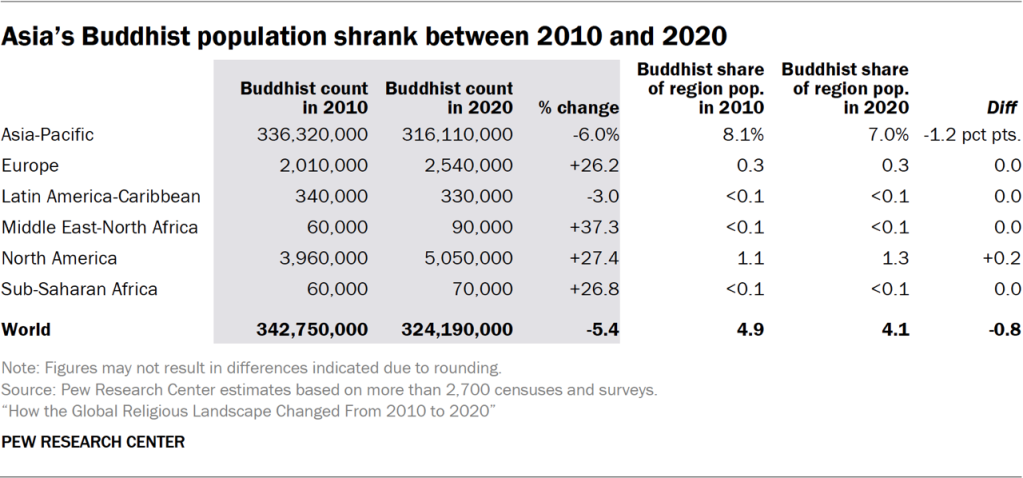
In two regions, there were fewer Buddhists in 2020 than in 2010. In the Asia-Pacific region, the number (or count) of Buddhists declined by 6% to 316 million. In Latin America and the Caribbean, it declined by 3% to 330,000.
Elsewhere, the Buddhist count increased between 2010 and 2020. In North America, it rose by 27% to 5.0 million. In Europe, the number of Buddhists grew by 26% to 2.5 million.
The small Buddhist populations in the Middle East-North Africa and sub-Saharan Africa regions also are estimated to have grown sharply while still numbering fewer than 100,000 in each region in 2020.
Although the Buddhist count changed in every region between 2010 and 2020, the share of the population that is Buddhist did not change much in most regions. In the Asia-Pacific region, the Buddhist share dropped by about 1 percentage point.
Regional distribution of Buddhists
Since 2010, the geographic distribution of the world’s Buddhists has changed little.
As of 2020, the Asia-Pacific region remains home to most of the world’s Buddhists (98%), and the rest continue to live mostly in North America (2%) and Europe (1%).24
However, there was a slight shift in the geographic concentration of Buddhists between 2010 and 2020. The percentage of the world’s Buddhists living in Asia declined slightly, while North America and Europe experienced small increases in their shares of the global Buddhist population.
Countries with the highest Buddhist counts
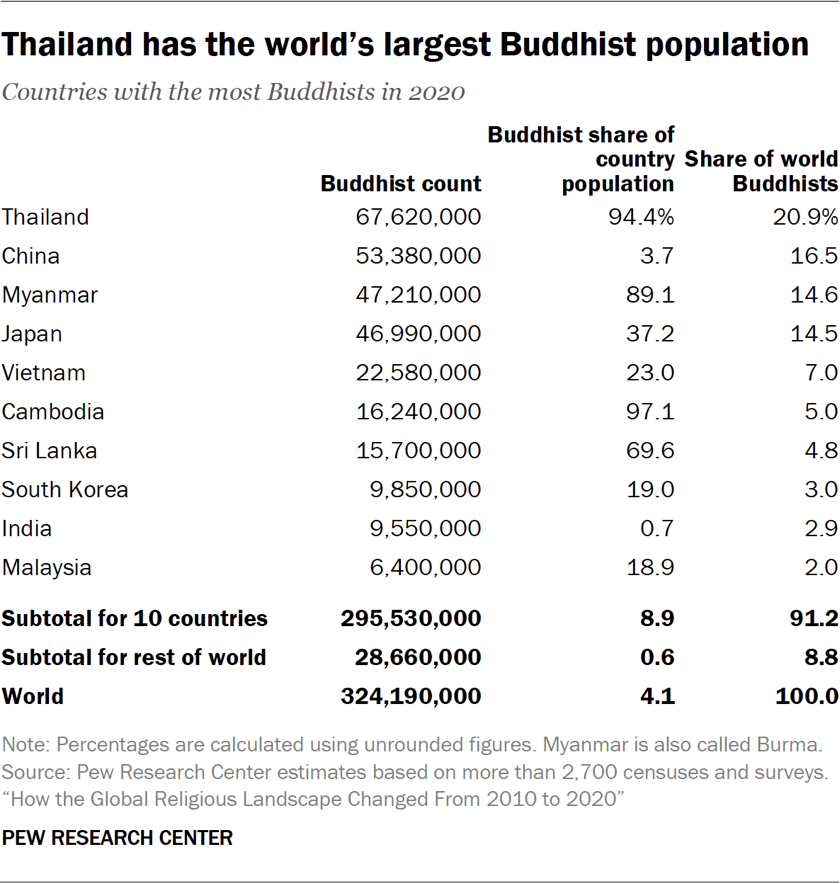
Thailand has the world’s largest number of Buddhists, with 68 million, making up 94% of the country’s population.
China has the second-largest number of Buddhists (53 million), although Buddhists account for just 4% of China’s overall population.
Buddhists form a majority in seven countries: Cambodia (97%); Thailand (94%); Myanmar, which is also called Burma (89%); Bhutan (75%), Sri Lanka (70%); Laos (64%); and Mongolia (51%).
The 10 countries with the largest numbers of Buddhists are home to 91% (or 296 million) of the global Buddhist population.
Among the 10 countries with the largest numbers of Buddhists, only four – Cambodia, Thailand, Myanmar and Sri Lanka – have Buddhist majorities. Elsewhere, Buddhists form minorities and sometimes comprise a tiny fraction of the overall population. For example, India’s Buddhists (approximately 10 million) make up less than 1% of the country’s population.
Where did the Buddhist share of the population change the most?
Between 2010 and 2020, the share of a country’s population identifying as Buddhist only changed substantially (by at least 5 percentage points) in South Korea.
How is ‘substantial change’ defined?
This section highlights countries that experienced substantial change in the size of their religious populations between 2010 and 2020. We focus on cases where a religious group’s share of a country’s population grew or shrank by at least 5 percentage points. We set that threshold because wide variations in data sources make it difficult to test the statistical significance of differences in population estimates in 2010 and 2020. Refer to the Methodology for details.
In South Korea, the percentage of Buddhists dropped over the decade by about 7 points (0r 2.6 million people) to 19%. Many South Koreans who were raised Buddhist have left their childhood religion.
The number of Buddhists in China and Japan declined considerably, but their shares in these countries – which have relatively large overall populations – changed by less than 5 points.
Buddhists are losing adherents in these countries not only due to widespread disaffiliation – people leaving religion after having been raised Buddhist – but also because Buddhists in these places tend to be older than the general population and therefore closer to the end of their lives.
7. ‘Other religions’ population change
There are many religious groups around the world that are not presented separately in this report due to their relatively small size and the limitations of national censuses and other data sources. These groups include Baha’is, Jains, Shintoists, Sikhs, Daoists (also spelled Taoists), Wiccans, Zoroastrians and numerous others, some of which are commonly described as folk or traditional religions.
Because the groups in this category are very diverse, people in this category may not share the same beliefs and practices. The groups within this category also may have quite different demographic profiles.
However, combining these groups into an umbrella category – all “other religions”– allows us to explore overall trends among people who identify as something other than Christian, Muslim, Hindu, Buddhist, Jewish or religiously unaffiliated.
Global change
The estimated number of people in other religions grew worldwide by 12%, from 154 million to 172 million, between 2010 and 2020. The world’s overall population grew at roughly the same pace, and as a result, the share of the global population that falls into the “other religions” category remained stable at about 2%.
Regional change
The absolute number (or count) of adherents of other religions grew in every region.
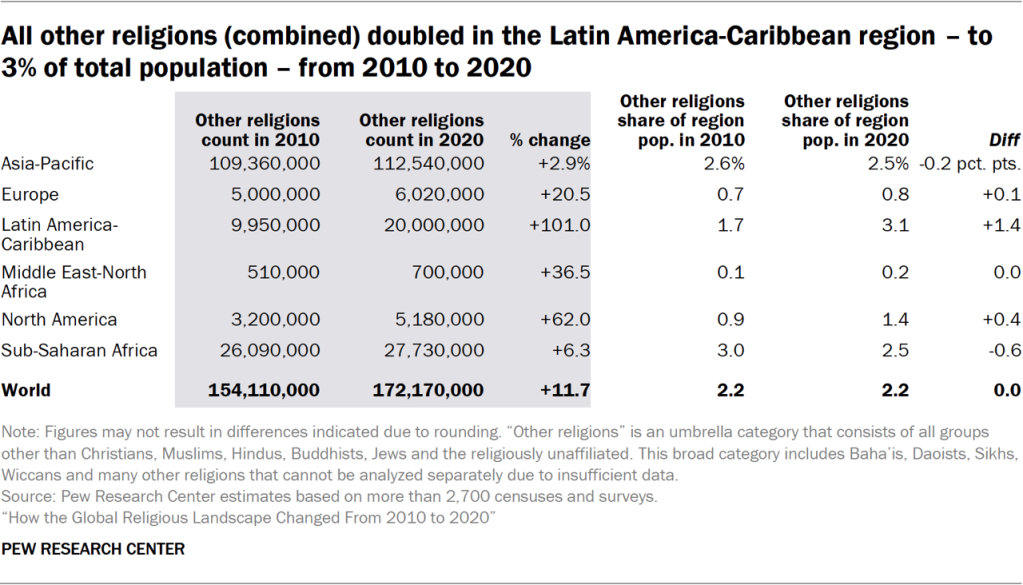
In the Asia-Pacific region, where most people in the “other religions” category live, their count grew to 113 million (up 3%) – their lowest growth rate in any region. Meanwhile, their number doubled to 20 million in the Latin America-Caribbean area (up 101%). In North America, the small population of people in other religions rose above 5 million (up 62%).
The percentage of residents belonging to other religions grew in three regions, fell in two regions, and was stable in the Middle East-North Africa region.
In Latin America and the Caribbean, people in other religions made up 3% of the overall public in 2020, up about 1 percentage point from 2010. They now account for a larger segment of residents of Latin America and the Caribbean than they do of Asia-Pacific residents. The “other religions” category also grew in Europe and North America, but by less than 1 percentage point.
Meanwhile, the share of people in other religions declined by less than 1 percentage point in the Asia-Pacific region and sub-Saharan Africa. In both places, the “other religions” category made up less than 3% of the regional population in 2020.
Regional distribution of people of other religions
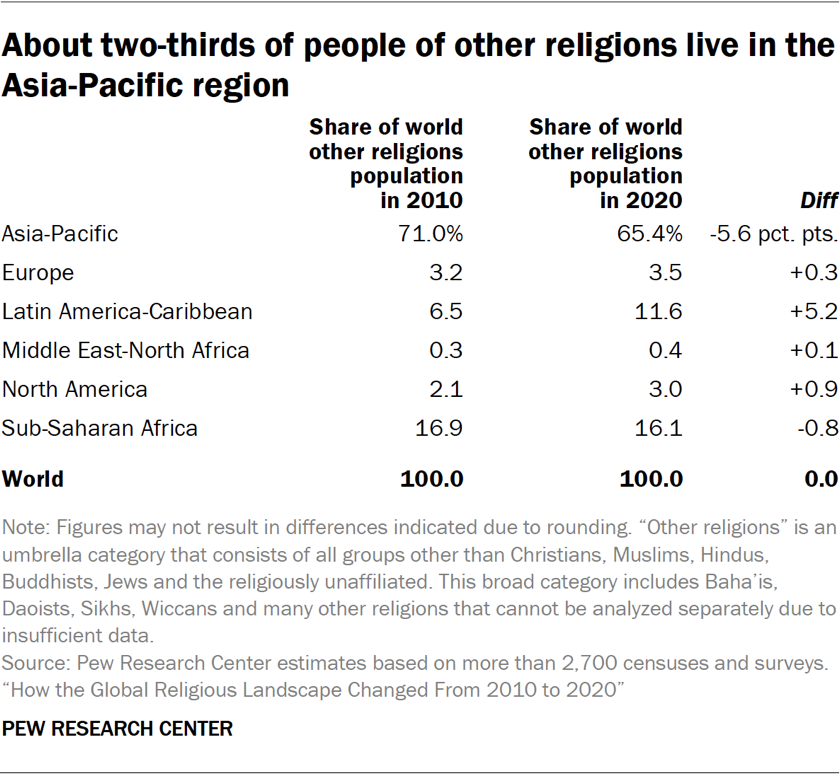
Between 2010 and 2020, the share of the world’s “other religions” population living in the Asia-Pacific region fell to 65% (down 6 points), and the share living in the Latin America-Caribbean region increased to 12% (up 5 points). The percentage of people in other religions living in North America grew to 3% (up 1 point). Less change occurred in other regions.
Countries with the highest counts of people of other religions
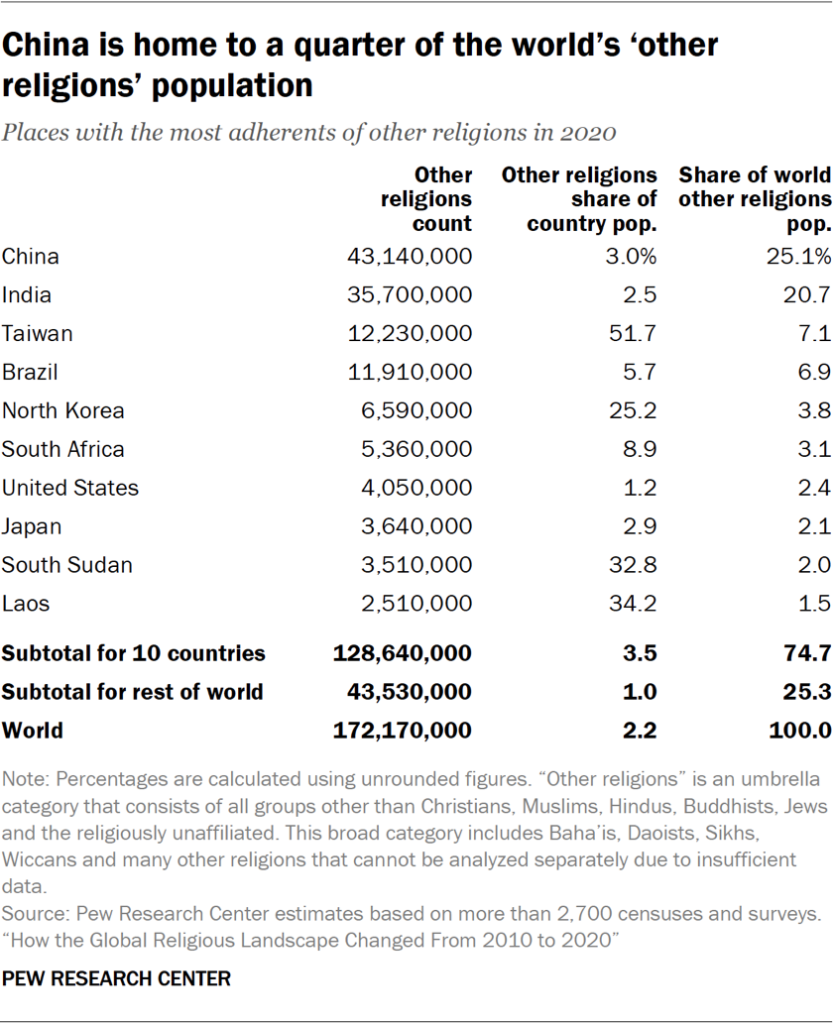
China is the country with the world’s largest number of people who fall into the “other religions” category.
While only 3% of the country’s population identifies with other religions, China has such a large population that this translates to 25% of all adherents of other religions around the world.
India also has a very large population of people in other religions, including many Sikhs and Jains. The 36 million Indians in the “other religions” category constitute one-in-five people in this group globally.
The 10 places with the highest counts of people in other religions combined were home to 129 million, or 75%, of their worldwide population.
Where did the ‘other religions’ share of the population change the most?
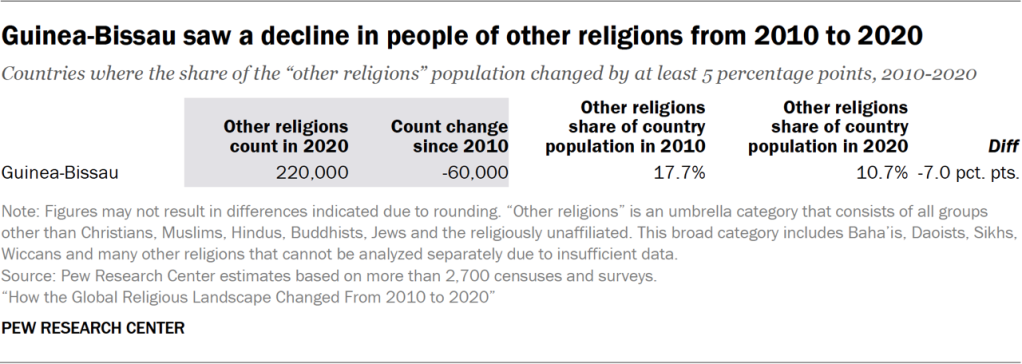
We identified only one country in which the percentage of people belonging to other religions shifted substantially (by at least 5 percentage points): Guinea-Bissau. The share of Guinea-Bissau residents who belong to other religions declined to 11% (down 7 points) between 2010 and 2020. During this period, the share of residents who are religiously unaffiliated grew by 9 points, to 12%.
How is ‘substantial change’ defined?
This section highlights countries that experienced substantial change in the size of their religious populations between 2010 and 2020. We focus on cases where a religious group’s share of a country’s population grew or shrank by at least 5 percentage points. We set that threshold because wide variations in data sources make it difficult to test the statistical significance of differences in population estimates in 2010 and 2020. Refer to the Methodology for details.
8. Jewish population change
Jews are the smallest religious group analyzed separately in this report, accounting for 0.2% of the global population. Most Jews live either in North America (primarily in the United States) or in the Middle East-North Africa region (almost exclusively in Israel). Jews make up less than 2% of the overall population in each of those regions.
Challenges of measuring Jewish identity
Estimating the size of the world’s Jewish population is complicated. Data sources variously measure Jewish religious identity, ethnic identity, or a mix of the two. The number of Jews around the world depends largely on one’s definition of Jewishness.
For consistency with other religious groups around the world, we rely, when possible, on censuses and surveys that measure religious affiliation with Judaism. Due to data limitations, in some countries, we use sources that employ a slightly different approach to measuring Jewish identity:
Israeli government counts. Our estimate of the number of Jews living in Israel comes from the Ministry of Interior’s population register that counts as Jews only those who meet halakhic (religious) legal criteria – i.e., children of Jewish mothers as well as people who have undergone formal conversions. Many people who do not meet these criteria are still eligible to make aliyah and become Israeli citizens based on other ties to Judaism, but they are classified as non-Jews by the government regardless of their personal religious identity. Consequently, the register data we rely on to make estimates of the number of Jews in Israel may count some people as Jewish based on halakhic criteria even if they do not self-identity as Jewish by religion. At the same time, some people who identify religiously as Jewish are not classified as Jewish by the government based on halakhic criteria.
“Core Jewish population” estimates from Sergio DellaPergola’s World Jewish Population dataset. DellaPergola, a leading expert on the demography of global Jewry, has made estimates of Jewish populations using Jewish community records and surveys as well as national census and survey data on religion and ethnicity. His “core Jewish population” numbers are designed to include people who identity as Jewish by religion, as well as people who do not identity with any religion but nonetheless identify otherwise as Jewish.
In the United States, the definition of Jewishness used in this report – based on self-identification with Judaism as a religion – results in a much smaller estimate of the number of Jewish Americans than Pew Research Center has previously provided using a broader definition. In our 2013 and 2020 surveys of Jewish Americans, we counted respondents as Jewish if they said either that Judaism is their religion or that they consider themselves Jewish aside from religion (for reasons such as ethnicity, culture or family background); have at least one Jewish parent or were raised Jewish; and don’t belong to any other religion. Using that broader definition, there were an estimated 7.5 million Jews of all ages in the U.S. in 2020, about 1.8 million more than this report’s estimate of the number of Americans who identify religiously as Jewish (5.7 million).
Another challenge in measuring Jewish populations is that Jews are minorities in countries outside Israel, and their populations are often too small to measure reliably with surveys. (Jews account for less than 0.01% of the population in most of the world’s countries and territories.) Furthermore, in some national censuses that measure religion, “Jewish” is not a response option.
DellaPergola, whose estimates we chose as the best source of Jewish numbers in many countries, has described estimates of Jewish populations as “permanently provisional” in nature.
Our estimates for Israel are based on the Ministry of Interior’s population register of Jews in Israel. Outside of Israel, we generally use a definition of Jewishness based on self-identification with Judaism as a religion.25
During this time, the rest of the world’s population grew about twice as quickly. Despite this gap, the share of the global population that is Jewish still rounds to 0.2%.
Regional change
Jews grew in number in three regions and declined in three others. In the Middle East-North Africa region, Jews grew to a population of almost 7 million (up 18%). The number of Jewish residents also increased slightly in the Asia-Pacific region (up 2%) and North America (up 1%).
The Jewish population of sub-Saharan Africa, already small in 2010, shrank to 50,000 individuals (down 37%). Jews also declined in the Latin America-Caribbean region to 390,000 (down 12%). In Europe, the Jewish population fell to 1.3 million (down 8%).
Jewish shares of regional populations held fairly steady, including a small decline of about 0.1 point in North America.
Regional distribution of Jews
Jews are heavily concentrated in the Middle East-North Africa area and in North America, with the vast majority of Jews (87%) living in one of these two regions.
Between 2010 and 2020, the Middle East and North Africa surpassed North America to become the geographic region with the largest Jewish population. This is primarily because Israel added over 1 million Jews to its population between 2010 and 2020, compared with an increase of just 30,000 in the U.S.
As a result, the share of the world’s Jews who live in the Middle East-North Africa region increased to 46% (up 4 points), while the share who live in North America fell to 41% (down 2 points).
The Middle East and North Africa was the only region that saw an increase in its share of the global Jewish population between 2010 and 2020.
Countries with the highest Jewish counts
Israel and the United States are the only countries with millions of Jewish residents; 85% of Jews worldwide live in one of these two countries.
Nearly half of all Jews live in Israel, which has a 77% Jewish majority and is the only country in which Jews make up more than 2% of the population.26
Four-in-ten Jews worldwide live in the U.S., where they make up 1.7% of the population, when using a definition of Jewishness that is based solely on identification with Judaism as a religion.
Using a broader definition of Jewishness that includes people who identify, religiously, as atheist, agnostic or “nothing in particular” but who say they consider themselves Jewish for reasons aside from religion (such as culture, ancestry or family background) and who have at least one Jewish parent, Pew Research Center has estimated that there were 7.5 million Jews in the U.S. in 2020, making up slightly more than 2% of the U.S. population.27
The overwhelming majority of Jews (96%) live in one of the 10 countries with the largest Jewish populations, for a combined count of 14.2 million. About 500,000 Jews live elsewhere in the world.
Where did the Jewish share of the population change the most?
Between 2010 and 2020, the Jewish population did not grow or decline substantially (by at least 5 percentage points) in any country or territory.
9. Religion in Asia and the Pacific
As of 2020, the Asia-Pacific region is home to 4.5 billion people, 10% more than in 2010. This large and religiously diverse region – where no single religious group constitutes a majority of the population – includes more than 1 billion each of Hindus, Muslims and religiously unaffiliated people. The region also has hundreds of millions of Buddhists, Christians and people in the “other religions” umbrella category.
The vast majority of the world’s Hindus (99%) and Buddhists (98%) live in the Asia-Pacific region. Most of the world’s Muslims (59%), adherents of other religions (65%) and religiously unaffiliated people (78%) also reside in this region.
The heavy concentration of all these groups in Asia and the Pacific is due to the region’s religious diversity and history, as well as its massive population (a majority of the world’s inhabitants). Hinduism, Buddhism and many religions that fall into the “other religions” category – including Daoism (also spelled Taoism), Jainism, Shintoism and Sikhism – were founded in the region.
Nearly 95% of the world’s Hindus live in one country: India, where Hindus make up 79% of the nation’s 1.4 billion people. Adherents in the “other religions” category make up less than 3% of India’s population as of 2020, but even that small share is a lot of people. India contains 21% of all the people in the world who belong to the “other religions” category. (For more about India’s religious landscape, refer to our 2021 report on how the religious composition of India changed from the 1990s through 2010.)
A majority of the world’s religiously unaffiliated people live in China (67%), which was the world’s most populous country in 2020, though it has since been surpassed in size by India. Fully 90% of China’s population is religiously unaffiliated. (Refer to our 2023 report “Measuring Religion in China” for additional context, including a summary of recent Chinese government policy toward religion.)
Religious change
Most groups in the Asia-Pacific region grew in absolute number between 2010 and 2020. Growth in population count was greatest for Muslims (up 16%), Hindus (up 12%) and the religiously unaffiliated (up 10%). As of 2020, the religiously unaffiliated were the largest group in the region, with nearly 1.5 billion people. Muslims and Hindus each numbered about 1.2 billion.
Buddhists are the only group that shrank in number, to 316 million in 2020, down 6% over the preceding decade. This decline was partly due to religious disaffiliation, particularly in some East Asian countries with large Buddhist populations. In addition, Buddhism is declining for demographic reasons, including relatively low fertility rates and an older age distribution.
There were modest changes in the percentage (or share) that each religion made up of the region’s overall population. The share of the region’s population that is Muslim grew to 26% (up about 1 percentage point), while the share of the population that is Buddhist decreased by about 1 point, to about 7%.
Overall, the share of the region’s population that is religiously unaffiliated was stable. However, this stability masks more complex patterns at the individual country-level.
Substantial change within countries
Several countries in the Asia-Pacific region saw a substantial shift (of at least 5 percentage points) in one or more religious group’s share of the total population between 2010 and 2020. The religiously unaffiliated grew considerably in five countries (Australia, New Zealand, South Korea, Vietnam and Japan), while Christians shrank in three (Kazakhstan, New Zealand and Australia). Buddhists declined in South Korea and Muslims grew in Kazakhstan.
How is ‘substantial change’ defined?
This section highlights countries that experienced substantial change in the size of their religious populations between 2010 and 2020. We focus on cases where a religious group’s share of a country’s population grew or shrank by at least 5 percentage points. We set that threshold because wide variations in data sources make it difficult to test the statistical significance of differences in population estimates in 2010 and 2020. Refer to the Methodology for details.
Australia showed the most change. Between 2010 and 2020, Australia’s Christian population fell from 67% to 47% of the country’s total population (down 20 points), while the religiously unaffiliated grew to represent 42% of the country’s inhabitants (up 17 points). Australia is one of four countries around the world that had a Christian majority in 2010 but not in 2020.
Median age of religious groups
The age structure of populations varies greatly by religion across Asia and the Pacific. Three groups – Muslims (26 years), Hindus (29) and Christians (31) – have median ages that are lower than the region’s overall median age (32). The figure is much higher among religiously unaffiliated people (38), Buddhists (40) and Jews (40).
The age patterns by religion in Asia and the Pacific mirror those in other regions. Globally, Muslims have the lowest median age of all major religious groups, followed by Hindus; most members of these two religions around the world are under 30.
Christians, followers of other religions, and religiously unaffiliated people are the next-youngest groups, both in the Asia-Pacific region and worldwide. Both in the Asia-Pacific region and globally, Buddhists and Jews have the highest median ages.
10. Religion in Europe
As of 2020, Europe has about 753 million inhabitants, only 2% more than in 2010. Roughly two-thirds of Europeans in 2020 are Christians, and a quarter are religiously unaffiliated. Around 6% of Europe’s residents are Muslims.
In many European countries, there has been a decades-long pattern of religious “switching,” with people who were raised as Christians becoming religiously unaffiliated. This widespread disaffiliation has contributed to the thinning of Europe’s Christian population and the swelling of the ranks of the religiously unaffiliated.
Between 2010 and 2020, France and the United Kingdom lost their Christian majorities, and the Netherlands gained an unaffiliated majority.
Religious change
Between 2010 and 2020, the absolute number (or count) of Christians dropped by 9% to 505 million. Jews also decreased in count, by 8%, to 1.3 million in 2020. Meanwhile, every other major religious group grew in number in Europe. The religiously unaffiliated expanded the most, numbering 190 million in 2020 (up 37%). Muslims increased to 46 million (up 16%). Europe’s relatively small Hindu population also grew substantially, rising to 2 million (up 30%).
There were also changes in the percentages (or shares) these groups made up of Europe’s overall population. The biggest driver of change between 2010 and 2020 was religious disaffiliation: The share that Christians made up of the region’s population dropped to 67% (down 8 percentage points), while the share of religiously unaffiliated people rose to 25% (up 7 points). Every other group saw less than a 1-point change over the decade.
Immigration to Europe from Muslim-majority countries elsewhere in the world generated a lot of public discussion between 2010 and 2020, particularly as many refugees arrived from Syria.
Overall, the share of Europe’s population that is Muslim grew by less than 1 percentage point, to 6% in 2020, but the change was not evenly distributed. In Sweden, where government policies toward Syrian refugees were generous, Muslims grew to make up 8% of the country’s inhabitants (up 4 percentage points, or roughly double the share of Sweden’s population that Muslims had been in 2010).
Muslims also increased as a share of the overall population by about 4 points in Albania, where they already made up a majority in 2010. The Muslim share was more stable in other European countries. For example, in Germany, where then-Chancellor Angela Merkel’s welcoming stance toward Muslim refugees in 2015 was highly controversial, Muslims grew by about 1 percentage point as a share of the country’s population, making up 7% of the country’s residents in 2020.
Substantial change within countries
Among regions, Europe has the largest number of countries (23) that experienced a substantial change (of 5 percentage points or more) in at least one religious group’s share of the population. Every such change in the region reflected declining percentages of Christians. In most of these countries (20), religiously unaffiliated people increased as a share of the population by at least 5 points.
How is ‘substantial change’ defined?
This section highlights countries that experienced substantial change in the size of their religious populations between 2010 and 2020. We focus on cases where a religious group’s share of a country’s population grew or shrank by at least 5 percentage points. We set that threshold because wide variations in data sources make it difficult to test the statistical significance of differences in population estimates in 2010 and 2020. Refer to the Methodology for details.
The largest shift, in terms of percentage point change, occurred among Christians in the United Kingdom, where Christians shrank to just under half of the UK’s population (down 13 points). At the same time, religiously unaffiliated people increased to 40% of the UK population (up 11 points). A slightly larger change among the religiously unaffiliated occurred in Estonia, where they grew to represent 44% of the country’s population (up 12 points).
In Europe, two countries – France and the UK – had Christian majorities in 2010 and no longer do. Meanwhile, the Netherlands became the second unaffiliated-majority country in Europe, joining the Czech Republic.
Aside from Christians and unaffiliated people, no religious group saw its share in any European country change by 5 percentage points or more between 2010 and 2020.
Median age of religious groups
Europeans are older, on average, than people in any other region, with a median age of 42. Europe has slower population growth than other regions largely because of relatively low fertility rates and large percentages of older adults. In fact, the populations of some European countries would have shrunk since 2000 if not for immigration, because deaths have outpaced births.
Muslims are the youngest religious group in Europe, with a median age of 34. The median age of European Jews – the oldest group in the region – is approximately 53.
Hindus (36 years), religiously unaffiliated people (39) and Buddhists (40) all have median ages below the region’s overall figure. We do not have sufficient data on adherents of other religions in Europe to reliably estimate their age structure.
As with Jews, Christians (45) tend to be older than other Europeans.
11. Religion in Latin America and the Caribbean
As of 2020, roughly 650 million people live in the Latin America-Caribbean region, an increase of about 10% since 2010. The region is overwhelmingly Christian; almost every country in the region has a Christian majority. The lone exception is Uruguay, where more than half the population is religiously unaffiliated.
As in North America, Europe, and parts of the Asia-Pacific region, disaffiliation drove much of the religious change that has occurred across Latin America and the Caribbean since 2010. In many Latin American and Caribbean countries, substantial numbers of adults say they were raised as Christians but now identify with no religion.
Based on numbers (or counts), most religious groups in the Latin America-Caribbean region grew between 2010 and 2020. People belonging to the “other religions” category are estimated to have increased in number the most rapidly (up 101%). This change is largely due to a doubling of followers of other religions in Brazil, the region’s most populous country. Throughout the region, the “other religions” category includes various Indigenous and Afro-Latin religious traditions, such as Candomblé in Brazil.
The size of the region’s religiously unaffiliated population also grew considerably (up 67%), while Muslims (up 6%), Hindus (up 5%) and Christians (up 3%) grew less rapidly. Across all of Latin America and the Caribbean in 2020, Muslims, Hindus, Jews and Buddhists still numbered fewer than 1 million each. By comparison, there were approximately 547 million Christians, 77 million religiously unaffiliated people and 20 million followers of other religions.
During this period, the region’s small population of Jews shrank the most (down 13%).
There were fewer changes in the percentage (or share) each religious group made up of the population of Latin America and the Caribbean. Christians grew more slowly in number than most other groups from 2010 to 2020, so their share of the region’s residents fell 5 points, to 85% in 2020. The religiously unaffiliated grew 4 points (to 12%), and people in the “other religions” category increased by about 1 point, to make up 3% of the population in 2020. Other groups held fairly steady.
Substantial change within countries
Across Latin American and the Caribbean – as in North America and Europe – Christians and religiously unaffiliated people are the only groups whose share of the population in any single country changed substantially (by at least 5 percentage points) from 2010 to 2020.
How is ‘substantial change’ defined?
This section highlights countries that experienced substantial change in the size of their religious populations between 2010 and 2020. We focus on cases where a religious group’s share of a country’s population grew or shrank by at least 5 percentage points. We set that threshold because wide variations in data sources make it difficult to test the statistical significance of differences in population estimates in 2010 and 2020. Refer to the Methodology for details.
The share of residents who self-identify as Christians fell substantially in eight countries, while in five of these countries, the share of religiously unaffiliated people grew substantially.
Change was most pronounced in Chile, where the share of Christians in the country’s overall population shrank to 68% (down 18 points) and the religiously unaffiliated grew to 30% (up 17 points).
Similarly, Christians made up 44% of Uruguay’s population in 2020 (down 16 points), while religiously unaffiliated people accounted for 52% (up 16 points), making Uruguay the only country in the region without a Christian majority. Other countries’ populations experienced smaller declines in their share of Christians and/or growth of religiously unaffiliated people.
Median age of religious groups
The religiously unaffiliated, with a median age of 28, are the youngest group in the Latin America-Caribbean region. This median age is much lower than among religiously unaffiliated people globally (37 years).
Christians are the region’s next-youngest religious group – about half are 31 or younger. Buddhists are the oldest group in the region, with a median age of 41. Hindus (36) and people of other religions (39) fall in between. (We do not have sufficient data on the relatively small numbers of Jews and Muslims across Latin America and the Caribbean to reliably estimate their age structures.)
12. Religion in the Middle East and North Africa
As of 2020, the Middle East-North Africa region – the birthplace of Judaism, Christianity and Islam – is home to 440 million people, up 24% since 2010. Muslims make up the vast majority of the region’s population (94%). There is no other major geographic region with such a high concentration of a single religion. While most of the world’s Muslims live elsewhere, the Middle East-North Africa region is the only large region with a Muslim majority.
Christians are the largest minority group in the region, representing 3% of its population, and they are heavily concentrated in Egypt. Fewer than 2% of residents in the Middle East-North Africa region – or 7 million people – are Jewish, almost all of whom live in Israel.28 Hindus, Buddhists, religiously unaffiliated people and adherents of other religions – many of whom are Druze living in Lebanon and Israel – each make up less than 1% of the region’s population.
Gulf Cooperation Council countries, such as Saudi Arabia and the United Arab Emirates, have attracted non-Muslim migrants, boosting the absolute numbers of several religious groups in the broader region.
Religious change
Every group grew in number (or count) between 2010 and 2020. The region’s small Hindu population grew the most rapidly (up 62%), followed by the even smaller religiously unaffiliated population (up 41%). Meanwhile, Muslims grew to 414 million (up 24%), and the Jewish population grew to nearly 7 million (up 18%). Christians increased their numbers to an estimated 13 million (up 9%), the lowest growth rate in the region.
There were only small changes in the percentage (or share) of people represented by each group in the region. The largest change was a 0.4-point decrease in the share that Christians make up of the region’s total population.
Substantial change within countries
Lebanon and Oman are the only two countries in the Middle East-North Africa region that experienced a substantial change (of at least 5 percentage points) in a religious group’s share of their overall population.
How is ‘substantial change’ defined?
This section highlights countries that experienced substantial change in the size of their religious populations between 2010 and 2020. We focus on cases where a religious group’s share of a country’s population grew or shrank by at least 5 percentage points. We set that threshold because wide variations in data sources make it difficult to test the statistical significance of differences in population estimates in 2010 and 2020. Refer to the Methodology for details.
In Lebanon, the share of the population that is Muslim rose to 68% (up 5 points), while the Christian population declined by about the same amount, to 28% of all residents of Lebanon. Much of the change was due to a large influx of Muslim refugees from Syria. Lebanon hosts the second-largest number of Syrian refugees (after Turkey) and has the highest concentration of Syrians relative to its population size – roughly one-in-five residents of Lebanon is a Syrian refugee. But the decline in the Christian share of Lebanon’s population also results from a decrease in the absolute number of Christians residing in the country.
In Oman, the share of the population that is Muslim declined to 82% (down 8 points). Hindus and Christians made up rising shares of Oman’s population from 2010 to 2020 as a result of immigration, especially from India. Over the decade, immigrants accounted for most of Oman’s overall population increase of 1.8 million.
Median age of religious groups
The Middle East-North Africa region has a relatively young population, with a median age of about 25. The only major region of the world with a younger population is sub-Saharan Africa.
Muslims tend to be younger than Jews in the Middle East and North Africa; Jews living in the region (primarily in Israel) had a median age of about 31, as of 2020. (We do not have sufficient data on people in other religious categories across the Middle East and North Africa to reliably estimate their age structure.)
13. Religion in North America
North America – comprised in this report of the United States and Canada – had 378 million inhabitants in 2020, a 9% increase since 2010.29 Christians are by far the largest religious group in the region (63%), followed by religiously unaffiliated people (30%). All other groups, including Jews, Muslims, Buddhists and Hindus, each account for less than 2% of the population.
In the period from 201o to 2020, North America experienced large shifts in the shares of two religious categories: a steep drop in Christians as a percentage of the region’s overall population, and a corresponding rise in the percentage of the population that is religiously unaffiliated.
The prevailing pattern of change in the region is religious disaffiliation, particularly by people who say they were raised Christian but who have stopped identifying with any religion in adulthood.
Religious change
Christians were the only group in the region that declined in absolute number (or count) from 2010 to 2020, falling below 240 million (down 11%). Meanwhile, the number of religiously unaffiliated people almost doubled to 114 million (up 92%).
Several religious groups with smaller footprints in the region grew much faster than the region’s population overall. North American Muslims now number about 6 million (up 52%). People in the “other religions” category (up 62%) and Buddhists (up 27%) each have grown to more than 5 million. There also are about 4 million Hindus in the region, up 55% from 2010.
Most of the growth of Muslim and Hindu populations in the U.S. and Canada can be attributed to immigration.
North America’s Jewish population grew by only a few tens of thousands over the decade (up less than 1%), due to a relatively old age structure, low fertility rates and the absence of any major, new wave of Jewish immigration since the collapse of the Soviet Union. (For consistency with other religious groups, the definition of Jewishness in North America is based on self-identification with Judaism as a religion. It does not include people who describe their current religion as atheist, agnostic or “nothing in particular” but who consider themselves Jewish for reasons aside from religion, such as ancestry, culture or family background.30 Refer to Chapter 8 for more details.)
In terms of the percentage (or share) that each group made up, North America saw the two largest changes of any region: Christians dropped by 14 percentage points to 63% of the region’s population in 2020, while religiously unaffiliated people rose by 13 points to 30% of the population.
Every other group’s share of the population changed by less than 1 percentage point between 2010 and 2020.
Substantial change within countries
Between 2010 and 2020, both the U.S. and Canada experienced drops of about 14 percentage points in the share of their populations that are Christian. Christians now make up an estimated 64% of all U.S. residents and 53% of Canada’s inhabitants. Both countries’ religiously unaffiliated populations grew substantially over the same period (by at least 5 percentage points).
How is ‘substantial change’ defined?
This section highlights countries that experienced substantial change in the size of their religious populations between 2010 and 2020. We focus on cases where a religious group’s share of a country’s population grew or shrank by at least 5 percentage points. We set that threshold because wide variations in data sources make it difficult to test the statistical significance of differences in population estimates in 2010 and 2020. Refer to the Methodology for details.
As of 2020, about 30% of U.S. residents (of all ages) do not identify with any religion, an increase of 13 points since 2010. In Canada, religiously unaffiliated people made up about 35% of the population in 2020, up 11 points since 2010.
Median age of religious groups
The median age of religious groups in North America ranges from 28 among Muslims to 44 among Christians. North America’s overall median age is 39 – the second-highest of any region of the world (after Europe, where the median age is 42).
In addition to Christians, Buddhists (43) and Jews (44) have higher median ages than the region overall. By comparison, Hindus (30) and the religiously unaffiliated (31) have relatively young populations in the region.
14. Religion in sub-Saharan Africa
Between 2010 and 2020, the population of sub-Saharan Africa grew by 31% to 1.1 billion. As of 2020, most people living in the region are Christians (62%), while Muslims make up about a third of the population. Religiously unaffiliated people and followers of other religions (which include African traditional religions) each account for roughly 3% of the overall population.
Sub-Saharan Africans are younger and have a higher fertility rate, on average, than people in any other region, leading to growth among all religious groups except for Jews. From 2010 to 2020, sub-Saharan Africa accounted for most of the increase in Christian numbers, globally.
Christians and Muslims, who together make up 95% of sub-Saharan Africans, are not evenly distributed in the region or even within many countries. Muslim-majority countries are in the north, closer to North Africa and the Middle East, while Christian-majority countries are in the south. This north-south divide appears in some countries, too. In Nigeria, for example, Muslims and Christians make up similar population shares but typically live in the north and south, respectively. A similar dynamic in Sudan contributed to the division of Sudan and South Sudan in 2011.
Measuring traditional religion and religiously unaffiliated populations in the region can be difficult. For example, older, traditional beliefs – including animism and Indigenous religious traditions – are often integrated into the monotheistic religions, making it hard to separate Christians and Muslims from people who fall in the “other religions” category.
Religious change
Sub-Saharan Africa’s overall population is growing fast, and the same is true for its two largest religious groups.
Between 2010 and 2020, the number (or count) of Christians grew to 697 million (up 31%), while Muslims increased to 369 million (up 34%). More than 29 million people in the region are religiously unaffiliated (up 10%), and 28 million identify with an “other religion” (up 6%), most commonly animism and other Indigenous traditions. Hindus number more than 1 million (up 9%), as of 2020. But across this region of over 1 billion people, Buddhists and Jews each number in the tens of thousands, as they did in 2010.
There were only small changes in the percentages (or shares) of the regional population these groups made up in 2020 compared with 2010. The share of the population that is Muslim changed the most, growing by roughly 1 percentage point to 33%. Christians increased their share by less than half of a percentage point, to 62%. The religiously unaffiliated and “other religions” populations both declined slightly, but each still made up roughly 3% of sub-Saharan Africa’s population in 2020, as they did in 2010.
Substantial change within countries
Across sub-Saharan Africa, the largest substantial change (of at least 5 percentage points) in a religious group’s share of a country’s population occurred in Guinea-Bissau, where the religiously unaffiliated grew to represent 12% in 2020, up 9 percentage points from 2010. In the same country, the share of people belonging to other religions fell to 11% (down 7 points).
How is ‘substantial change’ defined?
This section highlights countries that experienced substantial change in the size of their religious populations between 2010 and 2020. We focus on cases where a religious group’s share of a country’s population grew or shrank by at least 5 percentage points. We set that threshold because wide variations in data sources make it difficult to test the statistical significance of differences in population estimates in 2010 and 2020. Refer to the Methodology for details.
Mozambique is the only country in the region (and in the world) in which Christians substantially increased their share of the population, growing to 61% (up 5 points). A government-led anti-religious campaign in Mozambique officially ended in the 1980s, and the share of its population that is Christian has been increasing since then.
Other changes also occurred:
Christians declined in Benin, Namibia and Cape Verde.
The percentage of the population identifying as Muslim increased substantially in one country (Benin) and fell in one other (Tanzania).
The share of religiously unaffiliated people expanded in three countries (Guinea-Bissau, Cape Verde and Namibia).
Median age of religious groups
Sub-Saharan Africa has the youngest population of any major region of the world. With a median age of 19, young people make up most of the region’s population. Christians tend to be older than Muslims across the region, with median ages of 20 and 17, respectively. People in the “other religions” category also have a median age of about 20. (There is not enough information available about the age structure of Buddhists in the region to make a reliable estimate of their median age.)
We revised estimates for 2010 to reflect advances in our methodology, including new approaches to measuring religion in China and categorizing adherents of folk religions. Furthermore, this report draws on data sources that were not available to us previously. We made these revisions to improve the validity of 2010 figures, and so that the measures presented within this report could be directly compared with each other – i.e., to ensure that we use the same types of measures consistently across time periods and countries.
We describe the new 2010 figures as methodological revisions to avoid confusion with the societal changes we estimate took place in each country between 2010 and 2020.
How do our 2010 global estimates differ from what we published before?
As a result of our methodological revisions, our current 2010 estimates for a few groups are substantially different from our initial 2010 estimates.
In percentage points, the difference is largest for the religiously unaffiliated population, which we now estimate was 23% of the global population in 2010, instead of 16% in our previous estimates.
We no longer make a separate estimate for the number of people who identify with folk religions. Instead, people who identify with folk religions in censuses and surveys have been counted in our “other religions” category, which makes up 2% of our revised global religious landscape, up from 1% in our earlier reports.
Among the remaining categories, the largest downward revision in percentage point terms is for Buddhists, who we now estimate made up 5% of the global population in 2010, instead of 7% in our previous estimates.
As a result of country-level revisions, global shares of Christians and Muslims have moved by less than 1 percentage point. Our revised Christian estimate for 2010 is 31% of the world’s population, and our revised Muslim estimate is 24%. Our estimates of the share of Hindus and Jews in the world have undergone very small revisions in the new report.
The revisions to our estimates of the world’s religiously unaffiliated, Buddhist and Christian populations are largely due to our new approach to measuring religion in China. Revisions to the Muslim estimates are largely due to updated source data from Nigeria, and updated United Nations figures for Pakistan’s overall population.31
Our new approach to measuring religion in China
In most countries, the adjustments we made to our methodology have resulted in only modest changes. But in China, a new approach has resulted in consequential revisions for that country and – because China accounts for a large share of the global population – for the rest of the world.
Our initial estimates for China, first published in 2012, were based on a mix of identity, belief and practice measures drawn from a 2007 Spiritual Life Study of Chinese Residents survey. Using this mix of measures, we originally classified 52% of Chinese people as having no religious affiliation. In our revised estimates, to be consistent with our approach in other countries, we use only a single measure of religious identity. Based on responses to the question, “What is your religion” – typically using the Chinese word zongjiao for religion – we now estimate that 87% of people in China did not formally identify with a religion in 2010.32
Zongjiao versus measures of belief and practice in China
Assessing how many people in China identify with religion is difficult, as we discussed in our 2023 report “Measuring Religion in China.”
The challenges of measuring religion in China are conceptual, cultural and political. Chinese surveys that ask about religious identity typically use the Chinese term zongjiao (宗教), which is commonly understood as a form of organized religion. Chinese people generally do not use this term to describe popular rituals, such as making offerings to deities. Meanwhile, unlike Christianity and Islam, Chinese traditional religions are often deeply intertwined and do not emphasize exclusive membership.
As a result, surveys that ask about zongjiao identity may not capture people who venerate Buddha and other deities but who do not consider themselves to be affiliated with a religion. An analysis we conducted in 2023 indicates that the questions about zongjiao affiliation tend to capture people who are actively engaged in religious beliefs and practices.
Additionally, surveys may suffer from underreporting because some Chinese people may be motivated to conceal their zongjiao identity in light of China’s policies on religion.
To address these challenges, our 2015 estimates used a distinct mix of methods. For instance, we derived our Buddhist estimate (18%) from a survey question that asked respondents whether they believe in “Buddhism or Buddha” instead of just “Buddhism.”33 To account for possible underreporting of Christian identity, we adjusted our Christian estimate up from the survey’s reported level of Christian identity.34
While these strategies were intended to provide an accurate snapshot of China’s religious landscape as of 2010, they made our China estimates less comparable with our estimates for other countries.
Furthermore, our earlier strategy was not well suited for measuring change in China between 2010 and 2020. For example, while surveys may tend to undercount Christians (or other groups), we don’t know whether potential undercounts are growing, shrinking or stable in magnitude. We have discussed this topic at length elsewhere.35
In this report, we rely on measures of religious identity (i.e., zongjiao identity) to estimate China’s religious landscape.
Researchers have found that zongjiao measures produce consistent estimates across surveys, and zongjiao identification patterns remain stable amidst a shifting political climate for religion. Focusing on zongjiao measures allows us to compare the sizes of China’s religious groups with those of other countries and assess how these sizes have changed over time.36
The adjustments we made in China account for most of the differences in our global numbers of Buddhists, Christians and religiously unaffiliated people. Adjusting our China estimate was less consequential for global estimates of Muslims, Hindus and Jews, because these groups are not as heavily represented in China in proportion to their global populations.
Our new approach to folk religions
People who practice folk religions aren’t consistently captured in surveys and censuses. Sometimes, appropriate response categories are missing or underutilized. And sometimes, people who practice folk religions also follow another religion, such as Christianity or Islam, which they report in surveys.
In our initial estimates, we had a separate category for people who practice folk or traditional religions, and when we suspected that folk religion populations may have been undercounted, we adjusted estimates of the size of those populations using data from the World Religion Database and other sources.
In the current analysis, we include people who identify with folk religions in the “other religions” category, and we no longer attempt to make an adjustment for possible undercounts.
Maximizing comparability of sources and methods
An important goal for all the estimates in this report is that the 2010 and 2020 estimates of the religious makeup of each country should be as directly comparable as possible.
More people generally volunteer some kind of religious identity when they are asked a single, direct question (such as, “What is your religion, if any?”) rather than a two-step question, such as, “Do you have a religion?” followed – if the answer was “yes” – by, “What is it?” The two-step format tends to filter out some people with lower levels of religious belief and practice.37 We generally rely on data sources that measure religious identity with a direct, one-step question. But in some countries, we chose to rely on a two-step question when it was the most comparable option available in data sources for both 2010 and 2020. If we used different types of questions in those two years, we would be less able to discern real change over time: Any apparent difference between the 2010 and 2020 results might be a consequence just of the differently worded questions.
To maximize comparability over time, our revised estimates no longer make adjustments for possible underreporting of identities, such as adherents of folk religions or Christians in China and India.
Years ago, when we were compiling data and making estimates of each country’s religious composition for our earlier reports, we were focused on describing the size of groups in just one year, 2010. Adjusting for possible undercounts among adherents of folk religions and a few other groups in a few places seemed fitting. We expected that conservative adjustments would improve the accuracy of our estimates. However, we did not – and do not – have reliable information about how large the possible undercounts were. Nor do we know how they might be changing over time. For this report, we chose to forego all such adjustments.
Other revisions to our 2010 estimates
In addition to revising our approach in China and recategorizing adherents of folk religions, we made a few other methodological changes that affect our 2010 estimates.
Changes to our data sources
Many of the 2010 estimates in this report use a different source than we used before. In some cases, our current source was not previously available to us. In other cases, we chose a past source (for 2010) that is more comparable with the best source now available to measure religion in 2020. These revisions introduced changes big and small at the country level, which partially offset each other. In 10 countries, we adjusted our estimate of the majority religion. For example, we now estimate that Nigeria had a Muslim majority in 2010 rather than a Christian plurality that year. And we estimate that Vietnam had a religiously unaffiliated majority rather than a plurality of adherents of folk religions.
Changes to include children in population estimates
Few surveys include measures of the religion of children, so general population estimates in our past reports were in many cases based on the religious composition of adults. For this report, we estimate the religious composition of children in each country and use those figures in improving the accuracy of our 2010 and 2020 general population estimates.
In addition to the consequential methodological revisions described above, we also made smaller tweaks to our 2010 methodology that had little impact on the results:
Changes to exclude less-populous countries and territories
This report focuses on 201 countries and territories that are home to 99.98% of the world’s people. Our earlier reports included additional places that had populations below 100,000 in both 2010 and 2020.38 There is often very little data on religion available for these less populous countries. Because of their size, the omission of these places has little impact on global estimates of religious composition.
Changes to UN data
Our earlier reports used 2010 country-level population estimates from the United Nations’ 2010 revision of the World Population Prospects. This report uses 2010 estimates from the UN’s updated 2024 revision. There are many modest population differences between revisions of the UN data, which have minor effects on how the religious composition of each country is weighted. The largest differences are increases of at least 10 million people in the 2010 populations of Pakistan, India and China.
Acknowledgments
This report was produced by Pew Research Center as part of the Pew-Templeton Global Religious Futures project, which analyzes religious change and its impact on societies around the world. Funding for the Global Religious Futures project comes from The Pew Charitable Trusts and the John Templeton Foundation (grant 62287). Find related reports online at https://alpha.pewresearch.org/pewresearch-org/globalreligiousfutures.
This report is a collaborative effort based on input from and analysis by the following individuals from Pew Research Center and the Center for Advanced Studies of Population and Religion (CASPAR) at Krakow University of Economics.
Primary researchers
Conrad Hackett, Associate Director of Research and Senior Demographer, Pew Research Center Marcin Stonawski, Director of CASPAR Yunping Tong, Research Associate, Pew Research Center Stephanie Kramer, Senior Researcher, Pew Research Center Anne Shi, Senior Researcher, Pew Research Center
Research team
Alan Cooperman, Director of Religion Research, Pew Research Center Joanna Sikorska, Research Assistant, CASPAR Krystian Fejkiel, Research Assistant, CASPAR Michał Bożek, Research Assistant, CASPAR Maciej Laburda, Research Assistant, CASPAR Krzysztof Kiecoń, Research Assistant, CASPAR
Editorial and graphic design
Dalia Fahmy, Senior Writer and Editor, Pew Research Center Rebecca Leppert, Copy Editor, Pew Research Center Bill Webster, Senior Information Graphics Designer, Pew Research Center
Communications and web publishing
Hannah Taber, Communications Manager, Pew Research Center Maya Pottiger, Communications Associate, Pew Research Center Justine Coleman, Associate Digital Producer, Pew Research Center Nick Zanetti, Associate Engineer, Pew Research Center
Others at Pew Research Center who provided guidance include Caileigh Stirling, former research associate; Matthew Conrad, former graduate student intern; Isaac Lamoreaux, former undergraduate student intern; Andrew Mercer, senior research methodologist; Gregory A. Smith, senior associate director of research; Arnold Lau, research methodologist; Becka A. Alper, senior researcher; Jonathan Evans, senior researcher; Kirsten Lesage, research associate; Kelsey Jo Starr, research analyst; William Miner, research analyst; Manolo Corichi, research analyst; and Samirah Majumdar, research associate.
The following former research assistants at CASPAR helped to collect and standardize religious composition data: Małgorzata Jedynak, Gisella Lopez, Przemysław Wojno, Bartosz Tyrała, and Karolina Kosmala.
The Center also received valuable input from numerous social scientists, including Yair Assaf-Shapira, Head of Data Analysis and Services and Senior Researcher, Jerusalem Institute for Policy Research, Israel; Valentina Pereira Arena, Professor, Catholic University of Uruguay, Uruguay; Roberto Cipriani, Professor Emeritus of Sociology at Roma Tre University; Néstor Da Costa, Professor, Catholic University of Uruguay, Uruguay; Sergio DellaPergola, Professor Emeritus and former Chairman of The A. Harman Institute of Contemporary Jewry, The Hebrew University of Jerusalem, Israel; Ljiljana Đorđević, Head of Population Census Division, Statistical Office of the Republic of Serbia; Juan Cruz Esquivel, Senior Researcher at the National Scientific and Technical Research Council and Main Professor of Methodology of Social Research at the University of Buenos Aires, Argentina; Erling Häggström Gunfridsson, Associate Professor of Population Studies, Umeå University, Sweden; Francesco Benvenuto Molteni, Researcher, University of Milan, Italy; Eric Morier-Genoud, Professor, Queen’s University Belfast, Northern Ireland; Michaela Potančoková, Senior Research Scholar, International Institute for Applied Systems Analysis, Austria; Atko Remmel, Associate Professor, University of Tartu, Estonia; Roberta Ricucci, Associate Professor, Department of Cultures, Politics and Society, University of Torino, Italy; Triin Roosalu, Associate Professor of Sociology, Tallinn University, Estonia; Niel Roux, Director of Service Delivery Statistics, Statistics South Africa, South Africa; Kobus Schoeman, Emeritus Professor, University of the Free State, South Africa; John Shaver, Associate Professor, Baylor University, United States; Patrick Simon, Senior Researcher, French Institute for Demographic Studies, France; Ventsislava Stoyanova, Assistant Professor, University of National and World Economy, Bulgaria; and Sam Hyun Yoo, Associate Professor, Hanyang University, South Korea.
Methodology
This section describes the methods used to estimate religious composition at the country level, regionally and globally; our procedures for measuring religious groups’ demographic characteristics and their religious “switching” rates; as well as methodological challenges that we considered in some countries. The final section lists the 201 countries and territories that make up each of the six regions in our analysis.
This work was a collaboration between researchers at Pew Research Center and the Center for Advanced Studies of Population and Religion (CASPAR) at Krakow University of Economics.
A note on rounding
In most countries, it is not possible to precisely count the number of people who identify with each religion. Because our estimates are not precise, the tables in this report and accompanying data files show rounded population counts (often to the nearest 10,000) and show counts below 10,000 as “<10,000.” In the text, many estimates are rounded to the nearest million or percentage point.
How did you measure religious composition?
This report focuses on seven broad categories – Christians, Muslims, Hindus, Buddhists, Jews, adherents of other religions and religiously unaffiliated people. The “other religions” category includes Baha’is, Daoists (also spelled Taoists), Jains, Shintoists, Sikhs, Wiccans, Zoroastrians and many small groups, some of which can be described as folk or traditional religions. The religiously unaffiliated population – sometimes called “nones” – includes people who in surveys and censuses answer a religious affiliation question by saying they do not identify with any religion or that they are atheist or agnostic.
Censuses and surveys collect religious identity at different levels of specificity. For example, depending on the source, the most specific level of affiliation measured for a Southern Baptist could be Christian, Protestant, Baptist or Southern Baptist. Researchers coded all religious identities into the seven categories used in this report.
We rely on how people describe their own religious identity. Religious identity doesn’t line up perfectly with belief or practice. If someone identifies with a religious group, we classify them as part of that group regardless of their beliefs and practices. If someone self-identifies as Christian, we classify them as Christian whether or not they hold orthodox Christian beliefs or attend worship services. Similarly, if someone says they identify with no religion, we classify them as religiously unaffiliated even if they hold religious beliefs and attend worship services.
Most of our data comes from census and survey questions that measure religion using a direct question like “What is your religion, if any?” Direct, one-step measures of religious identity are more widely used than two-step measures that first ask a filter question such as, “Do you belong to a religion or religious denomination?”39
Sources used to measure religious composition
We use more than 2,700 data sources in this study. These sources include censuses; large-scale demographic surveys, which often survey more than 10,000 people; general population surveys, which typically survey 1,000 to 3,000 people; information from population registers; the World Religion Database; and government reports. For more information, read Appendix A.
As our team of demographers considered which sources to use in each country, we evaluated characteristics of the sources, including how they measured religious identity, how samples were drawn, the mode of data collection, the size of samples, and estimates of the size of groups across sources and across waves of surveys that were repeated.
We sought sources that collected data close to 2010 and 2020 using sound methods and robust samples. As much as possible, we wanted to maximize the comparability of sources across time periods within each country and to have similar types of sources within countries.
The countries and territories for which we used census data to estimate religious composition comprised 44% of all people in 2010 and 42% in 2020. Large-scale demographic surveys, including Demographic and Health Surveys (DHS), were our primary sources for 8% of the world’s people in 2010 and 10% in 2020. We used general population surveys to measure 44% of the world’s population in both 2010 and 2020.
The places for which we used World Religion Database (WRD) estimates as our primary source are home to 3% of the world’s people. Among the many types of information used to create WRD estimates are statistics gathered from religious communities and assessments from country experts. This type of information is especially valuable for countries like Cuba and North Korea, which have little or no publicly available, nationally representative survey data on religious composition.
For countries and territories home to less than 1% of the world’s people, we used a different kind of primary source. For Finland and Israel, we used data from population registers maintained by the governments of those countries (in Israel, religion data from the population register is merged into census reports). In Gulf Cooperation Council (GCC) countries, we relied on the estimates produced for our 2024 Center report “The Religious Composition of the World’s Migrants” to describe the religious makeup of migrants. Migrants made up about half of the region’s overall population as of 2020.
Special procedures for estimating the size of small religious groups
When religious groups make up a small share of a population, they are not necessarily measured reliably in surveys. For example, some immigrant populations may be underrepresented if they are not fluent in the languages in which a survey is conducted or because they are concentrated in refugee camps or other areas outside a survey’s sampling frame. Alternatively, a religious group with only a few thousand members in a country of many millions may not be reliably detected in a typical survey.
We consulted a range of sources to refine our estimates when some of the seven groups in our study made up a small share of a population. These sources include the World Religion Database, the religious demography sections of International Religious Freedom Reports from the U.S. State Department, the Yearbook of Muslims in Europe, and world Jewish population estimates published in annual editions of the American Jewish Year Book.
In some Western European countries, we used surveys to measure the religious composition of the native-born population combined with a separate procedure to estimate the religious composition of the foreign-born population. Our foreign-born population estimates frequently rely on estimates we made for the 2024 Center report “The Religious Composition of the World’s Migrants.” Read that report’s Methodology for details on how migrant religious composition estimates were made.
Children’s religion
While censuses often provide religion information on people of all ages, most surveys provide information on the religious composition only of adults. When primary sources provide direct information only about adult religious composition, we use indirect demographic estimation methods for the religious composition of children. For example, in many countries we use information about the age structure and fertility rates of women in different religious groups to estimate the proportion of each religious group in the child population. This approach assumes that children share their mother’s religion.
Using surveys of people of reproductive age to make general population estimates
Some demographic surveys, such as the Demographic and Health Surveys, gather data on everyone living in a household but measure religious affiliation only among the household members who are in their reproductive years. We used imputation methods to estimate the religious identities of other household members and of households that didn’t include anyone of reproductive age.
In most cases, all the adults who are surveyed in a household share the same religious identity. In these cases, a matching identity was applied to other household members. In cases where multiple religions were measured among multiple adults of reproductive age, assignment was based on a hierarchy of relationship closeness (in order: spouse, parent, child, other relative). For instance, if a male head of household was not asked about his religion because he was too old to be included in the fertility survey, but he lived with his Muslim reproductive-aged wife and his religiously unaffiliated nephew, his religious affiliation was assigned as Muslim.
For households in which there were no members of reproductive age, and therefore no information about religious identity was gathered, multiple imputation was applied using the multivariate imputation by chained equations (MICE) algorithm in Stata. There was enough information about adults not of reproductive age in households with adults of reproductive age to identify age, sex, marital status, educational attainment, household size, region and urbanicity as predictors of religion and to use them in the imputation. Five iterations were executed with these predictors (independent variables) for the missing data on religion. For example, in the 2018 DHS survey of Nigeria, 11% of individuals lived in households without anyone of reproductive age, so we imputed their religious identities using the MICE approach.
How did you measure religious change from 2010 to 2020?
We measure changes in the size of seven religious categories by calculating differences between our new 2020 estimates and our revised 2010 estimates for 201 countries and territories.
As we prepared our 2020 and 2010 estimates, we sought to maximize the similarity of the data sources and measurement methods used in each country for each time point. We wanted to measure real change rather than variation that could be the result of measurement differences, such as variation resulting from surveys or censuses using a one-step question about religious identity in one year and a two-step question in the other year.40
In previous reports, including our 2012 report “The Global Religious Landscape,” we presented religious composition estimates for 2010. We revised our previous 2010 composition estimates for the current report, using updated methods and data sources that weren’t available to us previously. For example, to better measure religious change in China, we have revised our approaches to measuring religion and no longer try to adjust figures from primary sources for populations that may be undercounted. Read Chapter 15 for more details.
Why do you use projections for some 2010 and 2020 numbers?
Generally speaking, Pew Research Center uses “estimates” to describe population statistics for a year in the past and “projections” to describe demographic modeling of what a population is expected to be in the future.
However, in some cases we created projections using older data to make 2020 estimates, because reliable data for 2020 was not available for all countries. In even rarer instances, we lacked a good source for 2010, so we used demographic methods to “back project” a population in 2010 using data from a more recent year. All our projections – both backward and forward – are based on differences by religion in age structure and fertility.
Highlighting substantial change at the country level
If a religious category’s share of a country’s population grew or shrank by at least 5 percentage points between 2010 and 2020, we consider this a substantial change. By using the same country-level threshold of at least 5 points, we describe change of comparable magnitude across contexts.
This threshold allows us to highlight notable change at the country level in the absence of statistical significance tests.
We did not conduct significance tests for a few reasons, the most important of which is the variability of the source data. For example, among countries that collected census data on religion in 2010 and 2020, relatively small changes – below 1 percentage point – would be statistically significant. On the other hand, among countries in which the best source of religious composition in each year is a survey of the adult population, statistically significant changes typically would need to be larger than 1 or 2 percentage points, since surveys have much less statistical power than censuses.
Moreover, our survey-based estimates include indirect estimates of the religious composition of children as well as estimates of small groups and migrants based on a mix of other sources. It would be difficult to perform statistical significance tests for differences between 2010 and 2020 estimates that combine direct and indirect estimation methods as well as data from multiple sources.
Why do Pew Research Center numbers sometimes vary from published census numbers?
One reason our numbers may differ from published census figures is that we exclude responses from people who do not answer a religious identity question. Some countries that measure religion in their census make clear that answering the religion question is optional. Census agencies often report results based on the overall population rather than just people who provided an answer to the religion question. For example, published religion results from the 2021 census of England and Wales show that 6% of people fell into the “not answered” category.41 We don’t know which mix of our seven religion categories best describe the people who don’t answer religion questions. By treating this missing data as invalid, we effectively assume that the people who don’t answer census religion questions have a similar mix of religious identities as those who do provide answers.
To estimate religious composition by each five-year age and sex cohort in a population (e.g., men ages 25 to 29 and women ages 40 to 44), we begin with data on age, sex and religion from surveys and censuses. In some cases, we use a combination of multiple datasets and demographic smoothing techniques to make age structure estimates for each year (2010 and 2020). We typically use these approaches to compensate for data limitations that emerge when using a general population survey to describe many cohorts in each country.
Fertility
We present data on fertility differences by religious category to help explain trajectories of population growth from 2010 to 2020. The estimates of 2010 to 2015 fertility in this report were prepared for our earlier report “The Future of World Religions: Population Growth Projections, 2010-2050.”
Fertility data was gathered from censuses and surveys, and fertility rates were estimated via direct and indirect measures. Some censuses and surveys directly measure recent births, or the count of children a woman has ever given birth to, at the time of the survey. In other cases, fertility data was gathered indirectly, for example, by using data on the age of a mother’s children to estimate her past birth patterns. These various sources of fertility data were used to estimate age-specific and total fertility rates for religious groups in each country.42
In many countries, data on differential fertility is available for the largest religious groups but sufficient detail is not available for all minority religious groups. In Nigeria, for example, more than 98% of women of reproductive age are either Christian or Muslim, and there is sufficient data for estimating fertility for these two groups. For other religious groups in Nigeria, however, researchers had to base estimates on more limited data.
In some countries, data on differences in fertility by religion was not available. In these cases, researchers applied prevailing national fertility rates to all religious groups equally.
Migration
Estimates of the religious composition of migrants are drawn from our 2024 report “The Religious Composition of the World’s Migrants.” Those estimates were made using migrant stock estimates from the United Nations as well as data from 270 censuses and surveys. Read that report’s Methodology for more details.
Mortality (life expectancy)
Mortality patterns can be described with data on the rate of deaths experienced by various age groups in a population in a given period. To provide a snapshot of mortality patterns in a period, it is convenient to transform these period death rates into statistics about the expected longevity implied by these rates – life expectancy at birth.
Because no global data is available on how life expectancy varies by religion within countries, we estimate global life expectancy for each religious group by assuming that people in all religious groups have the average life expectancy of the country in which they live.
Therefore, global differences in life expectancy between religious groups reflect their geographic concentrations. For instance, the relatively high life expectancy of Jews reflects the fact that the vast majority of the world’s Jews live in either the United States or Israel – both of which are places where life expectancy is above the global average.
How did you measure religious ‘switching’?
In this report, religious “switching” refers to a change between the religious group in which a person says they were raised (during their childhood) and their religious identity now (in adulthood). We use the term “switching” rather than “conversion” because many people who switch identities leave a religion and become religiously unaffiliated, and also because the changes often take place without any formal declaration or ritual.
We count changes between seven large religious categories (such as from Buddhist to Christian, or from Hindu to religiously unaffiliated) but not switching within the same category (such as from Protestant to Catholic).
Rates of religious switching are calculated using responses to two questions that have been consistently included in Pew Research Center surveys (“What is your religion, if any?” and “Thinking about when you were a child, in what religion were you raised?”) and in International Social Survey Programme (ISSP) surveys (“What is your religion” and “What religion, if any, were you raised in?”).
In China, we take a slightly different approach. The 2018 Chinese General Social Survey does not include the same type of measure of childhood religion. Instead, we use responses to the question, “What was your mother’s religion when you were 14?” as a proxy. 43
In this analysis, we looked at the switching of adults under 55 as a way of focusing on switching that has happened in recent decades. Among survey respondents who have changed religion, we don’t have data on the age at which they switched. Religious changes can occur at any age, but previous studies have found that religious switching is more common among young adults than among older adults. Therefore, the religious switches reported by people ages 55 and older probably occurred longer ago, on average, than religious switches reported by people under 55.44
The surveys we analyze do not allow us to isolate the religious switching that took place exclusively between 2010 and 2020. Rather, they provide an overview of switching patterns that have shifted religious landscapes in recent decades, including over the period from 2010 to 2020.
Sources used to measure religious switching
Our switching analysis is based on data from 117 countries and territories, including 96 Pew Research Center surveys conducted between 2009 and 2024, 20 ISSP surveys conducted in 2008 or 2018, and the 2018 Chinese General Social Survey.45
For places with multiple surveys available, sources were chosen based on recency, sample size, and consistency with estimates from other surveys. For example, to estimate rates of religious switching in the United States, we use data from the 2023-24 Religious Landscape Study instead of the 2024 American Trends Panel because the former has a larger sample size, allowing us to reliably estimate switching patterns among U.S. Hindus, Muslims and Buddhists. (Read Appendix A for a list of countries and source information.)
Together, these 117 surveys provide samples in countries that encompass 92% of the global adult population (ages 18 to 54) in 2010, including almost all Hindus, 98% of religiously unaffiliated people and 93% of Christians. Coverage is also high for Muslims (82%) and Buddhists (85%). In the report, results for Jews and members of other religions are not shown.46
Aggregating switching rates to the global level
To quantify how common switching in and out is for each religion, we first computed country-level results for each religious category available in the data, with survey weights applied. Using information about respondents’ childhood religion and current religion, we calculated the rates of switching among religious groups in a country, including the percentage of people who were raised in a particular religion and the percentage of people who currently identify with this religion, as well as the percentage of people who left and entered each group. Read, for example, the accompanying table “Rates of religious switching in the United States.”
For the 84 countries where religious switching data is not available, we applied the assumption of no switching between any religious groups (i.e., by assigning the share of people who left or entered as 0% for all religions). For instance, in Saudi Arabia, where switching data is not available, we assumed no switching among religious groups. For the distribution of religious upbringing and current religious affiliation, we used our composition estimates among populations ages 18 to 54 in Saudi Arabia for the year 2010 as a proxy, as shown in the accompanying table.
To aggregate country-level results into global rates of religious switching, we weighted the data from each country proportionately to each country’s share of all people age 18 to 54 in the world as of 2010.47 The accompanying table presents the distribution of religious groups and their switching patterns in this aggregated dataset. Note that estimates do not represent the global religious composition of a particular year because the datasets analyzed were collected over a 17-year period.
Lastly, using these global percentages, we calculated the global rates of joining and leaving relative to each religion per 100 people raised in the group. This perspective allows us to compare the extent to which people move into and out of different religious groups, and how much each group has grown or declined due to religious switching. In the report Overview, we focus on the simplified ratio of people who have joined and left each group. This perspective makes it easy to compare the patterns of joining and leaving across groups.
Some readers may wonder whether large margins of sampling error for relatively small religious groups in some countries could affect our global switching results. Indeed, many of the surveys with switching data have a sample size of 1,000 to 3,000 respondents ages 18 and older, and the estimated percentages of people who were raised in, left, entered or currently are in a religion can be imprecise for small groups. This is especially true for religious groups that are heavily concentrated in a few countries, such as Hindus, Buddhists and Jews. For instance, the switching results for Hindus in European and African countries with small Hindu populations may be unreliable because fewer than 1% of adults in the sample were raised Hindu or currently identify as Hindu. However, these estimates have little impact on global patterns of switching among Hindus, because they are weighted to reflect the relative size of each country’s Hindu population when the country-level results are aggregated to the global level.
We conducted sensitivity tests to ensure the robustness of our switching estimates. This sensitivity analysis showed that because of their small sample size in most surveys, results for Jews and adherents of other religions are unstable. Therefore, we do not show global results for these two groups. (For an overview of switching into and out of Judaism in Israel and the U.S., read “Around The World, Many People Are Leaving Their Childhood Religions.”)
Global estimates for the “other religions” category vary widely depending on which countries are included in the analysis. “Other religions” is an umbrella category containing a wide variety of religions other than Buddhism, Christianity, Hinduism, Islam and Judaism. The instability of the results for this aggregate reflects the fact that religious groups constituting the “other religions” category differ from one place to another. For instance, in India, most of the adherents of other religions are Sikhs and Jains, and there is little religious switching – roughly nine-in-ten of those raised in other religions have remained in their childhood faith – according to our 2021 study on religion in India. On the other hand, in Taiwan, this category includes many Daoists, and about half of Taiwanese people who say they were raised Daoist no longer identify as Daoist, according to our 2023 study “Religion and Spirituality in East Asian Societies.”
Did any countries require special consideration?
Our research team considered the unique measurement challenges posed by the strengths and weaknesses of the data available for each of 201 countries and territories. Below we discuss some interesting cases. Although we don’t discuss every country, these examples provide a glimpse into the range of issues we considered.
China
In this report, our estimates of China’s religious composition are primarily based on the religious (zongjiao) identity measure from the 2010 and 2018 Chinese General Social Survey (CGSS).48 This is a different approach to measuring religion in China than we used in our 2012 report “The Global Religious Landscape,” and in our 2015 report “The Future of World Religions: Population Growth Projections, 2010-2050.” In the earlier studies, we relied on belief and practice measures from surveys to estimate the numbers of Buddhists and adherents of folk religions, and we used ethnicity data from the Chinese census to approximate the size of China’s Muslim population, which predominantly consists of 10 ethnic minority groups that traditionally practice Islam.
In this report, for comparability with religious composition estimates around the world, we updated our strategy for China and relied on direct estimates from the CGSS for all religious groups. Because the CGSS includes a larger share of Muslim ethnic minorities than China’s census, and the default survey weight does not correct for this imbalance, we modified the weight in the CGSS to ensure the accuracy of our estimate for Muslims. Specifically, we reweighted the CGSS sample so that the share of adults in predominantly Muslim ethnic groups aligns with their representation in the national census.
Most Muslims in China belong to the Hui and Uyghur ethnic groups. Based on data from the 2010, 2012, 2017 and 2018 waves of the CGSS, more than 9-in-10 Hui and Uyghur adults identify as Muslim. By contrast, self-reports of Muslim identity are rare (less than 0.5%) among the Han ethnic group, which makes up a majority of China’s population. Most Uyghur people live in Xinjiang, a provincial unit that the CGSS has not surveyed since 2013. We do not have any information about whether restrictive Chinese government policies in Xinjiang have reduced rates of Muslim identification among Uyghurs and other traditionally Muslim ethnic groups in the region. (For more details about the weight adjustment and our new method of measuring the number of Chinese Muslims, read the “Estimating Islam in China” section of our 2023 report, “Measuring Religion in China.”)
We acknowledge the limitations of using the religious (zongjiao) identity measure to estimate China’s religious landscape. Our research shows that this measure does not capture Chinese people who may hold religious beliefs and engage in religious practices but do not consider themselves to be affiliated with any religion in a formal sense. Meanwhile, some scholars argue that Chinese surveys that ask about religious (zongjiao) identity may undercount Christians, because some Christians – particularly those who worship in unauthorized churches – may not agree to be interviewed or may not divulge their religious identity to interviewers. Asking survey respondents whether they have a formal religion (zongjiao) also produces a conservative estimate of the number of people in China who practice elements of Buddhism, as discussed in the “How many Buddhists are there in China?” section of our 2023 report. Nevertheless, the zongjiao identity measure has several benefits. It does appear to capture respondents who feel formally affiliated with religion and are actively engaged in religious beliefs and practices. Additionally, zongjiao measures generate results that are relatively stable across surveys, which suggests they can provide reliable information about religious change over time.49
Egypt measures religion in its decennial census. However, in recent decades, the Egyptian government has not published these results, including from the most recent census conducted in 2017.
The Christian share of Egypt’s total population, as measured in the country’s census, has been steadily declining since 1927, when 8.3% of Egyptians reported being Christian. Moreover, past censuses and demographic surveys consistently have indicated that Egyptian Christians tend to be older and have fewer children than the country’s Muslim majority.
Nonetheless, for many years, journalists and government leaders have reported that 10% of Egypt’s population is Christian. Officials of the Coptic Orthodox Church sometimes claim the Christian population is even larger.
We were able to access religion results from Egypt’s 2006 census via the IPUMS data archive. In 2006, about 5% of Egyptian census respondents identified as Christian. Egypt’s religion results in this report are projected from the 2006 census.
Gulf Cooperation Council countries
The six countries in the Gulf Cooperation Council (GCC) – Bahrain, Kuwait, Oman, Qatar, Saudi Arabia and the United Arab Emirates – share similar data limitations. We applied the same method to all but one GCC country to estimate their overall religious compositions. (Census data about religion was available for Bahrain.)
Census and survey data on the religious affiliation of residents in GCC countries is generally not collected, not made available to outside researchers and/or not inclusive of the large migrant populations living there. The available information on citizens of GCC countries shows that they nearly always identify as Muslim. In Bahrain’s 2020 census, which measured only whether respondents were Muslim or not, 99.7% of citizens identified as Muslim, as did 50.9% of non-citizens. Every GCC country has a Muslim majority. Their legal and social systems are influenced by Islamic law to varying degrees, but all have consistently high levels of restrictions on religion, according to Pew Research Center studies. For example, all GCC countries have a law against blasphemy, and all but one (Bahrain) also bans apostasy (giving up or changing one’s religion).
The GCC countries have thriving economies and strong demand for foreign labor, and all attract many migrants. Migrants made up about half of the region’s 2020 population.
To overcome these data challenges, we calculated the religious compositions of most GCC countries by making two assumptions: Native-born residents are all Muslim, and foreign-born residents have the religious composition we estimated in a previous report on the religious composition of migrants by origin-and-destination country pairings. We subtracted the total number of immigrants (based on the UN’s “International Migrant Stock 2020” report) from the country’s total population (based on the 2022 update to the UN’s World Population Prospects, the most current version available at the time) to disaggregate residents by nativity. We then applied religious distributions to native- and foreign-born populations separately to arrive at estimates for the countries overall.
India
We relied on census data on religion for our India estimates. Because India’s 2021 census was delayed by the COVID-19 pandemic, our 2020 estimates are based on population projections from the religious composition in the earlier 2011 census.
There are known issues with census data on religion in India. Christians in particular appear to be undercounted; some Christians who belong to Scheduled Castes may choose to identify as Hindu when completing official forms such as the census. This is due to a mandate in the Indian Constitution specifying that only Hindus, Sikhs and Buddhists can receive some types of caste-based government affirmative action benefits (known in India as “reservations”). In our 2012 report “The Global Religious Landscape” and our 2015 report “The Future of World Religions: Population Growth Projections, 2010-2050,” we accounted for this by estimating that 10% of Christians in India state their affiliations as Hindu in the census and by adjusting the population figures accordingly.
Consistent with our 2021 report “Religious Composition of India,” this report relies on unadjusted numbers, due to the uncertainty surrounding how a bias in responses might have changed over time. Simply put, there may be an undercount of Christians in any given census, but we don’t know how big it is, and we also don’t know whether it is increasing or decreasing from one census to the next. To assess change over time in the country’s religious composition, it may be better (and more transparent) just to compare the unadjusted census figures.
Iran’s national census is the source of our religious composition estimates for the country. In the census, more than 99% of residents formally identify as Muslim.
We are aware of data describing a different picture. Recent surveys conducted by The Group for Analyzing and Measuring Attitudes in Iran (GAMAAN) paint a very different Iranian religious landscape. GAMAAN assumes that legal pressures influence how Iranian respondents answer the census and that “fear of the state” could affect responses to most surveys in Iran. Therefore, the group uses anonymous, nonprobability, online surveys to measure religion in the Iranian population. In the U.S. context, nonprobability polls can produce misleading results. However, in an effort to make the Iranian results nationally representative, GAMAAN weights the results to census and workforce parameters. Across surveys conducted in 2020, 2022 and 2023, the research group finds that a considerable share of Iran’s population does not identify as Muslim.
GAMAAN’s surveys provide an intriguing perspective on Iran’s religious landscape, but they are not suitable for measuring religious change from 2010 to 2020. GAMAAN did not conduct surveys around 2010. Furthermore, GAMAAN’s findings have not yet been replicated by other research organizations. Some of the most anomalous results, such as a relatively large share of Zoroastrians, have led scholars to wonder whether “participating in surveys beyond the government’s control” gave discontented Iranians an opportunity for “performing alternative identity aspirations.”
Israel
Our estimates for Israel come from the country’s Central Bureau of Statistics (CBS), which provide religion data from the Ministry of Interior’s population register. This data includes estimates for the country’s Jewish, Muslim, Christian and Druze populations. However, it counts as Jews only those who meet halakhic (religious) legal criteria – i.e., children of Jewish mothers as well as people who have undergone formal conversions recognized by the authorities.50 Consequently, the register data may count some people as Jewish even if they do not self-identity as Jewish by religion. At the same time, some Israelis who identify religiously as Jewish are not classified as Jewish based on halakhic criteria. (For more about how we estimate the Jewish population around the world, read Chapter 8.)
In Israel, as in other countries and territories, our estimates of the total number of residents come from the United Nations’ World Population Prospects (WPP), produced by the Population Division of the UN secretariat. The UN’s population figures are usually close to those published by each country’s census bureau or statistical agency. However, Israel’s Central Bureau of Statistics counts everyone living in East Jerusalem as part of its population, while the UN counts Arabs living in East Jerusalem as part of the population of the Palestinian territories and does not include them in Israel’s population. Both the UN and the Central Bureau of Statistics (CBS) count Jews living in the West Bank and Golan Heights as part of Israel’s population.
We followed the procedure below to reconcile the discrepancy in the total population estimates from the CBS and the UN. First, we deducted the Arab population living in East Jerusalem from CBS’s religion data using religious composition estimates of East Jerusalem’s Arab population compiled by the Jerusalem Institute. Next, we recalculated the country’s religious composition after excluding the Arab population living in East Jerusalem, which resulted in a slightly higher estimate of the Jewish share of Israel’s population in 2010 and 2020 than the CBS reported. Finally, we applied this religious distribution to the UN’s total population figure. This procedure was used for both the 2010 and 2020 estimates.
Lebanon
We took a similar approach to estimating the religious makeup of the total population of Lebanon as we did for GCC countries. About 30% of the country’s residents are immigrants. Lebanon hosts more Syrian refugees than any country except Turkey, as well as the world’s third-largest population of refugees from the Palestinian territories. We relied on a Pew Research Center survey that measured the religious composition of residents but provided limited coverage of the refugee population living in the country due to security concerns in areas where many refugees live. To account for this limitation in the survey data, we separated the native- and foreign-born populations. We applied the religious composition of the survey respondents to all native-born residents, and we applied our estimate of the religious makeup of migrants in Lebanon to all foreign-born residents.
Russia
The 2011 and 2019 waves of the ISSP were our main sources of religious composition data for Russia. To refine estimates of Russia’s religious minorities, we adjusted our estimates to account for census data on the size of various ethnic groups and survey data on the shares of Muslims and other religious minorities in those ethnic groups. We also slightly adjusted the count of Russian Jews to reflect Israeli demographer Sergio DellaPergola’s estimates, which he prepared for “World Jewish Population” chapters in the American Jewish Year Book.
Sweden
In Sweden, we began by estimating the religious composition of native-born residents using ISSP survey data. To estimate the religious composition of foreign-born residents, we used a combination of national register data on country of birth and estimates about the religious identity of immigrants to Sweden from our report “The Religious Composition of the World’s Migrants.” We combined these estimates and then refined the figures for Muslims, Buddhists and Hindus using population register data about native-born descendants of immigrants who came to Sweden in recent generations. This population register analysis was conducted by Erling Häggström Gunfridsson of Umea University.
United States
The U.S. census does not ask Americans about religion, but Pew Research Center has conducted many surveys measuring the U.S. religious landscape. Demographic estimates for the size of the Christian and religiously unaffiliated populations in 2020 come from our 2022 report “Modeling the Future of Religion in America” and are based on surveys of U.S. adults who are part of the Center’s American Trends Panel (ATP). Results are then weighted to our National Public Opinion Reference Survey (NPORS) and adjusted to include children. Christians and religiously unaffiliated people combined made up 94% of the U.S. population in 2020.
Despite its large number of panelists and rigorous sampling strategy, the ATP was not our best source for estimating the population sizes of Buddhists, Hindus, Jews, Muslims and people of other religions, who together make up 6% of the U.S. population. These smaller (and sometimes hard-to-reach) populations were better represented in specialized surveys.
Most Buddhist and Hindu residents of the U.S. are Asian American, and many are immigrants. Because ATP surveys are only conducted in English and Spanish, Asian Americans on the ATP may not be representative of all Asian Americans religiously. Pew Research Center in 2023 conducted a large survey of Asian Americans in Chinese (Simplified or Traditional), English, Hindi, Korean, Tagalog and Vietnamese. The religious composition of Asian Americans in this survey differed from those in the ATP. We incorporated information from this population-focused survey, along with U.S. Census Bureau estimates of the size of the Asian American population, into our 2020 estimates of U.S. Buddhists and Hindus.
Pew Research Center has conducted multiple studies of Jewish and Muslim Americans based on surveys focused on those populations. These surveys are advantageous because they include many more American Jews and Muslims than are on the ATP (since Jews and Muslims make up only about 2% and 1% of the U.S. population, respectively) and were offered in languages familiar to large immigrant groups within these religions, including Arabic, Farsi, Russian and Urdu, as well as Spanish and English. Information from these surveys was used to estimate the size of the 2020 Jewish and Muslim populations in the U.S. We classified the remaining 1% of the population as belonging to the “other religions” category.
How do you define regions, countries and territories?
The word “country” in this report refers to all countries recognized as such by the United Nations. The word “territory” in this report does not have a technical definition. Rather, it is a general term for distinct geographical entities that the UN doesn’t recognize as countries, but for which it provides separate population estimates. Territories in this report include such entities as Hong Kong and Macao (special administrative regions of China), Greenland (an autonomous constituent country within the Kingdom of Denmark) and the Commonwealth of Puerto Rico (an unincorporated territory of the United States).
List of countries and territories in each region
This report groups 201 countries and territories into six major regions: Asia and the Pacific, Europe, Latin America and the Caribbean, the Middle East and North Africa, North America and sub-Saharan Africa.
The 50 countries and territories in the Asia-Pacific region are: Afghanistan, Armenia, Australia, Azerbaijan, Bangladesh, Bhutan, Brunei, Cambodia, China, Cyprus, Federated States of Micronesia, Fiji, French Polynesia, Guam, Hong Kong, India, Indonesia, Iran, Japan, Kazakhstan, Kiribati, Kyrgyzstan, Laos, Macao, Malaysia, Maldives, Mongolia, Myanmar (also called Burma), Nepal, New Caledonia, New Zealand, North Korea, Pakistan, Papua New Guinea, Philippines, Samoa, Singapore, Solomon Islands, South Korea, Sri Lanka, Taiwan, Tajikistan, Thailand, Timor-Leste, Tonga, Turkey, Turkmenistan, Uzbekistan, Vanuatu, and Vietnam.
The 42 countries and territories in Europe are: Albania, Austria, Belarus, Belgium, Bosnia-Herzegovina, Bulgaria, Channel Islands, Croatia, Czech Republic, Denmark, Estonia, Finland, France, Georgia, Germany, Greece, Hungary, Iceland, Ireland, Italy, Kosovo, Latvia, Lithuania, Luxembourg, Malta, Moldova, Montenegro, Netherlands, North Macedonia, Norway, Poland, Portugal, Romania, Russia, Serbia, Slovakia, Slovenia, Spain, Sweden, Switzerland, Ukraine, and United Kingdom.
The 37 countries and territories in Latin America and the Caribbean are: Argentina, Aruba, Bahamas, Barbados, Belize, Bolivia, Brazil, Chile, Colombia, Costa Rica, Cuba, Curacao, Dominican Republic, Ecuador, El Salvador, French Guiana, Grenada, Guadeloupe, Guatemala, Guyana, Haiti, Honduras, Jamaica, Martinique, Mexico, Nicaragua, Panama, Paraguay, Peru, Puerto Rico, St. Lucia, St. Vincent and the Grenadines, Suriname, Trinidad and Tobago, U.S. Virgin Islands, Uruguay, and Venezuela.
The 20 countries and territories in the Middle East and North Africa are: Algeria, Bahrain, Egypt, Iraq, Israel, Jordan, Kuwait, Lebanon, Libya, Morocco, Oman, Palestinian territories, Qatar, Saudi Arabia, Sudan, Syria, Tunisia, United Arab Emirates, Western Sahara, and Yemen.
The two countries and territories of North America are: Canada and the United States.
The 50 countries and territories of sub-Saharan Africa are: Angola, Benin, Botswana, Burkina Faso, Burundi, Cameroon, Cape Verde, Central African Republic, Chad, Comoros, Democratic Republic of the Congo, Djibouti, Equatorial Guinea, Eritrea, Eswatini, Ethiopia, Gabon, Gambia, Ghana, Guinea, Guinea-Bissau, Ivory Coast, Kenya, Lesotho, Liberia, Madagascar, Malawi, Mali, Mauritania, Mauritius, Mayotte, Mozambique, Namibia, Niger, Nigeria, Republic of the Congo, Reunion, Rwanda, São Tomé and Príncipe, Senegal, Seychelles, Sierra Leone, Somalia, South Africa, South Sudan, Tanzania, Togo, Uganda, Zambia, and Zimbabwe.