Pew Research Center

FOR RELEASE FEBRUARY 26, 2025

Decline of Christianity in the U.S. Has Slowed, May Have Leveled Off

Findings from the 2023-24 Religious Landscape Study

BY Gregory A. Smith, Alan Cooperman, Becka A. Alper, Besheer Mohamed, Chip Rotolo, Patricia Tevington, Justin Nortey, Asta Kallo, Jeff Diamant and Dalia Fahmy

FOR MEDIA OR OTHER INQUIRIES:

Communications Department
202.419.4372
www.pewresearch.org

RECOMMENDED CITATION

Pew Research Center, February 2025, "Decline of Christianity in the U.S. Has Slowed, May Have Leveled Off"

About Pew Research Center

Pew Research Center is a nonpartisan, nonadvocacy fact tank that informs the public about the issues, attitudes and trends shaping the world. It does not take policy positions. The Center conducts public opinion polling, demographic research, computational social science research and other data-driven research. It studies politics and policy; news habits and media; the internet and technology; religion; race and ethnicity; international affairs; social, demographic and economic trends; science; research methodology and data science; and immigration and migration. Pew Research Center is a subsidiary of The Pew Charitable Trusts, its primary funder.

© Pew Research Center 2026

Table of contents

  • About Pew Research Center
  • Executive summary
  • Executive summary
  • I. Religious affiliation and religious switching
  • 1. Religious identity
  • 2. Religious switching
  • 3. Identifying with a religion because of culture, ethnicity or family background
  • II. Religion and family life
  • 4. Religious intermarriage
  • 5. Religious upbringing and childhood education
  • 6. Religion, fertility and child-rearing
  • III. Religious or spiritual beliefs and practices
  • 7. Importance of religion and the Bible
  • 8. Religious attendance and congregational involvement
  • 9. Race and ethnicity in religious congregations
  • 10. Prayer and other religious practices
  • 11. Religious and spiritual beliefs
  • 12. Spiritual experiences
  • 13. Spiritual activities
  • 14. Spiritual and religious self-descriptions
  • IV. Social and political views
  • 15. Religion, partisanship and ideology
  • 16. Religion and views on LGBTQ issues and abortion
  • 17. Religion and views on gender, parenting and workforce participation
  • 18. Religion and views on immigration and diversity
  • 19. Religion and views on the environment
  • 20. Religion and views on the role of government
  • V. Opinions on religion's place in society
  • 21. Religion and views of right and wrong
  • 22. Religion’s role in public life
  • 23. Religion and views of science
  • VI. Demographics of U.S. religious groups
  • 24. Age, race, education and other demographic traits of U.S. religious groups
  • Acknowledgments
  • Acknowledgments
  • Methodology
  • Methodology
  • Appendices
  • Appendix A: Comparing results across Religious Landscape Studies
  • Appendix B: Classification of Protestant denominations
  • Appendix C: Comparing the Center’s religion trends with those of other major surveys
  • Decline of Christianity in the U.S. Has Slowed, May Have Leveled Off

Decline of Christianity in the U.S. Has Slowed, May Have Leveled Off

Findings from the 2023-24 Religious Landscape Study

How we did this

Pew Research Center conducts the Religious Landscape Study (RLS) to provide authoritative estimates of the U.S. population’s religious composition, beliefs and practices.

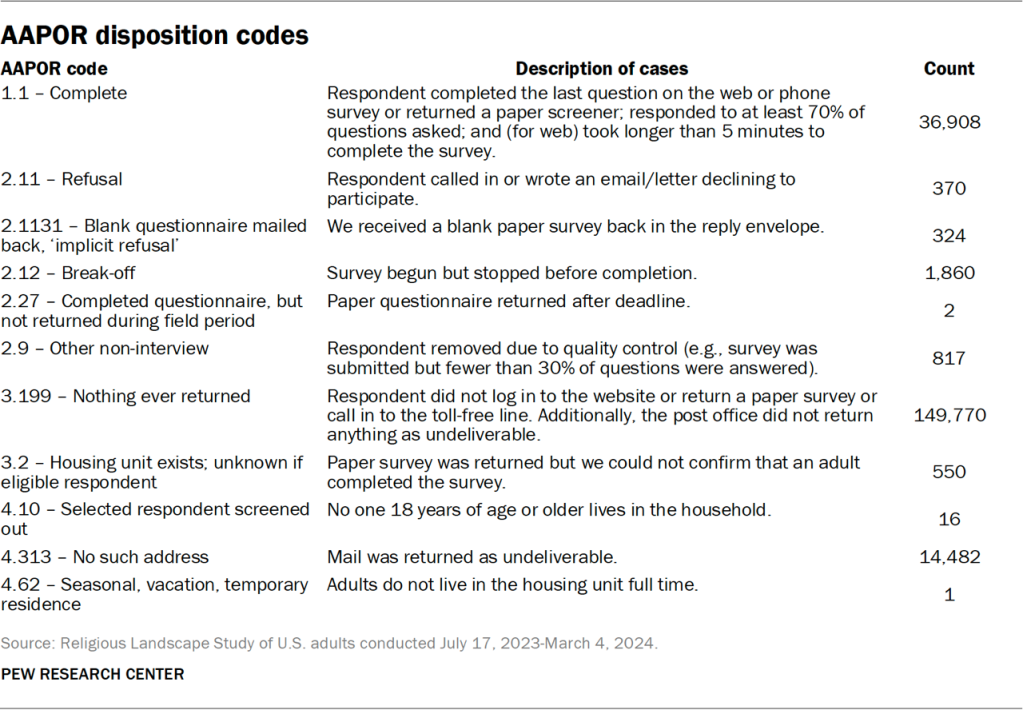
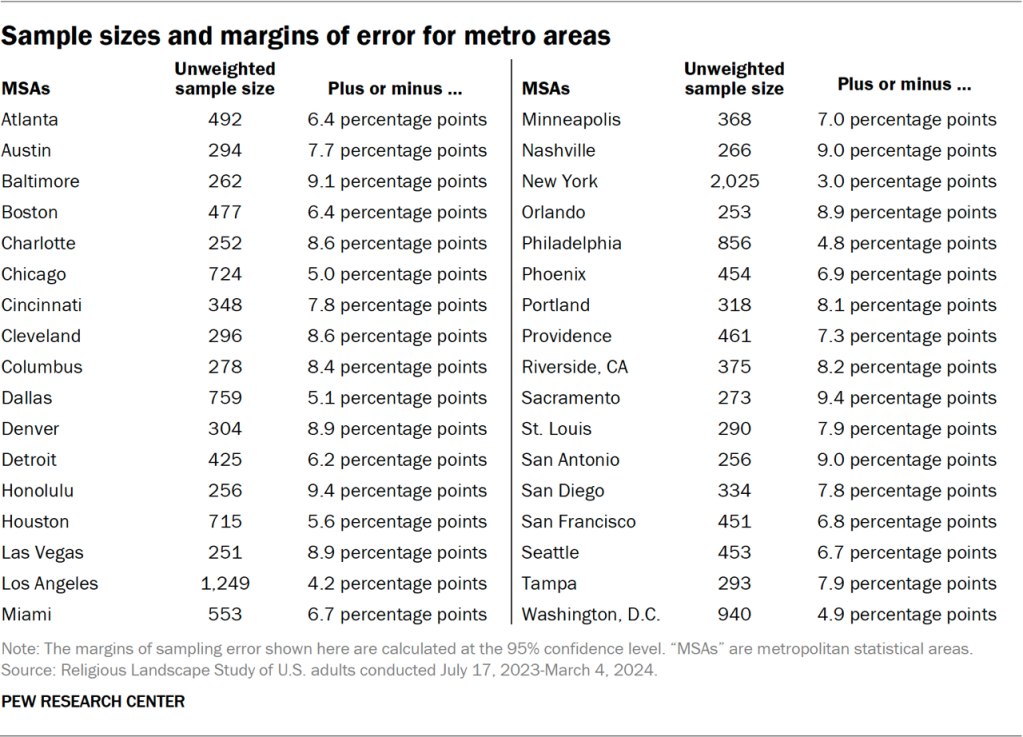
The new RLS was conducted in English and Spanish from July 17, 2023, to March 4, 2024, among a nationally representative sample of 36,908 respondents.

Our two previous Religious Landscape Studies, conducted in 2007 and 2014, were administered entirely by telephone. Because response rates to telephone surveys have dropped sharply over the past decade, we changed the design of the RLS in 2023-24.

To recruit people to take the survey, we used a method known as address-based sampling (ABS). This involved mailing invitation letters to randomly sampled addresses from the United States Postal Service’s Computerized Delivery Sequence File. This approach gave nearly all U.S. adults a chance of being selected to participate in the survey.

People who received our invitation had the option of completing the survey online, on paper, or by calling a toll-free number and completing the survey by telephone with an interviewer. In total, 25,250 respondents participated online, 10,733 completed the survey on paper, and 925 participated by phone.

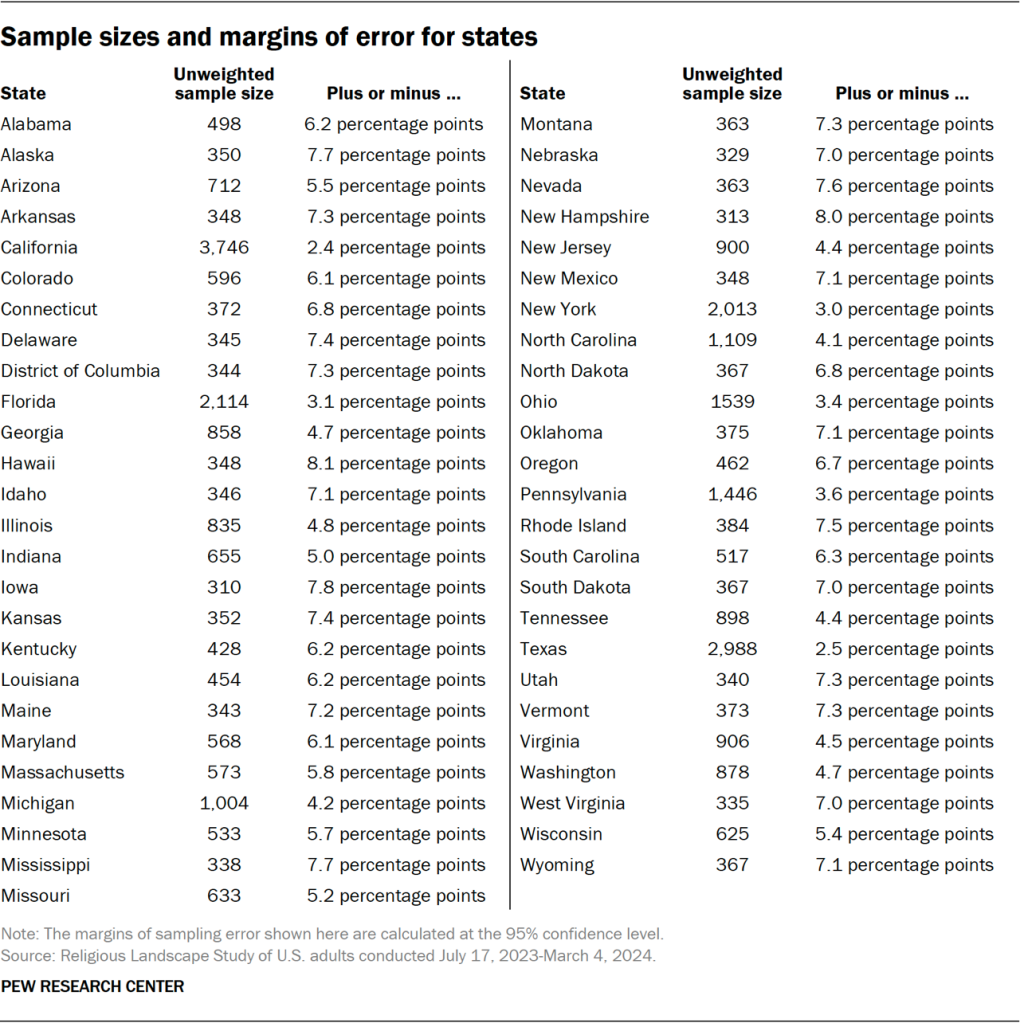
The survey is designed to be representative of all 50 states and the District of Columbia. The study’s large size also makes it possible to describe the religious characteristics of 34 large metro areas

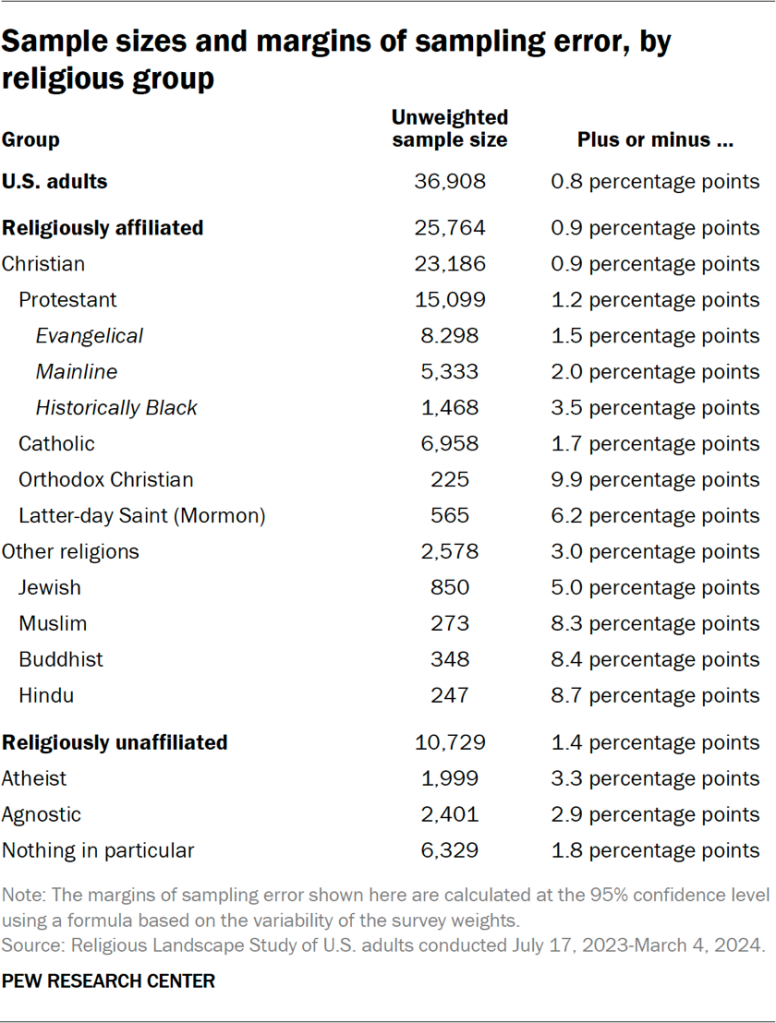
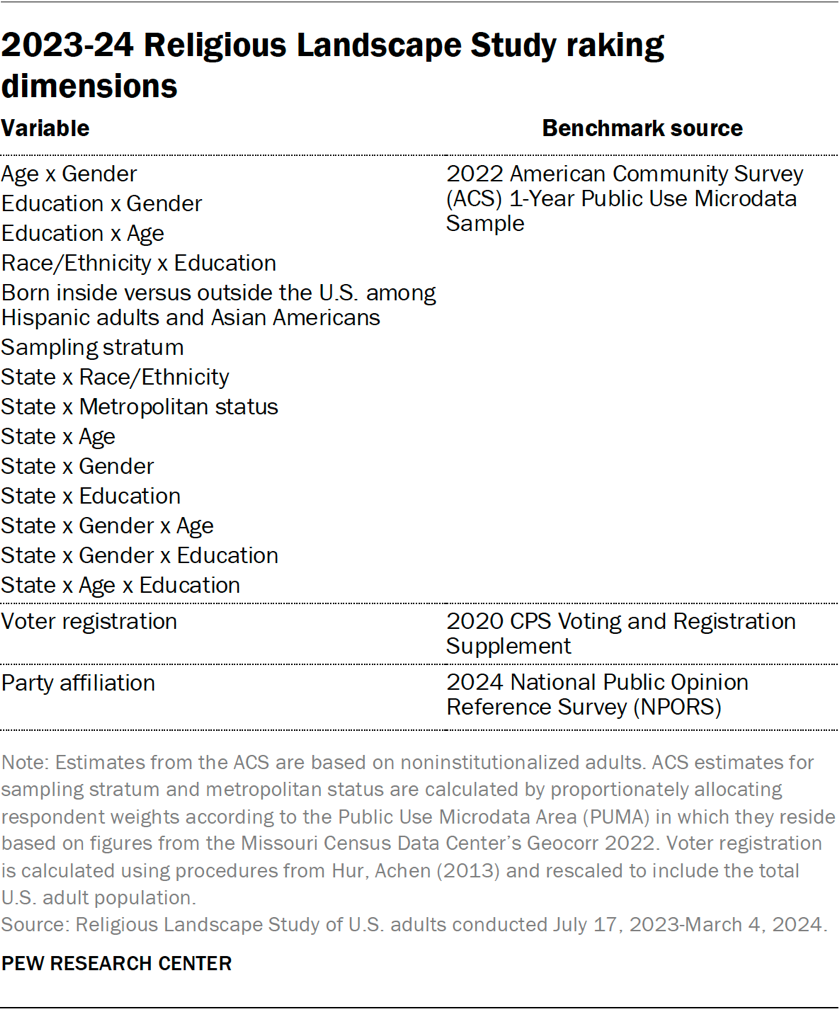
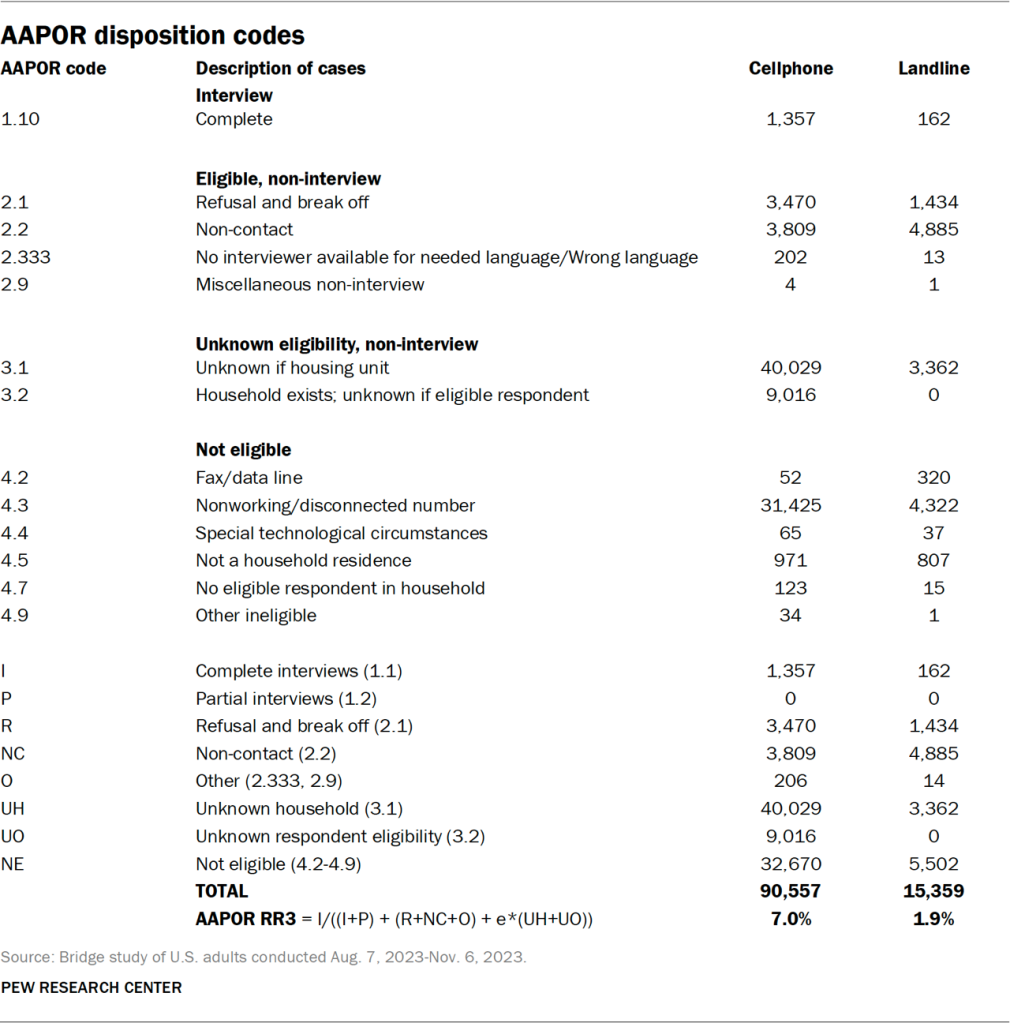
The data is weighted (using benchmarks from the U.S. Census Bureau and other sources) to be representative of the adult population of each state (and D.C.) and the overall U.S. adult population by gender, age, race, ethnicity, education and other categories. The survey’s margin of error for results based on the full sample is plus or minus 0.8 percentage points. The response rate is 20%.

For more details, refer to the Methodology.

Previous research has shown that people may answer some questions differently when completing a survey online or on paper than they do when speaking to a live interviewer over the phone. This means that when we compare data from the three landscape studies to see how Americans’ religious beliefs and practices have changed over time, we must consider the possible effects of changing the primary mode of interviewing from telephone (in 2007 and 2014) to online and on paper (in 2023-24). These “mode effects” can be quite large on some survey questions but small or nonexistent on others.

To help determine whether the results of particular questions in the new RLS are – or are not – directly comparable with our previous landscape studies, we conducted a nationwide telephone survey alongside the RLS. It included all the questions in the 2023-24 RLS that previously appeared in the 2007 and 2014 surveys. We used the findings of this experimental “bridge study” to inform the discussion of long-term trends throughout this report. For more details, go to Appendix A.

This report was made possible by The Pew Charitable Trusts, which received support from the Lilly Endowment Inc., Templeton Religion Trust, The Arthur Vining Davis Foundations and the M.J. Murdock Charitable Trust.

After many years of steady decline, the share of Americans who identify as Christians shows signs of leveling off – at least temporarily – at slightly above six-in-ten, according to a massive new Pew Research Center survey of 36,908 U.S. adults.
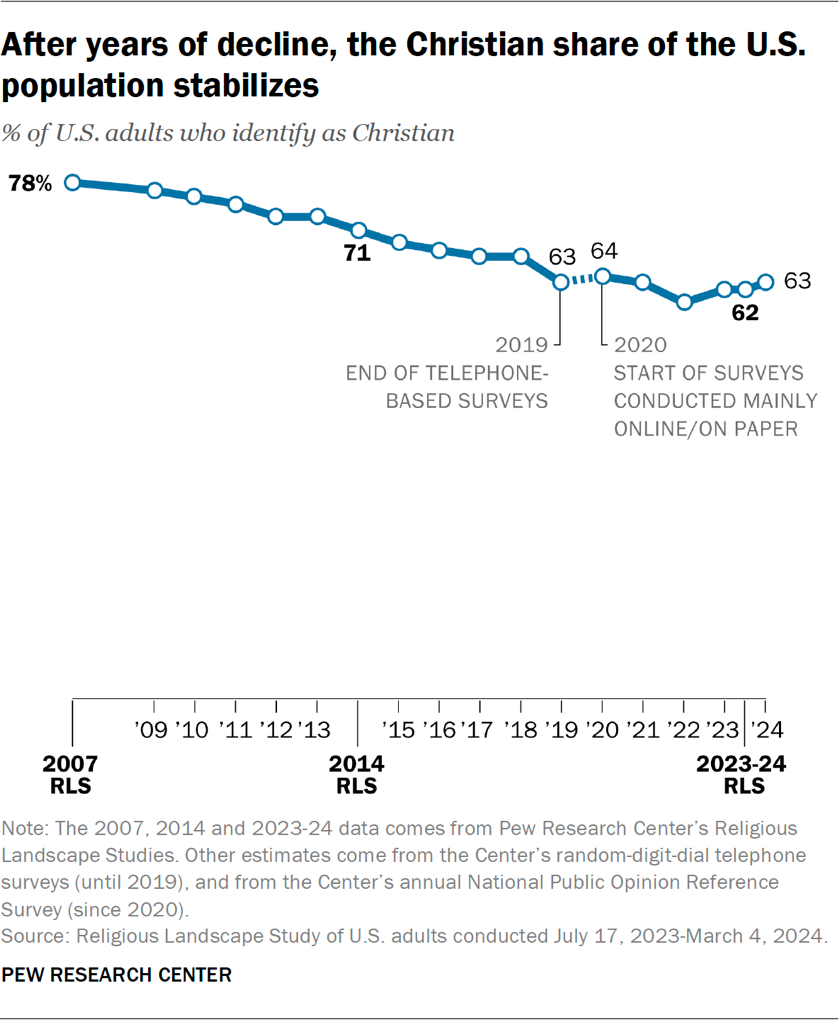
Line chart showing that after years of decline, the Christian share of the U.S. population stabilizes

The Religious Landscape Study (RLS) is the largest single survey the Center conducts, aiming to provide authoritative figures on the size of U.S. religious groups because the U.S. census does not collect that information.

We have conducted three of these landscape surveys over the past 17 years, with more than 35,000 randomly sampled respondents each time. That’s enough to paint a statistical portrait of religion not only nationally, but also in all 50 states and the District of Columbia, as well as in 34 large metro areas.

This introductory essay walks through the big-picture trends: evidence both of a long-term decline in American religion and of relative stability in the last few years, since 2020 or so.

Jump to an executive summary of key findings.

Search for data on religious groups.

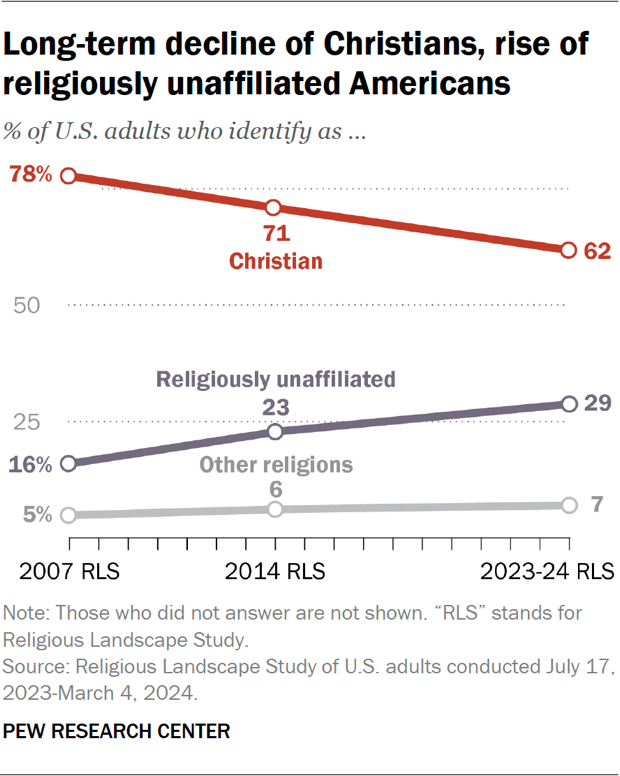
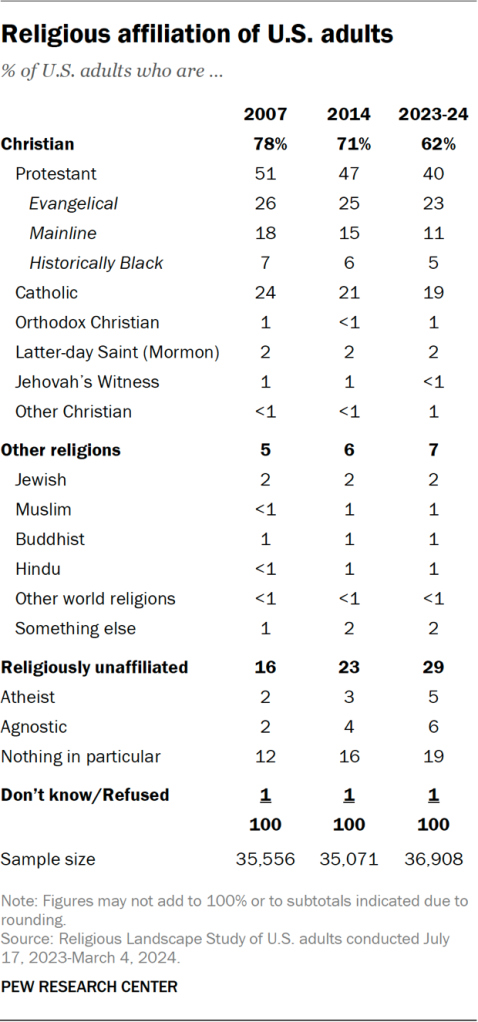
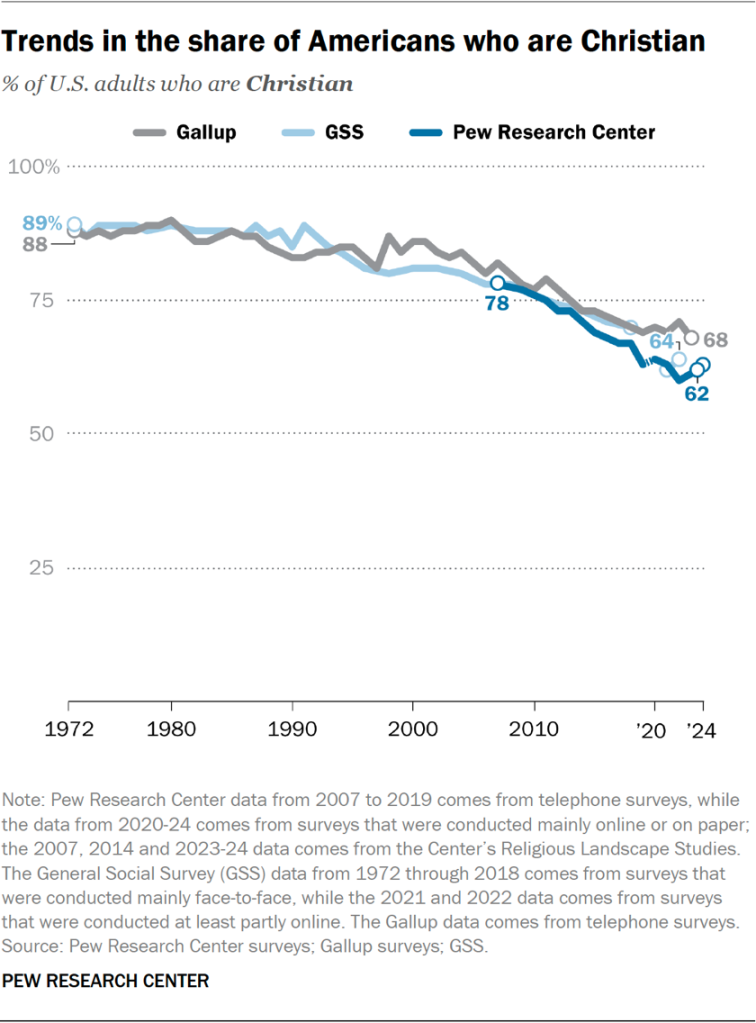
The first RLS, fielded in 2007, found that 78% of U.S. adults identified as Christians of one sort or another. That number ticked steadily downward in our smaller surveys each year and was pegged at 71% in the second RLS, conducted in 2014.

The latest RLS, fielded over seven months in 2023-24, finds that 62% of U.S. adults identify as Christians. That is a decline of 9 percentage points since 2014 and a 16-point drop since 2007.

But for the last five years, between 2019 and 2024, the Christian share of the adult population has been relatively stable, hovering between 60% and 64%. The 62% figure in the new Religious Landscape Study is smack in the middle of that recent range.

The largest subgroups of Christians in the United States are Protestants – now 40% of U.S. adults – and Catholics, now 19%. People who identify with all other Christian groups (including the Greek and Russian Orthodox Churches, the Church of Jesus Christ of Latter-day Saints, Jehovah’s Witnesses and many others) total about 3% of U.S. adults.

Both Protestant and Catholic numbers are down significantly since 2007, though the Protestant share of the population has remained fairly level since 2019 and the Catholic share has been stable since 2014, with only small fluctuations in our annual surveys.

Meanwhile, the share of Americans who identify with a religion other than Christianity has been trending upward, though it is still in single digits.
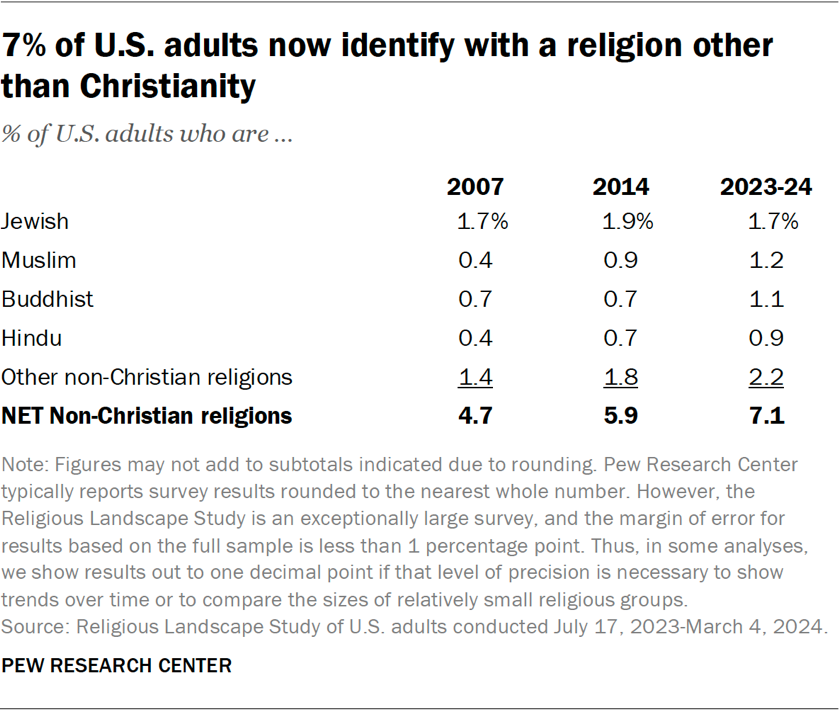
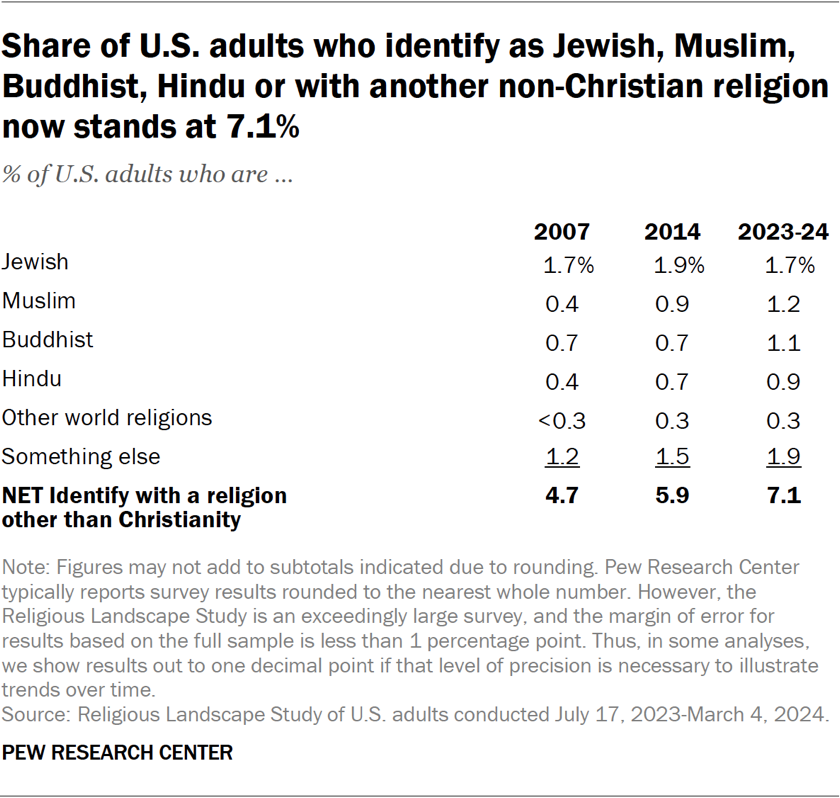
Table showing 7% of U.S. adults now identify with a religion other than Christianity

Today, 1.7% of U.S. adults say they are Jewish when asked about their religion, while 1.2% of respondents in the new survey are Muslim, 1.1% are Buddhist, and 0.9% are Hindu.

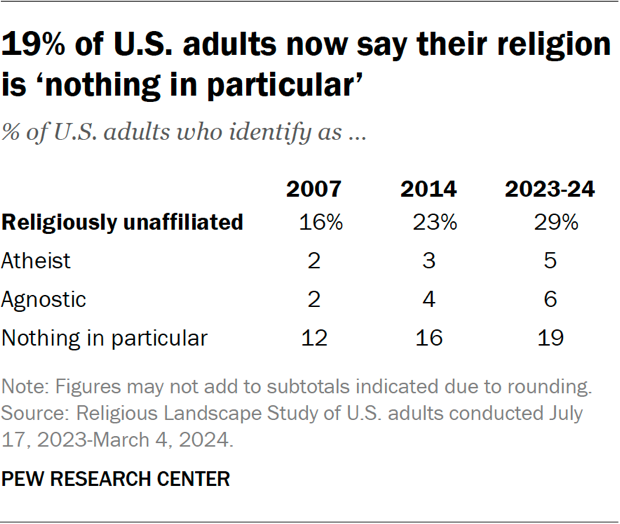
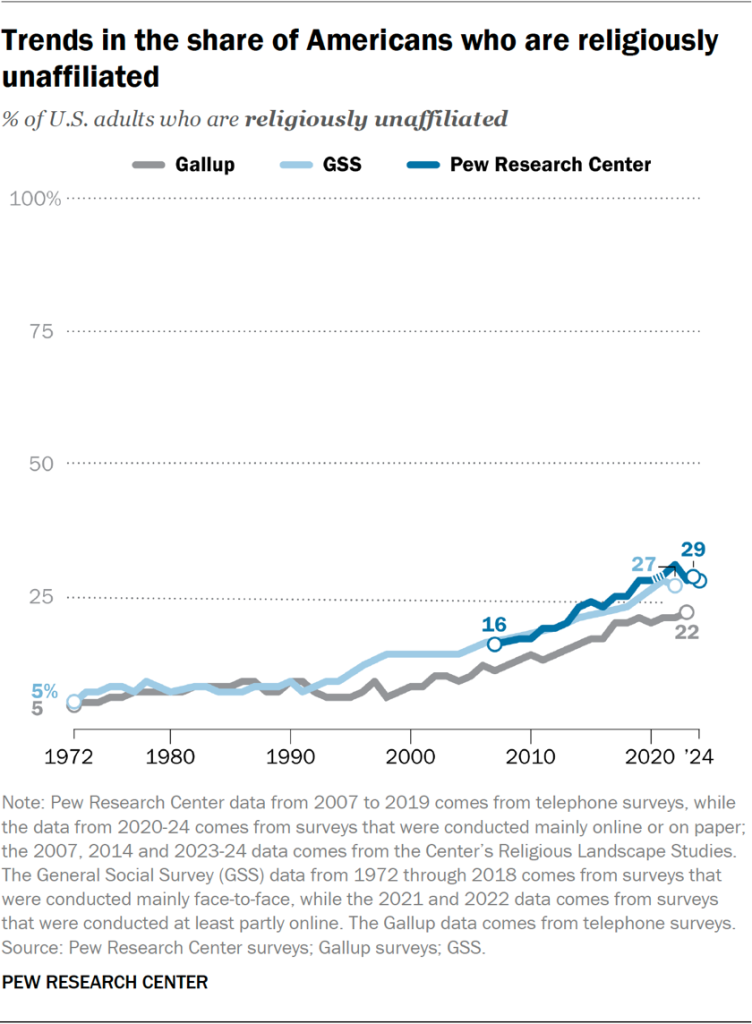
Religiously unaffiliated adults – those who identify as atheists, agnostics or as “nothing in particular” when asked about their religion – account for 29% of the population in the new RLS. The size of the religiously unaffiliated population, which we sometimes call religious “nones,” has plateaued in recent years after a long period of sustained growth.

Rates of prayer, attendance at religious services also relatively stable

Other standard survey measures contribute to this emerging picture of stability:

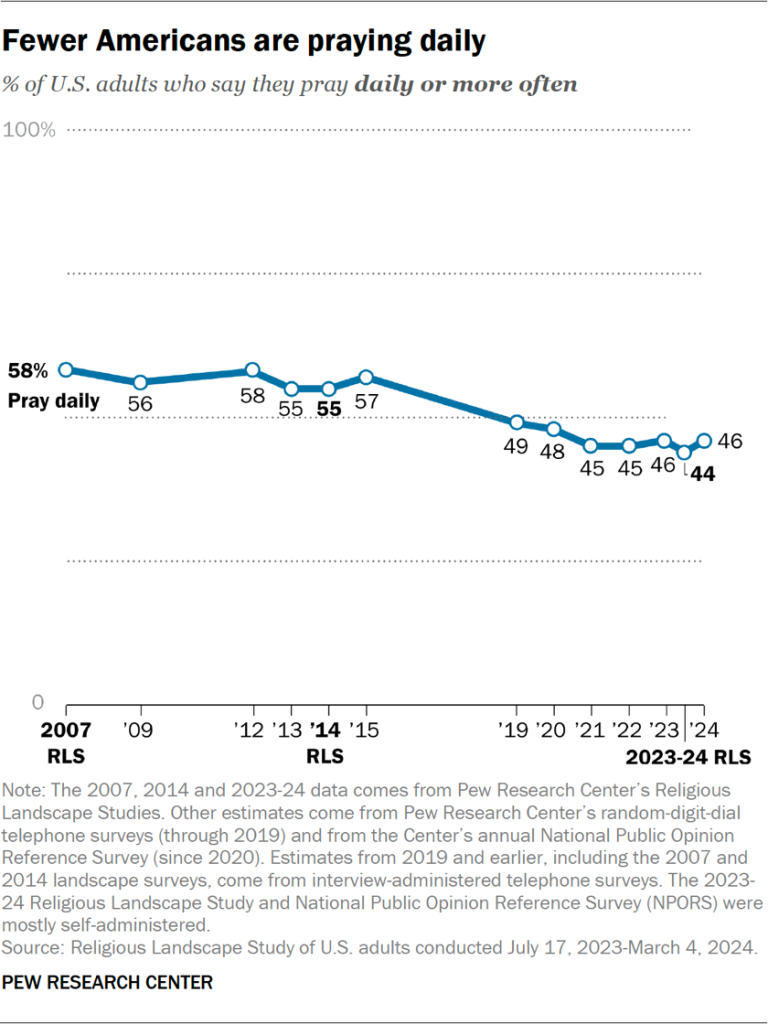
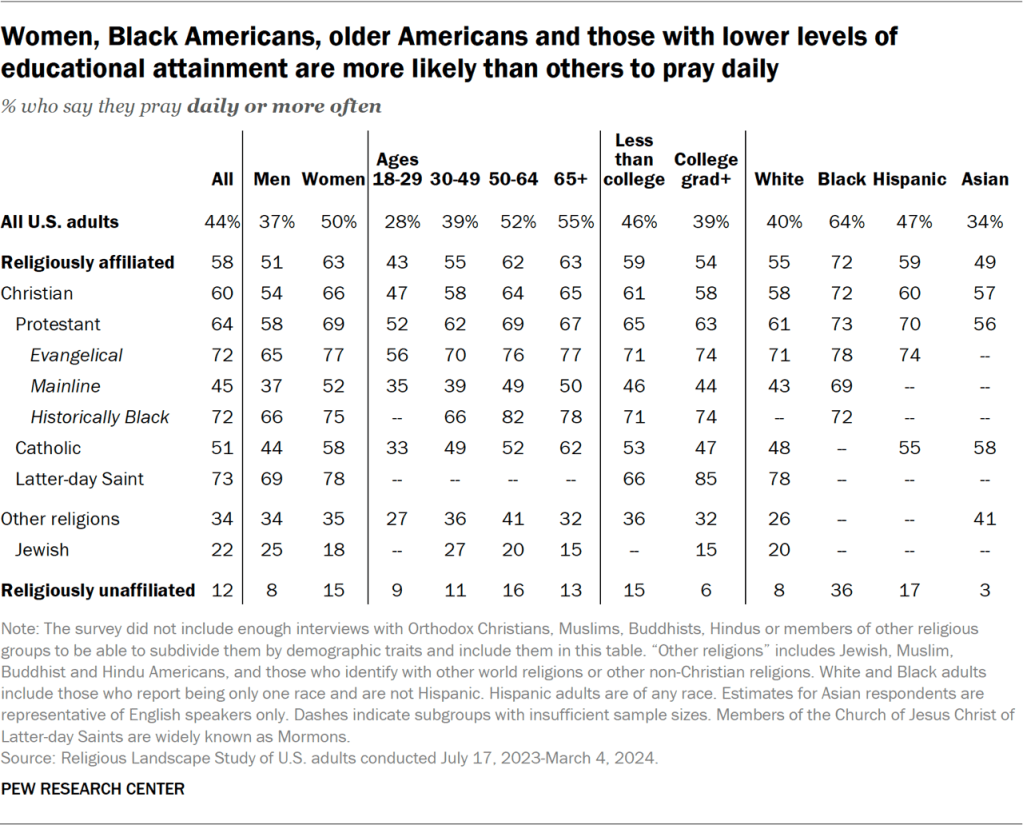
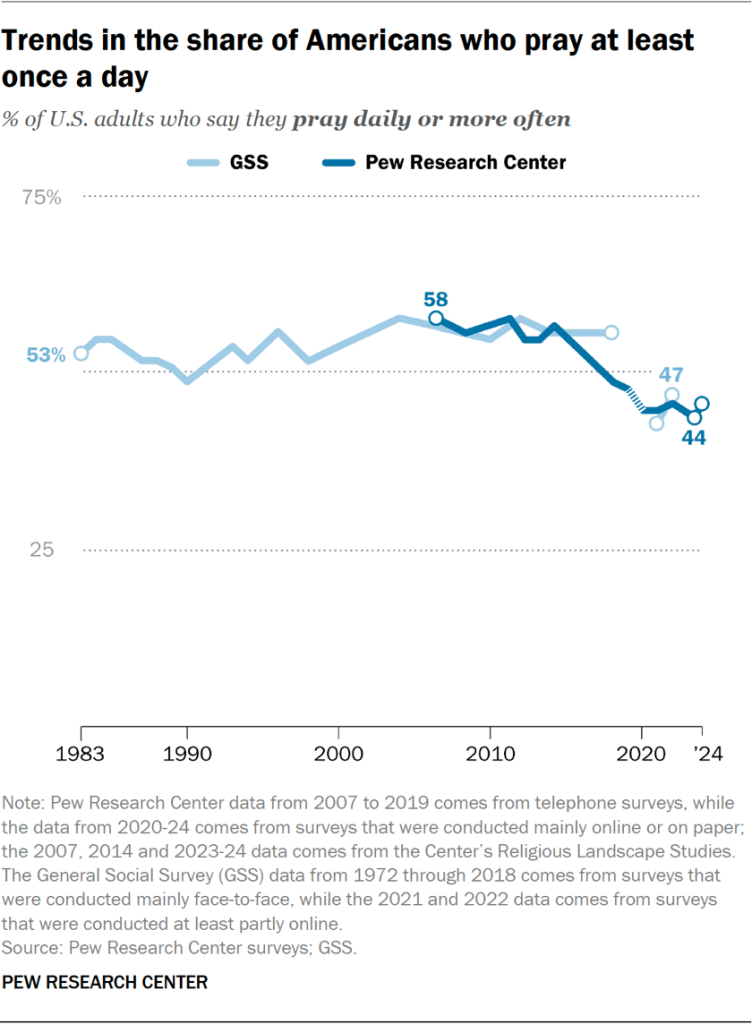
  • Though down significantly since 2007, the share of Americans who say they pray daily has consistently held between 44% and 46% since 2021. In the new RLS, 44% say they pray at least once a day.
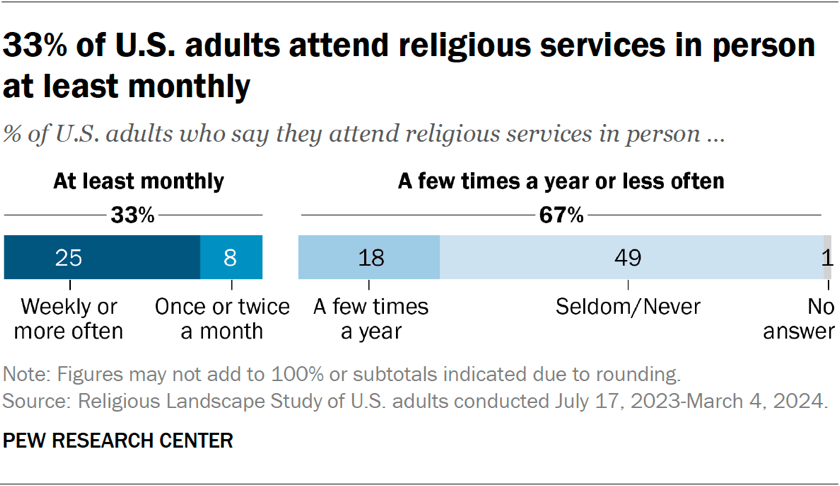
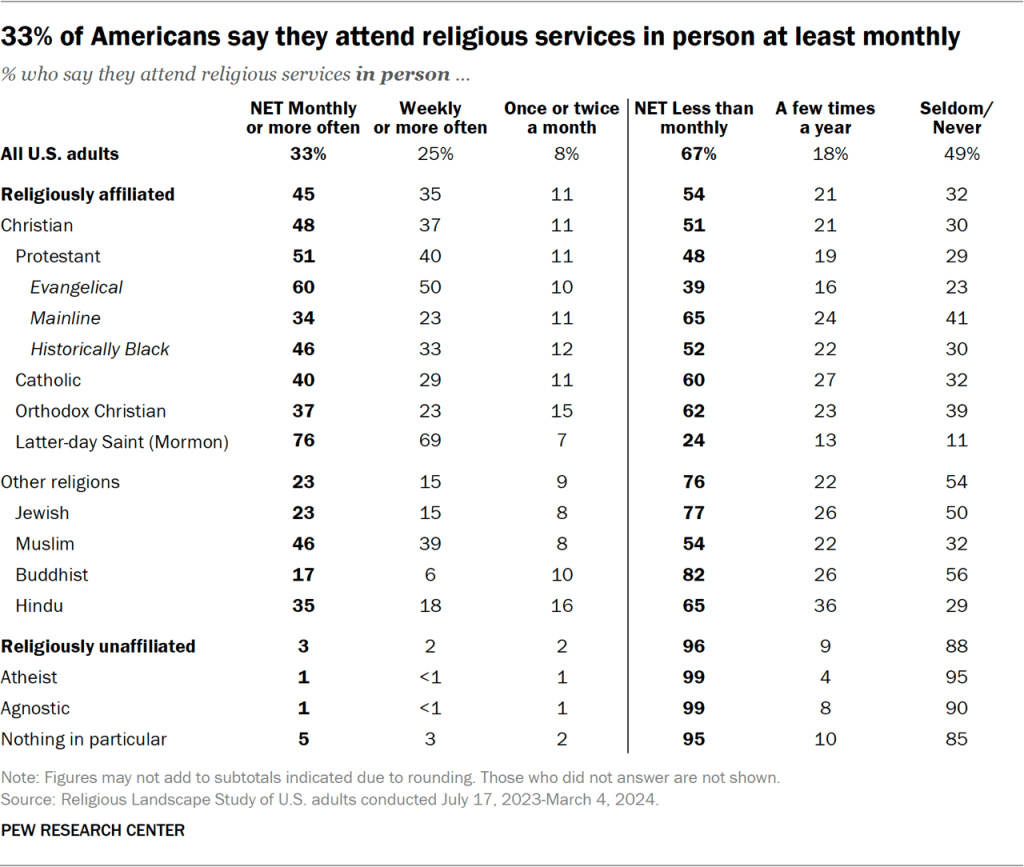
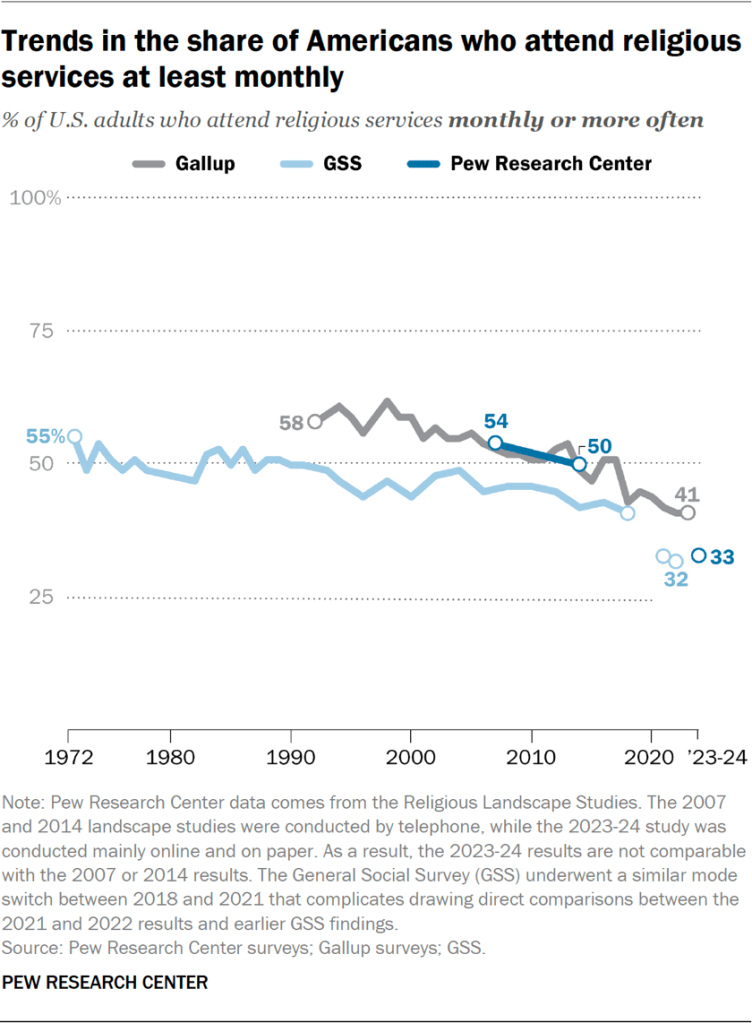
  • Similarly, since 2020, the percentage of U.S. adults who say they attend religious services monthly has hovered in the low 30s. In the new RLS, 33% say they go to religious services at least once a month.

Spiritual beliefs are widespread

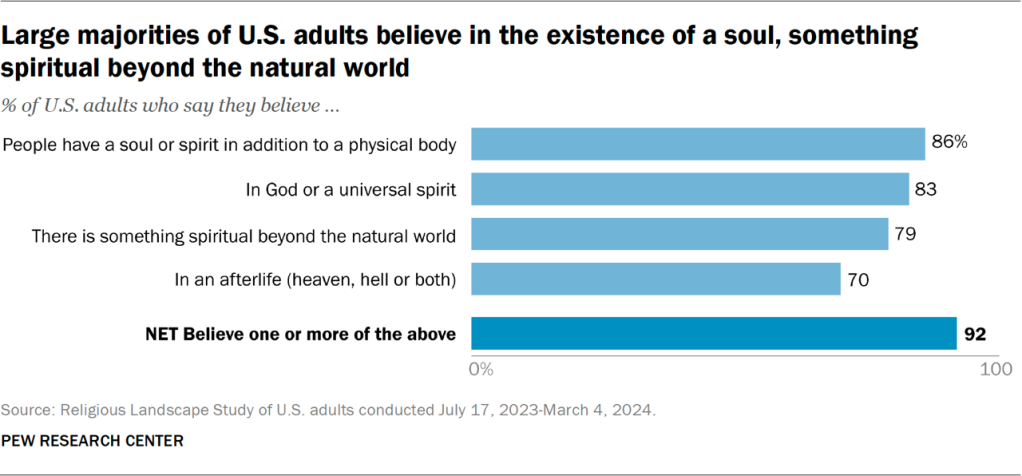
Moreover, the survey shows that large majorities of Americans have a spiritual or supernatural outlook on the world.

For example:

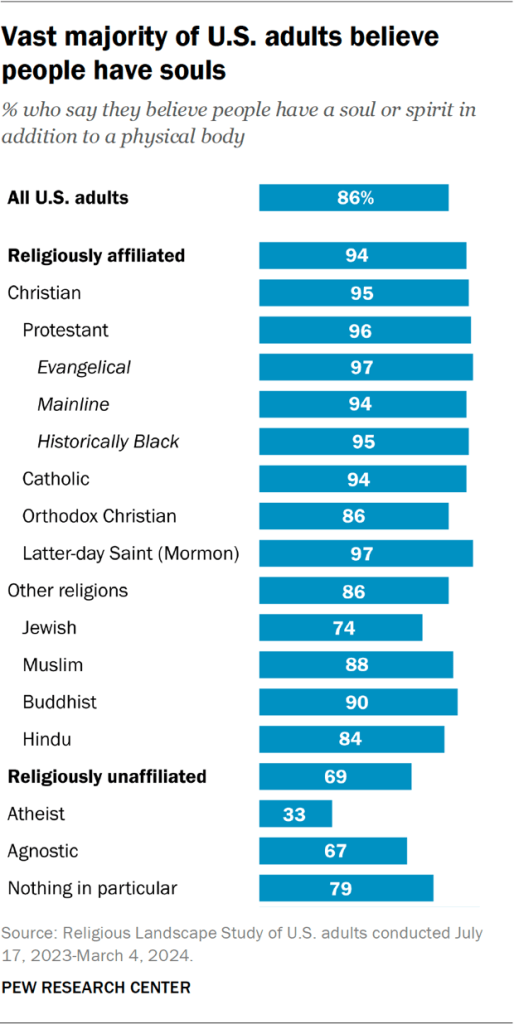
  • 86% believe people have a soul or spirit in addition to their physical body.
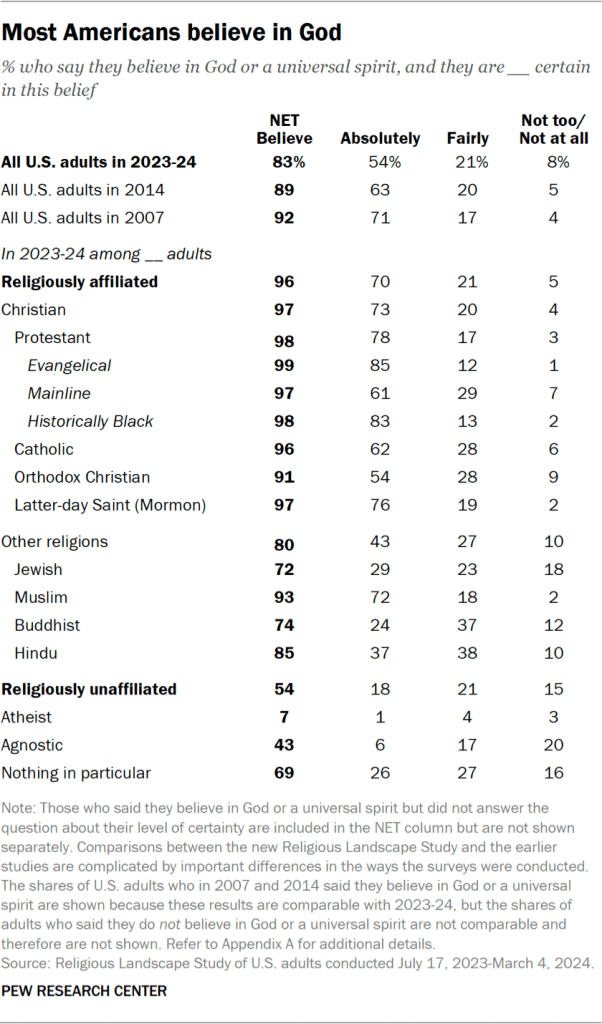
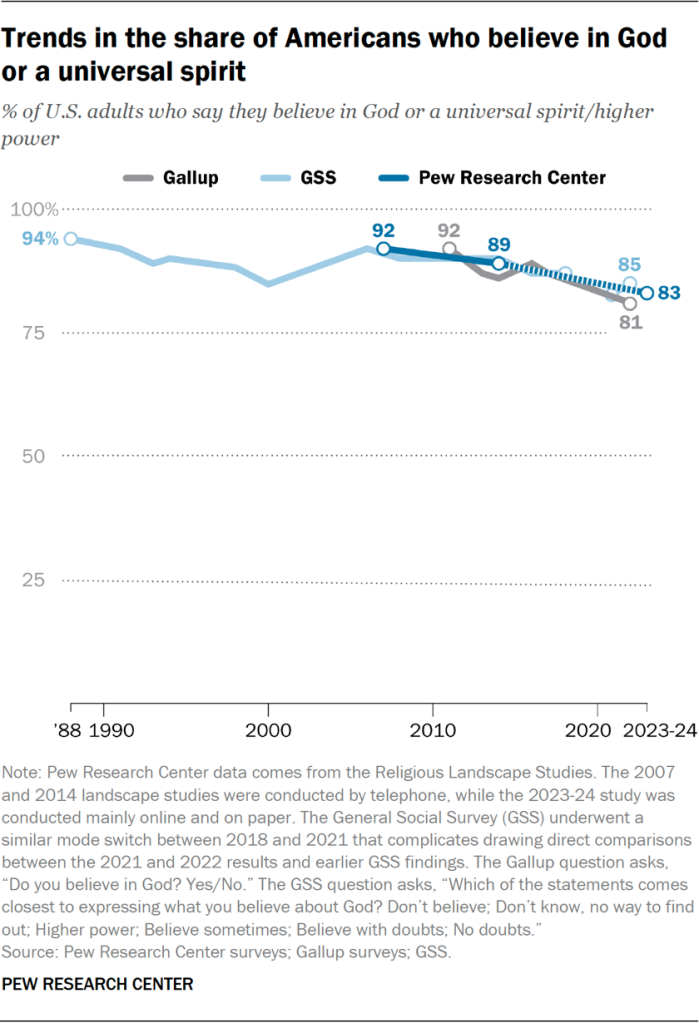
  • 83% believe in God or a universal spirit.
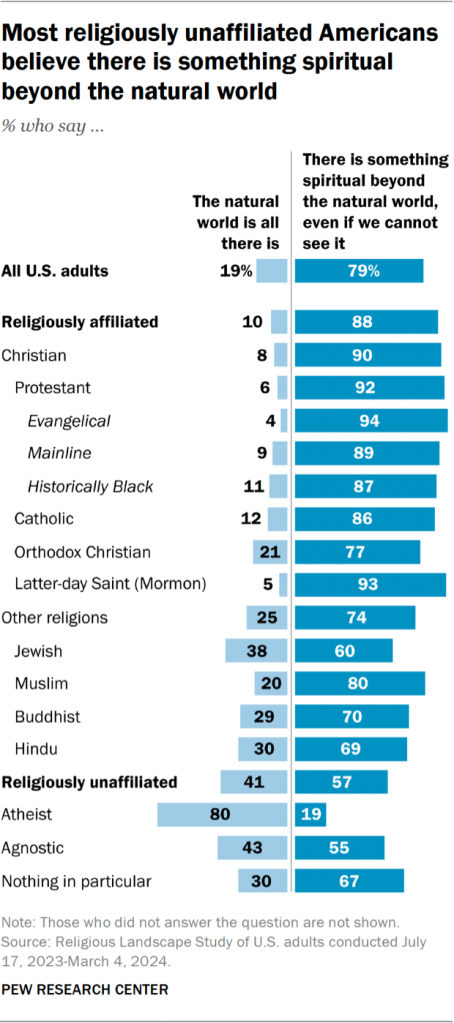
  • 79% believe there is something spiritual beyond the natural world, even if we can’t see it.
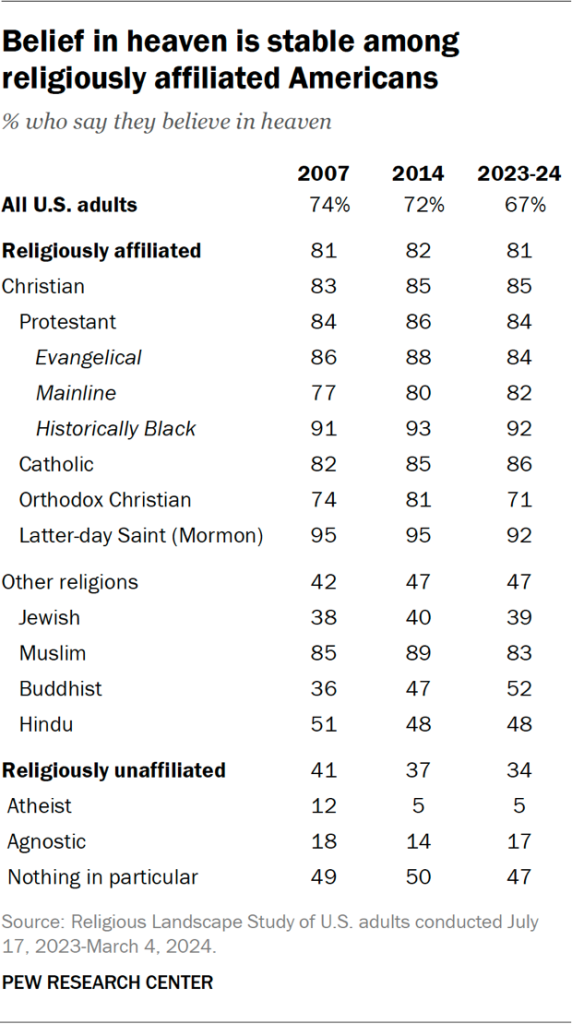
  • 70% believe in an afterlife (heaven, hell or both).
Bar chart showing large majorities of U.S. adults believe in the existence of a soul, something spiritual beyond the natural world

But, despite these signs of recent stabilization and abiding spirituality, other indicators suggest we may see further declines in the American religious landscape in future years.

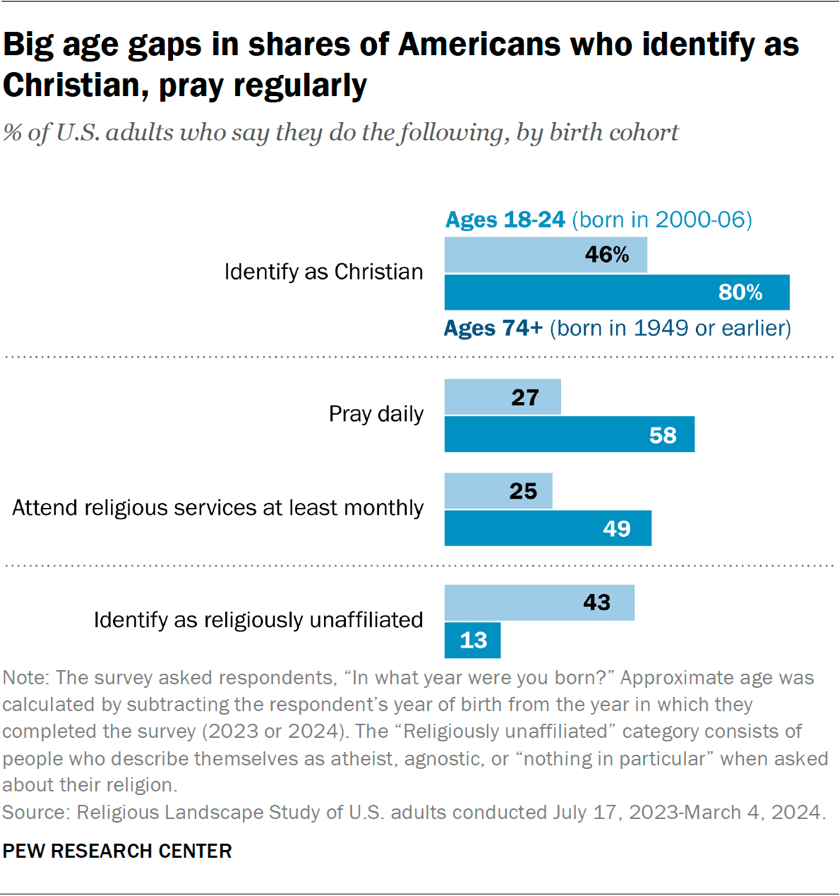
Namely, younger Americans remain far less religious than older adults.

For example, the youngest adults in the survey (ages 18 to 24) are less likely than today’s oldest adults (ages 74 and older) to:

  • Identify as Christian (46% vs. 80%)
  • Pray daily (27% vs. 58%)
  • Say they attend religious services at least monthly (25% vs. 49%)
Bar chart showing big age gaps in shares of Americans who identify as Christian, pray regularly

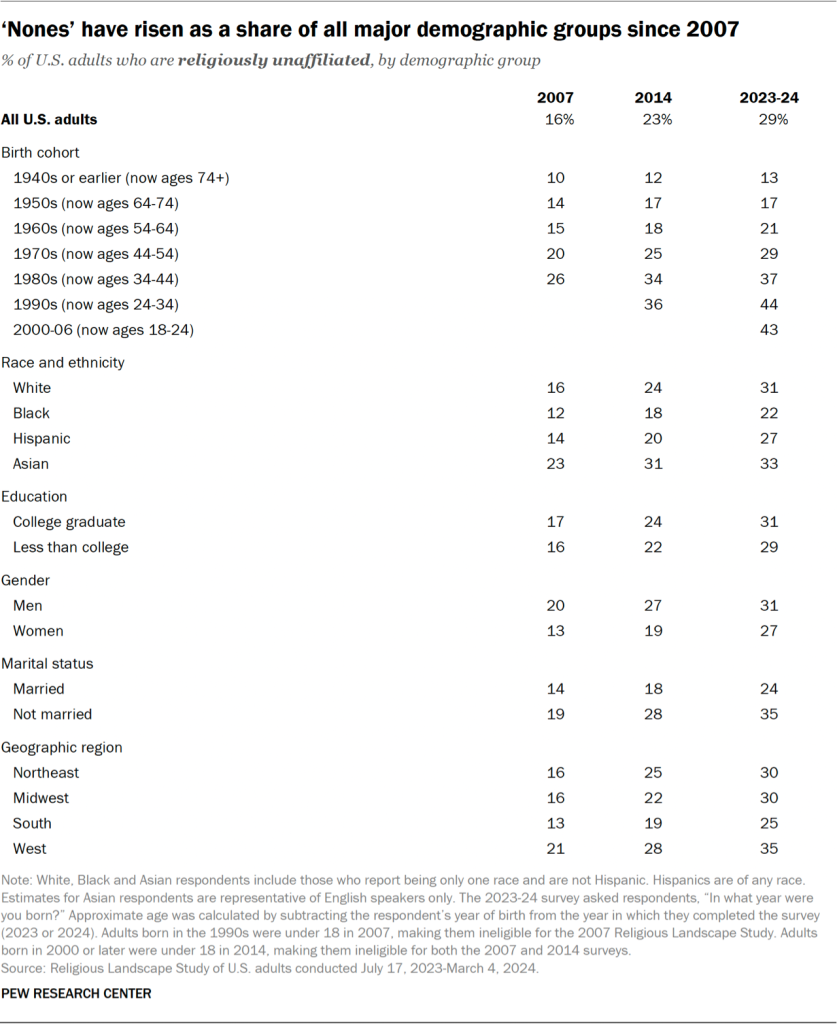
And the youngest adults are more likely than the oldest Americans to be religiously unaffiliated (43% vs. 13%).

Also, younger Americans are less likely than older adults to say they were raised in religious households.1 And, compared with older adults, fewer young people who were raised in religious households have remained religious after reaching adulthood.

These are among the key findings of Pew Research Center’s 2023-24 Religious Landscape Study. Like the previous studies, the new survey offers a great deal of information on what Americans believe and how they practice a wide variety of religions.

In this report, we cover in detail:

    Decline of Christianity in the U.S. Has Slowed, May Have Leveled Off
    Executive summary
    1. Executive summary
    I. Religious affiliation and religious switching
    1. 1. Religious identity
    2. 2. Religious switching
    3. 3. Identifying with a religion because of culture, ethnicity or family background
    II. Religion and family life
    1. 4. Religious intermarriage
    2. 5. Religious upbringing and childhood education
    3. 6. Religion, fertility and child-rearing
    III. Religious or spiritual beliefs and practices
    1. 7. Importance of religion and the Bible
    2. 8. Religious attendance and congregational involvement
    3. 9. Race and ethnicity in religious congregations
    4. 10. Prayer and other religious practices
    5. 11. Religious and spiritual beliefs
    6. 12. Spiritual experiences
    7. 13. Spiritual activities
    8. 14. Spiritual and religious self-descriptions
    IV. Social and political views
    1. 15. Religion, partisanship and ideology
    2. 16. Religion and views on LGBTQ issues and abortion
    3. 17. Religion and views on gender, parenting and workforce participation
    4. 18. Religion and views on immigration and diversity
    5. 19. Religion and views on the environment
    6. 20. Religion and views on the role of government
    V. Opinions on religion's place in society
    1. 21. Religion and views of right and wrong
    2. 22. Religion’s role in public life
    3. 23. Religion and views of science
    VI. Demographics of U.S. religious groups
    1. 24. Age, race, education and other demographic traits of U.S. religious groups
    Acknowledgments
    1. Acknowledgments
    Methodology
    1. Methodology
    Appendices
    1. Appendix A: Comparing results across Religious Landscape Studies
    2. Appendix B: Classification of Protestant denominations
    3. Appendix C: Comparing the Center’s religion trends with those of other major surveys

Reasons for the long-term decline and recent stability

The RLS and other recent Pew Research Center surveys suggest that two things are happening simultaneously in American religion:

  • Over the long term (since 2007 in our data and going back further in other major surveys), there is a downward trend in several measures of religiousness, including affiliation with Christianity.
  • In the short term (the last four or five years), these changes have slowed or perhaps even plateaued.
Long-term decline

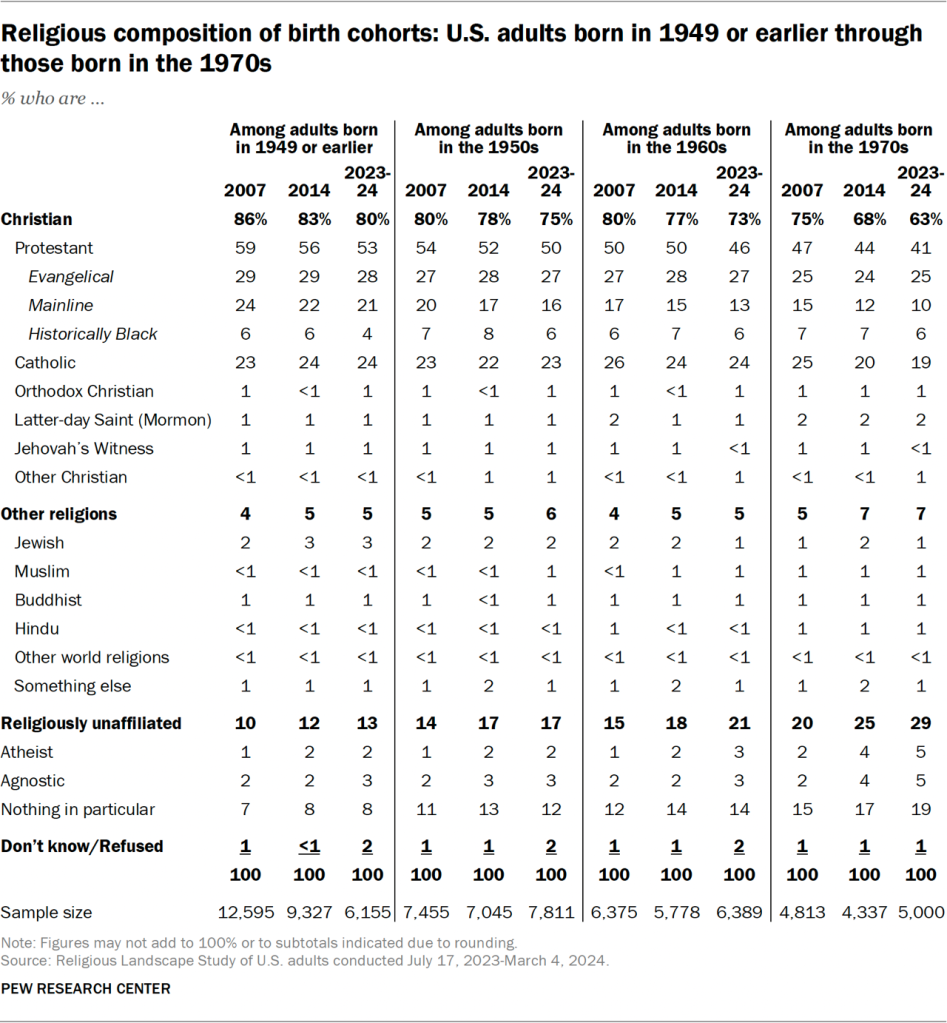
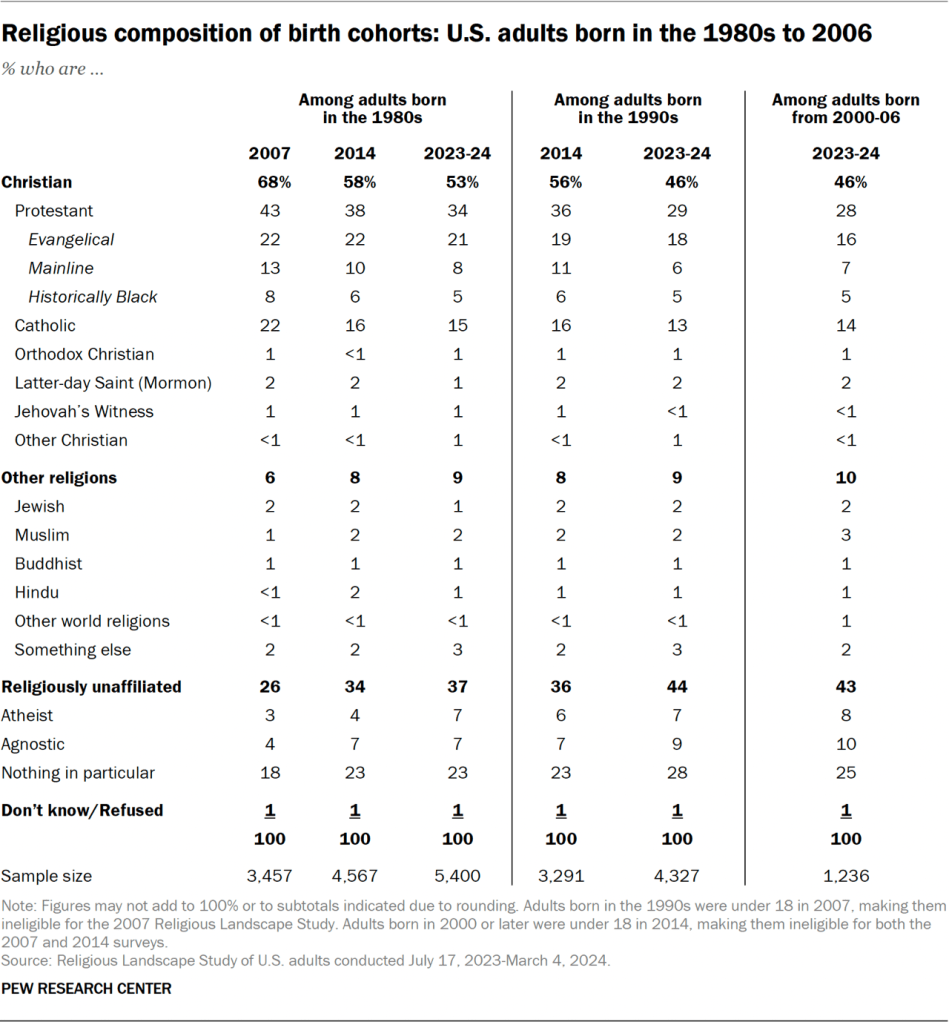
One driver of the long-term trend is “generational replacement.” Older, highly religious, heavily Christian generations are passing away. The younger generations succeeding them are much less religious, with smaller percentages of Christians and more “nones.”2

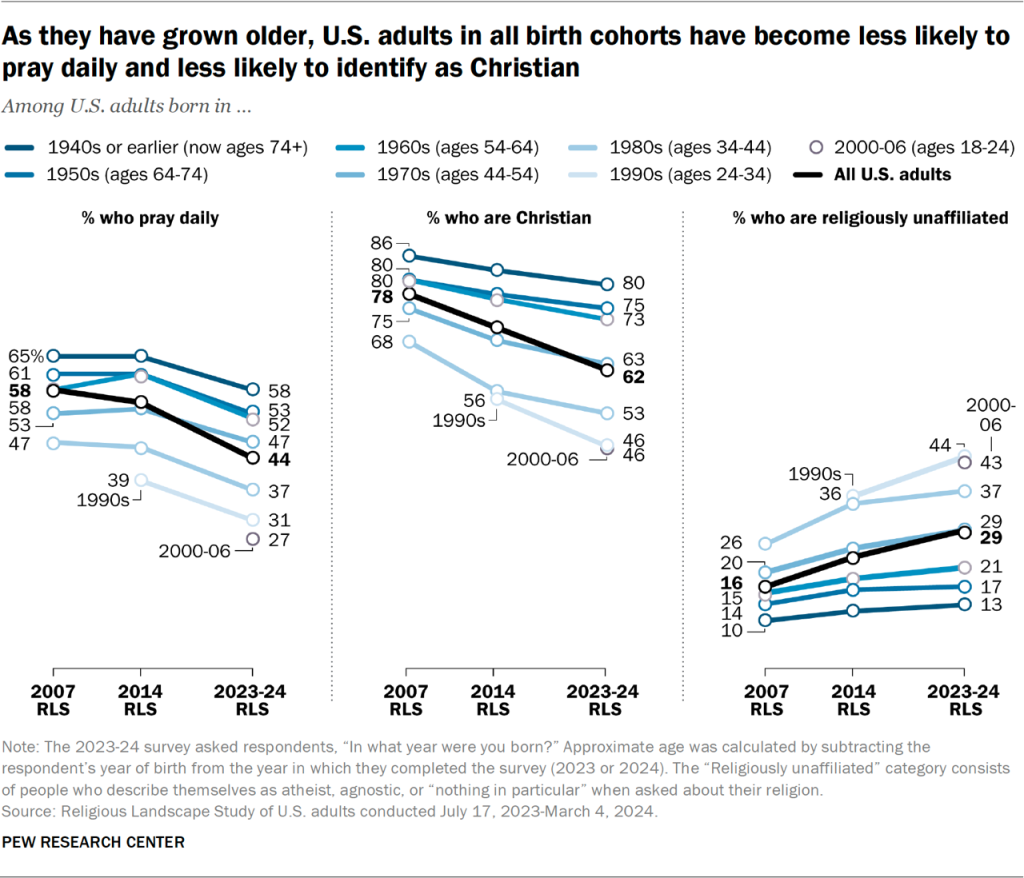
In addition, the landscape surveys show that between 2007 and 2023-24, each birth cohort has become less religious, by several measures, as it has aged.

What’s a birth cohort?

Throughout this report, we use “birth cohort” to refer to a group of people who were born in the same years. We categorize U.S. adults into seven cohorts: people born in the 1940s (or earlier) and those born in the 1950s, the 1960s, the 1970s, the 1980s, the 1990s, and from 2000 through 2006.

One advantage of analyzing these cohorts rather than conventional “generations” (like the Silent Generation, Baby Boomers, Gen X, Millennials and Gen Z) is that most of the cohorts are of equal length (a decade long).

Another advantage is that the decade-long cohorts may not carry as many assumptions – or stereotypes – as the familiar generations do.

For example, people within the oldest and youngest cohorts, as well as those in between, have become less likely to say they pray daily, less likely to identify with a religion (including Christianity), and less likely to believe in God or a universal spirit with absolute certainty.
Line chart showing that as they have grown older, U.S. adults in all birth cohorts have become less likely to pray daily and less likely to identify as Christian
Recent stability

Since 2020, however, our surveys indicate that the religiousness of most birth cohorts has remained relatively stable. For instance, people born in the 1950s are about as likely to report praying daily in the 2023-24 RLS (53%) and the 2024 National Public Opinion Reference Survey, or NPORS (57%), as they were in the 2020 NPORS (55%).

Additionally, the new RLS finds that the youngest cohort of adults is no less religious than the second-youngest cohort in a variety of ways.3 Americans born in 2000 through 2006 (those ages 18 to 24 in the 2023-24 RLS) are just as likely as those born in the 1990s (now ages 24 to 34) to identify as Christians, to say religion is very important in their lives, and to report that they attend religious services at least monthly.4

Time will tell whether the recent stability in measures of religious commitment is the beginning of a lasting shift in America’s religious trajectory. But it is inevitable that older generations will decline in size as their members gradually die. We also know that the younger cohorts succeeding them are much less religious.

This means that, for lasting stability to take hold in the U.S. religious landscape, something would need to change. For example, today’s young adults would have to become more religious as they age, or new generations of adults who are more religious than their parents would have to emerge.
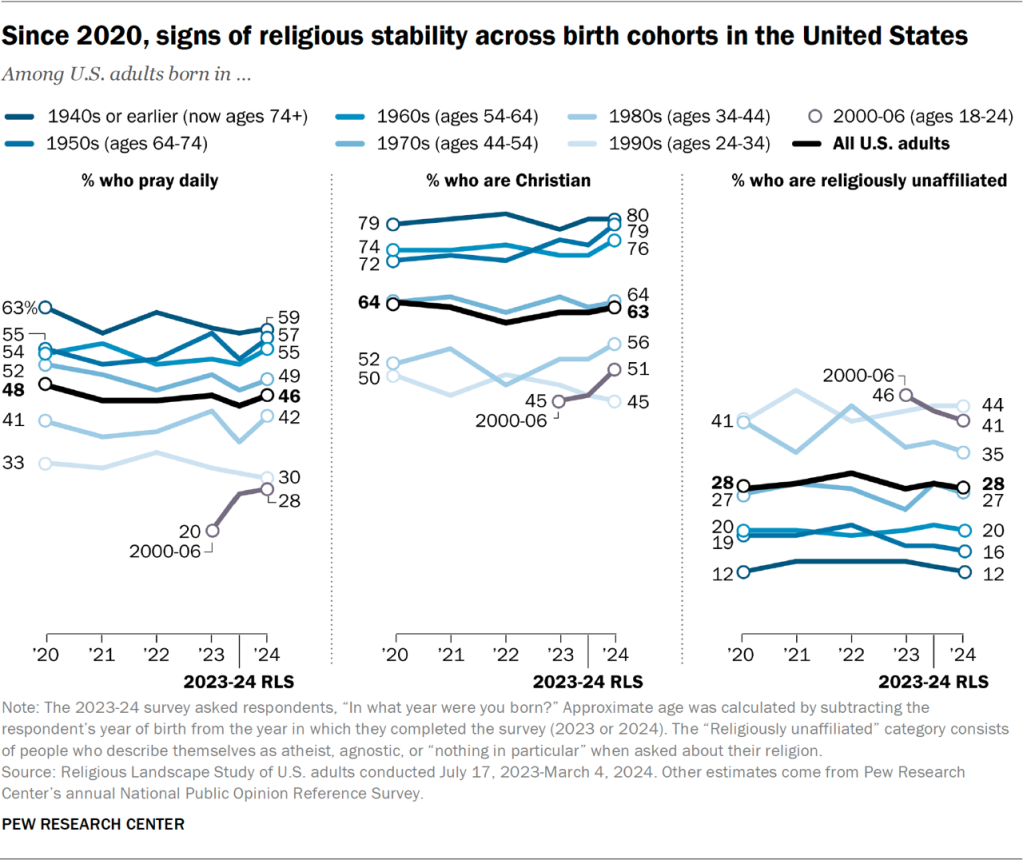
Line chart showing that since 2020, signs of religious stability across birth cohorts in the United States

Religion and spirituality among young adults

The dynamics of religion and spirituality among young people are key to understanding the country’s recent religious trajectory. The large size of the new survey makes it possible to paint a religious and spiritual profile of the nation’s youngest adults with unique precision.

By a number of traditional measures, today’s young adults exhibit far lower levels of religiousness than older adults. For example, 27% of adults between the approximate ages of 18 and 24 in the new survey say they pray daily, as do 31% of those ages 24 to 34. But among adults ages 54 and older, half or more say they pray daily.

Young adults also report attending religious services less often than older adults do, and they express lower levels of belief in God or a universal spirit. Compared with older adults, fewer young people identify as Christians, and more say they don’t identify with any religion.
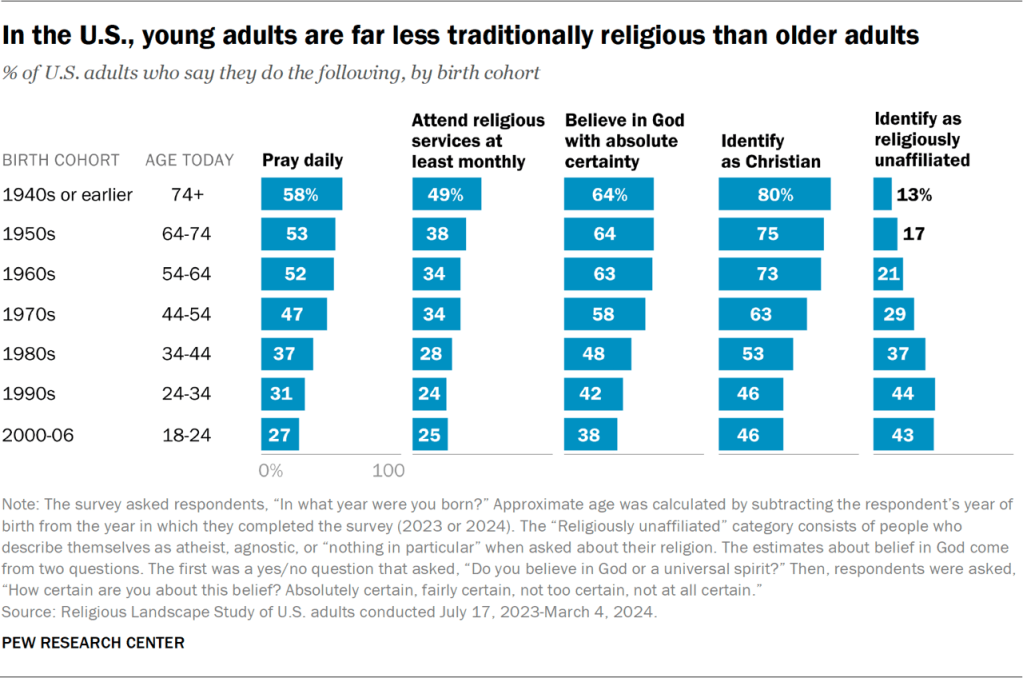
Bar chart showing that in the U.S., young adults are far less traditionally religious than older adults

On the survey’s questions touching on matters of spirituality, however, the age gaps are smaller.

For example, eight-in-ten or more adults in all age categories say they believe people have a soul or spirit in addition to their physical bodies.
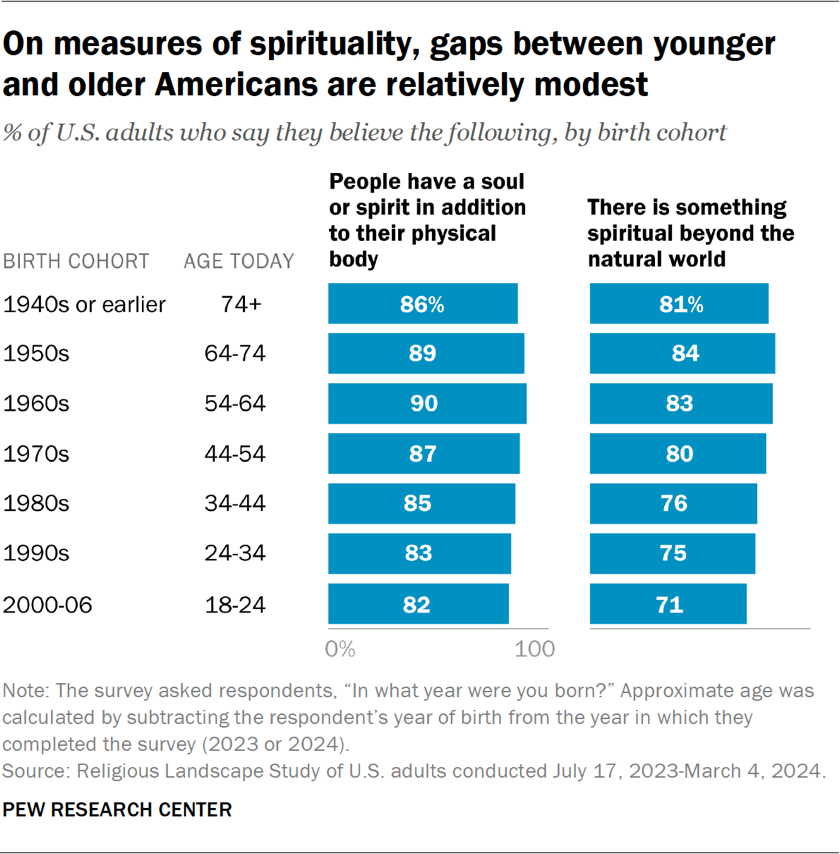
Bar chart showing that on measures of spirituality, gaps between younger and older Americans are relatively modest

And about seven-in-ten adults ages 18 to 24 and 75% of those ages 24 to 34 believe there is something spiritual beyond the natural world, only modestly below the 81% of the oldest adults (ages 74 and older) who say this.

In the rest of this Overview, we explore these and other key topics in detail:

  • Trends in the size of religious groups and denominations
  • Race in religious groups and congregations
  • The narrowing gender gap in American religion
  • Religion in childhood and adulthood
  • Religion in U.S. families today
  • Religious switching
  • Signs of strengthening spirituality
  • Attendance at religious services
  • How religious beliefs change as people age
  • What is happening to the ‘middle’ of American religion
  • Trends in the religiousness of Christians
  • Religion and political polarization

Trends in the size of U.S. religious groups and denominations

In the new Religious Landscape Study, 62% of U.S. adults describe themselves as Christians. The Christian share of the population is now 9 points lower than when the landscape study was last conducted in 2014, and 16 points lower than in 2007.
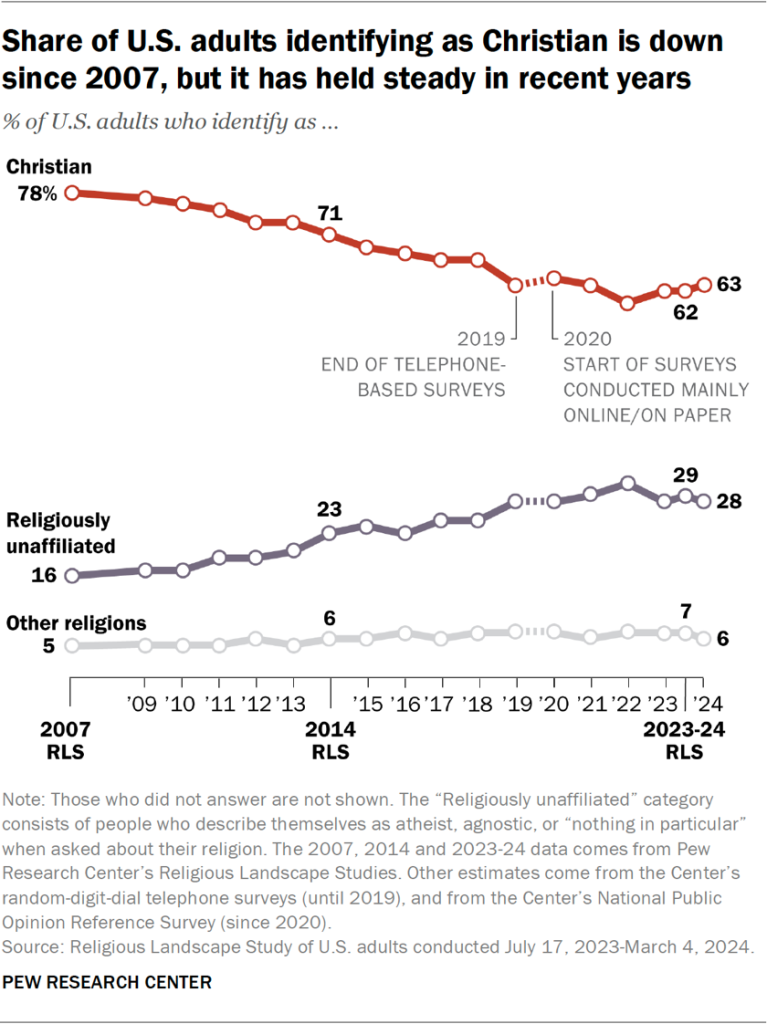
Line chart showing the share of U.S. adults identifying as Christian is down since 2007, but it has held steady in recent years

The share of Americans who say they have no religion – identifying, instead, as atheist, agnostic or as “nothing in particular” – stands at 29% in the new RLS, up from 23% in 2014 and 16% in 2007.

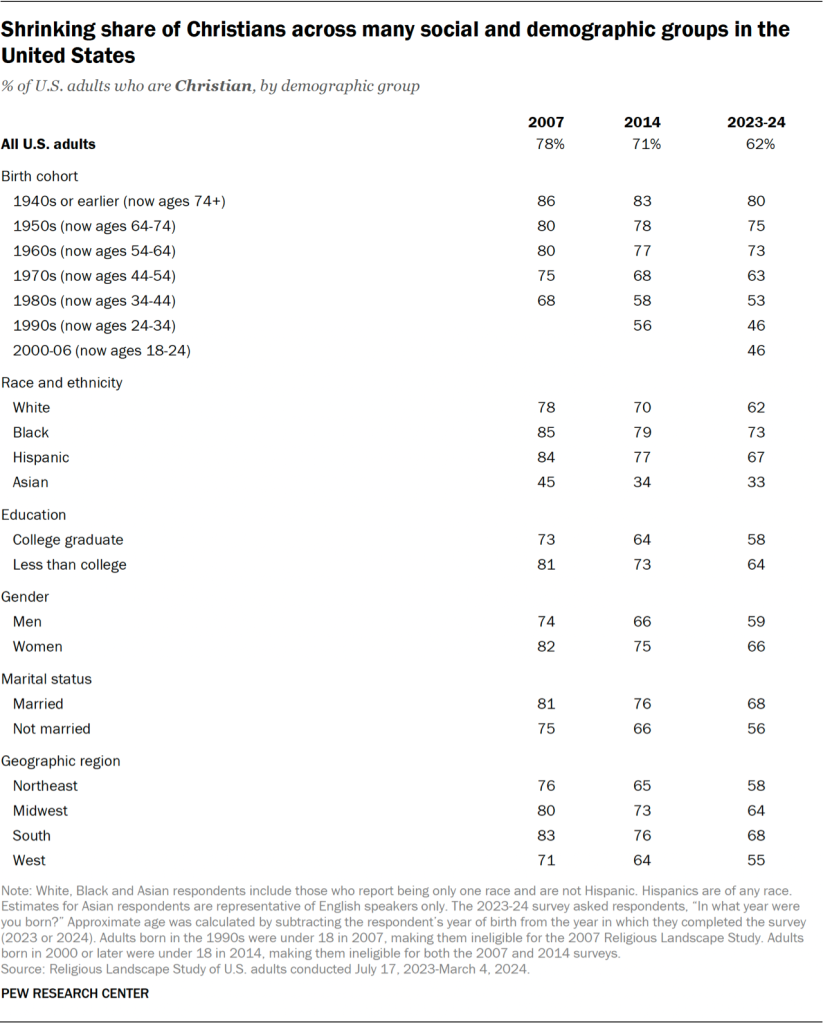
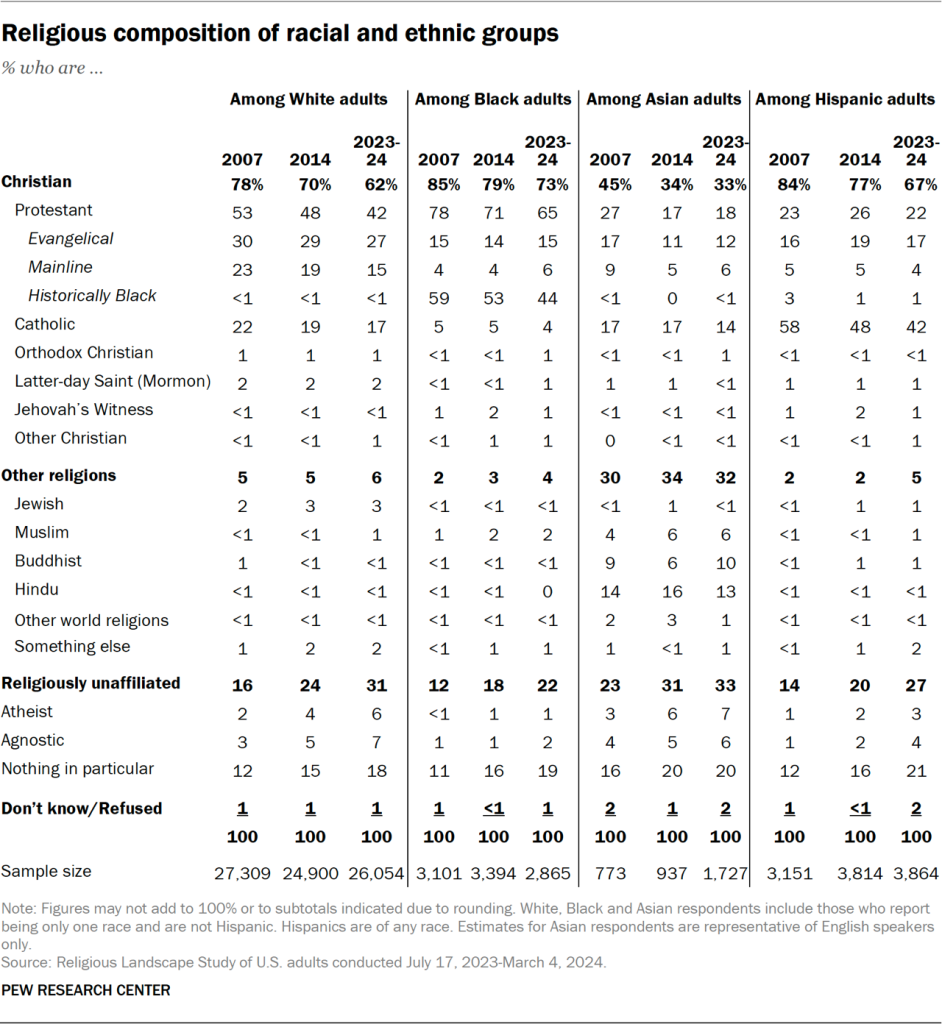
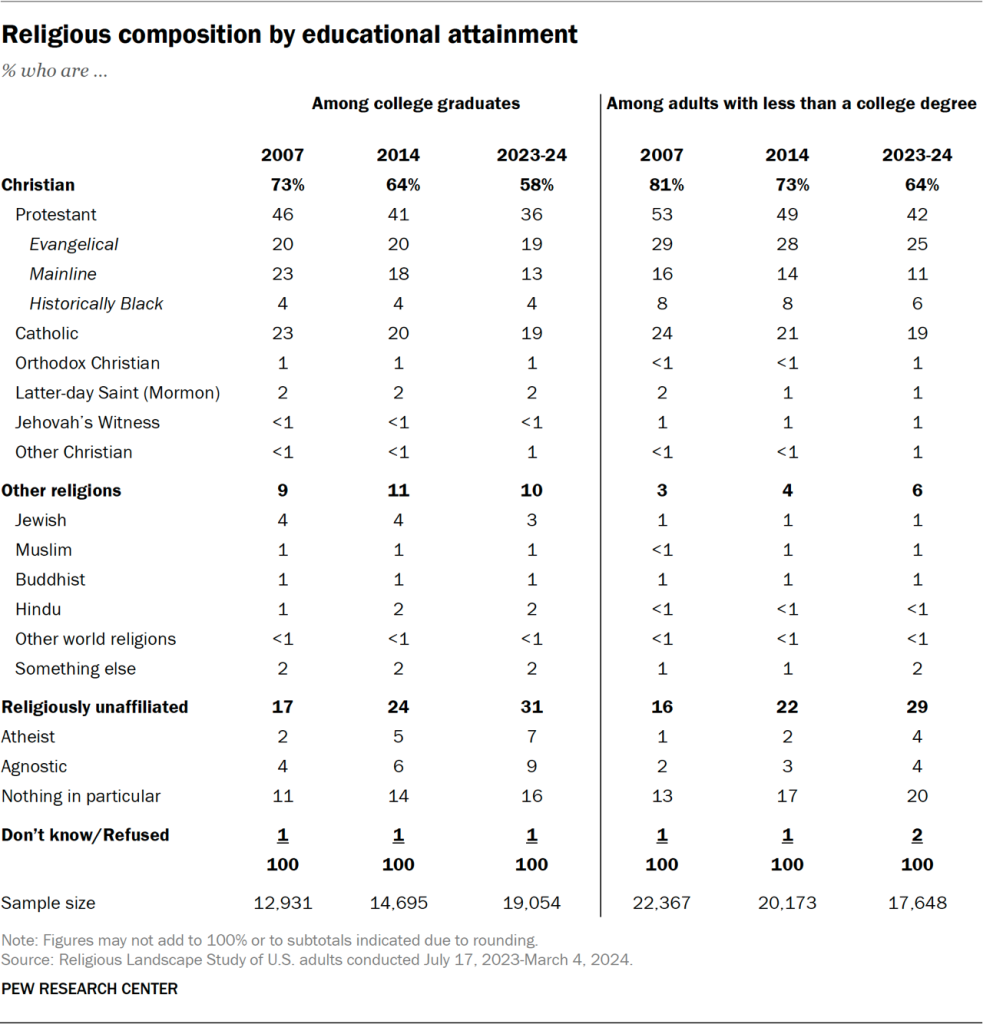
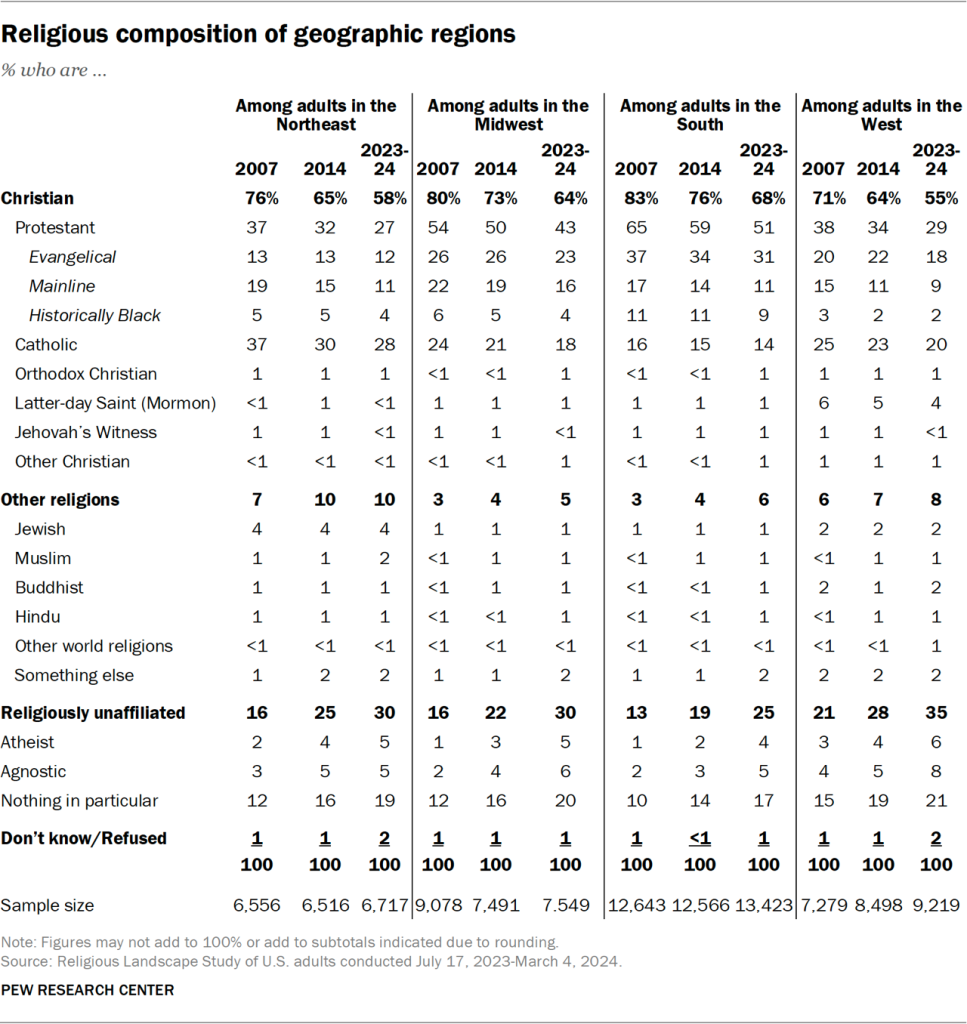
The long-term decline in the Christian share of the population and growth of religious “nones” is demographically broad-based. There are fewer Christians and more “nones” among men and women; people in every racial and ethnic category; college graduates and those with less education; and residents of all major regions of the country.

But the changes are much more pronounced among ideological liberals than conservatives. Today, 37% of self-described liberals identify with Christianity, down from 62% in 2007, a 25-point decline. Meanwhile, 51% of liberals now say they have no religion, up from 27% in 2007, a 24-point increase. There are now more religious “nones” than Christians among liberals, a reversal since 2007.5

There also are fewer Christians and more “nones” among conservatives. But the changes in the religious composition of conservatives have been much less pronounced than among liberals, and a large majority of conservatives continue to identify with Christianity.6

These changes within ideological categories resemble long-term trends within political parties. A prior Pew Research Center analysis shows that both Republicans and Democrats include fewer Christians and more religious “nones” today than they did a decade or more ago. But the decline of Christianity and rise of religious “nones” has been much more pronounced among Democrats than Republicans.7

For a detailed discussion of trends in the religious composition of demographic groups, refer to Chapter 1.
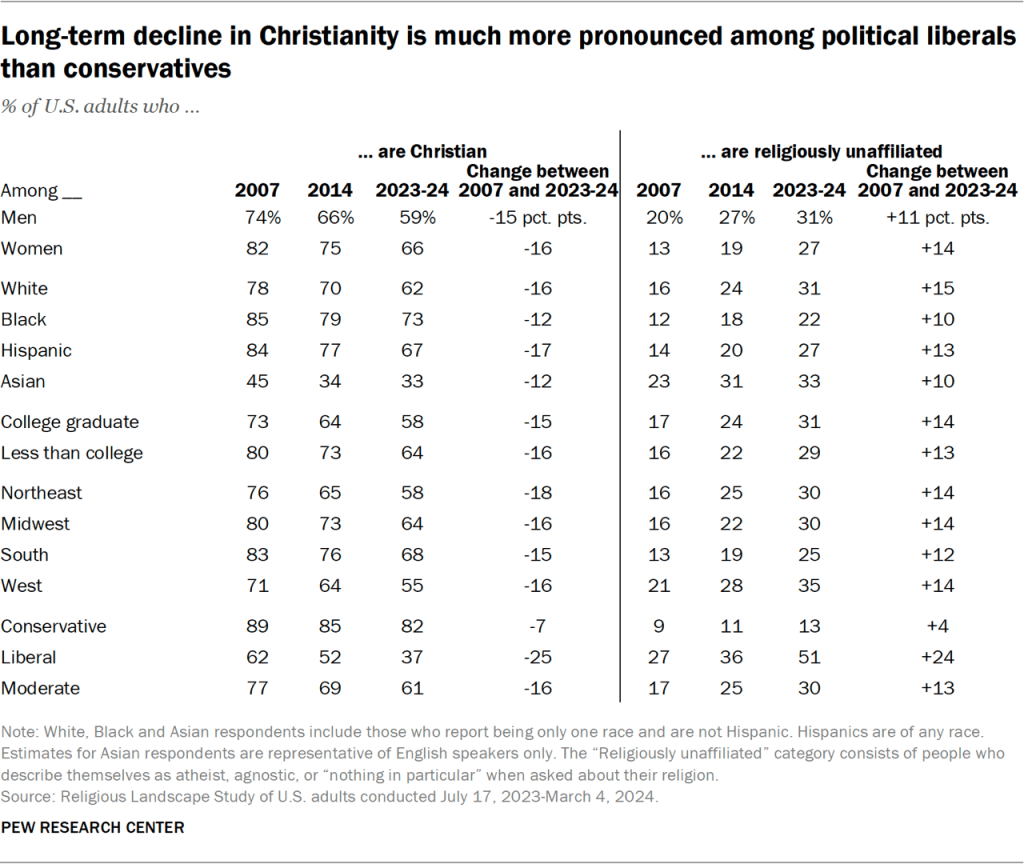
Table showing long-term decline in Christianity is much more pronounced among political liberals than conservatives

Trends within Christianity

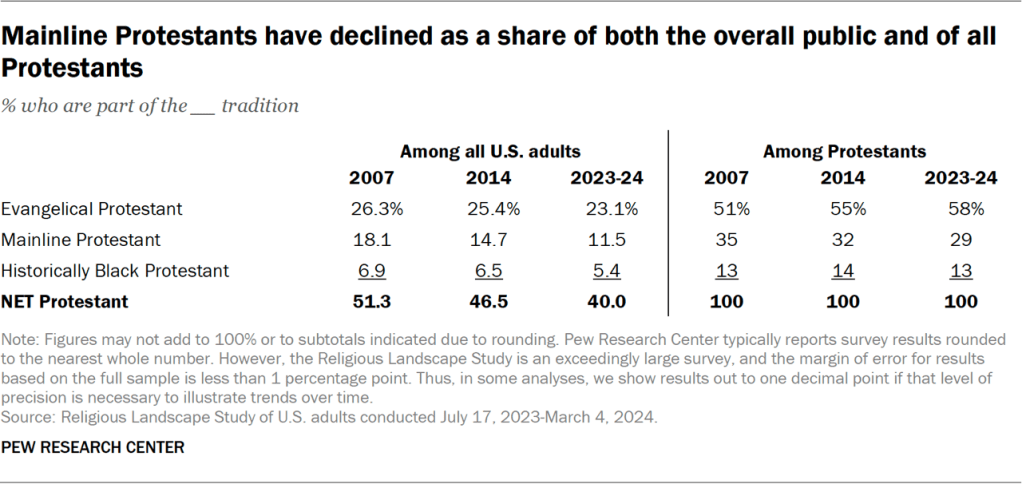
In the 2023-24 RLS, about four-in-ten U.S. adults identify as Protestants. That is 11 points lower than in the 2007 RLS.
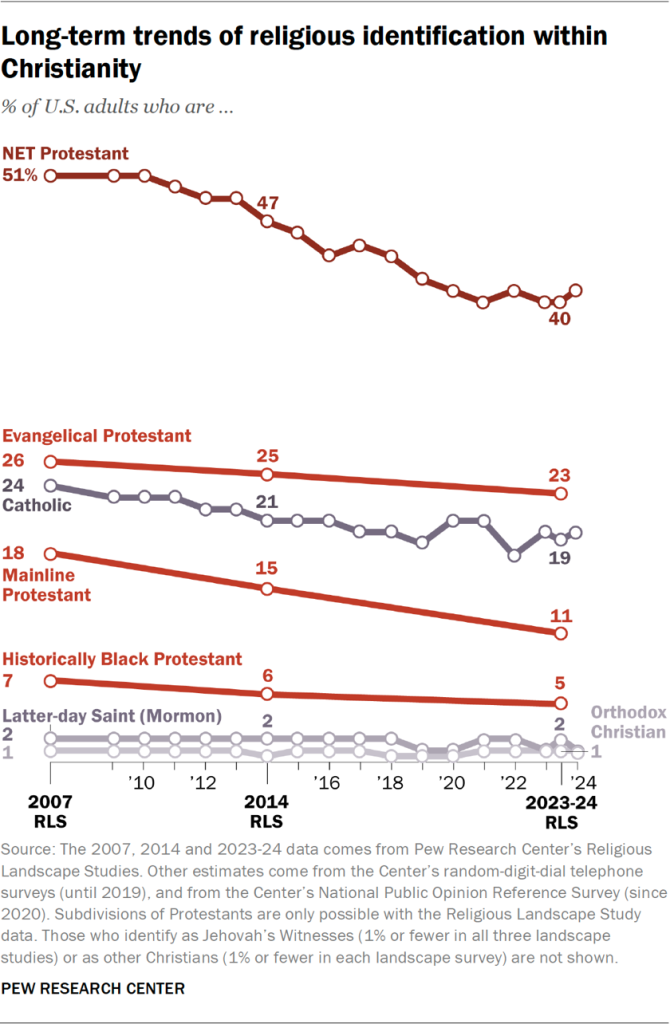
Line chart showing the long-term trends of religious identification within Christianity

All three major Protestant traditions have seen their population shares tick downward at least slightly over that period:

  • Evangelical Protestants now account for 23% of all U.S. adults, down from 26% in 2007.
  • Mainline Protestants stand at 11%, down from 18% in 2007.
  • Members of historically Black Protestant churches make up 5% of U.S. adults, down slightly from 7% in 2007.

Like the overall Christian share of the population, however, the total Protestant share of the population has been quite stable in recent years, hovering between 40% and 42% since 2019.

The Catholic share of the population has been steady over an even longer period. In 11 Pew Research Center surveys conducted since 2014, all but one have found between 19% and 21% of respondents identifying as Catholic.

Members of the Church of Jesus Christ of Latter-day Saints (widely known as Mormons) account for 2% of respondents in the new RLS, which is virtually unchanged from both the 2007 and 2014 landscape surveys. Orthodox Christians make up 1% of the U.S. population. Jehovah’s Witnesses and other, smaller Christian groups round out the country’s Christian population.

A closer look at Protestant denominational families

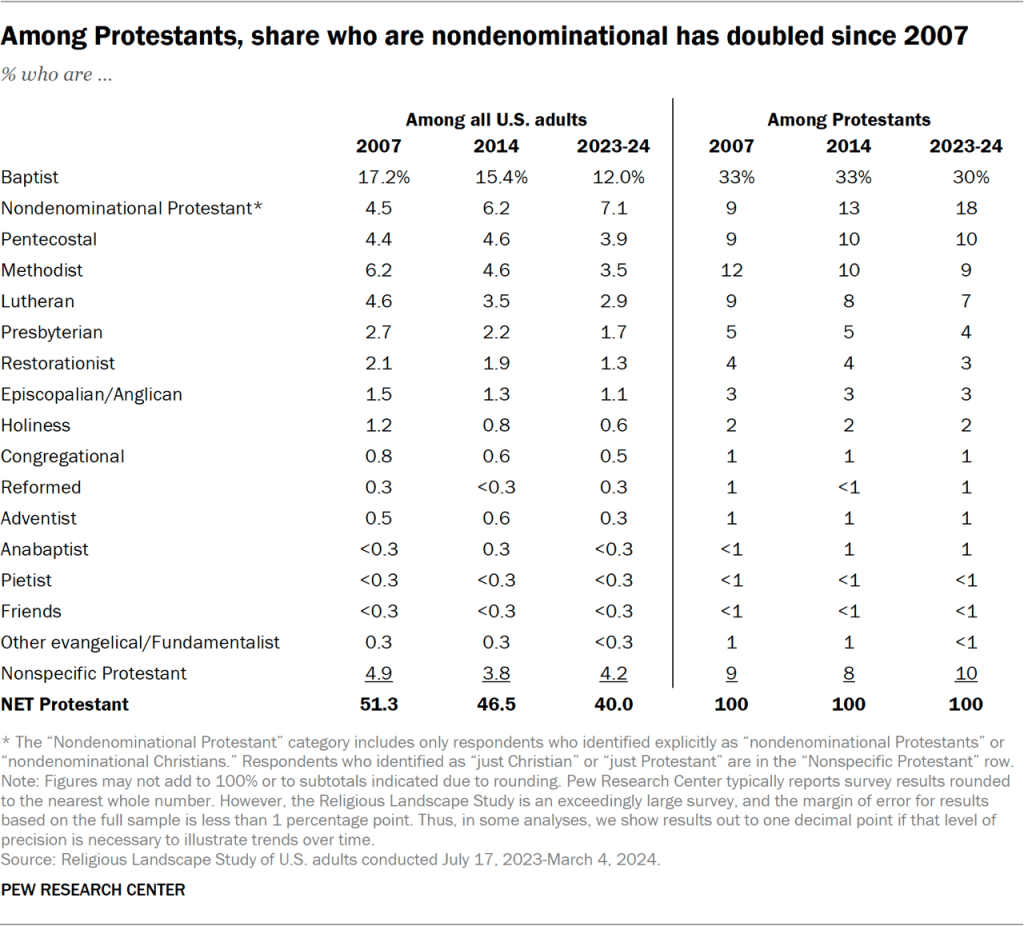
Many Protestant denominational families are slightly smaller today than they were in 2014 – at least nominally, even if some of the changes are too small to be statistically significant.
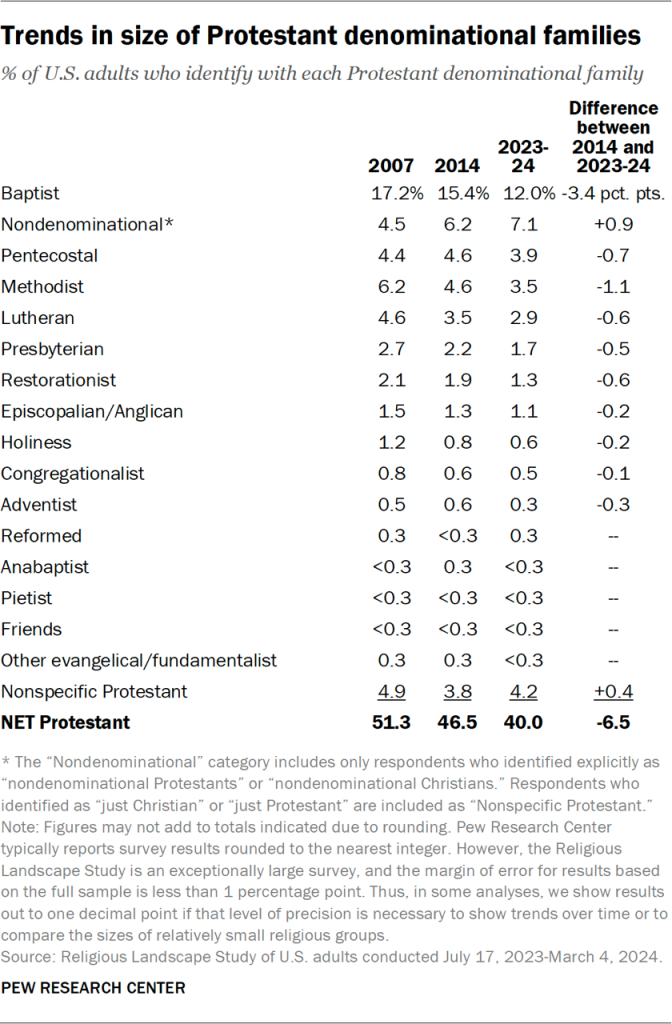
Table showing trends in size of Protestant denominational families

One exception to this pattern is nondenominational Protestantism. The share of Americans identifying with this group is slightly higher today than it was in 2014 (7.1% vs. 6.2%).8

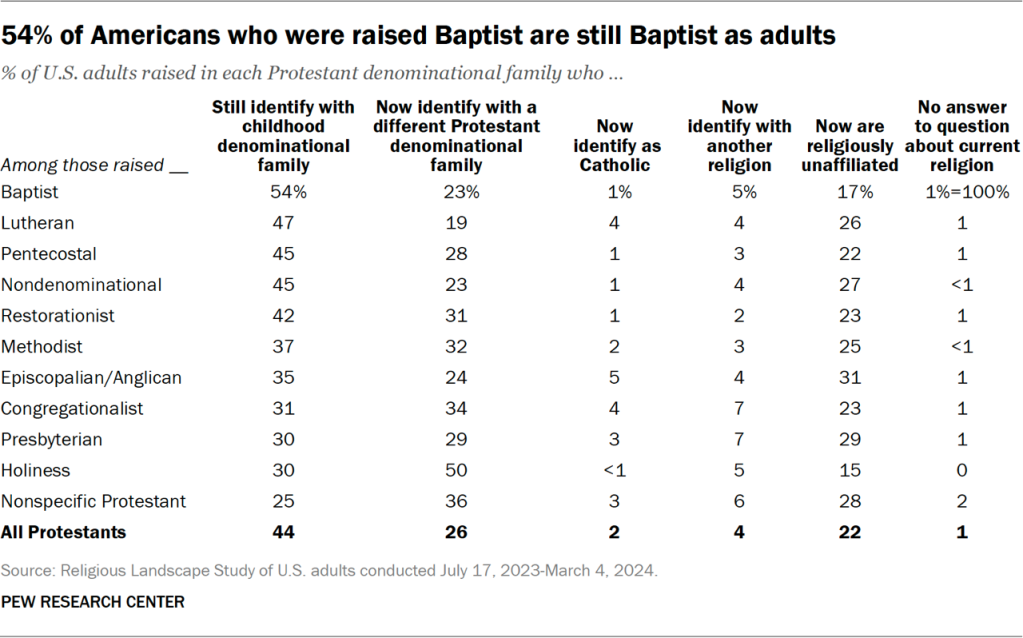
Baptists continue to be the single largest Protestant denominational family in America. Today, 12% of U.S. adults are Baptists, down from 15% in 2014 and 17% in 2007.

Members of Pentecostal churches account for 4% of the U.S. adult population.

Methodists and Lutherans each make up 3% of the population, while 2% of U.S. adults identify as Presbyterians.

Detailed information about Protestant denominations is not available from Pew Research Center’s annual NPORS, making it difficult to know whether the size of denominations has stabilized in recent years.

Categorizing Protestants into one of three traditions based on their denomination

One unique feature of the Religious Landscape Study (RLS) is its detailed questions about religious affiliation. All respondents are asked an initial question about their religious identity (“Are you Protestant, Catholic … Jewish, Muslim, etc.?”).

Then, Protestants are asked a second question to get more information about what type of church they identify with (“Are you Baptist, Methodist, Lutheran, etc.?”).

Finally, depending on how they answer that second question, Protestants are asked a third question to try to determine which denomination they identify with. (Complete details on how these branching questions work and the exact wording of these questions are available in the questionnaires. Refer to the English paper questionnaire; Spanish paper questionnaire; and combined English/Spanish questionnaire for the web/phone administration.)

Pew Research Center researchers then take the most specific information respondents provide about their denominational identity and use it to group Protestants into one of three major traditions – the evangelical Protestant tradition, mainline Protestant tradition, or the historically Black Protestant tradition. These divisions within Protestantism are important, because each tradition has its own, distinctive set of beliefs, practices and histories.

For example, churches in the evangelical tradition tend to share the conviction that personal acceptance of Jesus is the only way to salvation; to emphasize bringing other people to the faith; and to have originated in separatist movements against established religious institutions. Churches in the mainline tradition, by comparison, tend to take a less exclusive view of salvation and to place more emphasis on social reform. Churches in the historically Black Protestant tradition have been shaped uniquely by the experiences of slavery and segregation, which put their religious beliefs and practices in a special context.

It’s important to note that not all Protestant respondents identify with a specific denomination. Many Protestants identify as “just Baptist” or “just Methodist,” say they don’t identify with any particular denomination, or describe themselves as “just Christian.” In these cases, respondents are categorized into one of the three Protestant traditions based on their answers to a question asking whether they think of themselves as born-again or evangelical Christians, and/or a question asking about their race. Protestants who do identify with a specific denomination are grouped into one of the three Protestant traditions based exclusively on their denominational affiliation.

For example, all Southern Baptists are coded as evangelical Protestants regardless of their race, and all United Methodists are coded as mainline Protestants regardless of their answer to the question about whether they think of themselves as a born-again or evangelical Christian. Complete details on the categorization of Protestantism are available in Appendix B.

The Southern Baptist Convention (SBC) – which Pew Research Center categorizes as part of the evangelical Protestant tradition – remains the nation’s single largest Protestant denomination. Today, 4.4% of U.S. adults say they identify with the SBC, down from 5.3% in 2014 and 6.7% in 2007.

Some of the other large evangelical denominational groupings include:

  • The Assemblies of God, which we classify as a Pentecostal church (1.1% of U.S. adults)
  • The Lutheran Church-Missouri Synod (1.1%)
  • Churches of Christ (1.1%)9
  • The Presbyterian Church in America (0.5%)

The United Methodist Church – a mainline Protestant denomination in the Center’s coding – makes up 2.7% of the U.S. population, compared with 3.6% in 2014 and 5.1% in 2007. The United Methodist Church has splintered in recent years, and many of its former churches have “joined the more conservative Global Methodist Church,” according to The Associated Press.10

Other large mainline denominations include:

  • The Evangelical Lutheran Church in America, or ELCA (1.4% of U.S. adults)
  • The American Baptist Churches USA (1.0%)
  • The Episcopal Church (0.9%)
  • The Presbyterian Church (USA), at 0.8%

The National Baptist Convention, USA – a denomination in the historically Black Protestant tradition – was named by 1.0% of survey respondents. Other large historically Black Protestant denominations in the survey include:

  • The Church of God in Christ (COGIC), a Pentecostal denomination mentioned by 0.7% of respondents
  • The National Baptist Convention of America (0.4%)
  • The Progressive National Baptist Convention (mentioned by fewer than 0.3% of respondents)
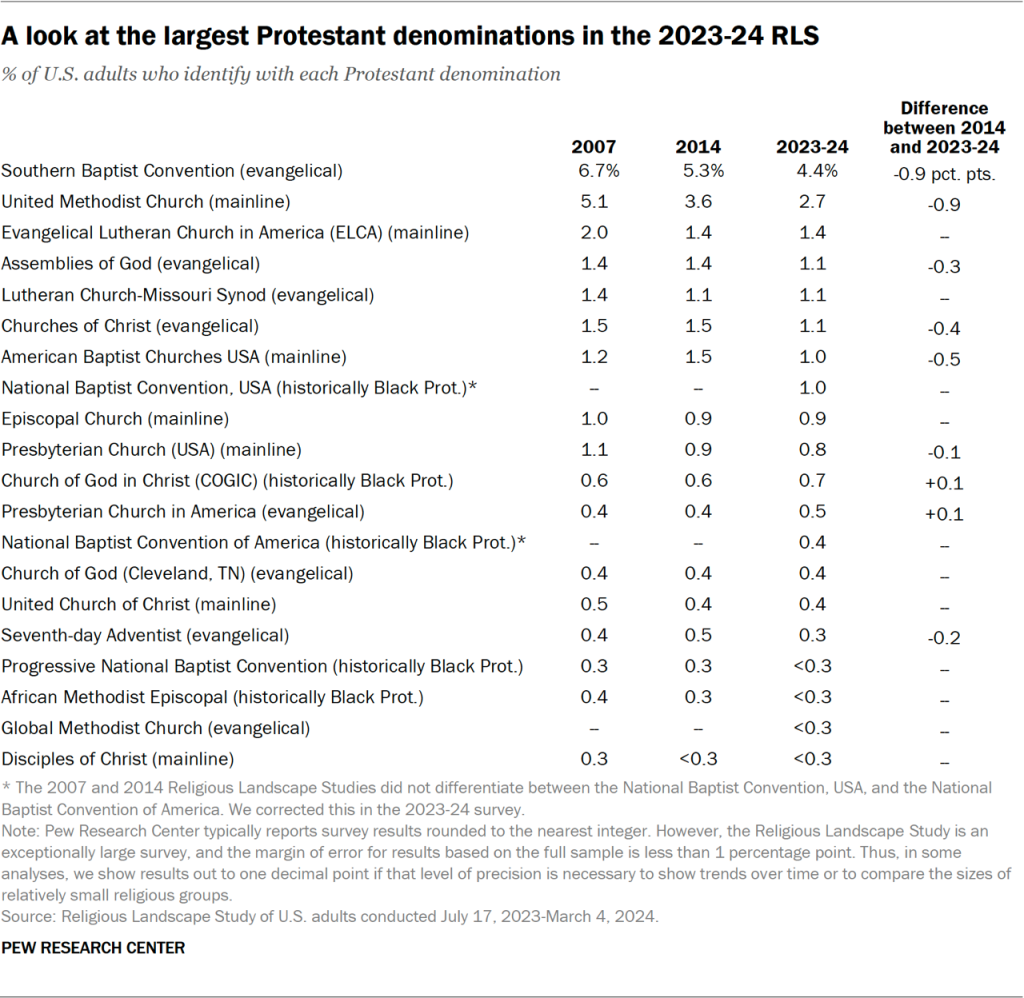
  • The African Methodist Episcopal Church (also mentioned by fewer than 0.3% of respondents)
Table showing a look at the largest Protestant denominations in the 2023-24 RLS

Identifying with religions other than Christianity

The share of Americans who identify with a religion other than Christianity has been trending upward, from 4.7% in 2007 to 7.1% today.

Table showing 1.7% of U.S. adults identify religiously as Jewish; Muslims, Buddhists and Hindus each make up roughly 1% of Americans

Overall, 1.7% of adults identify as Jewish when asked about their religion – on par with results from the previous landscape studies and Pew Research Center’s 2020 survey of Jewish Americans.

Muslims, Buddhists and Hindus each account for roughly 1% of the U.S. adult population. All three of these groups are larger today than they were in 2007.

An additional 0.3% of respondents identify with other world religions (including Bahai’ism, Daoism, Rastafarianism, Sikhism and traditional African religions).

And 1.9% of U.S. adults identify religiously as something else, including 1.1% of respondents who identify with Unitarianism or other liberal faiths, and 0.7% who identify with New Age groups.11

Religious affiliation of U.S. immigrants

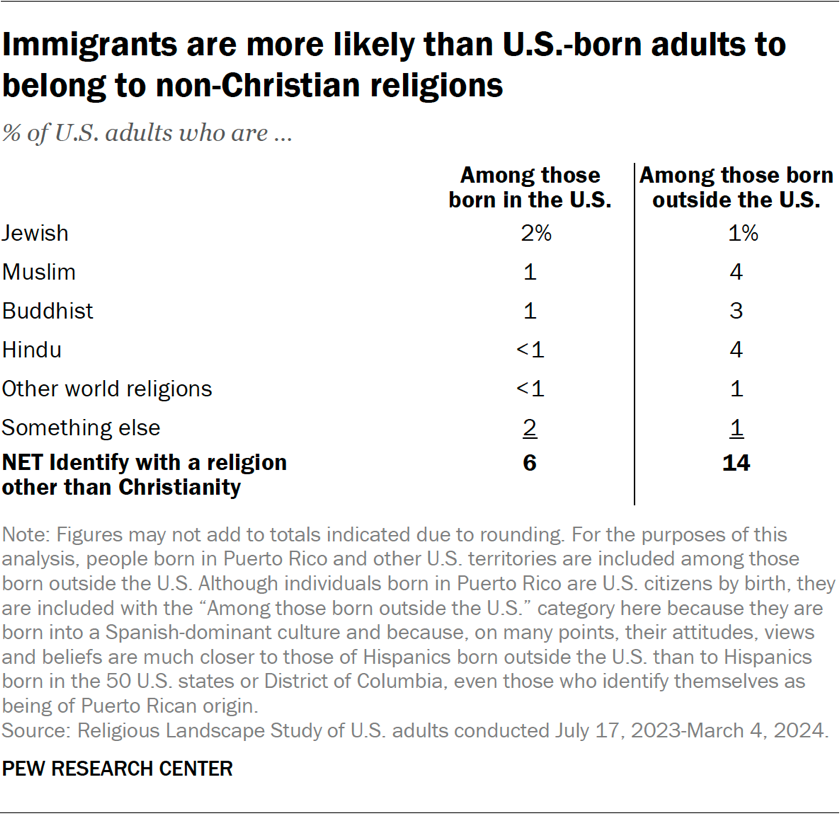
About 14% of U.S. adults who were born outside the country identify with religions other than Christianity, including 4% of U.S. immigrants who are Muslim, 4% who are Hindu, and 3% who are Buddhists.12

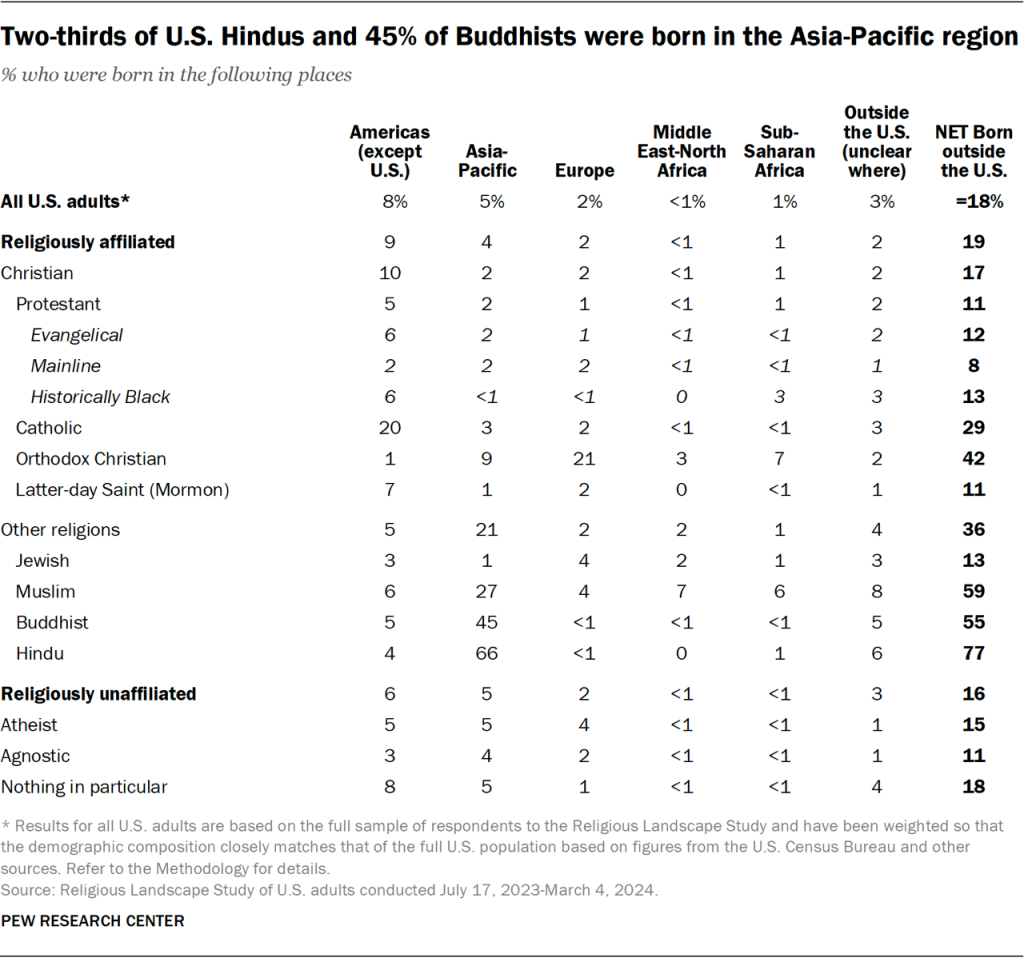
Most immigrants to the U.S. who were born in other parts of the Americas are Christian (72%), including 45% who are Catholic. Among immigrants from Europe, 57% are Christian, 8% identify with other religions, and 34% are religiously unaffiliated.

Immigrants born in the Asia-Pacific region are divided about evenly between Christians, adherents of non-Christian religions (including 14% who are Hindu, 11% who are Buddhist and 7% who are Muslim), and the religiously unaffiliated.13

The survey did not include enough respondents born in the Middle East-North Africa or sub-Saharan Africa regions to be able to report on them separately.

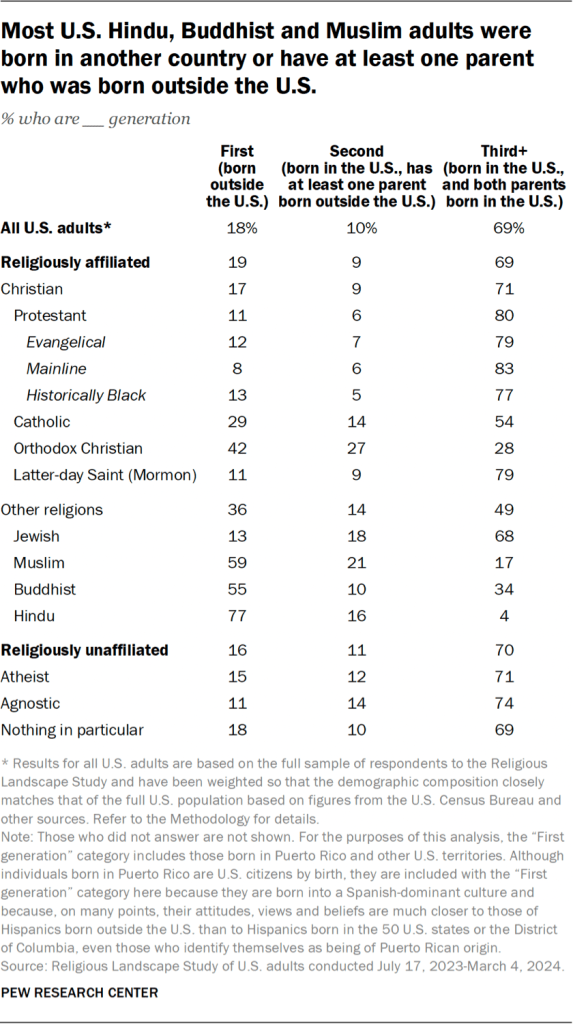
Among respondents who were born in the U.S. but had at least one parent born outside the U.S. (i.e., second-generation Americans), 10% identify with religions other than Christianity.

By comparison, among people born in the U.S. to parents both of whom also were born in the U.S. (i.e., at least third-generation Americans), 5% identify with non-Christian religions.
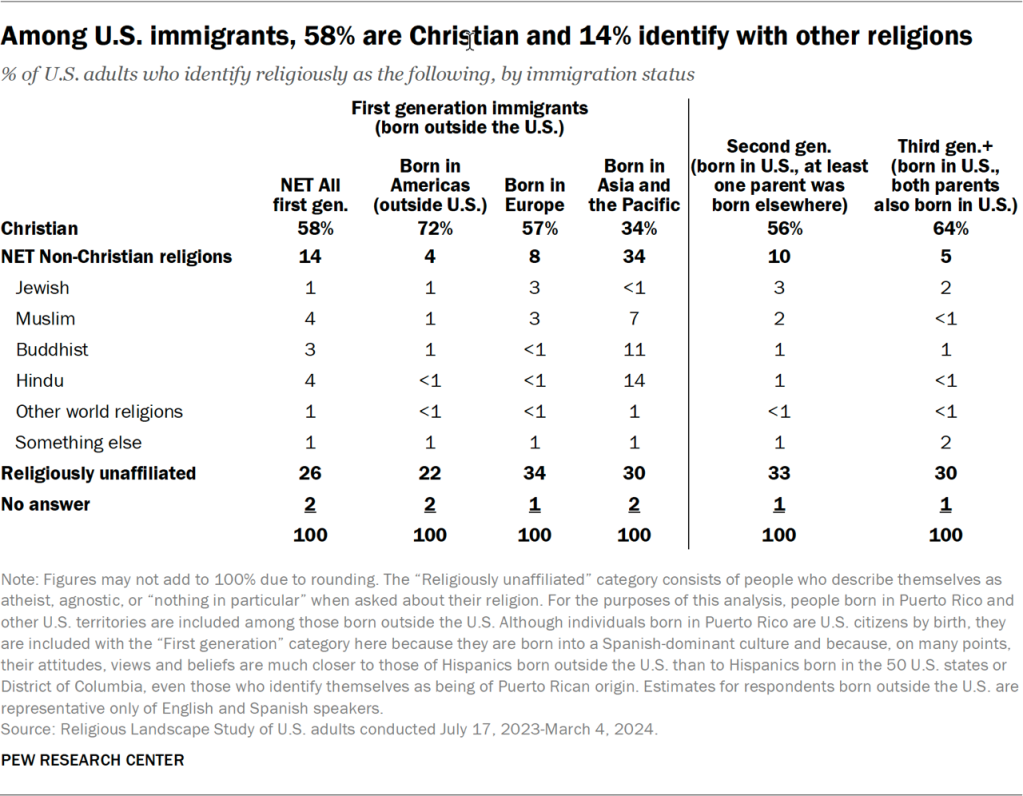
Table showing that among U.S. immigrants, 58% are Christian and 14% identify with other religions

More broadly, the survey finds that the long-term decline in Christianity and growth of the religiously unaffiliated population is evident among immigrants, second-generation respondents (people who were born in the U.S. but had at least one parent born elsewhere), and people whose families have been in the U.S. for three generations or more.

For example, among respondents born outside the U.S., the Christian share of the population declined from 75% to 58% between 2007 and 2023-24. Over the same period, the religiously unaffiliated share of this group (immigrants to the U.S.) grew from 16% to 26%, and the share identifying with religions other than Christianity grew from 8% to 14%.

For more details on trends in the religious composition of U.S. adults, refer to Chapter 1.
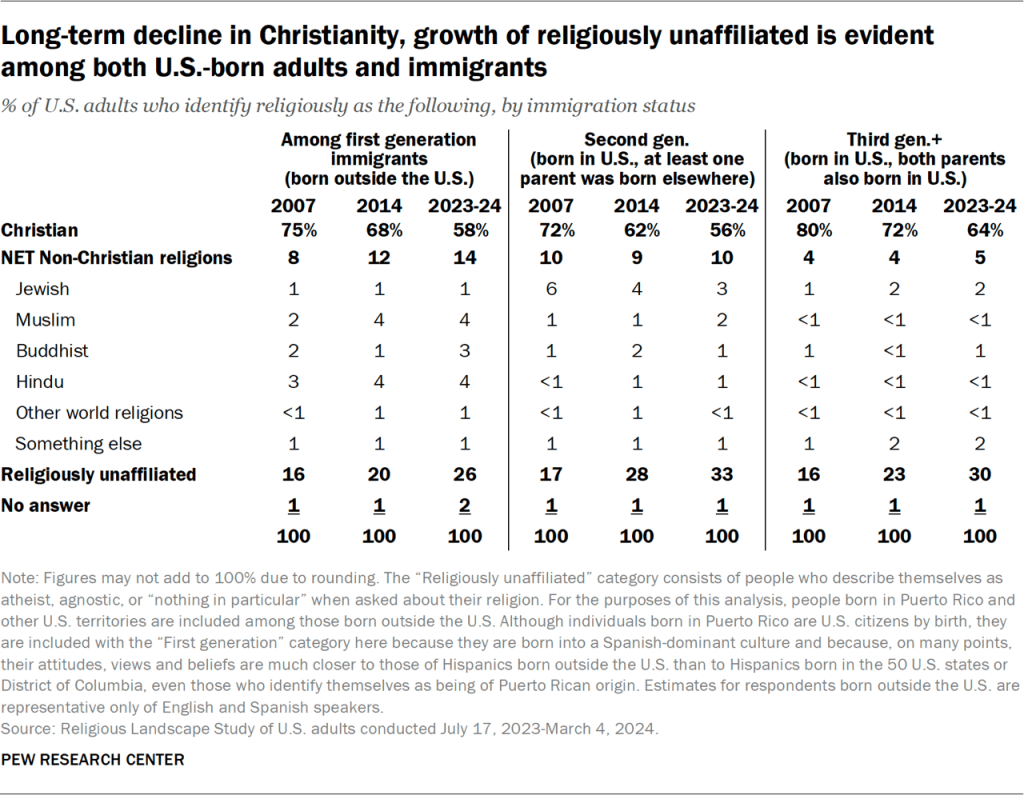
Table showing the long-term decline in Christianity, growth of religiously unaffiliated is evident among both U.S.-born adults and immigrants

Race in religious groups and congregations

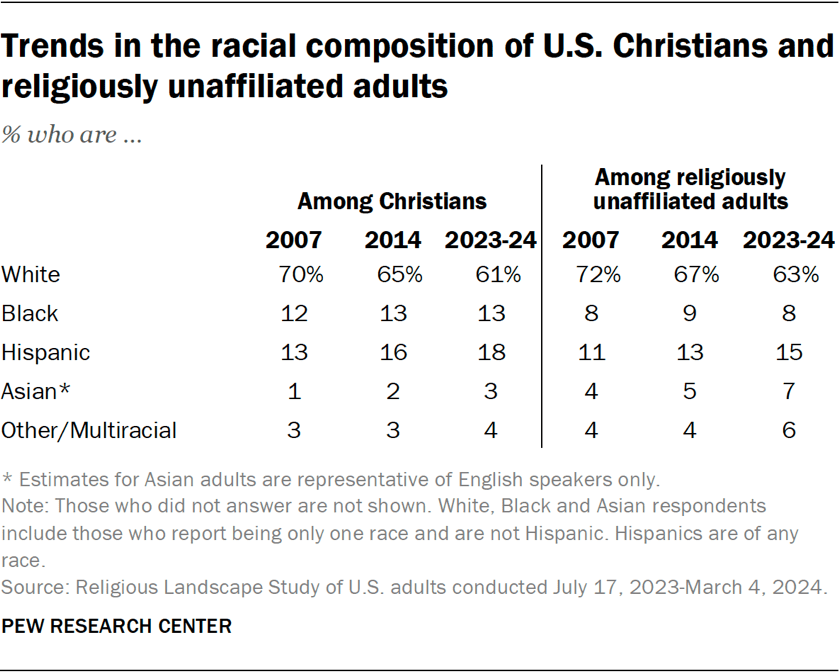
Like the U.S. public as a whole, both Christians and religious “nones” have experienced a decline in the shares who are White.

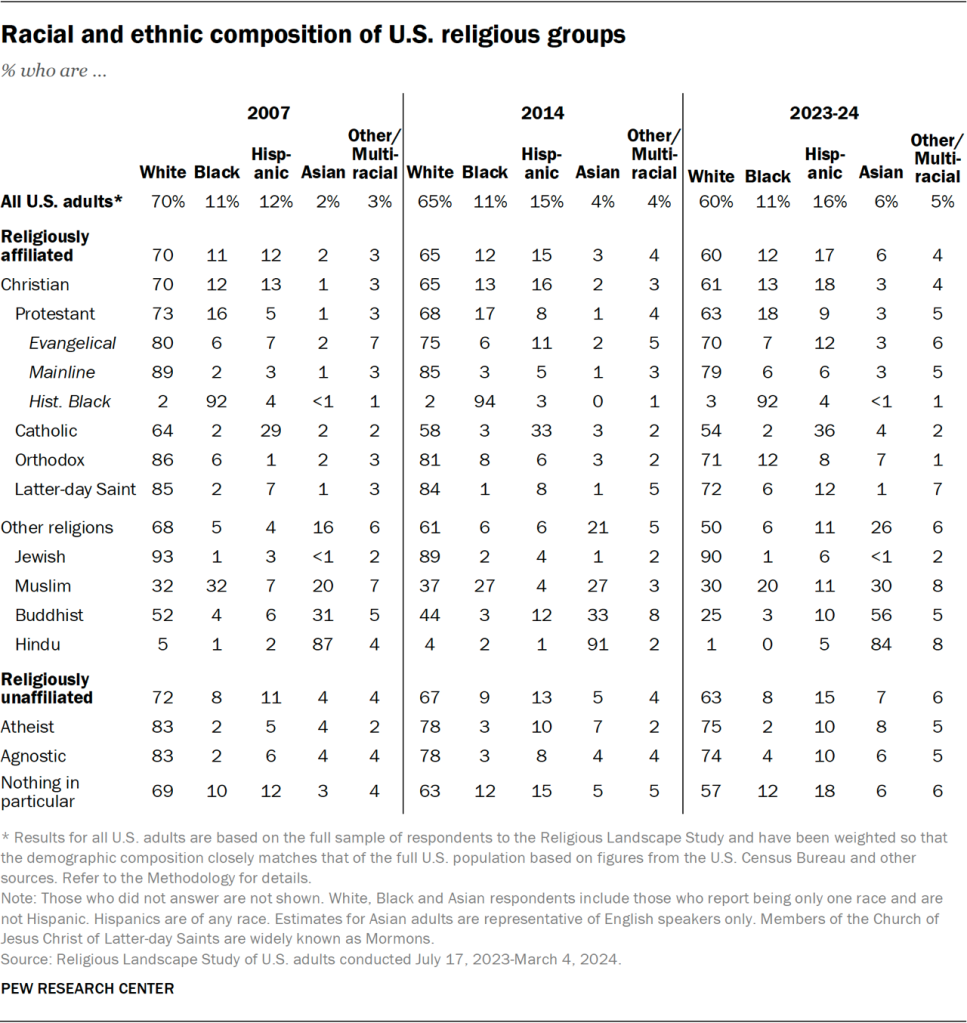
Among Christians in the new survey, 61% are White (and non-Hispanic), 18% are Hispanic, 13% are non-Hispanic Black, 4% describe themselves as multiracial or in another way, and 3% are non-Hispanic Asian.

In 2007, by comparison, 70% of Christians said they were White, 13% were Hispanic, 12% were Black, 3% identified as multiracial or in another way, and 1% were Asian.
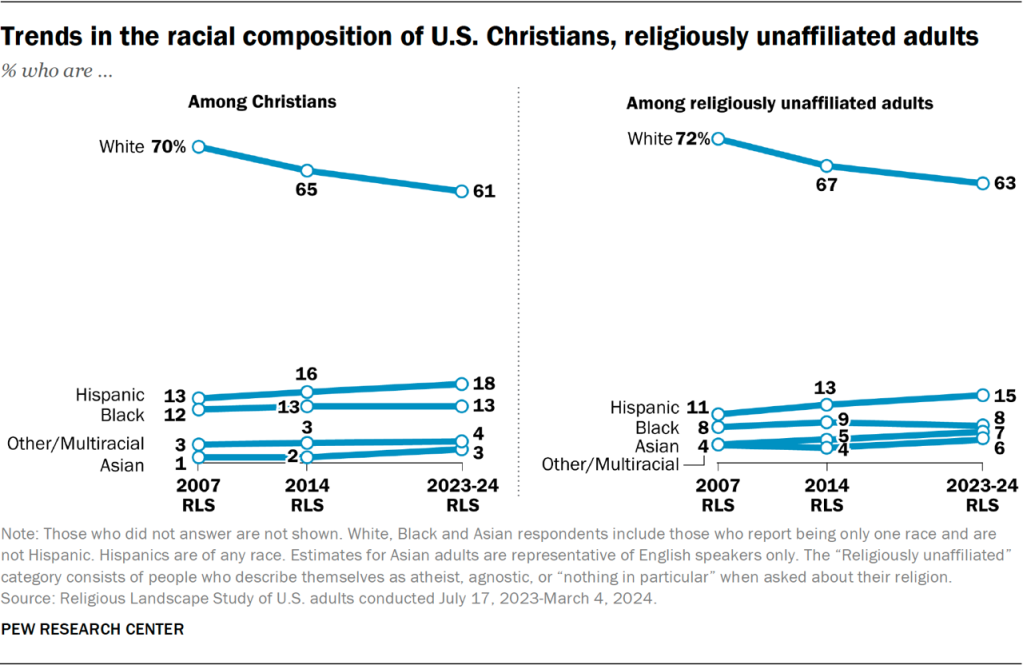
Line charts showing the trends in the racial composition of U.S. Christians, religiously unaffiliated adults

In the new survey, 92% of respondents in the historically Black Protestant tradition are Black themselves, while 4% are Hispanic and 3% are White.

In most other Christian traditions large enough to be analyzed in the survey, seven-in-ten or more adherents are White. Catholics are an exception: 54% in the new survey are White, while 36% are Hispanic, 4% are Asian, and 2% are Black.

Table showing the racial composition of religious groups in the U.S.

Nine-in-ten Jewish respondents in the new survey are White. Among Hindu respondents, 84% are Asian, as are 56% of Buddhists in the survey.

Muslim respondents in the new study include 30% who are White, 30% who are Asian, 20% who are Black and 11% who are Hispanic.

Roughly three-quarters of atheists (75%) and agnostics (74%) in the new survey are White; fewer people who describe their religion as “nothing in particular” are White (57%).

(For a detailed discussion of the racial and ethnic composition of religious groups, refer to Chapter 24.)

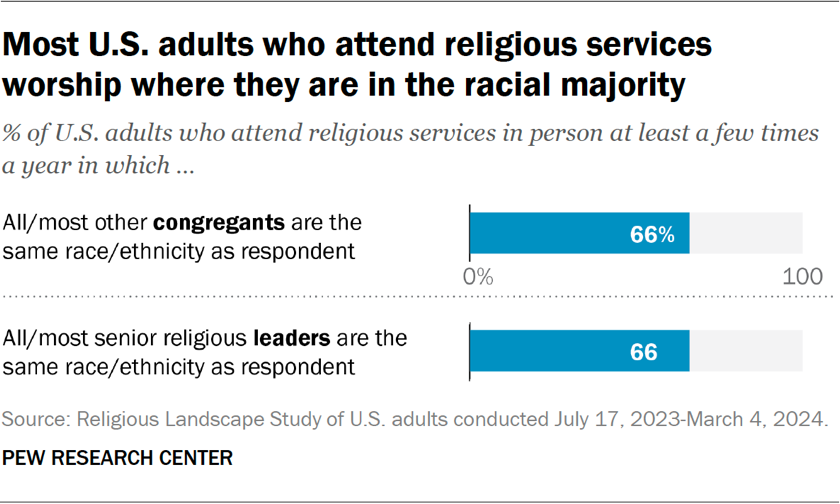
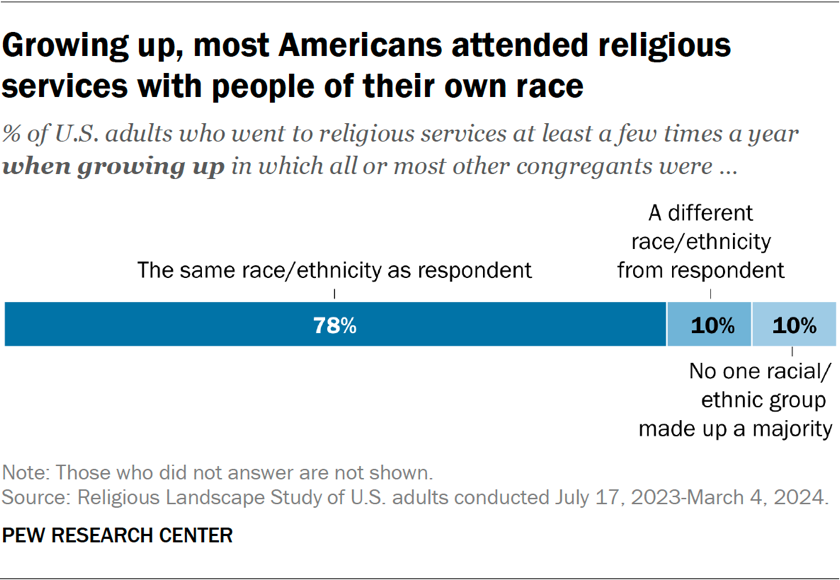
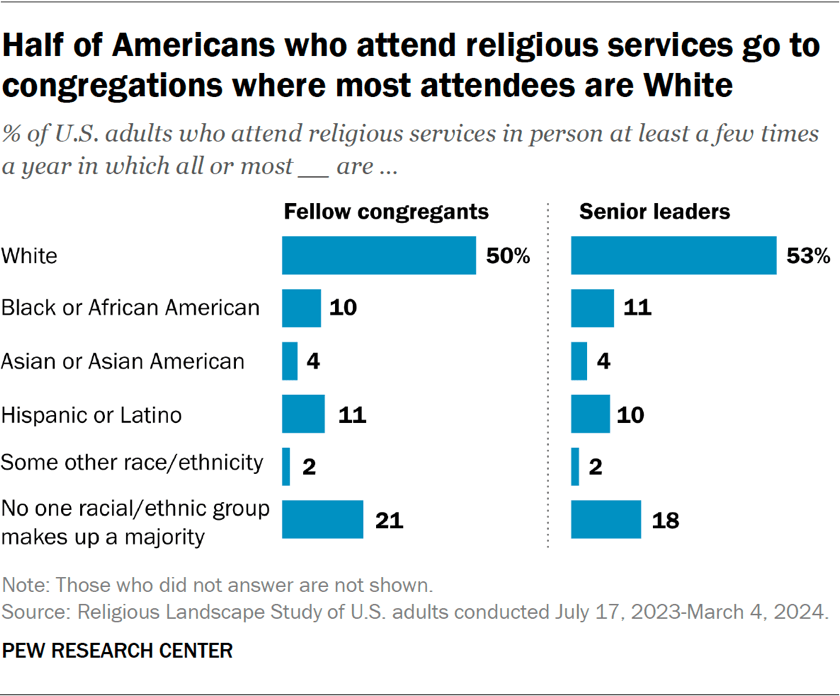
The survey asked people who attend religious services at least a few times a year about the racial and ethnic makeup of the congregation they attend. And it asked a similar question about the racial and ethnic composition of the congregation that respondents attended as children.

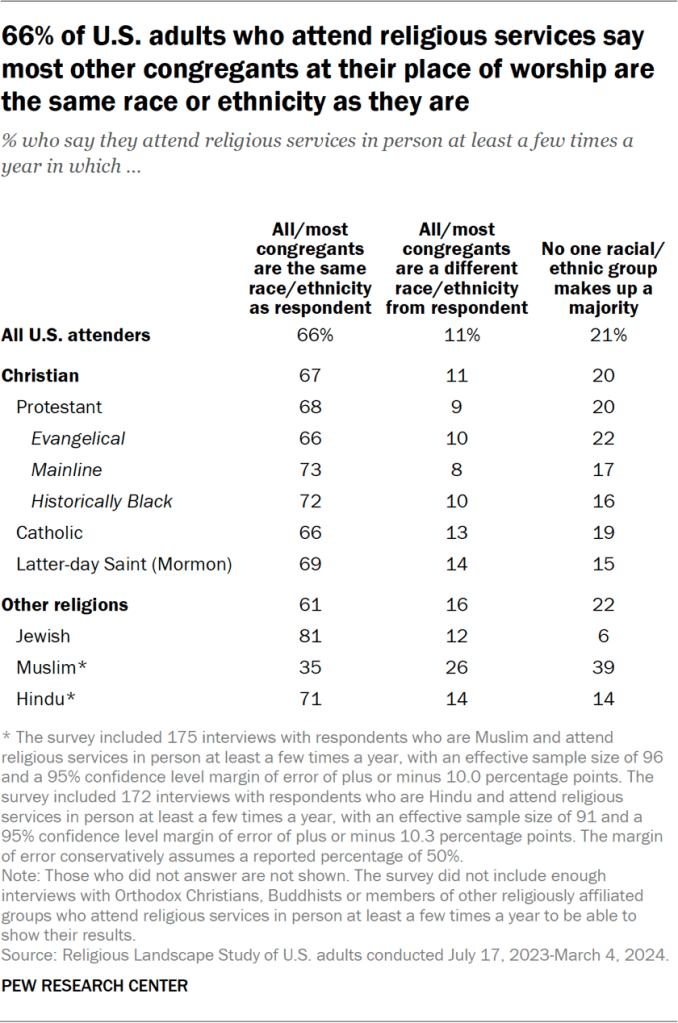
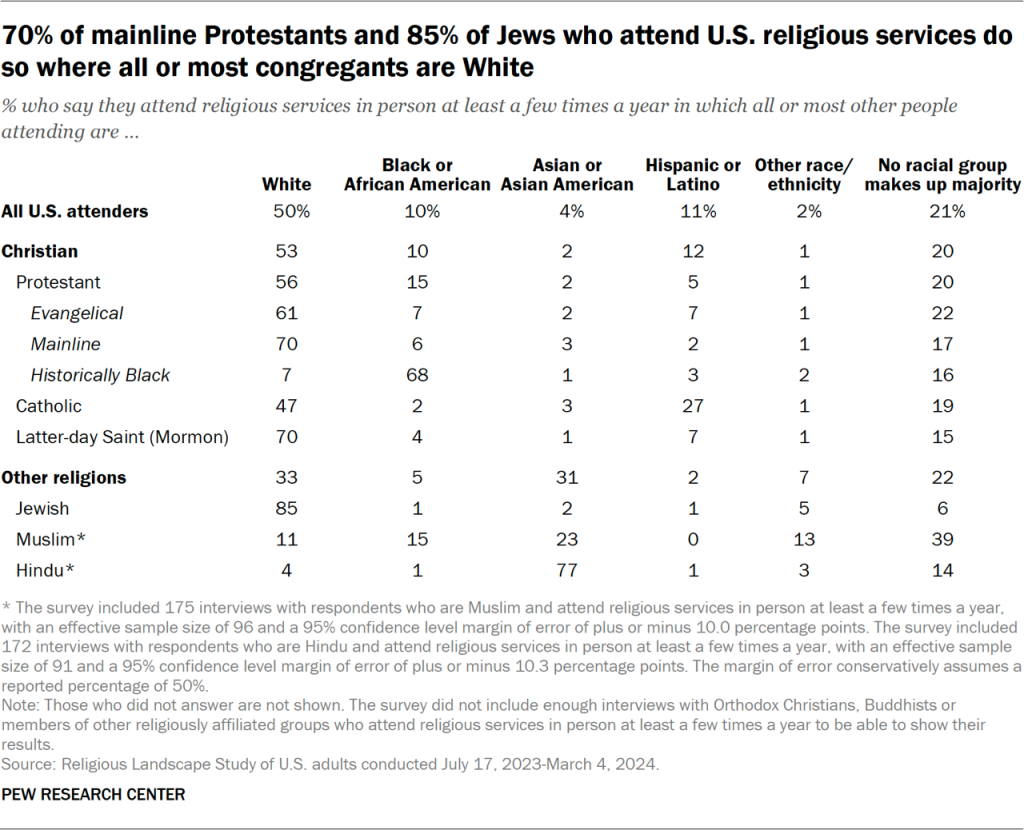
Among people who attend religious services, roughly one-third currently attend a congregation where they, themselves, are not part of a racial or ethnic majority. This includes 11% who say that most of their fellow worshippers have a different race or ethnicity than they do and 21% who say that no one racial or ethnic group makes up a majority.

Fewer people (roughly one-fifth of respondents) say they grew up attending a congregation where they, themselves, weren’t in a racial or ethnic majority. This includes 10% who grew up going to religious services at least a few times a year at a house of worship where most people belonged to a different race or ethnicity than they did, and an additional 10% who say that no single racial or ethnic group predominated at those services.

For more on race in religious congregations, refer to Chapter 9.
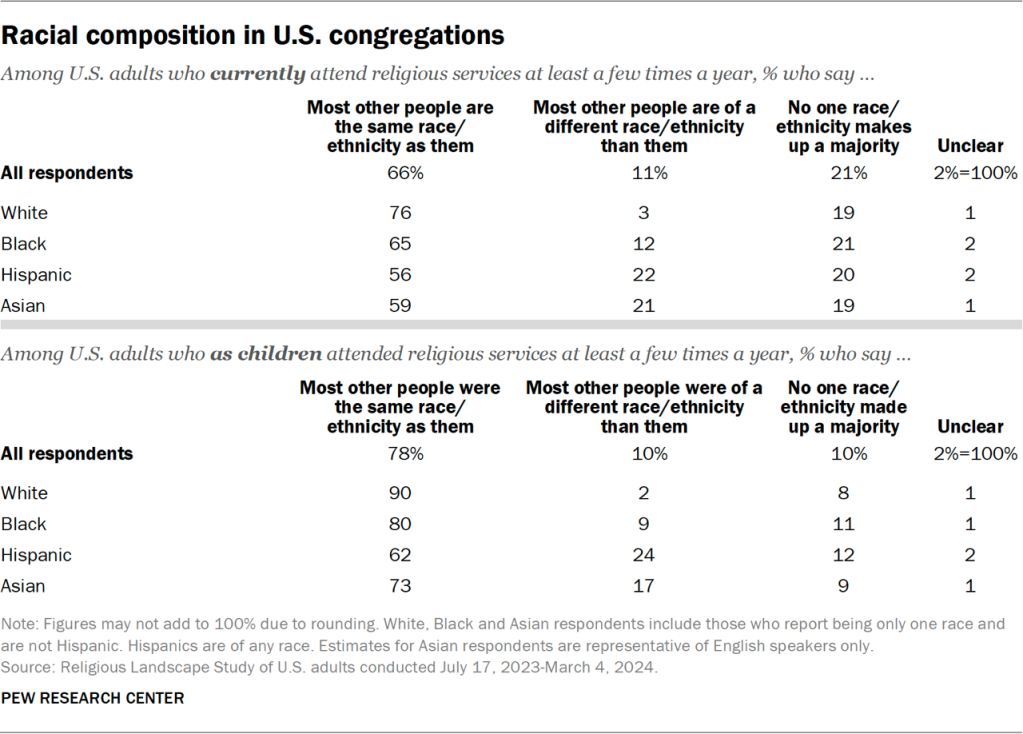
Table showing the racial composition in U.S. congregations

The narrowing gender gap in American religion

Recent news accounts suggest that among the youngest Americans, men are more religious than women. This would be a major reversal from the past. Historically, U.S. women consistently have exhibited higher levels of religiousness (on average) than men.14

In the new RLS, women continue to report higher levels of religious affiliation, belief and practice than men do. At the same time, there are signs that the gender gap in religion is narrowing, as it is smaller among younger people than among older Americans.

Chart showing the gender gap in U.S. religion shows signs of narrowing

For example, in 2007, the share of women who said they pray every day exceeded the share of men who did so by 17 percentage points. In the new survey, women still report praying at higher rates than men. But the difference is slightly narrower, at 13 points.

Among the oldest adults in the new survey (ages 74 and older), the share of women who say they pray every day is 20 points higher than among men. By contrast, among the youngest adults (ages 18 to 24), the share of women who say they pray daily (30%) is similar to the share of men who say they do the same (26%); the 4-point gap is not statistically significant.

While the gender gap in American religion appears to be narrowing, there are still no birth cohorts in which men are significantly more religious than women. In every age group, women are at least as religious as men, and in many birth cohorts, women are significantly more religious than men.
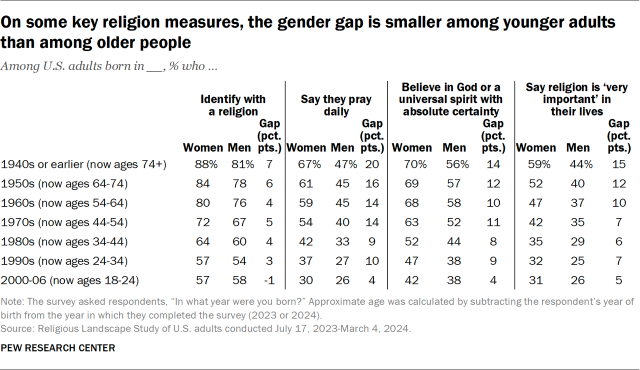
Table showing that on some key religion measures, the gender gap is smaller among younger adults than among older people

Religion in childhood and adulthood

The survey shows that Americans’ current religious identities, beliefs and practices are strongly linked with their upbringing. People who say they were raised in religious homes are much more likely to be religious as adults.

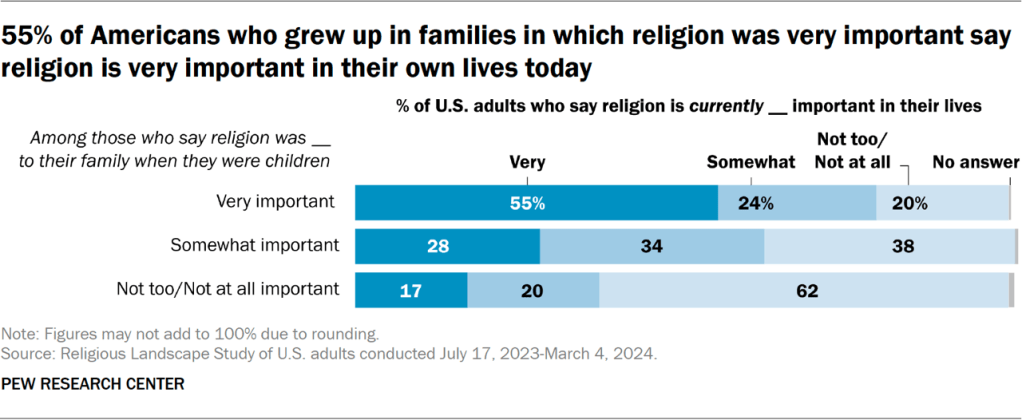
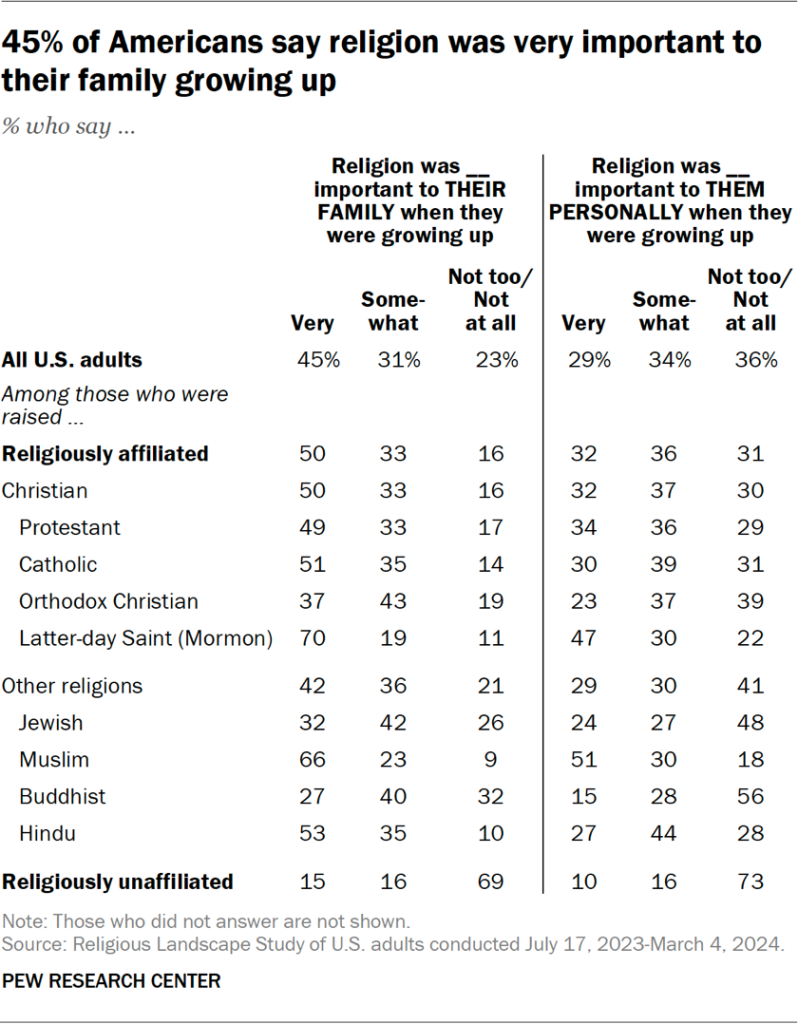
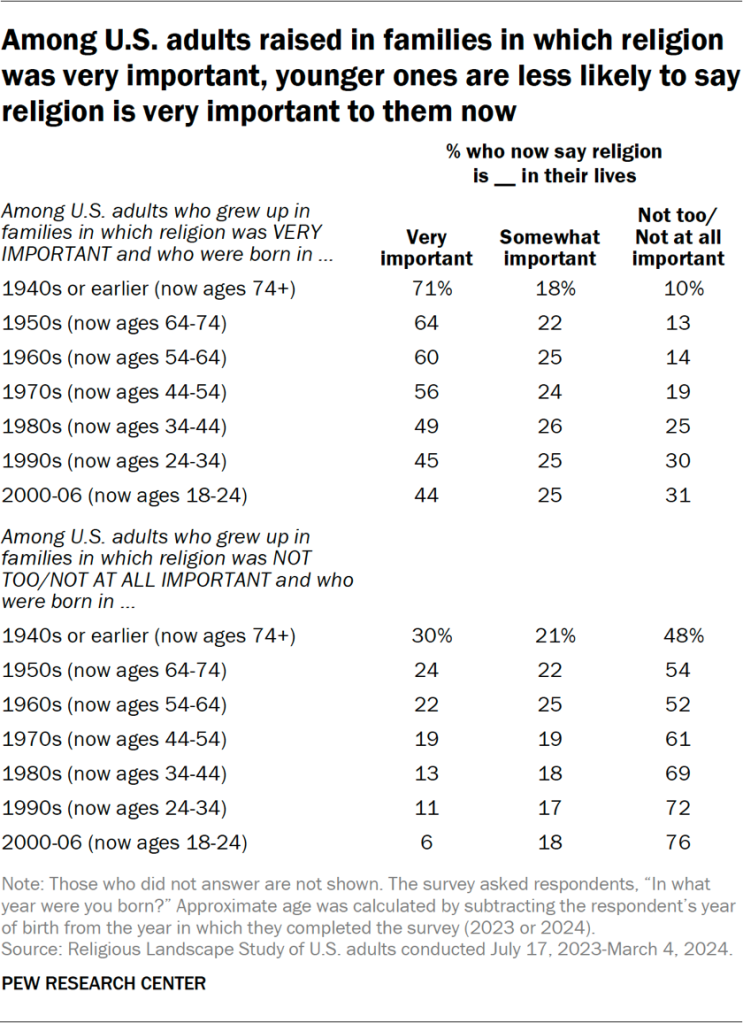
More than half of people who say religion was very important in their families while they were growing up also say religion is very important to them today. By contrast, among people who say religion was not too important or not at all important to their families during childhood, just 17% say religion is very important to them today.

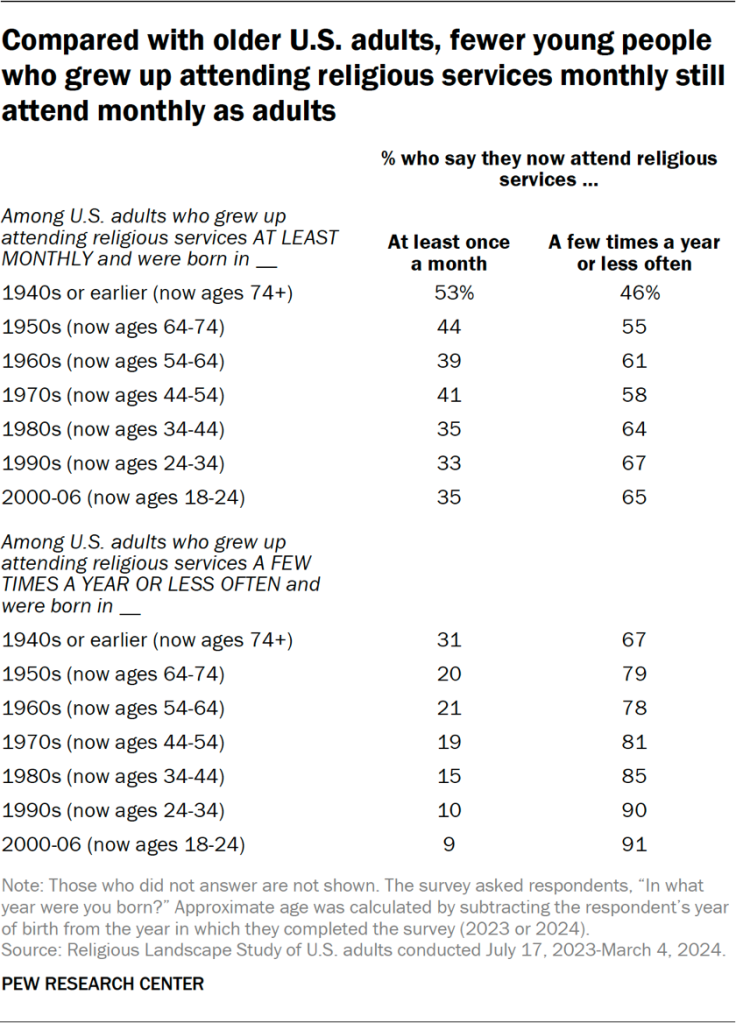
The survey finds a similar pattern on questions about religious attendance. People who grew up attending religious services regularly (at least once a month) are more than twice as likely as those who didn’t grow up attending services regularly to say they now attend religious services at least monthly.
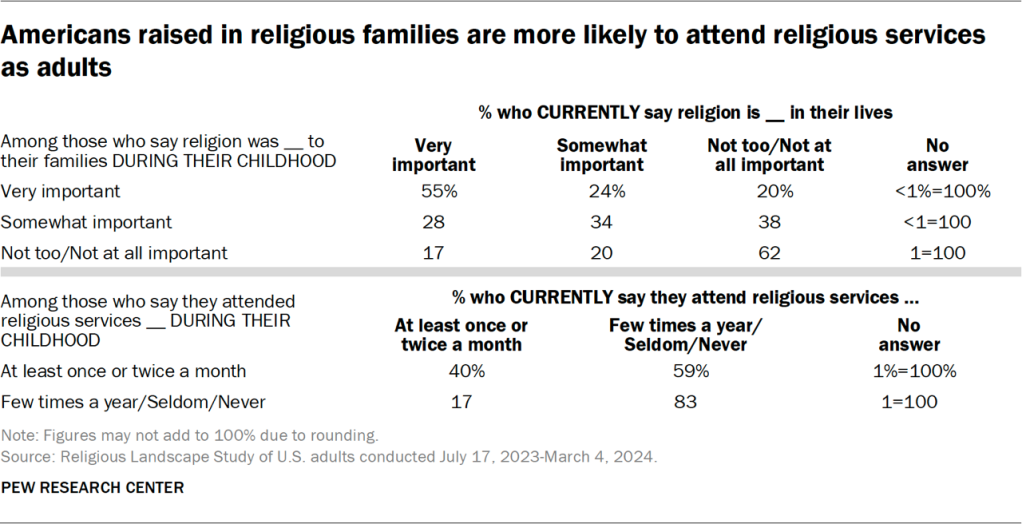
Table showing Americans raised in religious families are more likely to attend religious services as adults

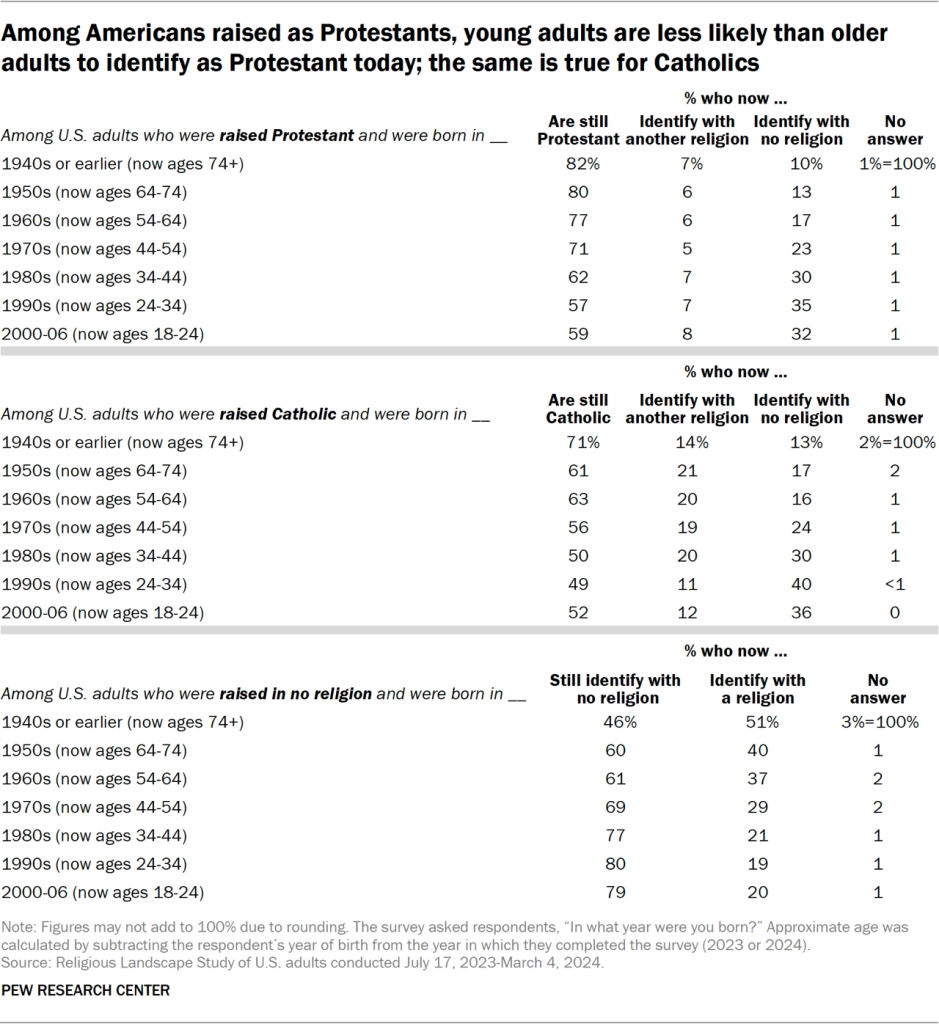
And among all respondents who were raised in a religion (i.e., among those raised Protestant, Catholic, Jewish, Muslim, or as adherents of another religious tradition), those who were raised in highly religious homes are much more likely to have retained their childhood religious identity.

Indeed, 74% of people who were raised in a religion and grew up attending weekly religious services in a family in which religion was very important still identify with their childhood religion today; 15% of respondents who grew up in this kind of environment now say they have no religion, and 10% identify with a religion different from the one in which they were raised. (Refer to the section on religious switching for details about retaining or leaving one’s childhood religion in adulthood.)

By contrast, among people who were raised in a religion but grew up seldom or never attending religious services – and in a family in which religion was not too important or not at all important – fewer than half still identify with their childhood religion. Instead, most now say they have no religion (40%) or identify with a religion different from the one in which they were raised (16%).
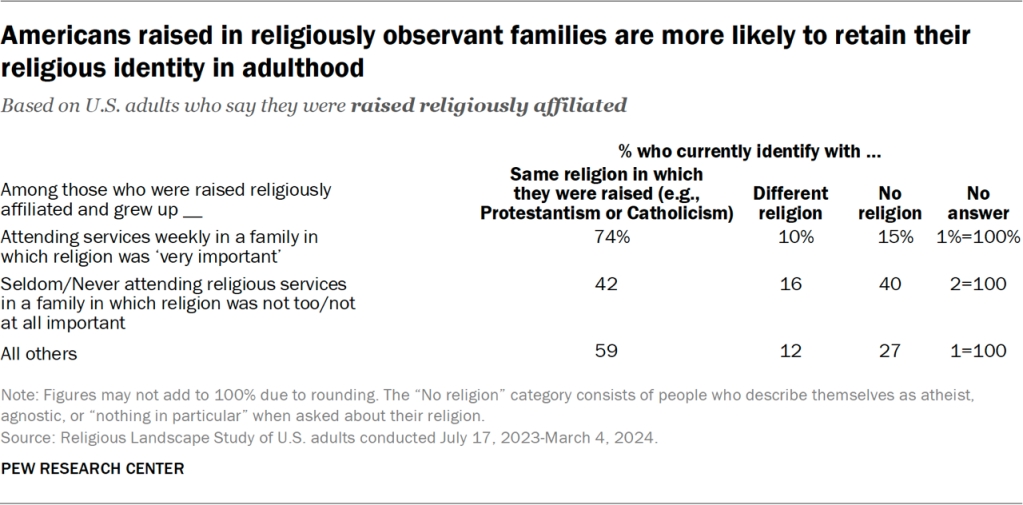
Table showing Americans raised in religiously observant families are more likely to retain their religious identity in adulthood

In short, for many people, a religious upbringing leads to a religious adulthood.15 But the survey also indicates that raising children in a religious environment is no guarantee that those children will grow up to be religious as adults.

Indeed, 40% of U.S. adults say they attend religious services less often today than they did as children. Just 5% say they attend religious services more often today than they did as kids.
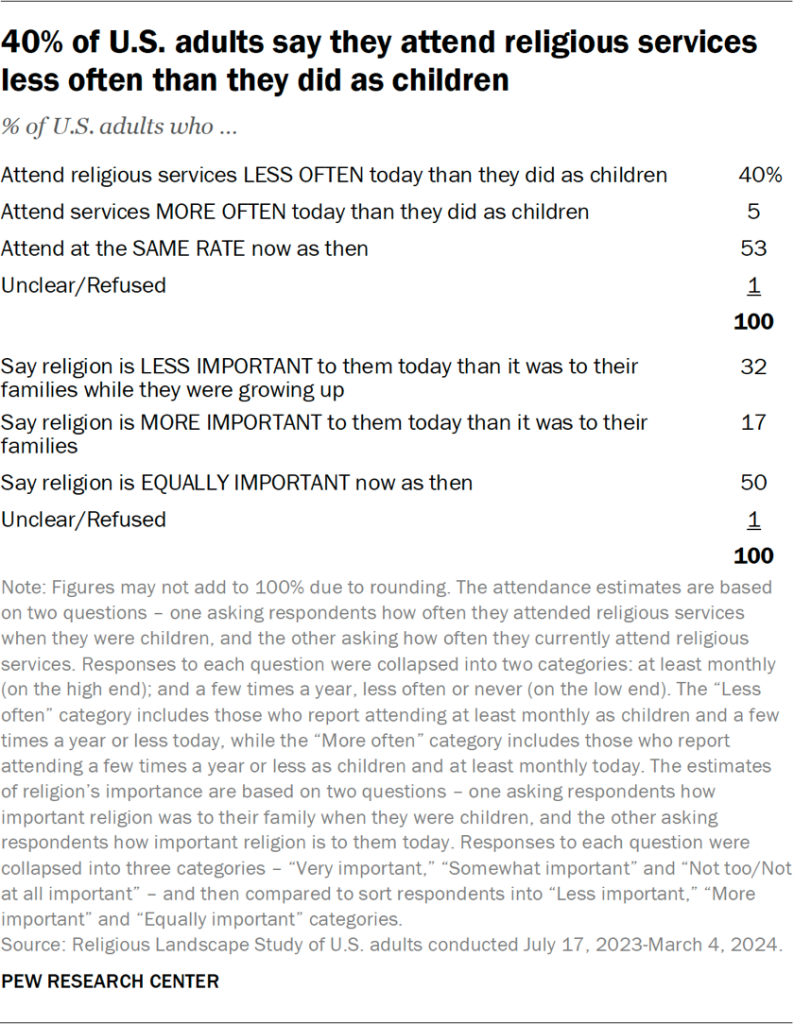
Table showing 40% of U.S. adults say they attend religious services less often than they did as children

And 32% of U.S. adults say religion is less important to them today than it was to their families when they were growing up. By contrast, 18% say religion is more important to them today than it was to their families when they were children.

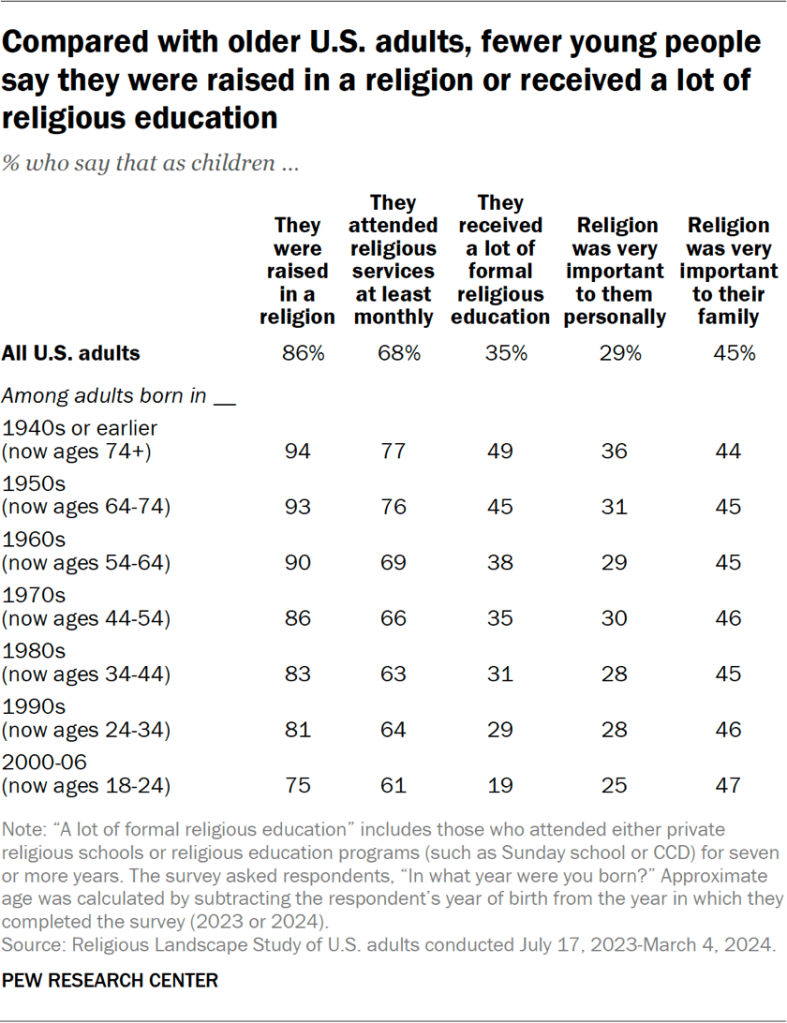
Compared with their elders, today’s youngest adults are less likely, by a variety of measures, to say they had a religious upbringing. For example, more than nine-in-ten adults ages 74 and older say they were raised in a religion, including 89% who were raised Christian. Among U.S. adults who were roughly between 18 and 24 when the survey was conducted, 75% were raised in a religion, including 67% who were raised Christian.

Two-thirds of the oldest Americans say they grew up going to religious services at least once a week. Only about half of the youngest adults say the same.

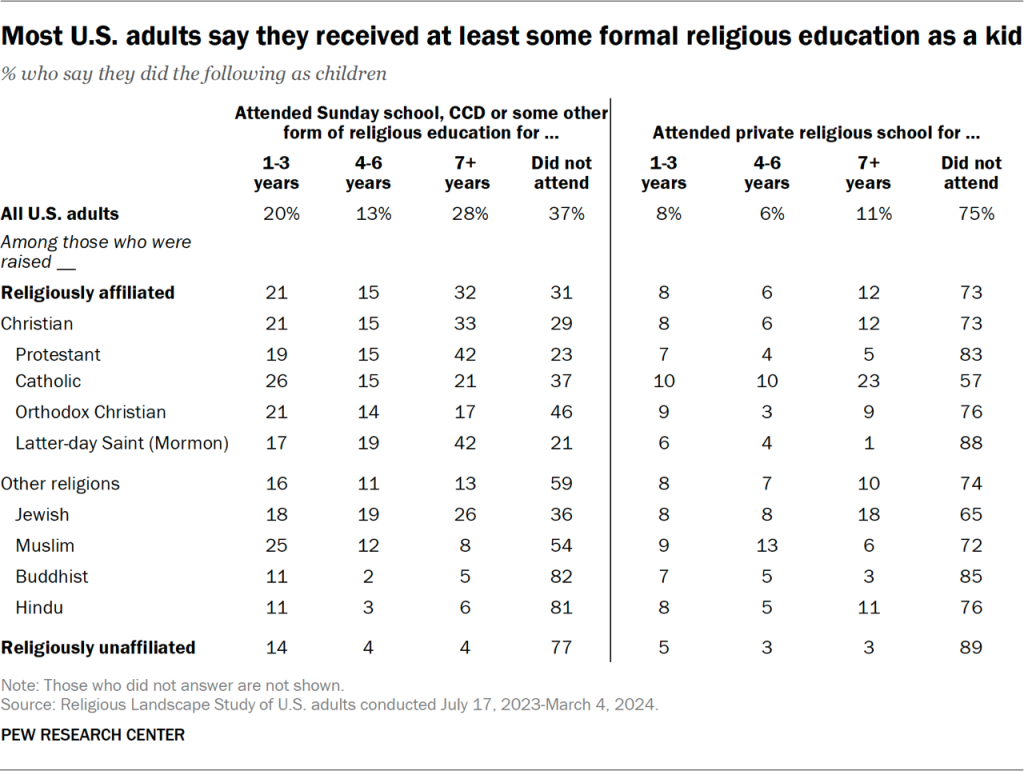
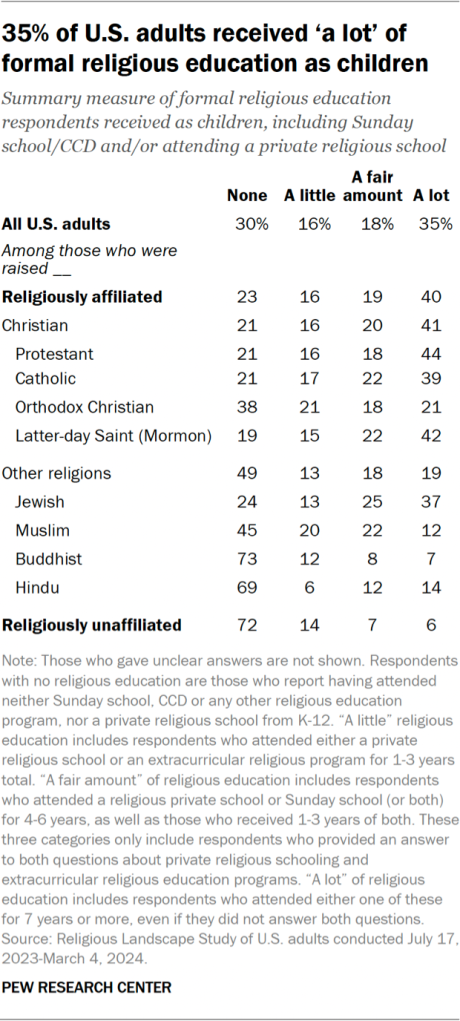
And while half of the oldest adults say that as children they received a lot of formal religious education (i.e., seven or more years), just 19% of today’s youngest adults say the same. People in the youngest age group are about twice as likely as those in the oldest age group to say they received no formal religious education at all (42% vs. 20%).

There is one exception to this pattern: Young adults are not less likely than older Americans to say religion was very important to their families when they were children. Among adults who were roughly between the ages of 18 to 24 when the new survey was conducted, 47% say religion was very important to their families when they were growing up. Among adults ages 74 and older, 44% say the same.
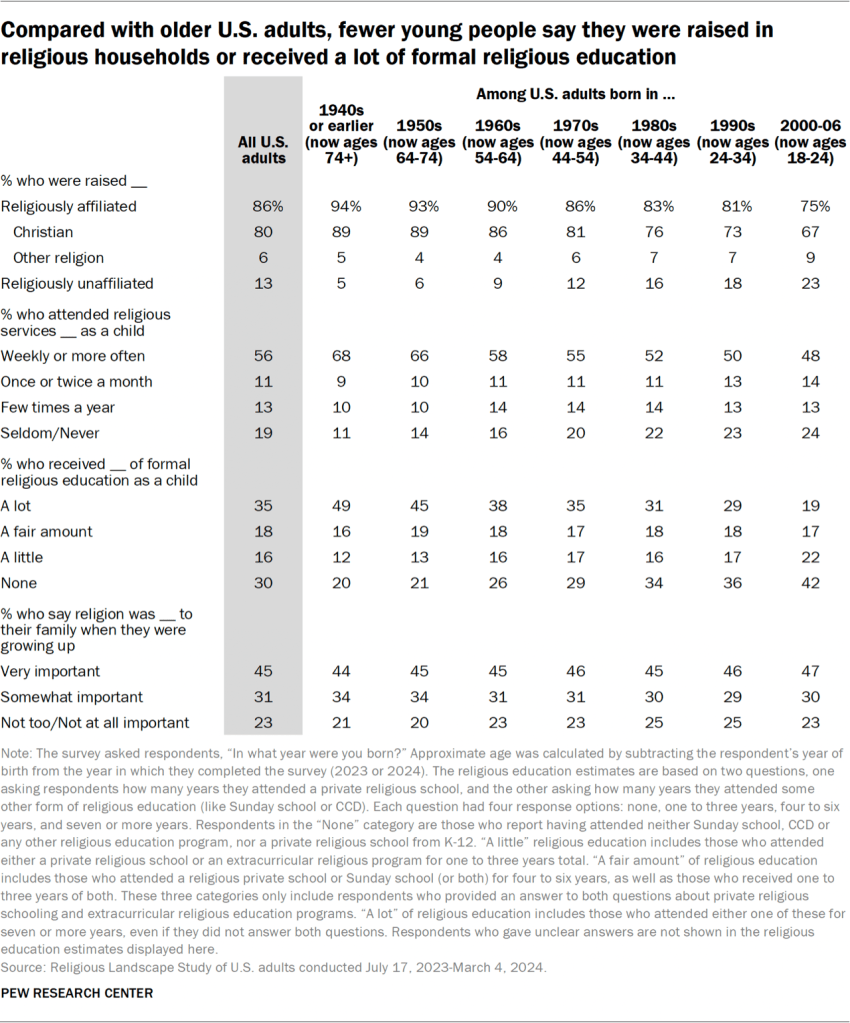
Table showing that compared with older U.S. adults, fewer young people say they were raised in religious households or received a lot of formal religious education

Moreover, the persistence of a high level of religiousness from childhood into adulthood – the “stickiness” of a religious upbringing – appears to be declining, while the stickiness of a nonreligious upbringing seems to be increasing.

In the oldest cohort of U.S. adults (ages 74 and older), 51% of those who say they grew up attending religious services weekly in families for whom religion was very important are still highly religious in these ways (i.e., they still go to services weekly and still say religion is very important in their lives).
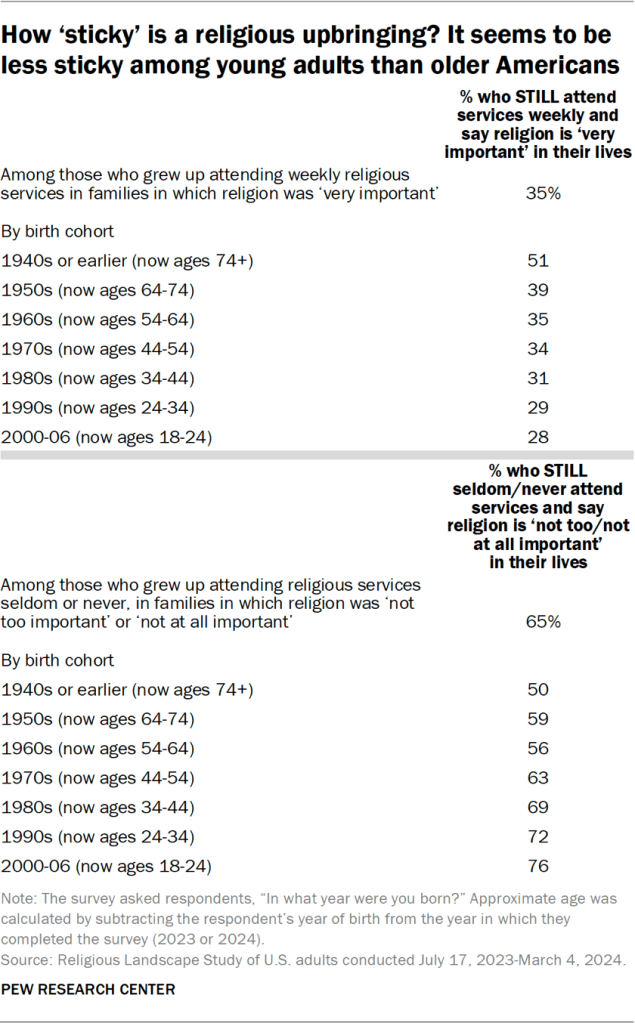
Table showing how ‘sticky’ is a religious upbringing? It seems to be less sticky among young adults than older Americans

And among people in this oldest cohort, 50% of those who say they grew up seldom or never attending religious services in families in which religion was not too important or not at all important still describe themselves as nonreligious in these ways (i.e., they still rarely or never go to services, and still say religion is not important in their lives).

In other words, a highly religious upbringing has proved to be just as “sticky” as a nonreligious upbringing over the lifetimes of the oldest Americans (now 74 and older).

By contrast, among the youngest U.S. adults in the survey (now ages 18 to 24), just 28% of those raised in highly religious homes are, today, highly religious themselves. Meanwhile, 76% of young adults who grew up rarely or never attending services, in families in which religion was unimportant, still say they don’t attend religious services and that religion is not important to them. In other words, a highly religious upbringing has been much less persistent (or “sticky”) than a nonreligious upbringing so far in the lifetimes of the youngest U.S. adults.

Of course, it’s possible that the effect of a highly religious upbringing just needs time to develop. Maybe the people in the youngest cohort will grow more religious as they age, and if they are surveyed again in 20 or 30 years, a highly religious upbringing will appear stickier than it does now. However, there is no evidence in the three Religious Landscape Studies conducted since 2007 that any birth cohorts have grown more religious over the long term, as discussed below in the section on how religious beliefs change as people age.

For more information on Americans’ religious upbringing, refer to Chapter 4.

Religion in U.S. families today

Raising children

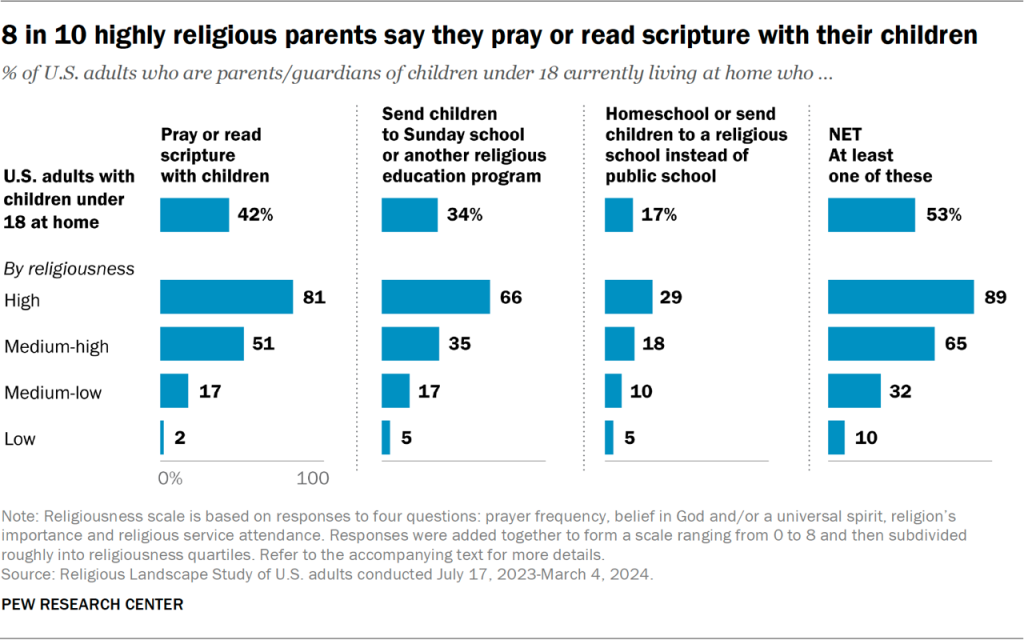
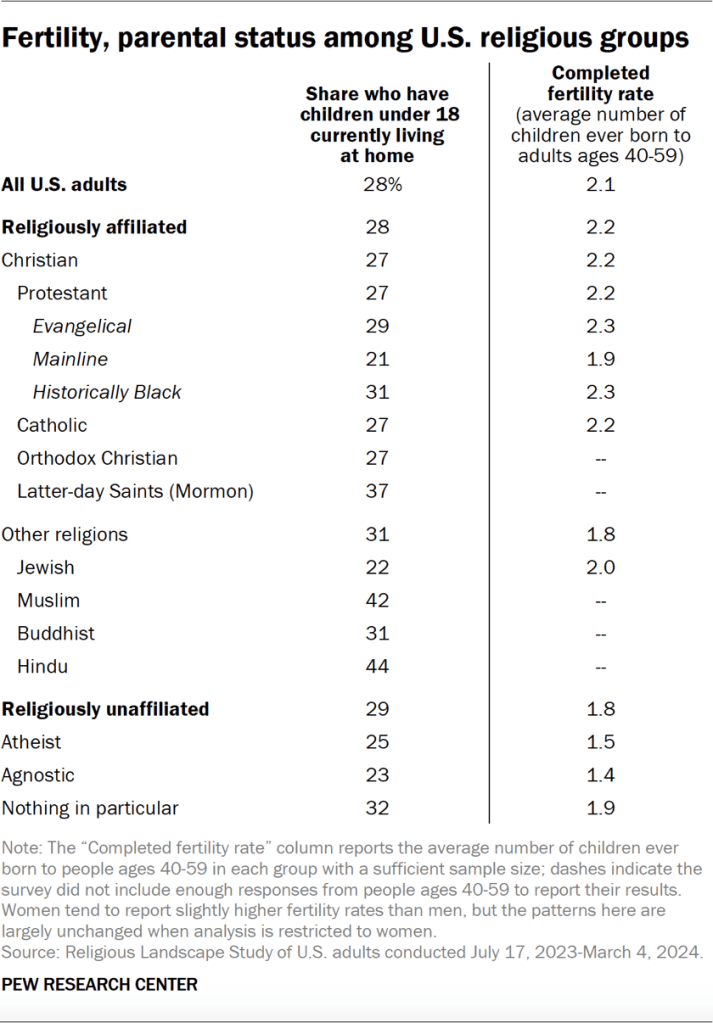
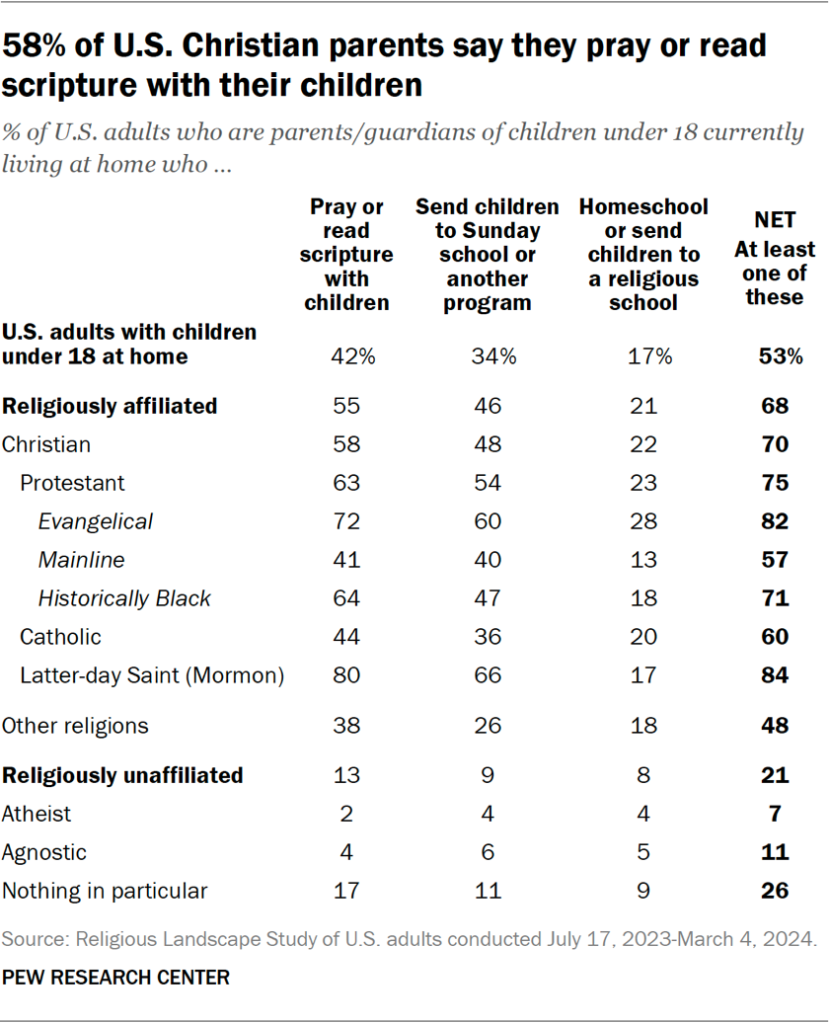
Among parents of minor children – i.e., people currently raising children under 18 in their homes – 40% say they send their child or children to some kind of religious education or private religious school.

By comparison, 51% of parents say they, themselves, received a fair amount or a lot of religious education as children, while 16% received a little, and 33% had none.

However, these questions about the respondent’s own religious education and the religious education of their kids are not exactly parallel. The survey asked respondents to report how many years of religious education they received as children, whereas parents were asked whether their minor children are currently enrolled in a religious private school or other religious education programs. Some parents may not have children enrolled right now but may enroll them later or may have enrolled them in the past.

Among parents living with minor children in their homes, 42% say they read scripture or pray with their children. The survey did not ask respondents whether (or how often) they used to read scripture with their parents or prayed with their parents when they were children themselves.
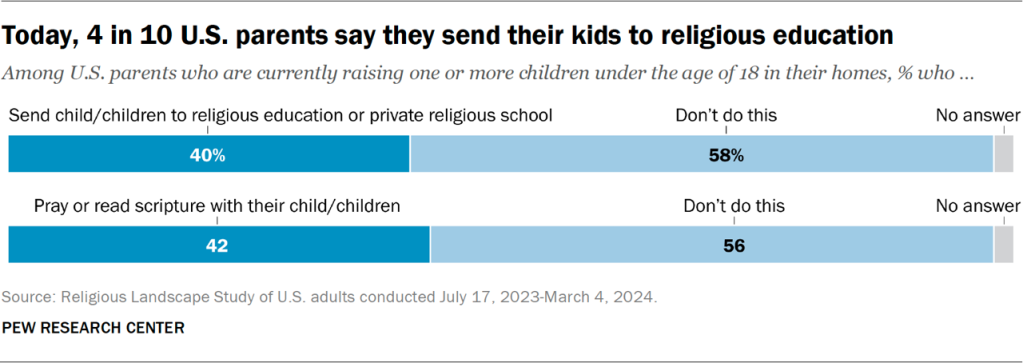
Bar chart showing that today, 4 in 10 U.S. parents say they send their kids to religious education

Overall, 26% of people who are currently raising children say they go to religious services at least weekly, and an additional 9% say they go to religious services once or twice a month. The survey did not ask current parents whether they take their children with them when they go to religious services. But, even if all 35% do take their children with them to services, this still would be a much smaller percentage than the roughly two-thirds of parents who say they went to services at least monthly when they were growing up.16

Bar chart showing 26% of parents currently raising children report attending religious services at least weekly

For more on how parents in different religious traditions are raising their children, refer to Chapter 6.

Religious intermarriage

In the new survey, 26% of married adults say their spouse has a religious identity different from their own. That’s virtually identical to what we found in the 2014 RLS (25%).

One-quarter of married Catholics in the new survey say they are married to a non-Catholic spouse, including 14% who are married to a spouse from another Christian tradition and 9% who are married to a spouse with no religion.

About one-in-five married Protestants say they have a non-Protestant spouse, including 8% who have a spouse who identifies with another Christian faith and 10% whose spouse has no religion.

Roughly one-third of married “nones” say their spouse identifies with some religion, in most cases a branch of Christianity.
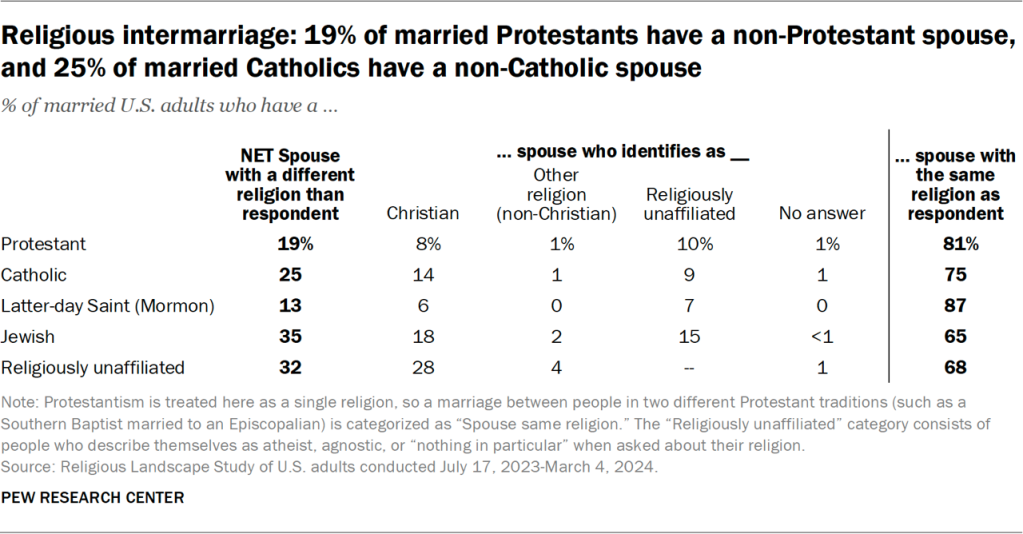
Table showing 19% of married Protestants have a non-Protestant spouse, and 25% of married Catholics have a non-Catholic spouse

Protestants, Catholics and Jews who are in religiously mixed marriages are far less religiously active, on average, than those with spouses who share their religion.

For example, 68% of Protestants married to other Protestants say religion is very important in their lives, compared with 38% of Protestants married to non-Protestants who say this. And 49% of Catholics married to fellow Catholics say they go to church at least once or twice a month, compared with 28% of Catholics married to non-Catholics who say they attend this often.

These differences carry over into child-rearing. Among parents of minor children, Protestants married to fellow Protestants are significantly more likely than Protestants married to non-Protestants to say they pray or read scripture with their kids and send their children to religious education. For the most part, a similar pattern holds for Catholics.

These patterns raise an interesting question: Does being in a religiously mixed marriage make people less religious, or are nonreligious people more likely to enter religiously mixed marriages? The survey cannot answer this question; it’s possible that both things are at play.

Meanwhile, religiously unaffiliated people married to spouses who identify with a religion tend to be a little more religiously active, on average, than religiously unaffiliated people married to spouses who are also unaffiliated.

For instance, 12% of married “nones” whose spouses identify with a religion say they pray daily, compared with 9% of married “nones” who have a fellow “none” as a spouse. And 13% of religious “nones” who are currently parenting a minor child and who are married to a religiously affiliated spouse say they send at least one of their children to religious education, compared with 5% of religious “nones” who are married to a religiously unaffiliated spouse.17 The differences are quite small, though, as are the overall shares of “nones” who say they are religiously active in these ways – regardless of whether they are married to a fellow “none,” or not.

For more on religious intermarriage, refer to Chapter 4.
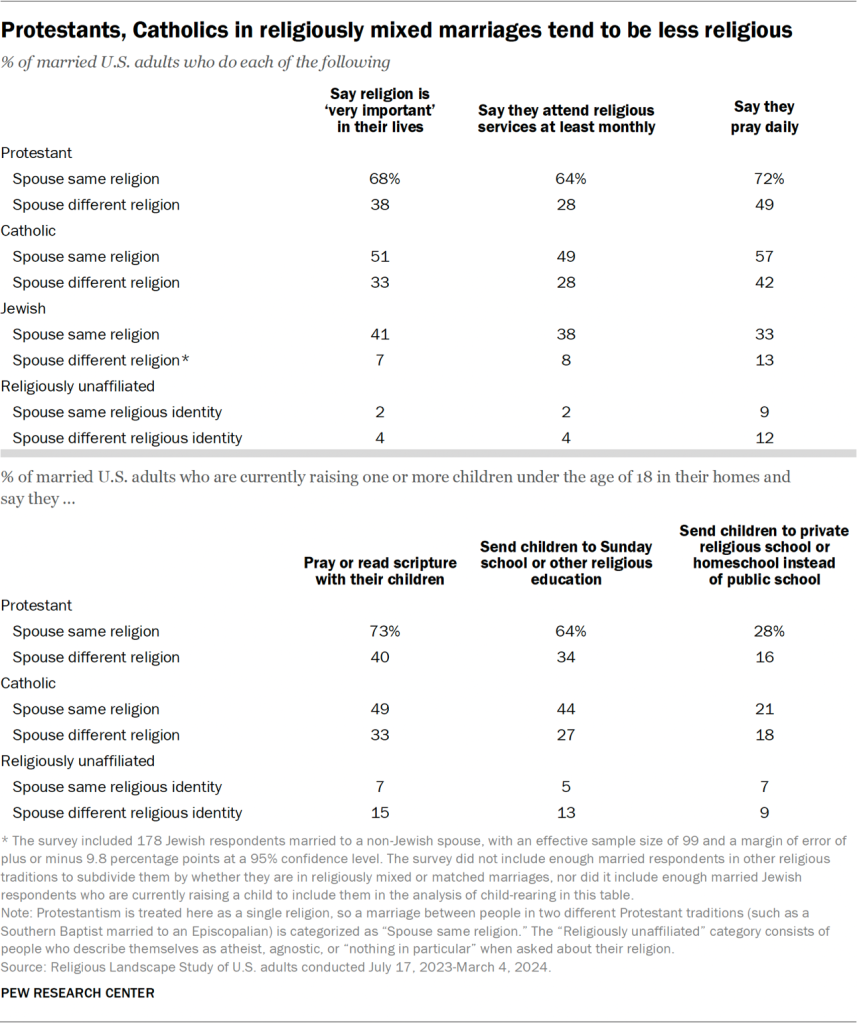
Table showing Protestants, Catholics in religiously mixed marriages tend to be less religious

Religious switching

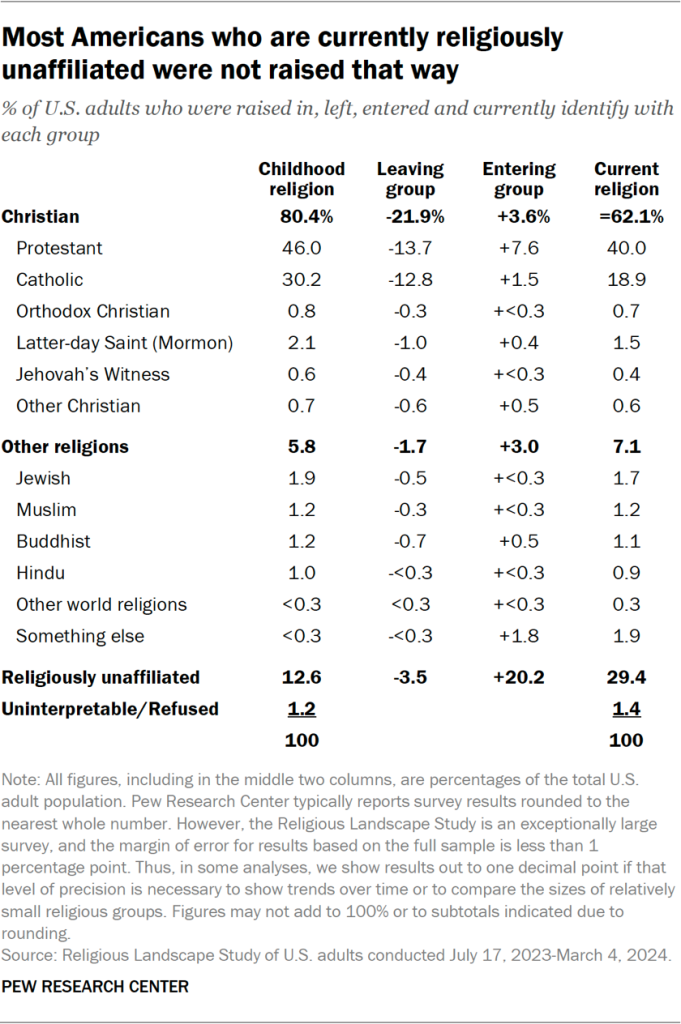
Overall, 35% of U.S. adults have switched religions between childhood and adulthood. That is, they say they currently identify with a religion (or with no religion) that is different from the religion in which they were raised.
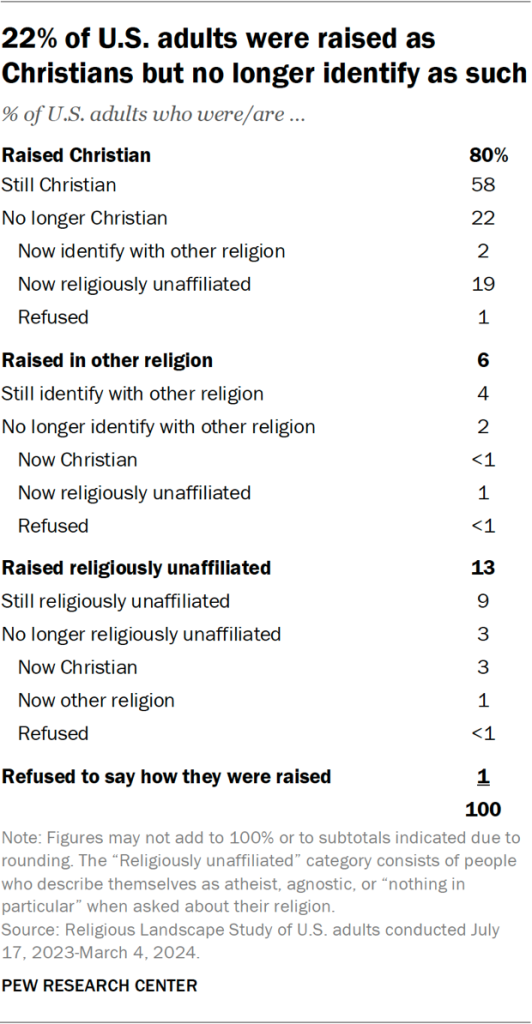
Table showing 22% of U.S. adults were raised as Christians but no longer identify as such

This figure includes people who switched from one Christian religious tradition to another (e.g., those who say they were raised Protestant but now identify as Catholic or vice versa), as well as people who switched from one non-Christian religion to another (e.g., those who say they were raised Hindu and now identify as Buddhist or vice versa).18 It also includes people who switch from identifying with a religion to describing themselves as religiously unaffiliated (or vice versa).

The share of people in the new survey who say they switched religions is on par with the share who said this in 2014.

When we divide the data into just three categories – Christianity, other religions and no religion – it shows very clearly that Christianity loses far more people than it gains through religious switching. Fully 80% of U.S. adults say they were raised Christian, but upward of a quarter of them (22% of all U.S. adults) no longer identify as Christians.

What is ‘religious switching’?

We use the phrase “religious switching” rather than more familiar terms like “conversion” because changes in religious identity occur in all directions, including from having a religion to having no religion. Also, these changes can take place without any formal ritual or declaration.

We measure religious switching with two survey questions. The first asks, “What is your present religion, if any?” The second asks, “Thinking about when you were a child, in what religion were you raised, if any?” By comparing each respondent’s answers to these questions, we can see whether they still have the same religion in which they were raised or whether they have switched.

However, these questions may not capture all the switching that takes place. For instance, they would not reveal whether a person has switched multiple times, or whether a person left their childhood religion and later returned to it. Our analysis of religious switching focuses on the difference (if any) between a respondent’s religious identity at the time of the survey and during childhood, not the steps that may have occurred in between.

By contrast, religious “nones” gain far more people than they lose through religious switching. Overall, 13% of U.S. adults say they were raised in no religion. But fully 20% of U.S. adults now say they are religiously unaffiliated after having been raised in a religion, including 19% who were raised Christian and 1% who were raised in other religions.

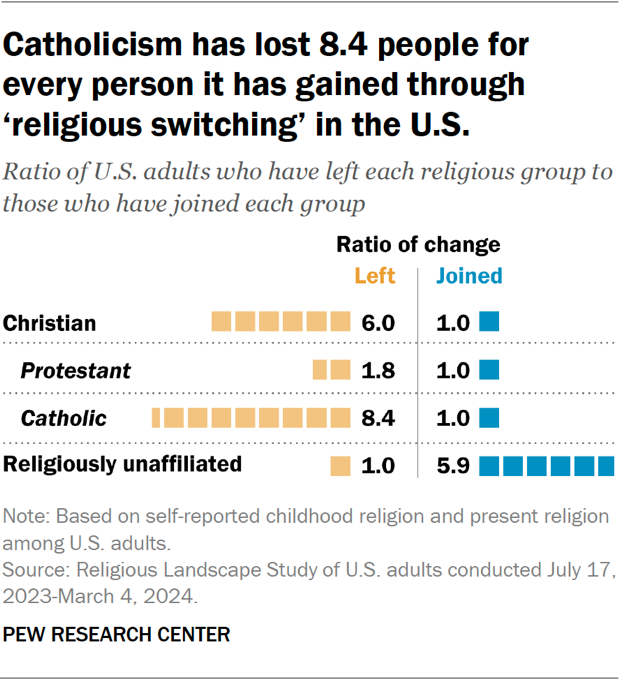
Expressed as a ratio, these figures mean that there are six former Christians for every convert to Christianity in the United States. The balance is especially lopsided for Catholicism (which loses 8.4 people through religious switching for every convert to the religion). But Protestants also lose more people than they gain through switching, by a ratio of 1.8 to one.
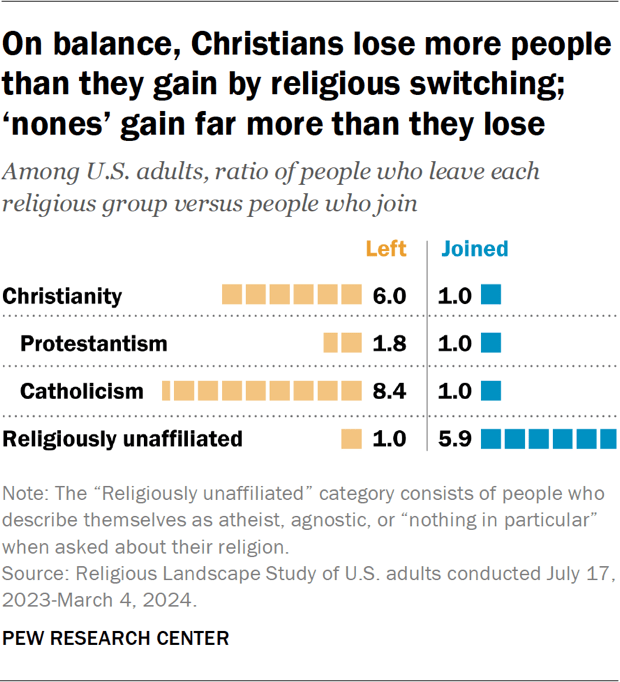
Chart showing that on balance, Christians lose more people than they gain by religious switching; ‘nones’ gain far more than they lose

In stark contrast, the religiously unaffiliated gain nearly six people for every person they lose through religious switching. That is, there are about six times as many Americans who say they were raised in a religion and no longer identify with a religion than there are who say they were raised in no religion but now identify with one.

In the aggregate, religions other than Christianity gain about as many people as they lose through religious switching. Overall, 3% of the public identifies with a religion other than Christianity after having been raised Christian or with no religion (or they did not answer the question about their childhood religion). And 2% of U.S. adults say they were raised in a religion other than Christianity but no longer identify with it.

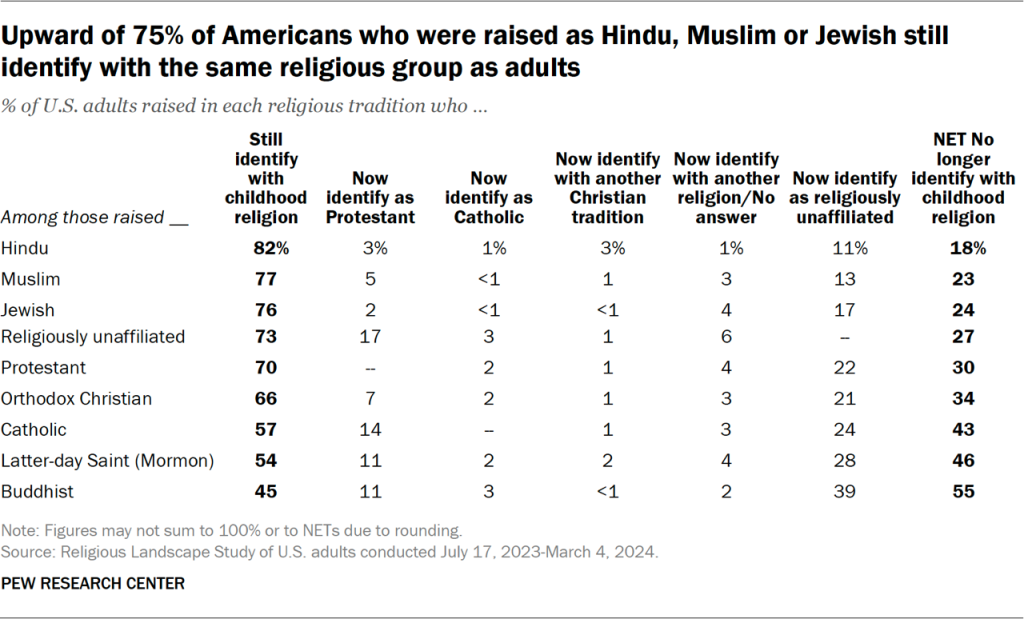
The survey shows big differences in religious switching patterns across age groups, which helps explain the long-term declines in religious affiliation, especially for Christianity. Vast majorities of older adults (89% of those born in the 1950s or earlier) say they were raised Christian, and most of them are still Christian today. Relatively few older adults say either that they were raised in no religion or that they have become religiously unaffiliated after having been raised as Christians.

Smaller majorities of young adults were raised as Christians, and fewer of them have retained their Christian identity in adulthood. Young people are more likely than older adults to have been raised in no religion and, also, more likely to have become religiously unaffiliated after having been raised as Christians.

Interestingly, among the youngest adults – those born between 2000 and 2006, who were ages 18 to 24 when the survey was conducted – the share who were raised Christian and are still Christian is about as high as among those born in the 1990s, who were 24 to 34 when the survey was conducted (41% vs. 42%). And the youngest cohort is slightly less likely than the second-youngest cohort to have left Christianity.

Jump to Chapter 2 to see the retention rates of different religious groups (i.e., what percentage of all the people raised in each group still identify with that group today).
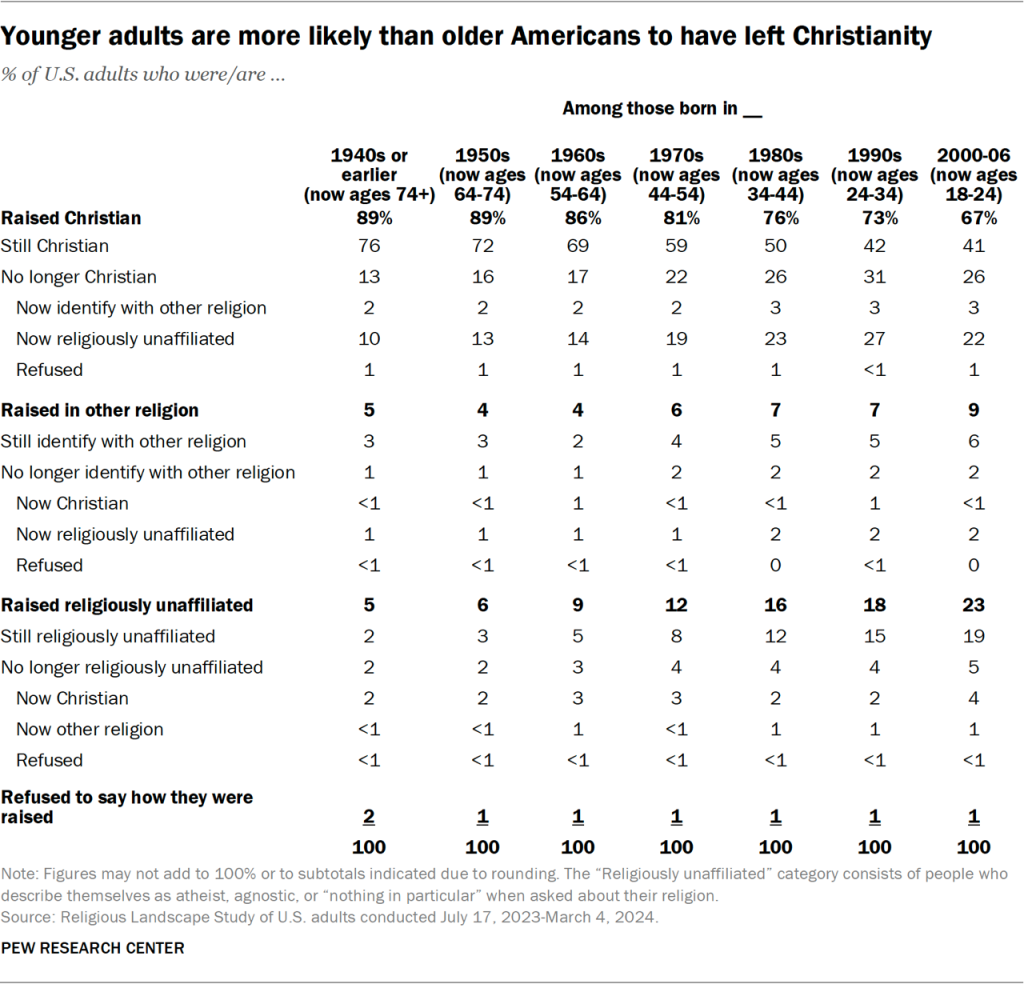
Table showing younger adults are more likely than older Americans to have left Christianity

Signs of strengthening spirituality

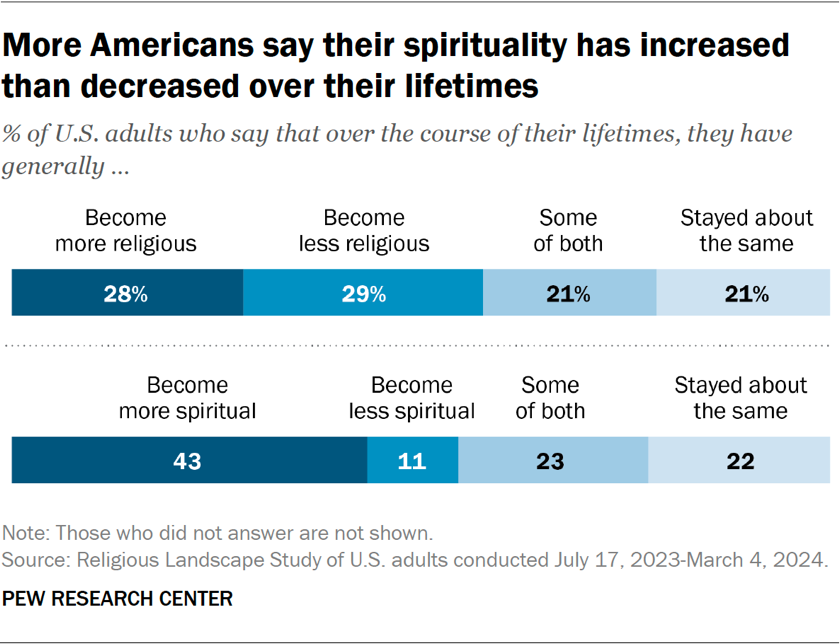
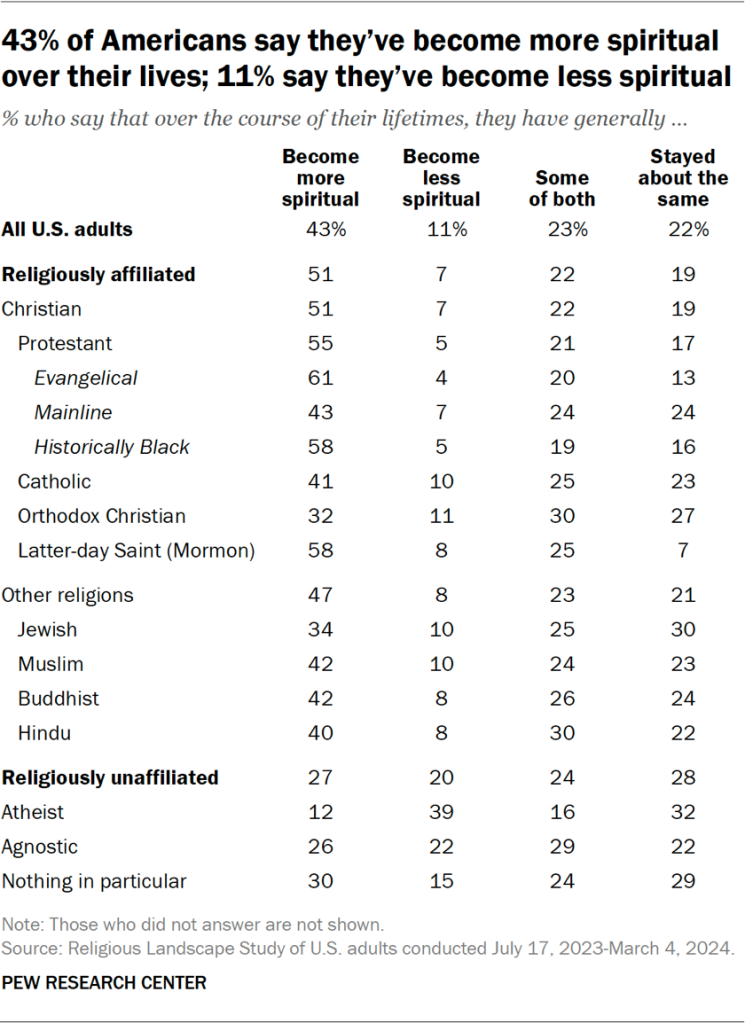
When asked how their levels of spirituality may have changed over the course of their lifetimes, Americans who say they have become more spiritual outnumber those who say they have become less spiritual by a roughly four-to-one margin (43% vs. 11%).

Bar chart showing more Americans say their spirituality has increased than decreased over the course of their lives

Moreover, the survey finds that Americans of all ages are more likely to say their spirituality has grown stronger than to say it has weakened.19

Large majorities of the U.S. public believe that people have a soul or spirit in addition to their physical bodies, that there is something spiritual beyond the natural world, and that there is an afterlife.

And although younger Americans are less traditionally religious than older adults (as measured by rates of prayer, identifying with a religious group, attending religious services, and some other beliefs and practices), the age gaps are much smaller on several of the survey’s questions about spirituality.20

For instance, 82% of adults who were roughly between the ages of 18 and 24 when the survey was conducted say they believe people have a soul or spirit in addition to their physical body – only slightly lower than the share of today’s oldest adults who affirm the same belief.
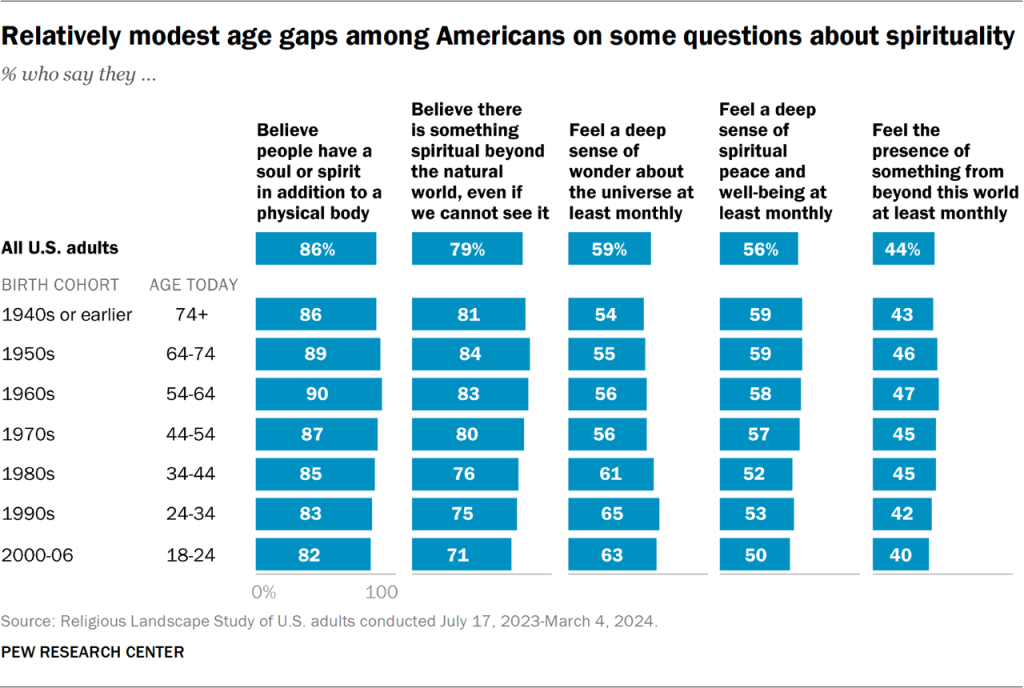
Bar chart showing the relatively modest age gaps among Americans on some questions about spirituality

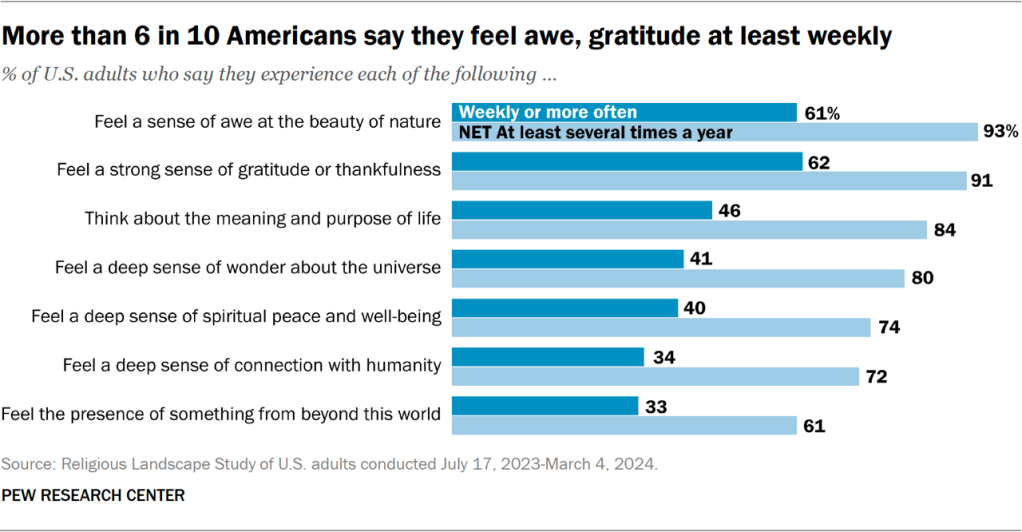
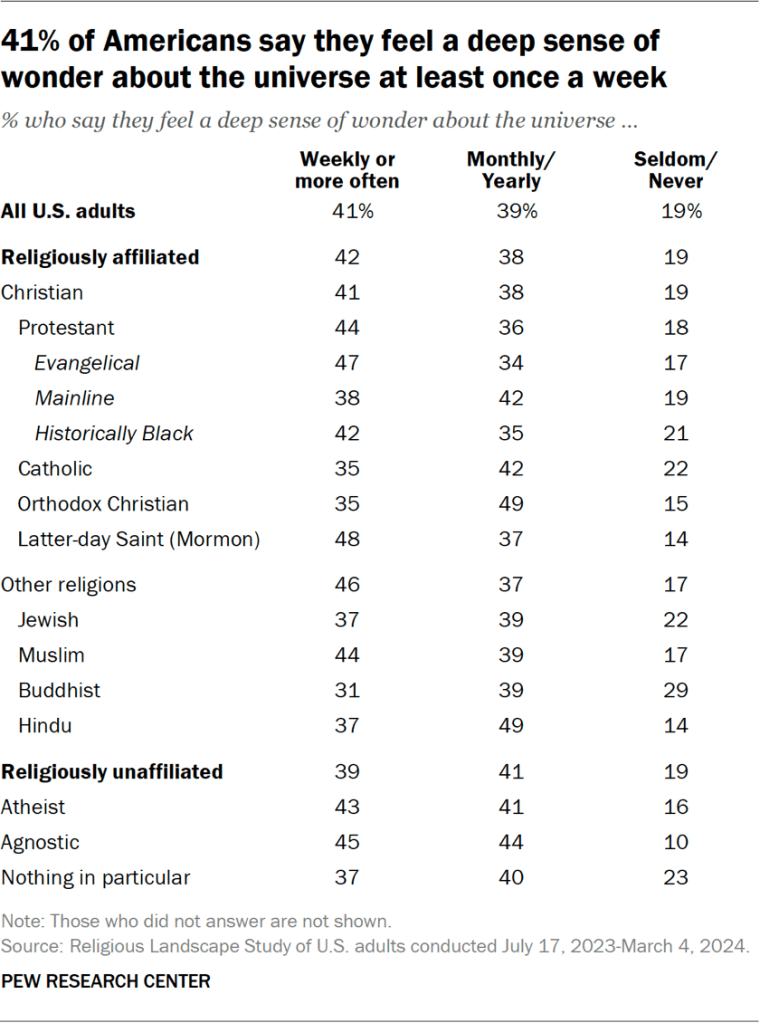
And 63% of today’s youngest adults say they feel a deep sense of wonder about the universe at least monthly, which is somewhat higher than the share of today’s oldest adults who say the same.

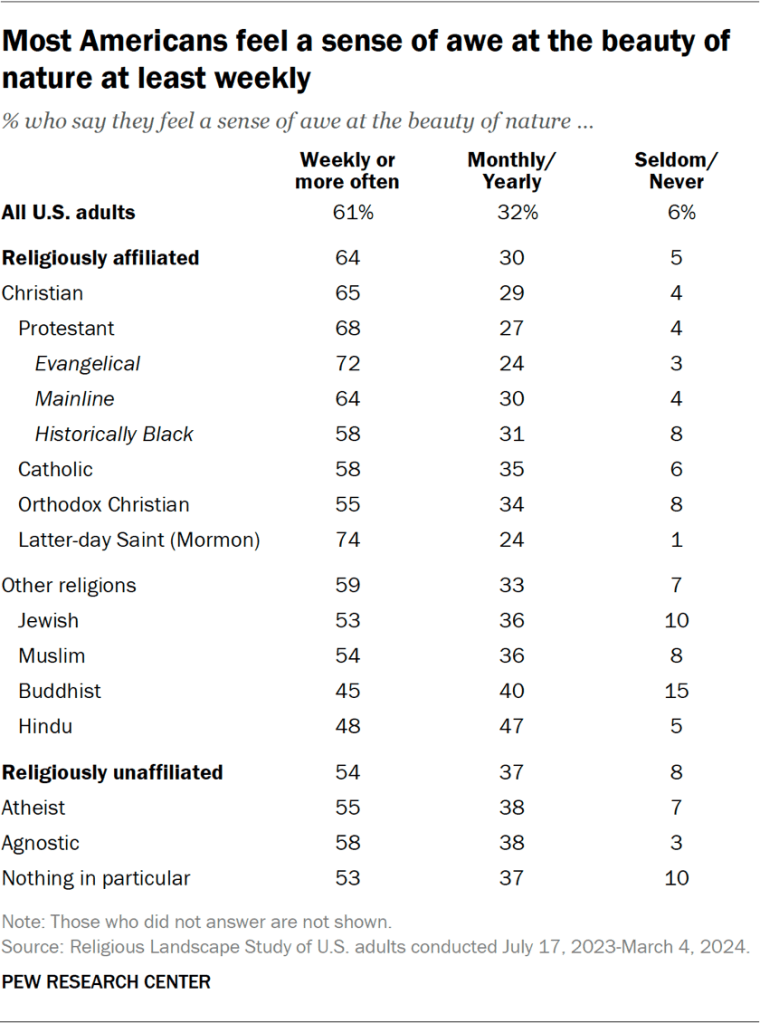
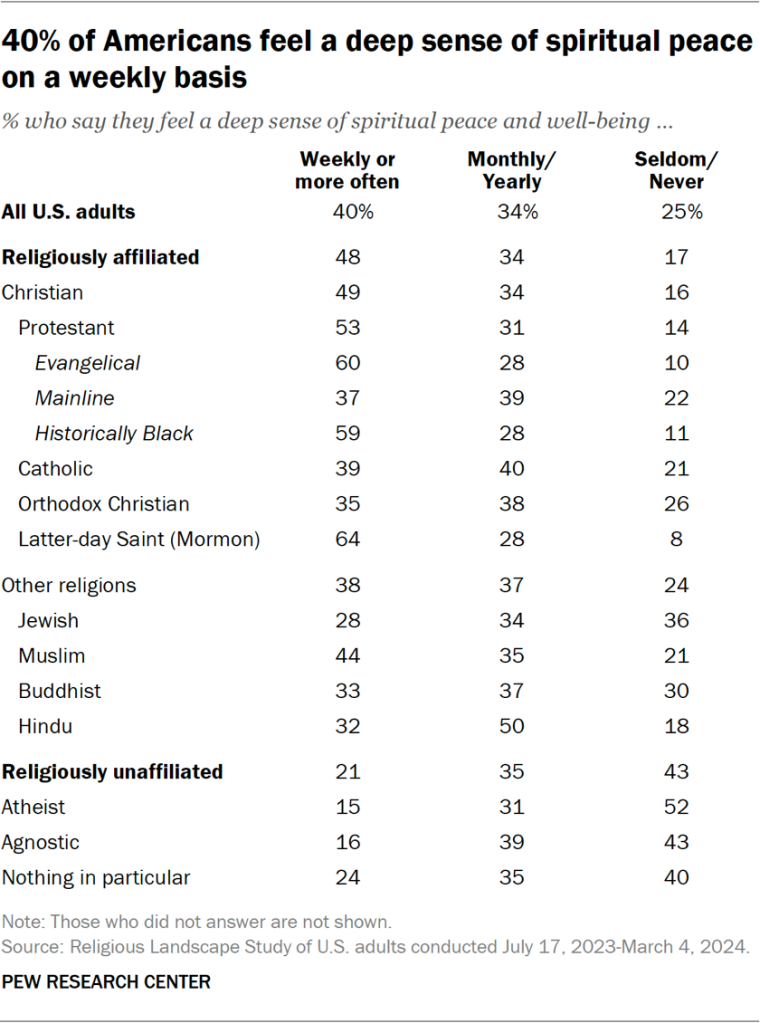
The survey finds that Americans who say their spirituality has increased are more likely than other adults (especially those who say their spirituality has declined) to say they regularly feel awe at nature’s beauty, feel a sense of spiritual peace, and experience the presence of something from beyond this world.

Americans who say their spirituality has grown also are more inclined than others to say they believe in God or a universal spirit, and to say they pray daily.
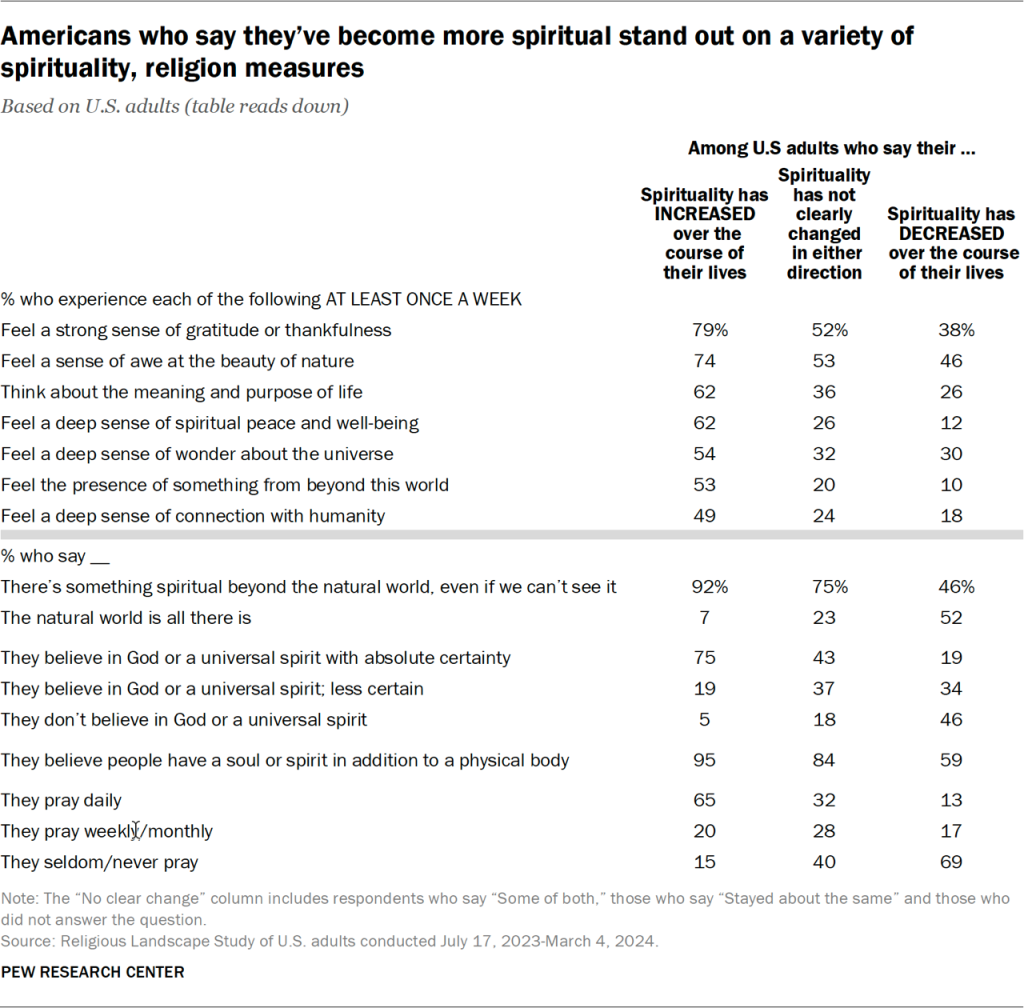
Table showing Americans who say they’ve become more spiritual stand out on a variety of spirituality, religion measures

These results suggest that spirituality and religion are not necessarily in tension with each other. We know from previous research that many people view spirituality and religion as complementary; some see no difference between them.
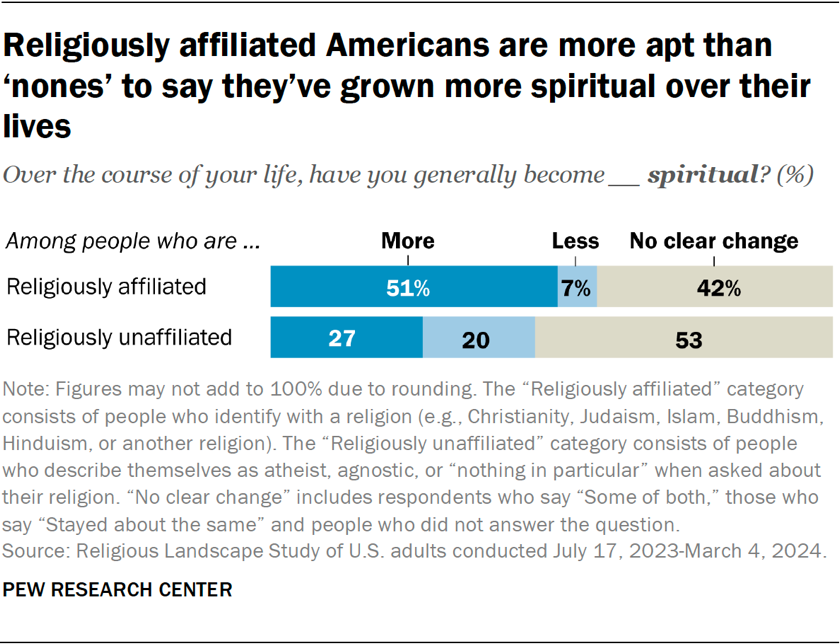
Bar chart showing religiously affiliated Americans are more apt than ‘nones’ to say they’ve grown more spiritual over their lives

Indeed, the new survey finds that people who identify with a religion are more likely than religiously unaffiliated Americans to say they have grown increasingly spiritual during their lives.

Religiously affiliated people also are more inclined than religious “nones” to believe in God or a universal spirit, to pray daily, and to report that they experience a variety of spiritual sensations, such as “the presence of something from beyond this world.”

Among the “nones,” those who say they’ve grown more spiritual during their lives are more likely than other religiously unaffiliated people to say that people have souls or spirits in addition to their physical bodies, that there is something spiritual beyond the natural world, and that they regularly feel a sense of awe at the beauty of nature.
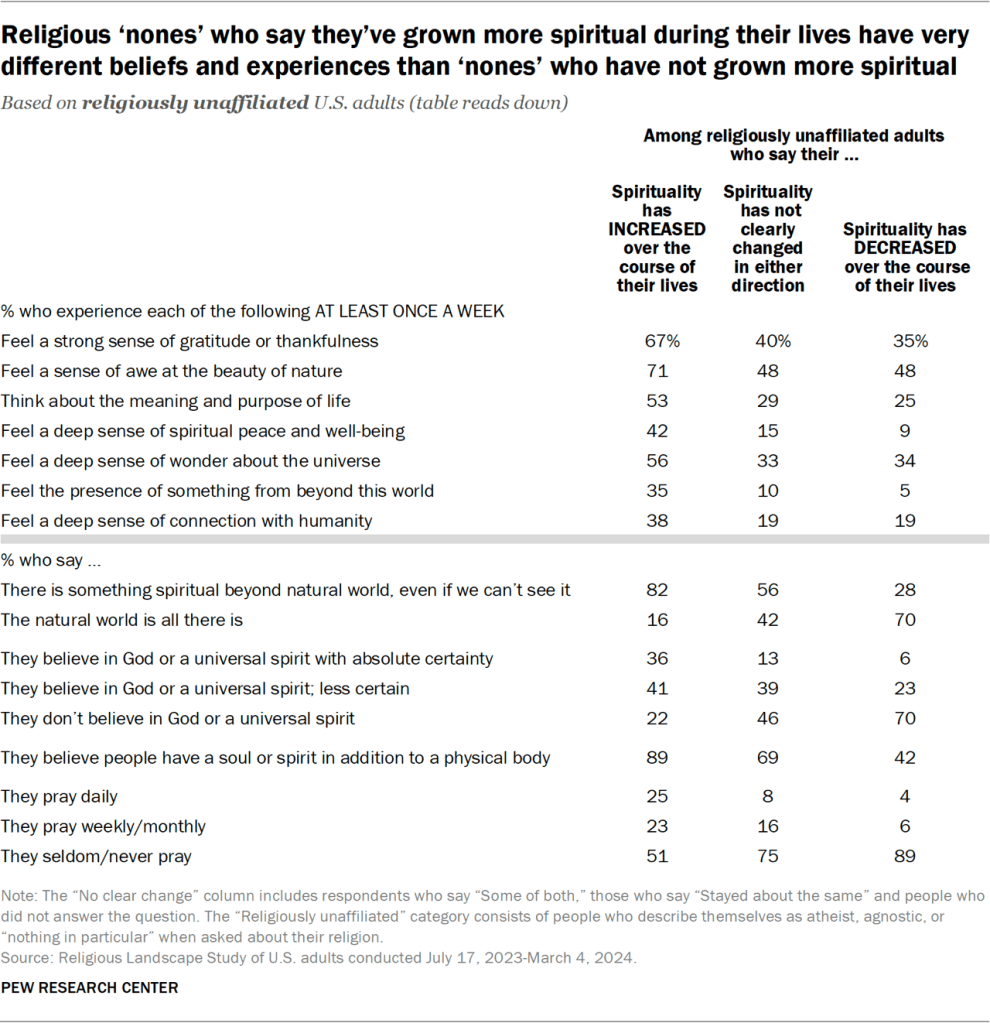
Table showing religious ‘nones’ who say they’ve grown more spiritual during their lives have very different beliefs and experiences than ‘nones’ who have not grown more spiritual

Attendance at religious services

The 2023-24 RLS finds a substantial age gap in attendance at religious services. Most young adults say they go to religious services no more than a few times a year. Indeed, among people born since the 1980s, about half or more say they seldom or never attend religious services.
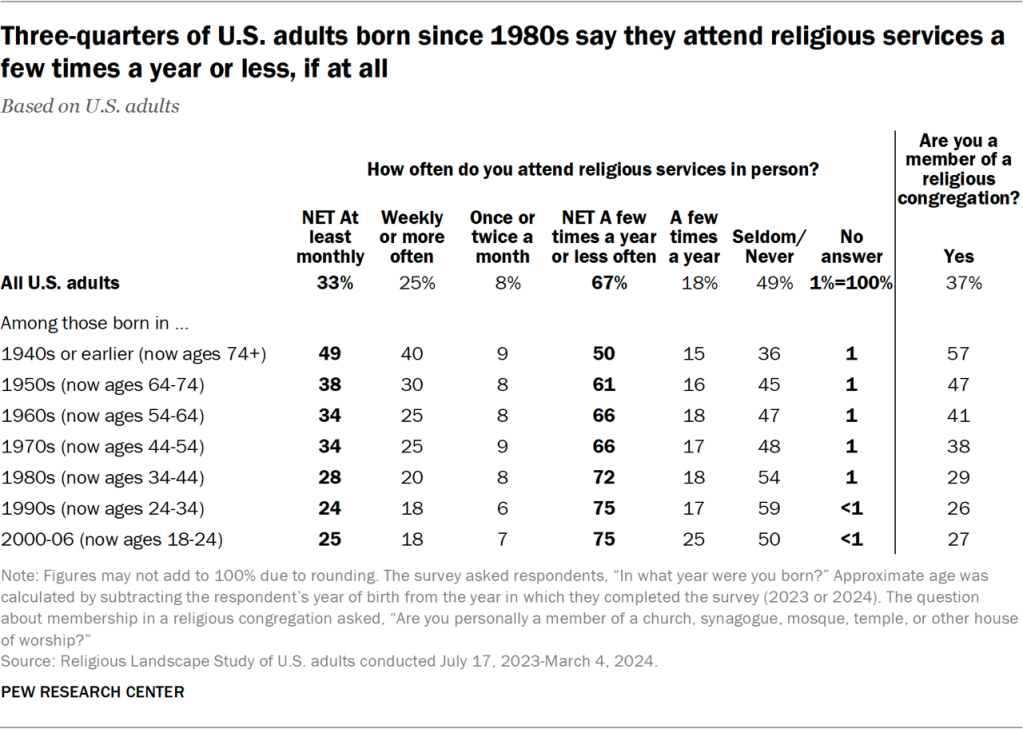
Table showing three-quarters of U.S. adults born since 1980s say they attend religious services a few times a year or less, if at all

By comparison, older adults report attending religious services at far higher rates. Furthermore, 57% of people in the oldest cohort say they are members of a religious congregation, compared with 27% of the youngest adults.

Does this mean that attendance at religious services is declining? Not necessarily. The age gap, by itself, is not proof that fewer people are attending services, because it is theoretically possible that people participate in religious services at higher rates as they get older. Perhaps today’s young adults will go to a church, synagogue, mosque or other house of worship more often when they reach middle age or retirement age than they do today.

Moreover, we do not have a clear, long-term trend line for attendance at religious services because the new survey’s findings about rates of religious attendance cannot be directly compared with the previous landscape studies.

The earlier studies in 2007 and 2014 were conducted by telephone, while the new survey was conducted mainly online or on paper. Previous research shows that these different ways (or “modes”) of conducting surveys produce significantly different results on the question “How often do you attend religious services?” This makes it hard to determine, over the long term, how much religious attendance has changed.

However, the Center’s telephone surveys were showing a decline in religious attendance in the years before we switched to online/paper surveys. The share of Americans who reported attending religious services at least monthly dropped from 54% in 2007 to 50% in the 2014 Religious Landscape Study and had fallen to 45% by 2018-19 (which is when the Center last regularly conducted telephone surveys that asked about religious attendance).

But the short-term trend line for the share of Americans who attend religious services at least monthly is pretty flat. In Pew Research Center’s 2020 NPORS, 33% of U.S. adults reported attending religious services at least once or twice a month. That’s identical to what we found in the 2023-24 RLS and very similar to the 32% measured in the 2024 NPORS.
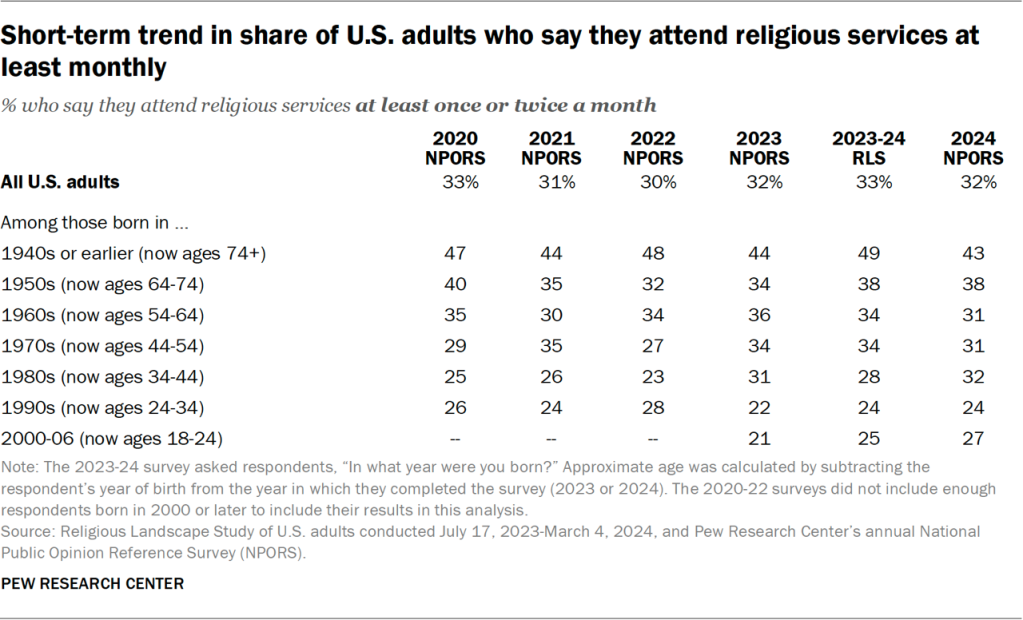
Table showing the short-term trend in the share of U.S. adults who say they attend religious services at least monthly

How religious beliefs change as people age

When asked to describe how their own religiousness has changed over their lifetimes, the most common response people give is that there has been no clear change in either direction – up or down – over the course of their lives (44% of U.S. adults say this). This includes people who say they have sometimes grown more religious and other times less religious; people who say their level of religiousness has not changed very much; and people who don’t answer the question. This is the most common kind of response among respondents in every age category.
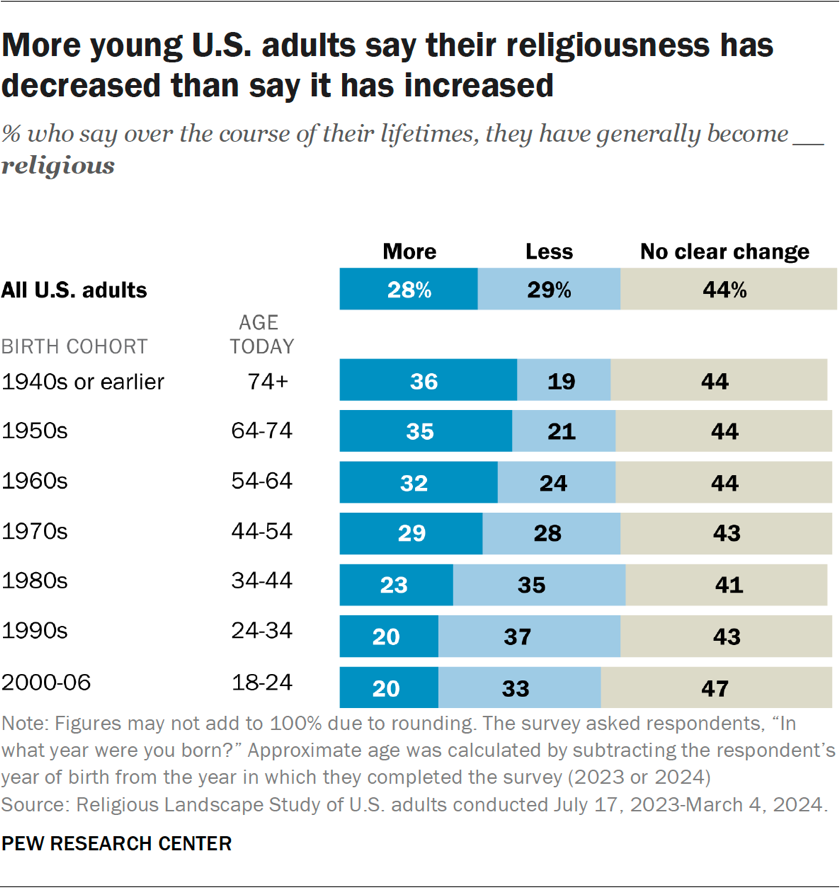
Bar chart showing more young U.S. adults say their religiousness has decreased than say it has increased

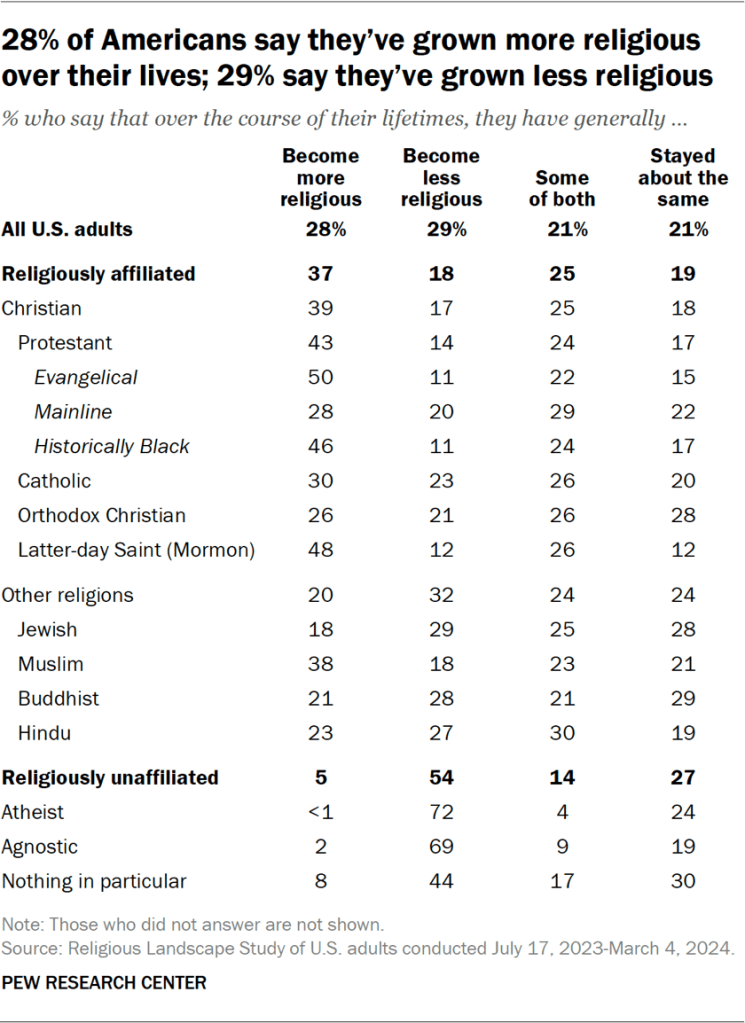
Among people who say their religiousness has changed over the course of their lives, about equal shares say they have become less religious (29%) and more religious (28%).

The new RLS also finds that more young adults say their religiousness has decreased than say it has increased. By contrast, older U.S. adults are more likely to say their religiousness has increased than that it has decreased.21

However, on the questions in the new survey that can be directly compared with the previous studies, there is no evidence that people in older birth cohorts have grown more religious between 2007 and today.

In the three Religious Landscape Studies conducted over the past 17 years, there are no birth cohorts – neither the oldest Americans, nor the youngest, nor any cohort in between – that have grown more prayerful, more certain in their belief in God, more likely to believe in an afterlife (heaven, hell or both), or more likely to identify with a religion, including Christianity.
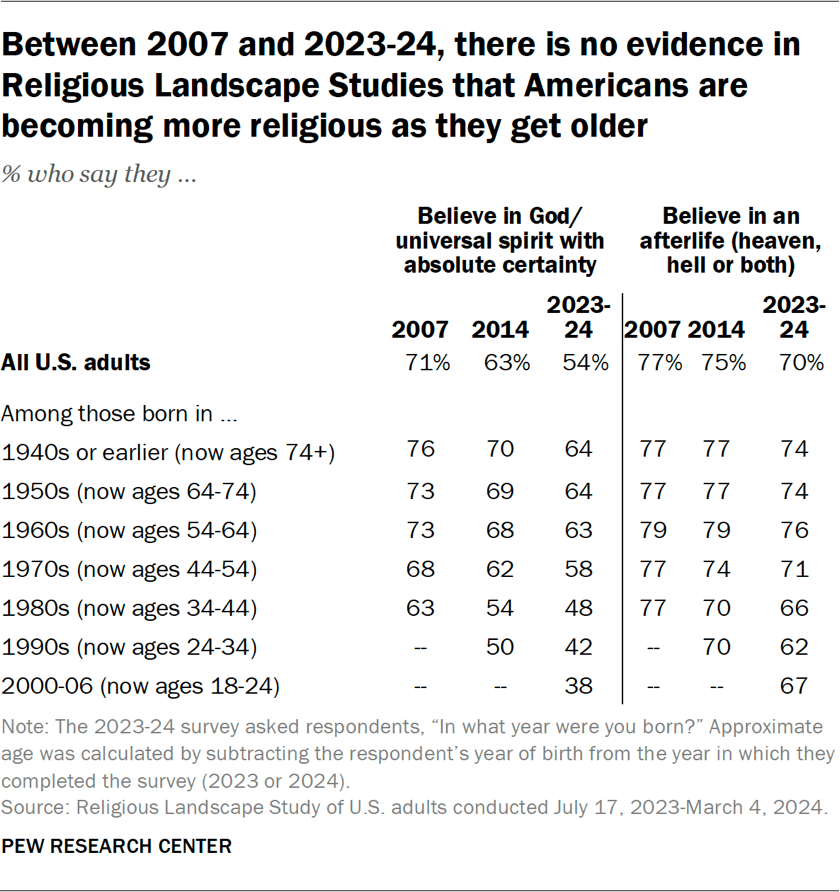
Table showing that between 2007 and 2023-24, there is no evidence in Religious Landscape Studies that Americans are becoming more religious as they get older

This may seem at odds with the retrospective answers that survey respondents give to questions about how their own religiousness and spirituality have changed. As previously noted, about four times as many U.S. adults say they have become more spiritual (43%) as say they have become less spiritual (11%) over their lifetimes, while nearly equal shares say they have become more religious (28%) and less religious (29%).

But substantial numbers of Americans say they haven’t really changed spiritually (46%) or religiously (44%). And the answers people give to these questions may be shaped by many factors, such as how desirable they feel it is to be spiritual and/or religious, and how they understand the meaning of those terms.

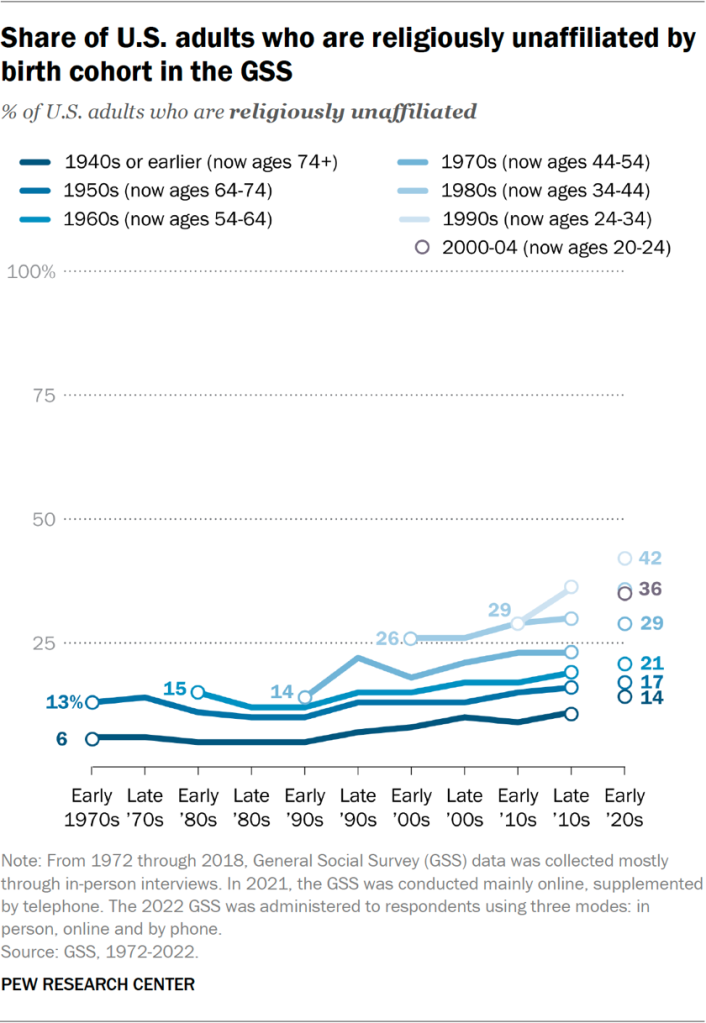
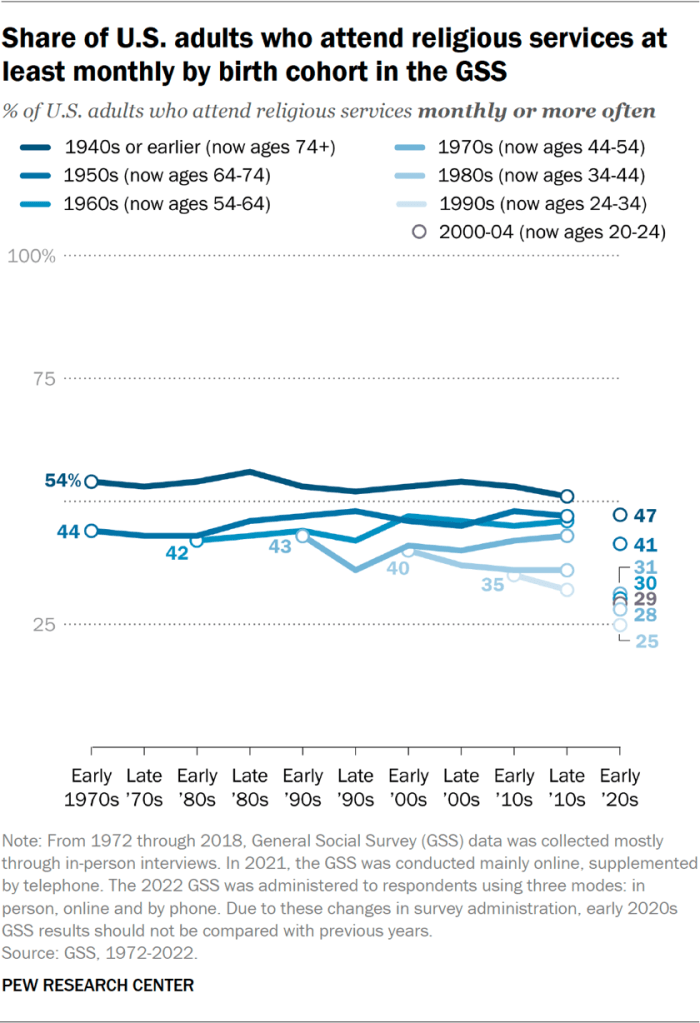
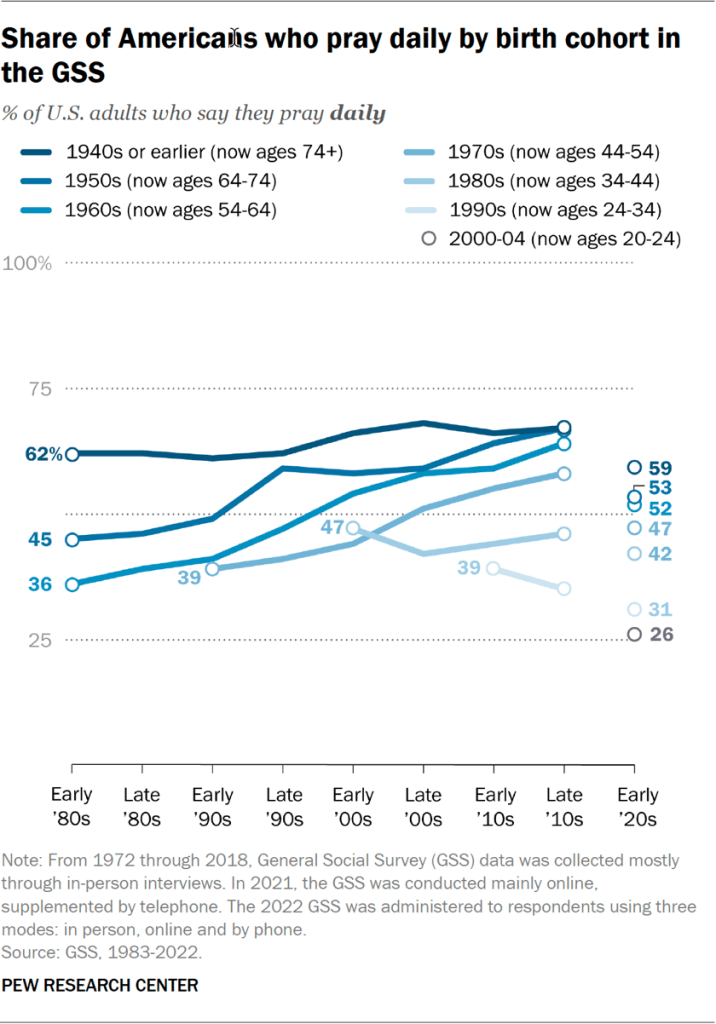
Another limitation in understanding how religiousness tends to change as people age is that Pew Research Center’s data on many questions about religion goes back no further than the first Religious Landscape Study in 2007. That 17-year span may not be long enough to capture all the change that has occurred in older birth cohorts. For a longer perspective, we turned to the General Social Survey (GSS), a national survey that has been conducted every year or two since 1972.

The GSS shows that people do tend to become more prayerful as they get older. For example, when people born in the 1960s were just entering adulthood in the early 1980s, 36% said in the GSS that they prayed on a daily basis. By the late 2010s, when people in this birth cohort were in their late 40s and 50s, 64% said they prayed daily. The GSS also reports that people born in the 1950s and 1970s exhibited similar long-term increases in rates of daily prayer.

But the GSS suggests that people do not become more likely to identify with a religion as they get older. There is also little evidence in the GSS that as Americans get older, they tend to become more likely to believe in God or to attend religious services regularly.

For more analysis of GSS data on how the religiousness of people in different birth cohorts has changed or stayed the same over time, refer to Appendix C.22

What is happening to the ‘middle’ of American religion

As the Christian share of the U.S. adult population has declined in recent decades and the public has come to look less religious on a variety of measures, the question arises whether these changes are evidence of religious decline across the board or, instead, a hollowing out of the “religious middle.”

That is, are religious beliefs and practices declining all across the religious spectrum? Or is there a decline only in the share of the population with medium levels of religiousness, accompanied by stability or even growth at both ends of the spectrum of religiousness – resulting in more highly secular people, more highly religious people, and fewer people who are just moderately religious?

The new RLS indicates that the long-term changes in American religion are broad-based and not a hollowing out of the religious middle.

Perhaps the easiest way to illustrate this is by looking at trends in prayer frequency over time. This is the new study’s best indicator of religiousness that can safely and directly be compared with previous RLS results.23 The share of Americans who say they pray daily is clearly down. And the share of Americans who say they seldom or never pray is clearly up. Meanwhile, the share of Americans who say they occasionally pray (on a weekly or monthly basis) is relatively stable. There is no indication of a hollowing out of the “religious middle” on this key indicator.
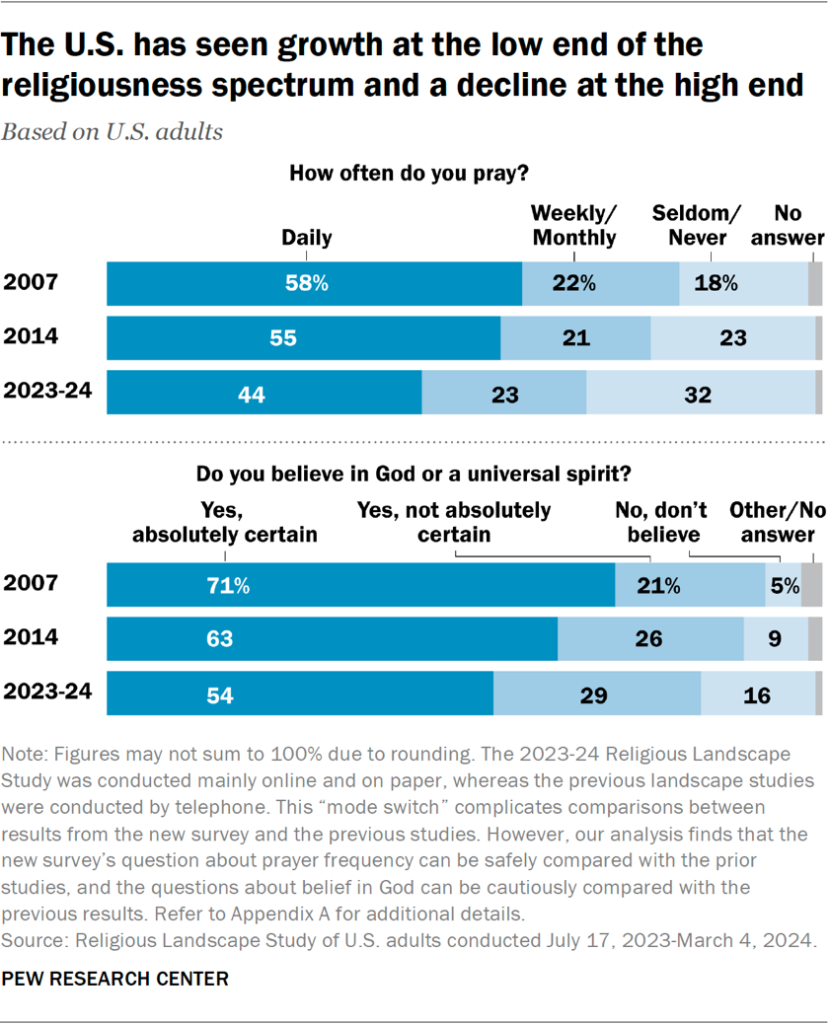
Bar chart showing the U.S. has seen growth at the low end of the religiousness spectrum and a decline at the high end

The survey finds a similar pattern in questions about belief in God. The share of Americans who say they believe in God or a universal spirit with absolute certainty has clearly declined, while nonbelief is trending upward. And the share of Americans occupying the middle ground on this question – saying they believe in God but with less than absolute certainty – shows no signs of hollowing out, but rather is rising. The share of adults in the new survey who believe in God but with less than absolute certainty is higher than it has ever been in an RLS survey.24

Another way to assess the evidence for a hollowing out of the religious middle is to look at differences across age groups within the new survey. This allows us to examine additional indicators of religiousness, because looking just at the results of the new survey sidesteps the difficulties posed by the change of survey modes between the previous two Religious Landscape Studies (conducted by telephone) and the new one (conducted mainly online and on paper).

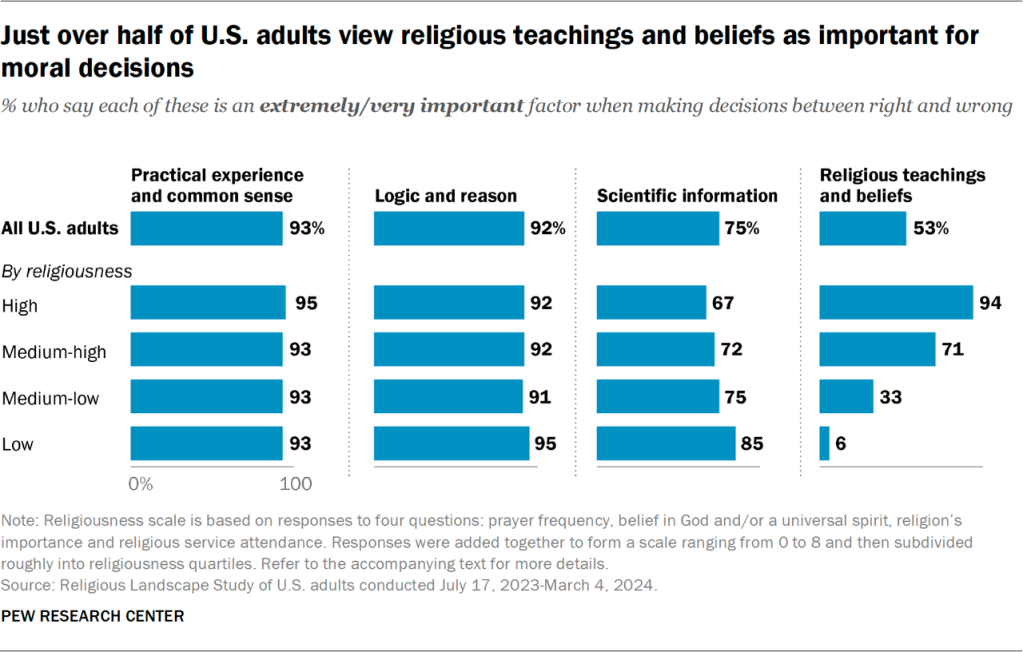
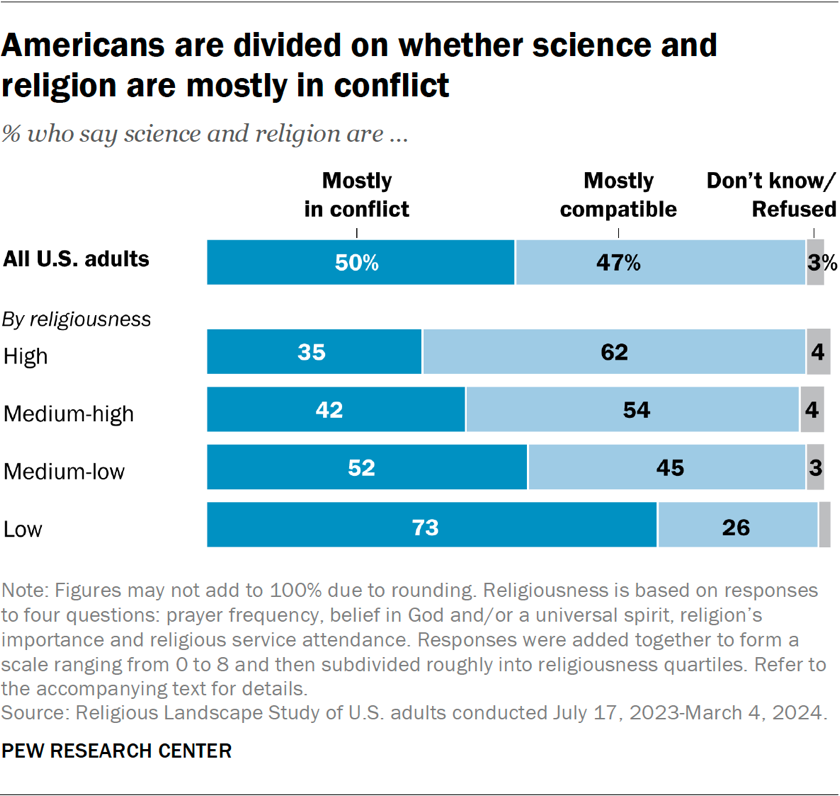
For this analysis, we used four key questions: prayer frequency, belief in God and/or a universal spirit, religion’s importance, and religious service attendance. Responses to each question were assigned numbers from 0 (low) to 2 (high) as follows:

  • Prayer frequency: Coded as 0 for those who seldom or never pray, 2 for those who pray daily, and 1 for everyone else.
  • Belief in God or a universal spirit: Coded as 0 for those who do not believe in God or a universal spirit, 2 for those who believe with absolute certainty, and 1 for everyone else.
  • Religion’s importance: Coded as 0 for those who say religion is not too important or not at all important in their lives, 2 for those who say religion is very important in their lives, and 1 for everyone else.
  • Religious attendance: Coded as 0 for those who say they seldom or never attend religious services, 2 for those who attend religious services at least once a month, and 1 for everyone else.

We then added these indicators together to form a scale ranging from 0 (for people who scored 0 on all four measures) to 8 (for respondents who scored 2 on all four measures).25 And we subdivided the scale roughly into quartiles, as follows:

  • Low religiousness: Scores of 0 to 1
  • Medium-low religiousness: Scores of 2 to 4
  • Medium-high religiousness: Scores of 5 to 6
  • High religiousness: Scores of 7 to 8

Here again, there is no evidence that religious changes underway in America reflect a shrinking of the “religious middle.” The religious middle is not smaller among the younger cohorts than among the older cohorts, which is what one might expect if a hollowing out of the religious middle were occurring.
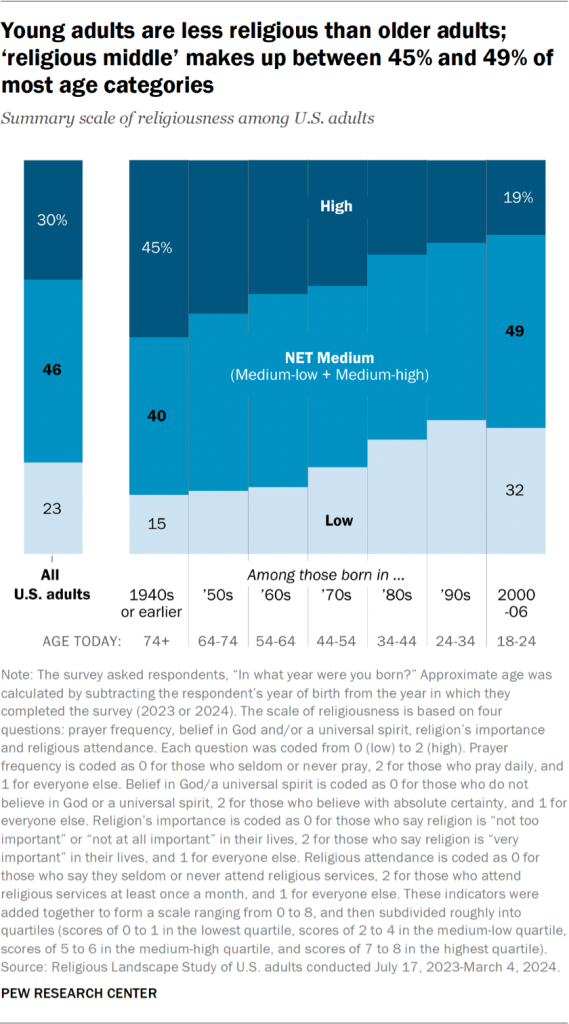
Chart showing young adults are less religious than older adults; ‘religious middle’ makes up between 45% and 49% of most age categories

Rather, compared with older adults, younger Americans include far more people at the low end of the religiousness spectrum and far fewer people at the high end. The size of the middle categories of religiousness is in the same ballpark across most age groups. This is exactly the pattern that would be expected if broad-based religious decline (which some social scientists call a process of secularization) were underway.

Trends in the religiousness of Christians

We have already seen that over the long term (since 2007), the Religious Landscape Studies show a substantial rise in the percentage of U.S. adults who are religiously unaffiliated (sometimes called “nones”) and a substantial decline in the percentage who describe themselves as Christians – including declines in all three major Protestant traditions (evangelical, mainline and historically Black Protestant churches).

This raises the question: As the Christian share of the population has shrunk, have Christians become more religious, on average? One might expect that as some Americans leave Christianity and join the ranks of the unaffiliated, those who stay behind and remain Christian would become a smaller but more committed group, with rising average levels of religious belief and practice. Has this happened?

The new RLS offers a mixed answer, with a couple of indicators of religiousness holding steady or rising slightly among U.S. Christians, while two other indicators clearly have declined.

The four questions in the 2023-24 RLS about religious practice and belief that can most readily be compared with the prior studies ask about prayer frequency, belief in God or a universal spirit, belief in heaven and, separately, belief in hell.26

The new survey shows that among Christians, belief in heaven and hell is on par with or slightly higher than in 2007. Belief in heaven now stands at 85% among Christians, compared with 83% in 2007. Meanwhile, 72% of Christians now say they believe in hell, up slightly from 68% in 2007.

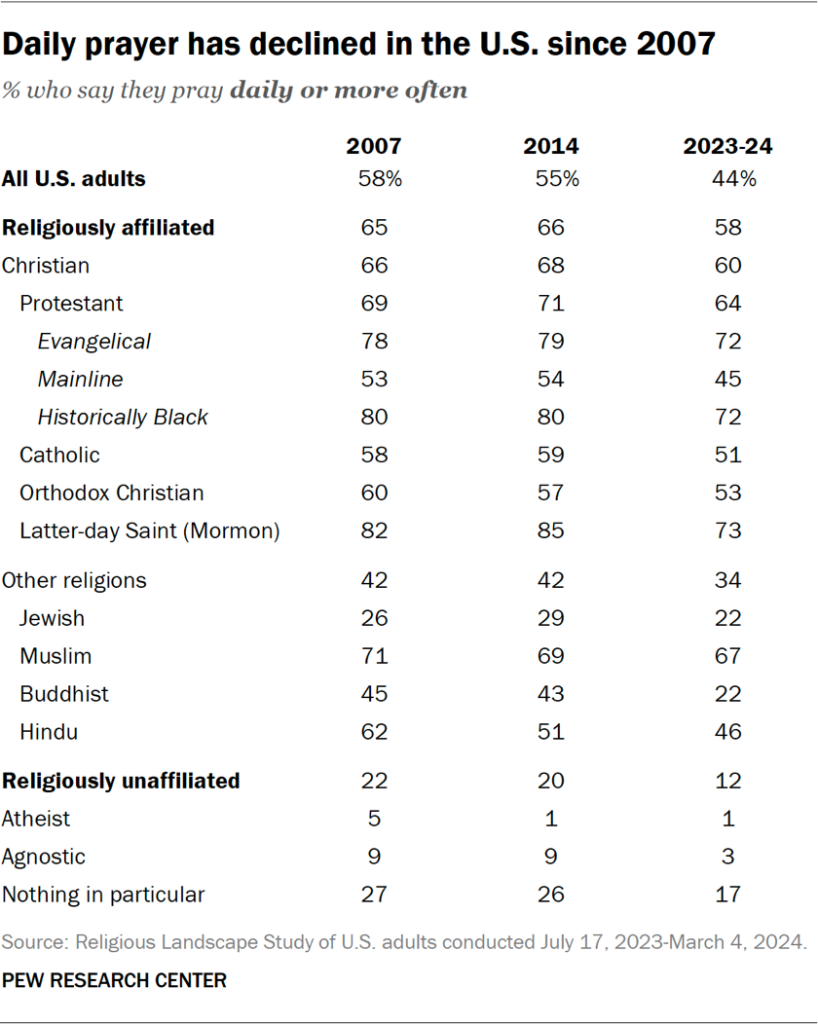
But there is no indication that Christians are any more prayerful today than they were in 2007. Indeed, the share of Christians who say they pray every day is markedly lower now (44%) than it was in 2007 (58%).

The share of Christians who say they believe in God with absolute certainty also is lower today than it was in 2007. In the new survey, 73% of Christians say they are absolutely certain God or a universal spirit exists, down from 80% in 2007.

Table showing that among U.S. Christians, belief in heaven and hell has been steady or rising, while rates of daily prayer and absolutely certain belief in God have been declining

Religion and political polarization

The U.S. is politically polarized, and religion is closely associated with the country’s political divisions. But the new Religious Landscape Study – which was conducted mostly in 2023 and the early part of 2024, before the 2024 presidential election – also finds that the connections between religion and political partisanship vary a lot by race and ethnicity, as described below.

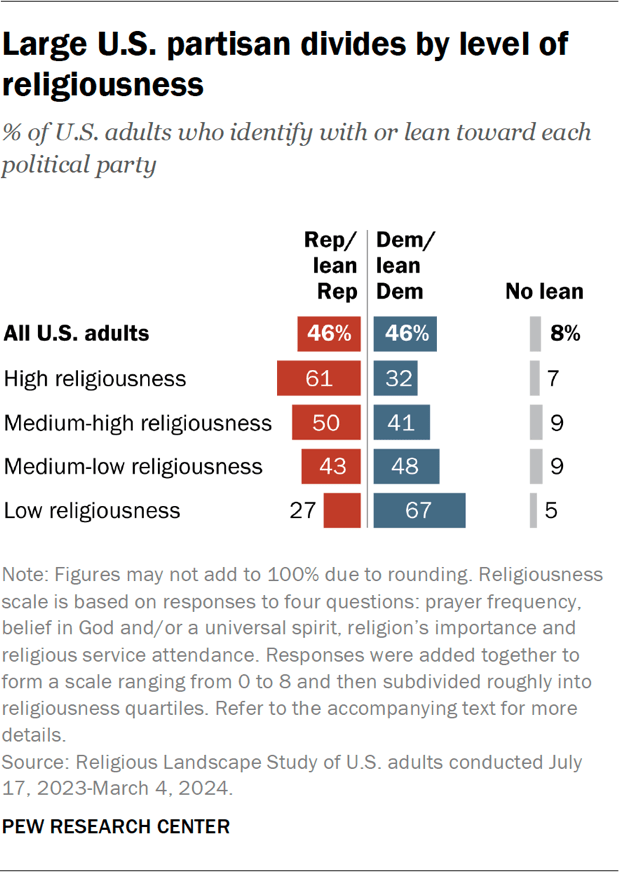
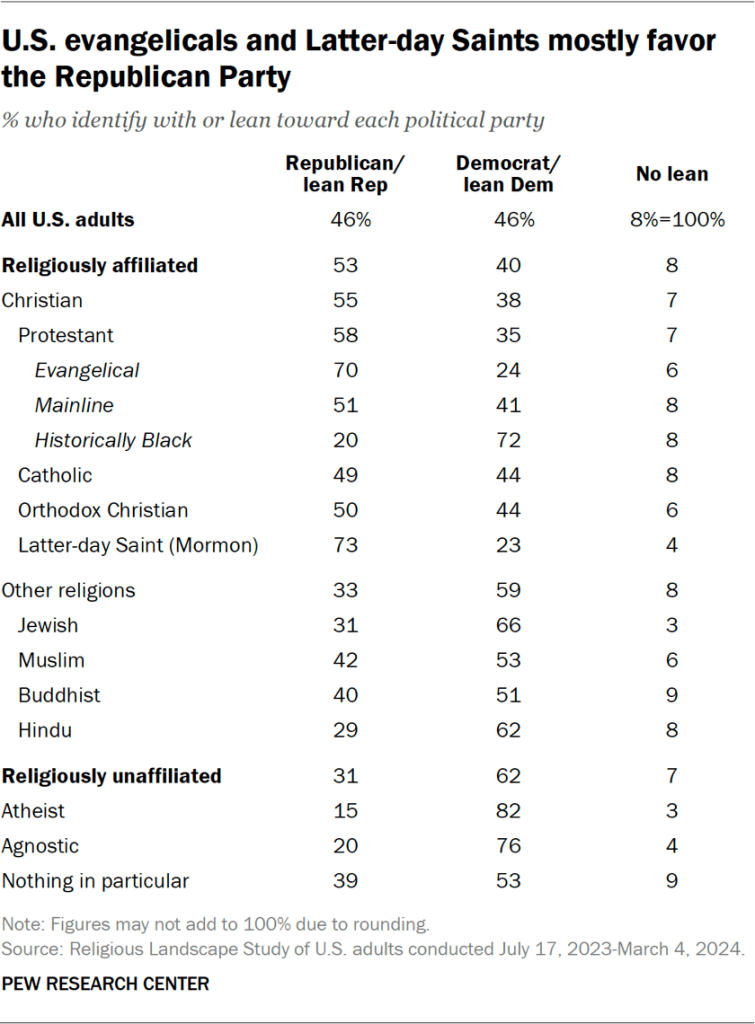
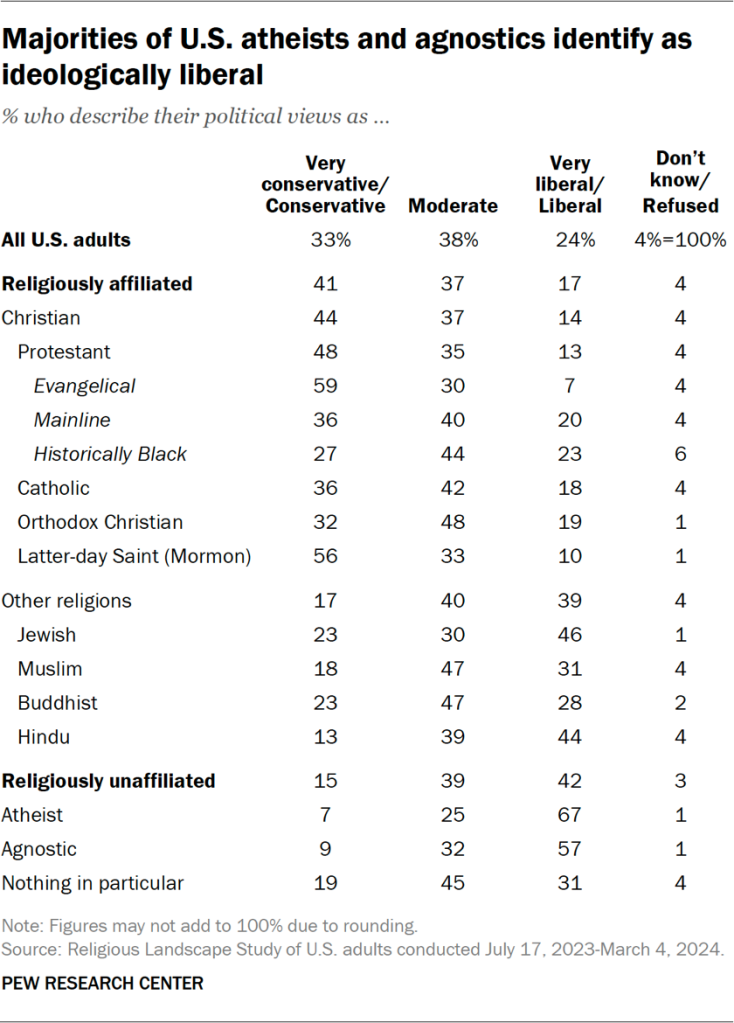
In general, highly religious Americans tend to identify with or lean toward the Republican Party and express conservative views on a variety of social, political and economic questions at much higher rates than do the least religious Americans. Meanwhile, Americans with lower levels of religious engagement tend to identify with or lean toward the Democratic Party and express liberal views on the same gamut of social, political and economic issues.27

For example, a majority of people in the most highly religious quartile of the U.S. adult population (61%) say they identify with or lean toward the Republican Party. By contrast, in the least religious quartile of the population, just 27% say they identify with or lean toward the GOP.28

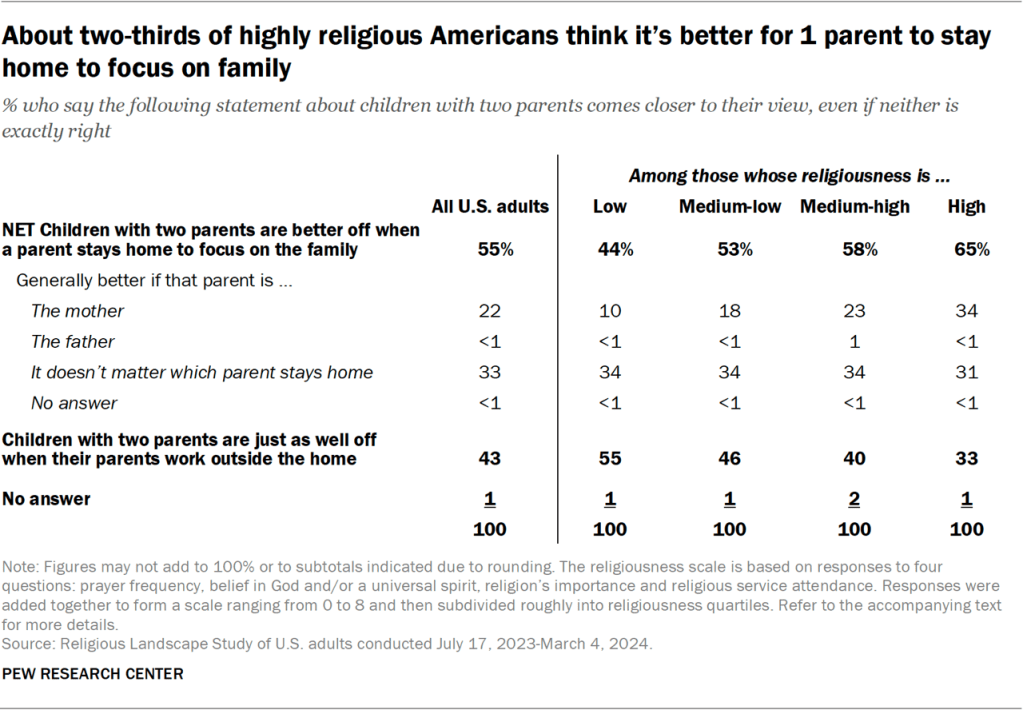
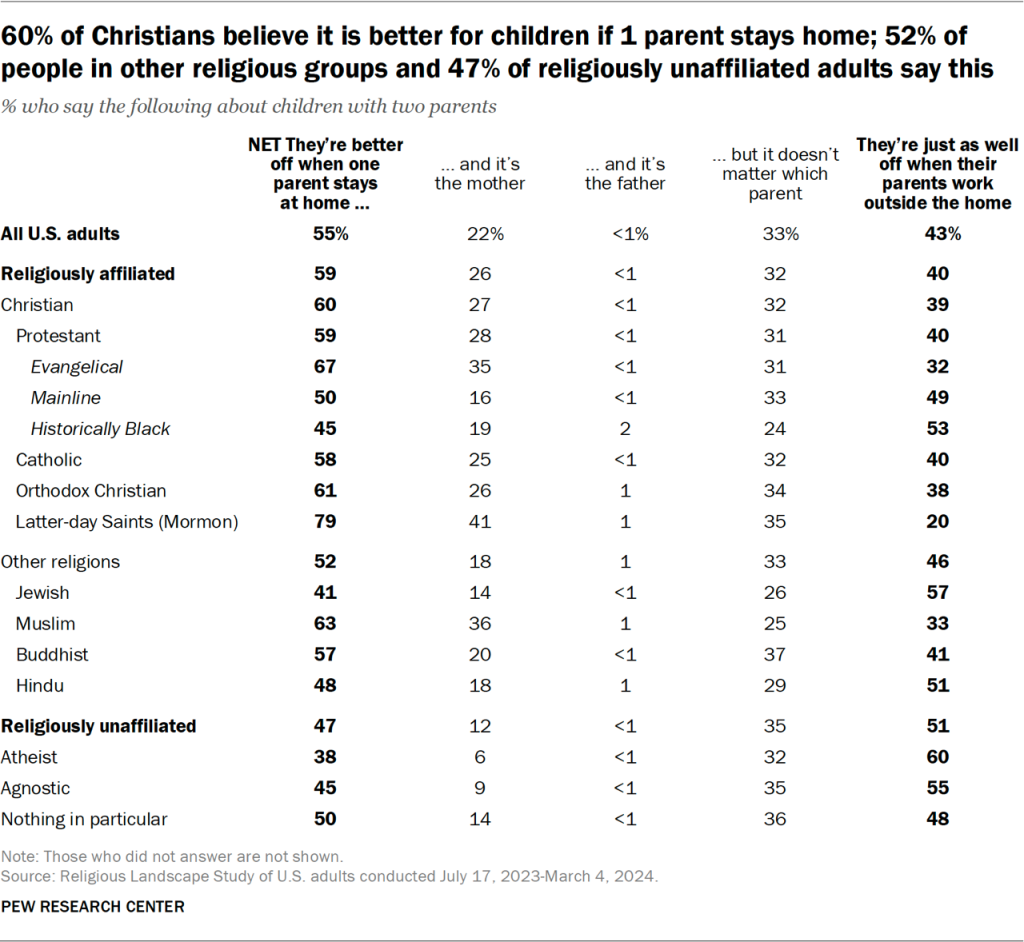
Highly religious U.S. adults also are far more likely than the least religious U.S. adults to say that abortion should be illegal, that homosexuality should be discouraged, and that children are better off if their mother doesn’t work and stays home to raise them instead.

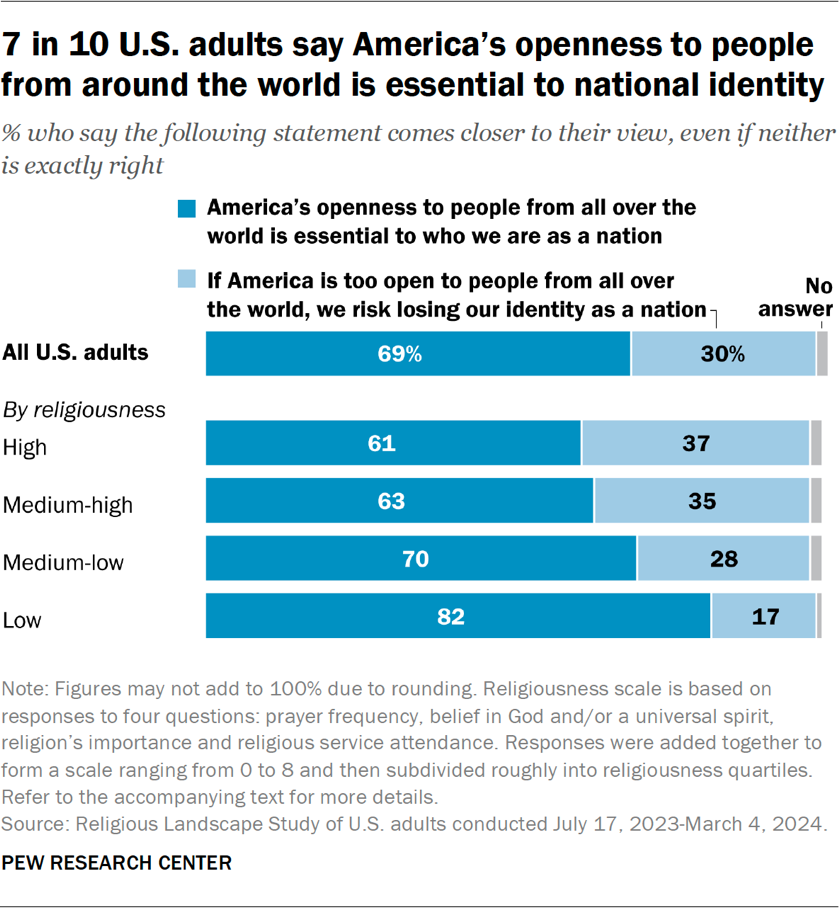
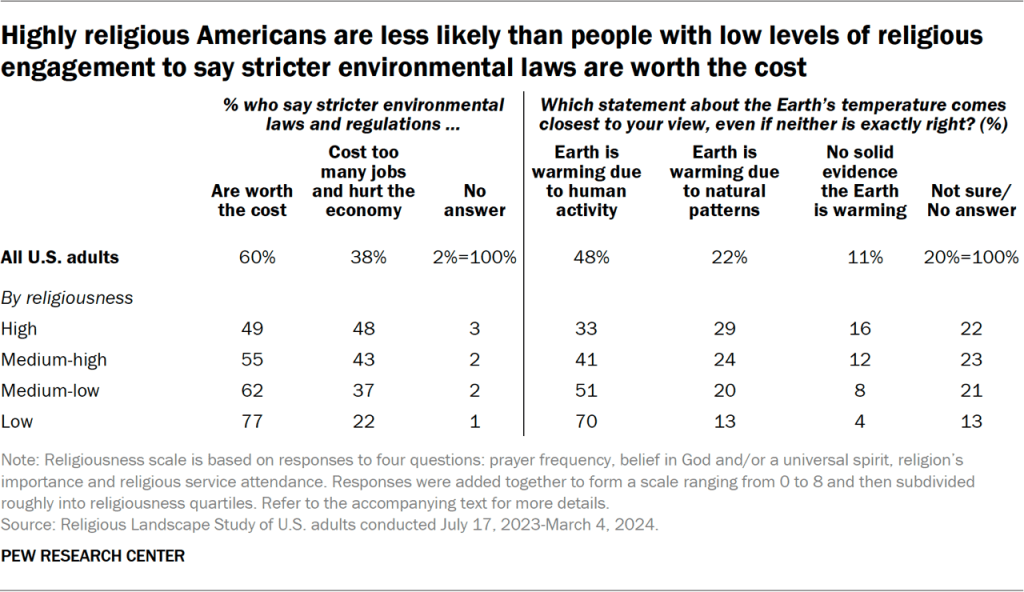
There also are religious differences on questions that aren’t directly about sexuality or gender roles. Highly religious people are more inclined than the least religious people to say that environmental regulations cost too many jobs and hurt the economy, as well as to say that too much openness to people from other countries is a threat to America’s identity.

None of the foregoing discussion is meant to suggest that religiousness (or lack thereof) is the primary factor driving Americans’ political opinions. Numerous other factors can help shape political views, including age, gender, education, geography and socioeconomic status. And political partisanship is itself an important factor in people’s views about a host of issues.29
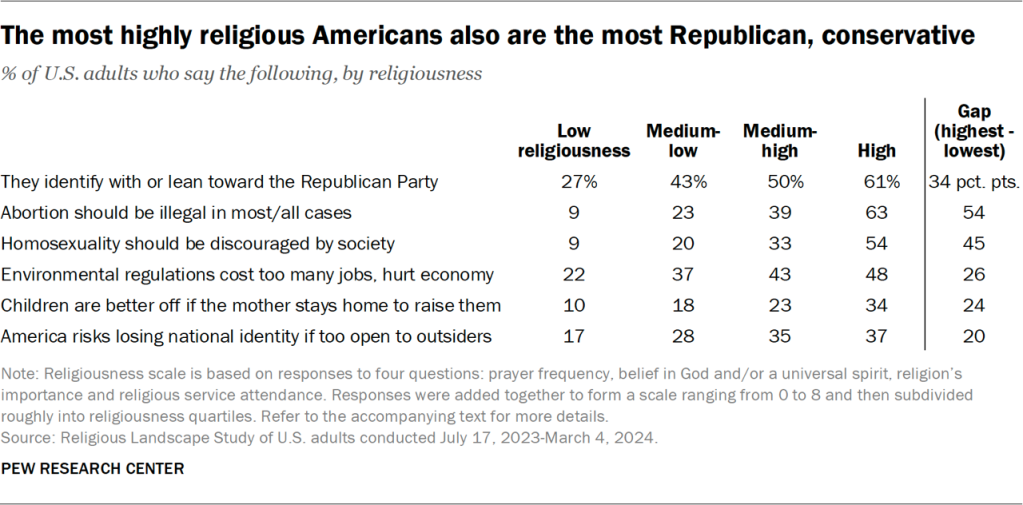
Table showing the most highly religious Americans also are the most Republican, conservative

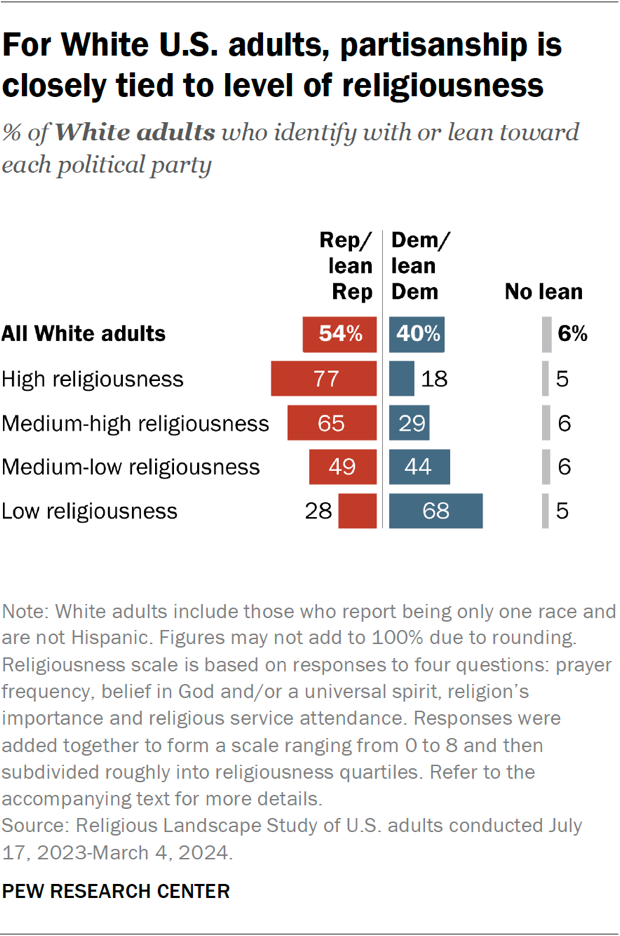
Moreover, the new RLS shows that the links between religion and politics vary quite a bit across racial and ethnic categories. The political differences between Americans with different levels of religiousness are especially large among White respondents. For example, compared with the least religious White Americans, the most highly religious White Americans are:

  • 64 percentage points more likely to say abortion should be against the law in most or all cases (72% vs. 8%)
  • 53 points more likely to say homosexuality should be discouraged by society (61% vs. 8%)
  • 49 points more likely to identify with or lean toward the Republican Party (77% vs. 28%)
  • 35 points more likely to say environmental regulations cost too many jobs and hurt the economy (56% vs. 21%)

In other racial and ethnic groups, there also is a relationship between religiousness and political views, with more highly religious people generally expressing more conservative views. However, the differences in political views between people with different levels of religiousness tend to be smaller in other racial and ethnic groups, and they are not seen on every issue.

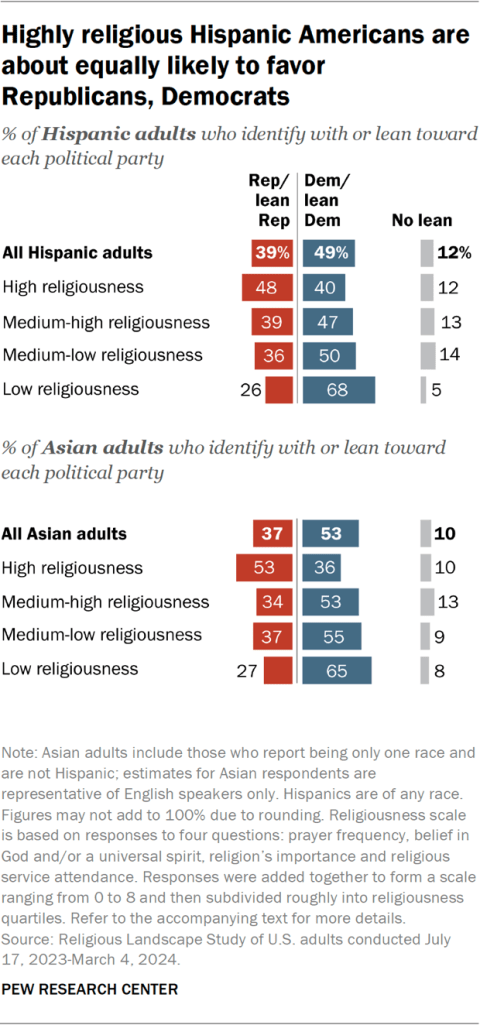
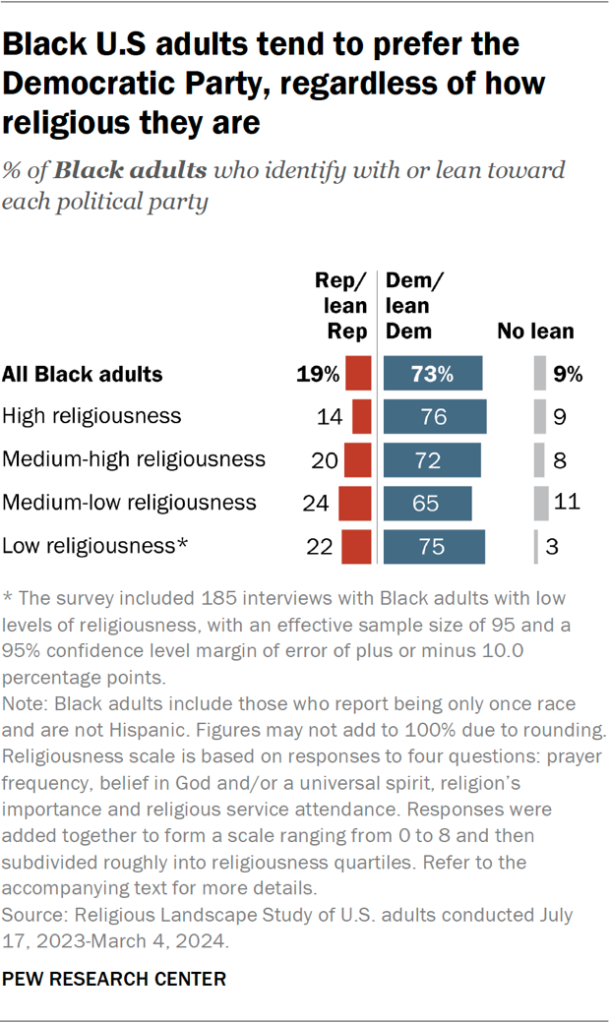
For example, Black respondents who are highly religious are not more likely than the least religious Black respondents to identify with or lean toward the Republican Party; if anything, highly religious Black adults are somewhat less Republican than Black adults with the lowest levels of religious engagement.

Highly religious Hispanic respondents are, on average, more likely than the least religious Hispanics surveyed to identify with the Republican Party. But the gap in Republicanism among highly religious Hispanic adults and Hispanic adults in the lowest religiousness category is 22 points, much smaller than the 49-point gap among White adults.
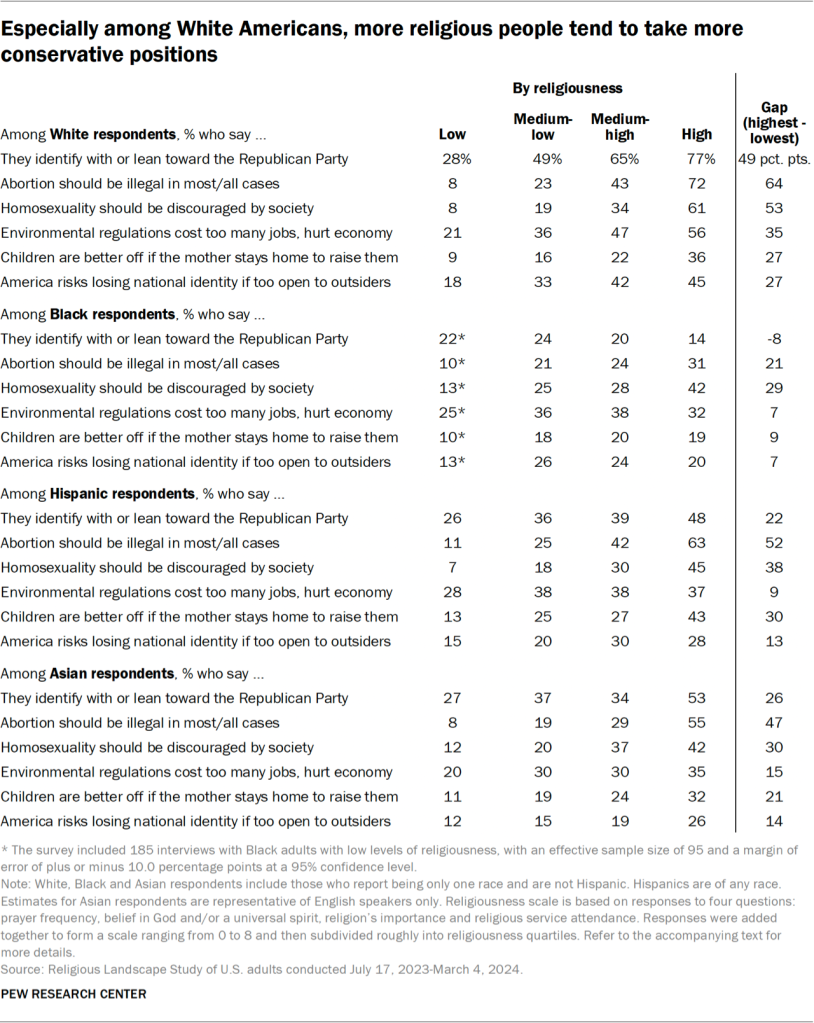
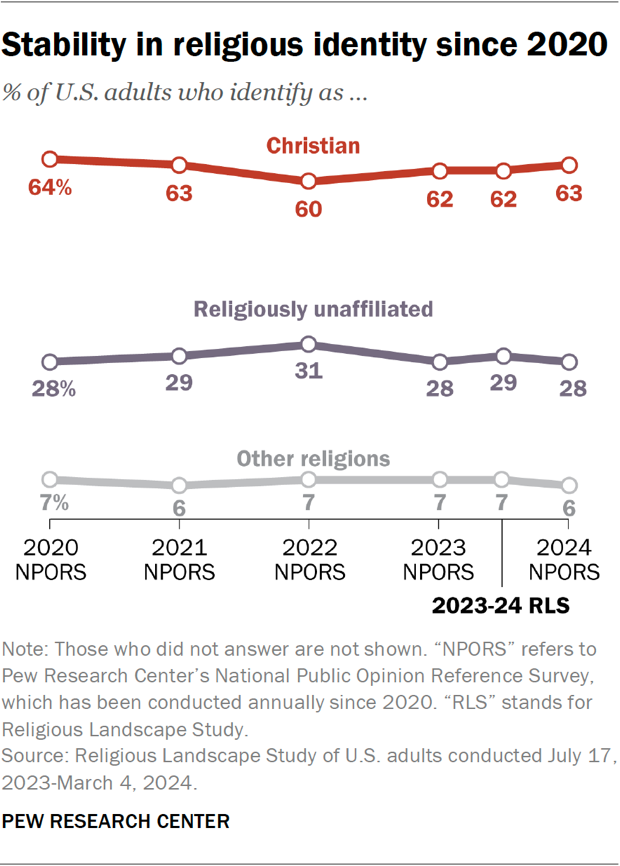
Table showing that especially among White Americans, more religious people tend to take more conservative positions

Executive summary

The 2023-24 Religious Landscape Study (RLS) and other Pew Research Center polling find that the Christian share of the population, after years of decline, has been relatively stable since 2019. And the religiously unaffiliated population, after rising rapidly for decades, has leveled off – at least temporarily. At present:

  • 62% of U.S. adults describe themselves as Christians: 40% are Protestant, 19% are Catholic, and 3% are other Christians.
  • 29% are religiously unaffiliated: 5% are atheist, 6% are agnostic, and 19% identify religiously as “nothing in particular.”
  • 7% belong to religions other than Christianity: 2% are Jewish, and 1% each are Muslim, Buddhist or Hindu (all figures are rounded).

Some key measures of religious belief and practice also have held fairly steady in recent years. The 2023-24 RLS finds that:

  • 44% of U.S. adults say they pray at least once a day. Though down significantly since 2007, this measure has held between 44% and 46% since 2021.
  • 33% say they go to religious services at least once a month. Since 2020, the percentages saying this have consistently hovered in the low 30s.

And large majorities of Americans have a spiritual, supernatural outlook. For example:

  • 86% believe people have a soul or spirit in addition to their physical body.
  • 83% believe in God or a universal spirit.
  • 79% believe there is something spiritual beyond the natural world.
  • 70% believe in heaven, hell or both.

But in future years we may see further declines in the religiousness of the American public, for several reasons:

  • Young adults are far less religious than older adults.
  • No recent birth cohort has become more religious as it has aged.
  • The “stickiness” of a religious upbringing seems to be declining: Compared with older people, fewer young adults who had a highly religious upbringing are still highly religious as adults.
  • The “stickiness” of a nonreligious upbringing seems to be rising.

This is the third time Pew Research Center has conducted a Religious Landscape Study. The first RLS was conducted in 2007. The second was in 2014. Other key findings from the new study include:

  • 35% of U.S. adults have switched religions since childhood, leading to net gains for the unaffiliated population and net losses for the Christian population.
  • All three major strands of Protestantism have declined in percentage terms since 2007.
    • Evangelical Protestants now make up 23% of U.S. adults, down from 26%.
    • Mainline Protestants account for 11% of U.S. adults, down from 18%.
    • Members of historically Black Protestant churches make up 5% of U.S. adults, down from 7%.
  • The share of Americans who identify with nondenominational Protestantism is growing.
  • Many other Protestant denominational families (including Baptists, Methodists, Lutherans and others) have declined as shares of the population.
  • The United Methodist Church, which has splintered in recent years, now makes up slightly fewer than 3% of U.S. adults, down from 5% in 2007.

The 2023-24 RLS also reveals patterns by:

  • Gender: Women remain more religious than men in the United States by a variety of measures, such as prayer frequency and belief in God or a universal spirit. But the gender gap in religiousness is less pronounced among the youngest adults than among older people, and it’s slightly smaller today than in 2007. Still, women in every age group are at least as religious as men.
  • Political ideology: The share of self-described political liberals who identify as Christians has fallen 25 percentage points since 2007, from 62% to 37%. Among self-described conservatives, the Christian share has declined 7 points, from 89% to 82%.
  • Race and ethnicity: 66% of adults who attend religious services say that most or all people in their congregation have the same race or ethnicity they do. Even more (78%) say this was true of the religious services they attended as children.
  • Immigration status: A majority of U.S. immigrants (58%) are Christian. About a quarter of foreign-born adults are unaffiliated, and 14% belong to other religions, including 4% who are Muslim, 4% who are Hindu and 3% who are Buddhist.

1. Religious identity

The religious composition of the United States has been fairly stable in half a dozen Pew Research Center surveys conducted since 2020. The Christian share of the adult population has been between 60% and 64% in these surveys, while the religiously unaffiliated share has ranged from 28% to 31%. Adherents of religions other than Christianity have consistently accounted for 6% or 7% of U.S. adults throughout this period.

Line chart showing the stability in religious identity since 2020

Over the longer term, however, Christians have been declining as a percentage of the U.S. adult population, while the share that is religiously unaffiliated has been rising.

Line chart showing the long-term decline of Christians, rise of religiously unaffiliated Americans

(For an extended discussion of what explains the short-term stability in American religion amid a longer-term decline, refer to this report’s Overview.)

This chapter draws on the 2007, 2014 and 2023-24 Religious Landscape Studies to summarize the long-term trends in Americans’ religious identities.

The data shows that the Christian share of the population has declined across many demographic groups. Compared with 2007, the percentage of people who describe themselves as Christians is lower among men and women; college graduates and those with less education; all racial and ethnic groups large enough to analyze; all age groups; and all geographic sectors of the country.

The picture is reversed for the religiously unaffiliated – a group sometimes referred to as religious “nones.” The “nones” are made up of U.S. adults who describe themselves as atheists, agnostics or “nothing in particular” when asked about their religion. The ranks of “nones” have grown among men and women, married and unmarried people; college graduates and people with less education; all large racial and ethnic groups; all age groups; and in all regions of the country.

This chapter includes sections on:

  • Trends within Christianity
  • A detailed look at the size of Protestant denominations
  • Trends among religiously unaffiliated Americans
  • Trends among religions other than Christianity

The chapter concludes with a set of detailed tables on the religious composition of key demographic groups.

Trends within Christianity

In the 2023-24 Religious Landscape Study (RLS), 62% of respondents identify as Christian, which is lower than the Christian shares measured in the 2007 (78%) and 2014 (71%) studies.

Table showing Christians have declined as a share of the U.S. adult population

The Protestant share of the population declined from 51% in 2007 to 40% in 2023-24.

The Catholic share of the population, meanwhile, ticked down from 24% in 2007 to 21% in 2014. Since then, it has ranged between 18% and 21% in Center surveys, and it stands at 19% in the 2023-24 RLS.

Members of the Church of Jesus Christ of Latter-day Saints (widely known as Mormons) have accounted for 2% of respondents in all three religious landscape surveys. Orthodox Christians account for 1% of the population in the latest RLS.

Fewer than 1% of respondents in the new survey identify as Jehovah’s Witnesses, and 1% identify either with more than one Christian group (e.g., people who say they identify as both Protestant and Catholic) or with a variety of other, smaller Christian groups (including Messianic Jews, Christian Scientists, or offshoots of Catholicism that are not in communion with Rome).

Christian shares across social and demographic groups

In all three of our landscape studies, younger Americans, men, unmarried people and college graduates have identified as Christians at lower rates than, respectively, older adults, women, married people and adults with less than a college degree.

But one thing all these demographic groups have in common is a long-term decline in the share who identify as Christians. For example, although women have identified as Christians at higher levels than men in all three landscape surveys, the share of women saying they are Christian has dropped from 82% in the first RLS (2007) to 66% in the most recent one (2023-24).

In addition, people of every racial and ethnic background that we measure are less likely to say they are Christian now than they were in 2007, as are people in every major region of the U.S.

Table showing the shrinking share of Christians across many social and demographic groups in the United States

A detailed look at the size of Protestant denominations

One feature of the RLS is that it includes detailed, branching questions to gather information about specific types of Protestants.  

The RLS seeks to learn not just whether someone is Protestant, but also what family of denominations (Baptist, Methodist, Lutheran, etc.) they may belong to.

In addition, the RLS goes a step further, seeking to learn which specific denomination within a Protestant family the respondent identifies with, if any. We ask Baptists, for instance, whether they identify with the Southern Baptist Convention; the American Baptist Churches USA; the National Baptist Convention, USA; or another Baptist church. We ask Methodists whether they identify with the United Methodist Church, the African Methodist Episcopal Church, the Global Methodist Church, or another kind of church.30

We take this information about which specific denomination respondents identify with and then we categorize Protestants into one of three major Protestant traditions – the evangelical tradition, the mainline tradition or the historically Black Protestant tradition. These divisions within Protestantism are important, because each has a distinctive combination of beliefs, practices and histories.31

Still, some respondents don’t identify with any specific denomination. For example, some describe themselves as “just Baptist,” “just Lutheran” or “just Christian” without providing additional details. In these cases, we use a question that asks respondents whether they think of themselves as “born-again or evangelical” Christians, along with information about their race and ethnicity, to help classify them into one of the three major Protestant traditions. (Refer to Appendix B for complete details about how Protestants are sorted into the evangelical, mainline and historically Black traditions.)

All three of these Protestant traditions have declined, at least a little, as shares of the U.S. adult population since the first RLS was conducted in 2007. The mainline Protestant category has exhibited the sharpest drop, declining from 18% of U.S. adults in 2007 to 11% in 2023-24. Evangelicalism remains the largest tradition within Protestantism, but the evangelical share of the adult population also has ticked down, going from 26% in 2007, to 25% in 2014, to 23% in 2023-24. Respondents in the historically Black Protestant tradition accounted for 7% of respondents in 2007 and 5% in 2023-24 (after rounding to the closest whole number).

Because of the steepness of the decline in mainline Protestantism, evangelicals have risen as a share of all Protestants (even as evangelicals have fallen as a percentage of the overall adult population).

Table showing mainline Protestants have declined as a share of both the overall public and of all Protestants

Largest Protestant denominational families

Baptists have been the single largest family of U.S. Protestant denominations in all three religious landscape surveys. They make up 12% of U.S. adults as of 2023-24.

Nondenominational Protestants, the second-largest family of Protestant denominations, now account for 7% of the adult population. This is the only Protestant family of denominations that is larger as a share of the U.S. population in the new survey than it was in the first RLS.32

Table showing among Protestants, share who are nondenominational has doubled since 2007

Most other denominational families have seen either a slight decline or relative stability in their share of the U.S. adult population since 2007.  

In the new survey, 4% of respondents identify with the Southern Baptist Convention, the nation’s largest evangelical denomination in our categorization. And 3% of U.S. adults identify with the United Methodist Church, making it the largest mainline denomination in the new survey. Overall, 1% of respondents in the new survey say they identify with the National Baptist Convention, USA, and 1% affiliate with the Church of God in Christ – two of the largest denominations in the historically Black Protestant tradition.

Table showing the largest Protestant denominations in the United States

Trends among religiously unaffiliated Americans

About three-in-ten Americans (29%) are religiously unaffiliated, according to the 2023-24 RLS. This includes 5% who identify as atheist, 6% who say they are agnostic, and 19% who describe their religion as “nothing in particular.”

Table showing 19% of U.S. adults now say their religion is ‘nothing in particular’

The share of Americans who are religiously unaffiliated – also known as religious “nones” – is markedly higher in the 2023-24 RLS than it was in 2007 (16%) and 2014 (23%). In the last several years, however, the growth of the “nones” seems to have slowed. (Refer to the Overview of this report for additional discussion of the short-term stability in the religiously unaffiliated population.)

While the percentage of “nones” varies across social and demographic groups, the direction of the trend from 2007 to 2023-24 is the same across the board: It is up, at least marginally, in every category.

Among Americans born in the 1980s, for example, 26% were religiously unaffiliated in 2007. In 2023-24, that share stands at 37%. The percentage of “nones” also has grown among both men and women; among married and unmarried people; within all major racial and ethnic categories; and in all regions of the country.

Table showing ‘nones’ have risen as a share of all major demographic groups since 2007

Trends among religions other than Christianity

Table showing the share of U.S. adults who identify as Jewish, Muslim, Buddhist, Hindu or with another non-Christian religion now stands at 7.1%

The share of Americans who identify with religions other than Christianity has increased – albeit from a small base – from 4.7% of U.S. adults in the 2007 RLS to 7.1% in the 2023-24 RLS.33

Table showing immigrants are more likely than U.S.-born adults to belong to non-Christian religions

In the new survey, 1.7% of respondents identify as Jewish when asked about their religion, while 1.2% identify as Muslim, 1.1% as Buddhist, and 0.9% as Hindu. The new survey finds that less than 0.3% identify with other world religions (such as Sikhism, Daoism, Bahaism and Zoroastrianism) and 1.9% identify with something else, religiously speaking (such as Unitarian Universalism, Pantheism, Wicca, etc.).

Immigrants in the United States are more likely than adults who were born in the U.S. to identify with a non-Christian religion. Among immigrants, 14% identify with a religion other than Christianity, compared with 6% of respondents born in the U.S.

Detailed tables

Table showing the religious affiliation of U.S. adults
Table showing the religious composition of birth cohorts: U.S. adults born in 1949 or earlier through those born in the 1970s
Table showing the religious composition of birth cohorts: U.S. adults born in the 1980s to 2006
Table showing the religious composition of racial and ethnic groups
Table showing the religious composition by place of birth
Table showing the religious composition by educational attainment
Table showing the religious composition by gender
Table showing the religious composition by marital status
Table showing the religious composition by detailed marital status, among people who are not currently married
Table showing the religious composition of geographic regions

2. Religious switching

Millions of Americans have changed their religion over the course of their lifetimes, switching from one religion to another, leaving religion altogether, or choosing to identify with a religion after having grown up without one.

If Protestants are counted as a single category – rather than separated into subgroups such as Baptists, Methodists, Lutherans, etc. – then the 2023-24 Religious Landscape Study (RLS) finds that 35% of U.S. adults were raised with a different religious identity than the one they have now.

This is roughly on par with what we found in the 2014 RLS, using the same definition of switching. At that time, 34% of Americans were categorized as having switched religions when Protestantism was treated as a single group.

(By this definition, religious switchers would include – to give just a few examples – a person who was raised Protestant and is now religiously unaffiliated; a person who was raised Catholic and now identifies as any kind of Protestant; a person who was raised in no religion but now identifies as Jewish; and a person who was raised as an Orthodox Christian and now identifies as a Catholic. However, a person who was raised as a United Methodist and now identifies as a Southern Baptist would not be considered to have switched religions, because both of those denominations are Protestant. Similarly, a person who was raised with no particular religion and now identifies as an atheist would not be counted as having switched, because both of those categories are part of the religiously unaffiliated grouping.34)

Chart showing Catholicism has lost 8.4 people for every person it has gained through ‘religious switching’ in the U.S.

The overall patterns of religious switching in the 2023-24 RLS are similar to the patterns that appeared in the previous landscape studies. Christianity, as a whole, continues to lose more adherents than it gains through switching: For every American who has become Christian after having been raised in another religion or no religion, six others have left Christianity and now describe themselves as religiously unaffiliated, as belonging to another – i.e., non-Christian – religion, or they don’t answer the question about their current religion.

Both Protestantism and Catholicism experience net loss from switching. In the 2023-24 RLS, 1.8 people have left Protestantism for every person who has become a Protestant after having been raised in another religious group or in no religion. The ratio for Catholicism is even more lopsided: For every U.S. adult who has become a Catholic after being raised in some other religion or without a religion, there are 8.4 adults who say they were raised in the Catholic faith but who no longer describe themselves as Catholics.35

Pew Research Center uses the term “religious switching” rather than “conversion” to reflect the fact that movement occurs in all directions and is not necessarily accompanied by any rituals.

The category that has grown the most through religious switching is the religiously unaffiliated population. This group is sometimes called the “nones” and is made up of Americans who answer a question about their present religion by saying they are atheist, agnostic or “nothing in particular.” For every person who was raised as a “none” and now identifies with a religion, 5.9 people have switched away from their childhood religion and no longer identify with any religion.

This chapter details the religious switching among U.S. religious groups. We show both sides of the equation: how many U.S. adults have entered and left each group. We also show the retention rates of the large groups: what percentage of all people raised in a religious group as children remain in it as adults.

In addition, this chapter explores a pair of questions asking respondents to evaluate, in broad terms, how they have changed religiously and spiritually as they have aged.

Bar chart showing more Americans say their spirituality has increased than decreased over their lifetimes

When asked how their religiousness has changed, 28% of Americans say they have become more religious, while roughly the same share – 29% – say they have become less religious. The remainder describe their religiousness as unchanged (21%), say they have sometimes grown more religious and other times less so (21%), or they decline to answer the question (1%).

When asked how their spirituality has shifted over the course of their lifetimes, more U.S. adults say it has increased (43%) than decreased (11%). The remainder say their level of spirituality has stayed about the same (22%), indicate that it has sometimes risen and sometimes fallen (23%), or they give no answer (1%).

Jump to sections on:

  • Net gains and losses among religious traditions
  • Net gains and losses among Protestant denominational families
  • Retention among religious traditions
  • Retention among Protestant denominational families
  • Change in religiousness over time
  • Change in spirituality over time

Net gains and losses among religious traditions

Religiously unaffiliated Americans have experienced the greatest net gains, as a share of the U.S population, through religious switching.

Table showing most Americans who are currently religiously unaffiliated were not raised that way

Among all U.S. adults, 12.6% say they were raised with no religious affiliation (as atheist, agnostic or “nothing in particular”). About a quarter of that group – 3.5% of all U.S. adults – no longer identify as religious “nones.” Instead, they now identify with a religion (or, in a small number of cases, decline to answer the religion question).

Still, the share of people who have joined the ranks of the “nones” is nearly six times larger: 20.2% of all U.S. adults were raised in a religion and now identify as religiously unaffiliated.36

The picture is reversed for Christianity. Overall, 21.9% of U.S. adults are former Christians – people who say they were raised as Christians but no longer identify as such. That’s six times higher than the share of U.S. adults who now identify as Christians after having been raised in some other way (3.6%).

Catholics have experienced the greatest net losses due to switching. About three-in-ten U.S. adults (30.2%) say they were raised Catholic. But 43% of the people raised Catholic no longer identify as Catholic, meaning that 12.8% of all U.S. adults are former Catholics. Meanwhile, on the other side of the ledger, 1.5% of U.S. adults have become Catholics after being raised another way. Overall, 18.9% of U.S. adults currently identify as Catholics, according to the new RLS.

Protestantism also has lost more people than it has gained through religious switching. Overall, 13.7% of U.S. adults say they no longer identify with the group after having been raised as Protestants, compared with 7.6% of Americans who were not raised Protestant but now identify as such.

We found similar religious switching patterns in our 2014 Religious Landscape Study.

To put some of these percentages in context, there were approximately 262 million adults (ages 18 and older) in the United States in 2023, according to the U.S. Census Bureau. That means:

  • About 91 million U.S. adults (35%) have switched their religion since childhood – including more than 9 million (3.6%) who have become Christians and more than 57 million (21.9%) who have left Christianity.
  • Meanwhile, about 53 million (20.2%) have become religiously unaffiliated, while about 9 million (3.5%) have joined a religion after being raised without one.

Net gains and losses among Protestant denominational families

Several Protestant denominational families have lost more people than they have gained through religious switching.

Table showing several Protestant denominational families have lost more adherents than they’ve gained through ‘religious switching’

For example, 7.5% of U.S. adults say they were raised Baptist but no longer identify as Baptist, compared with 3.3% of U.S. adults who were not raised Baptist but who now identify with the group.

Nondenominational Protestants are an exception to this pattern. While 1.7% of U.S. adults say they were raised as nondenominational Protestants and no longer identify as such, more than three times as many now describe themselves as nondenominal Protestants after having been raised another way (5.7%).

There were similar patterns in Protestant denominational switching in the 2014 RLS.

Retention among religious traditions

The previous analysis in this chapter looked at the shares of all U.S. adults who say they were raised in various religious groups, what percentages have left each group, and what percentages have joined each group after having been raised in some other way.

Another way to examine the data is by looking at “retention rates.” Among the people raised in a particular religious group, what percentage continue to identify with that group as adults?

At least three-quarters of Americans who were raised Hindu (82%), Muslim (77%) and Jewish (76%) still identify with those religious groups in adulthood. Among people raised as Hindus, 11% are religious “nones” today, as are 13% of those raised Muslim and 17% of those raised Jewish.

Seven-in-ten adults who were raised Protestant still identity as Protestant as adults, while 22% of people raised as Protestants say they are now religiously unaffiliated.

Table showing upward of 75% of Americans who were raised as Hindu, Muslim or Jewish still identify with the same religious group as adults

Among people who were raised Catholic, 57% still identify as such as adults. About a quarter of people who were raised Catholic now say they are religiously unaffiliated (24%), and 14% of people raised as Catholics identify as Protestant today.

Nearly three-quarters of those raised religiously unaffiliated (73%) have remained religious “nones” as adults. Most of those who were raised as “nones” but have since changed affiliations now identify as Protestants (17%).

The retention rate among religious “nones” in the 2023-24 RLS is significantly higher than it was in the 2014 RLS. At that time, 53% of Americans who were raised without a religious affiliation continued to identify as unaffiliated in adulthood. The share of people raised as “nones” who say they are still “nones” has gone up across all age categories since 2014.

In general, the retention rate of those raised as “nones” is higher among younger adults than it is among older people. For instance, among adults born between 2000 and 2006 (who were between the ages of 18 and 24 when the 2023-24 survey was conducted), 79% of those raised as “nones” are still religiously unaffiliated today, as are 80% among people born in the 1990s who were raised as “nones.” By comparison, among those born in the 1960s who were raised as “nones,” 61% are still “nones” today, as are 60% of people born in the 1950s who were raised as “nones.”

Retention among Protestant denominational families

Baptists, Lutherans, Pentecostals and nondenominational Protestants have among the highest retention rates of Protestant denominational families in the 2023-24 RLS. More than half of Americans who were raised Baptist (54%) still identify as Baptists as adults; 47% raised Lutheran still identify as Lutherans; and 45% raised Pentecostal or nondenominational still identify that way as adults.

Among all U.S. adults who were raised Protestant, 44% still identify with the same denominational family as they did as children, while 26% identify with a different one. An additional 22% are religiously unaffiliated, 2% identify as Catholic, and 4% identify with another religion.

Table showing 54% of Americans who were raised Baptist are still Baptist as adults

Change in religiousness over time

About eight-in-ten Americans say their religiousness has shifted during their lifetimes, including 28% who say they have become more religious, 29% who say they have become less religious, and 21% who say their religiousness has fluctuated, sometimes increasing and other times decreasing. About one-in-five (21%) say their religiousness has stayed about the same over the course of their lives.37

Table showing 28% of Americans say they’ve grown more religious over their lives; 29% say they’ve grown less religious

Evangelical Protestants (50%); people who identify with the Church of Jesus Christ of Latter-day Saints, who are widely known as Mormons (48%); and members of historically Black Protestant churches (46%) are especially likely to say they have become more religious during their lifetimes. Religiously unaffiliated adults are the most likely group to say they have become less religious (54%).

Change in spirituality over time

On a parallel question about spiritual change, 43% of Americans say they have generally become more spiritual during their lifetimes, while 11% say they have become less so. An additional 23% say they sometimes have grown more spiritual, other times less so. And 22% say their level of spirituality has stayed about the same.38

Table showing 43% of Americans say they’ve become more spiritual over their lives; 11% say they’ve become less spiritual

About six-in-ten members of evangelical Protestant (61%) and historically Black Protestant (58%) denominations say they have become more spiritual over their lifetimes. A similar share of Latter-day Saints say this (58%).

The survey finds that 43% of mainline Protestants, 42% of Muslims, 42% of Buddhists, 41% of Catholics and 40% of Hindus say they have grown more spiritual over time.

About a third of Jews (34%) and 27% of religiously unaffiliated adults say they have become more spiritual over the course of their lives.

3. Identifying with a religion because of culture, ethnicity or family background

For many years, Pew Research Center’s standard question about religious identity has asked, “What is your present religion, if any?” We asked that question again in the 2023-24 Religious Landscape Study (RLS).

This new survey, coming after a long period of decline in U.S. religious affiliation, also sought to measure whether Americans feel connected to religions that they do not identify with religiously.

So we asked respondents if they think of themselves as Catholic, Jewish, Buddhist, Muslim or Hindu for reasons “aside from religion” – for example, ethnically, culturally, or because of their family background. Respondents had the option to say they felt connected to any of these five religions, or to none of them.39

We asked this question because we wanted to know how many people feel an enduring attachment to a religious tradition they were raised in but no longer practice, or feel a connection to a particular religious group for other reasons – perhaps, for example, because they have a spouse, family member or close friend who belongs to the group, or because their ancestors belonged to the group – even though they don’t consider it their own religion.

In some previous research, we delved into the views and experiences of Americans who feel these kinds of cultural, ethnic or ancestral connections to the Jewish people, to Catholicism and to Islam.40 In the new RLS, we have broadened the lens to include two additional religions that are often intertwined with ethnicity: Hinduism and Buddhism.

Table showing 12% of U.S. adults say they consider themselves Catholic for reasons ‘aside from religion’

The survey finds that more Americans identify as Catholic aside from religion (12%) than express a similar connection with any other religion we listed. Combining this 12% with the 19% of U.S. adults who identify Catholicism as their religion, a total of 31% of all U.S. adults identify as Catholic either religiously or aside from religion.

The survey also finds that 3% of U.S. adults identify as Jewish aside from religion, and an identical share identify as Buddhist aside from religion.41

Additionally, 1% of U.S. adults identify as Muslim aside from religion, and 1% identify as Hindu aside from religion. (All these percentages have been rounded to the nearest whole number.)

The survey did not ask any follow-up questions about why respondents identify with these religious groups. But, using other questions in the survey, we can see that some people who identify with a religious tradition for reasons aside from religion also say they were raised in that religion or have a spouse or partner who identifies with that religion. For example, 62% of people who identify as Catholic aside from religion say they were raised Catholic or have a Catholic spouse or partner. Among adults who identify as Jewish, Buddhist, Muslim or Hindu aside from religion, about one-in-five or slightly fewer respondents say they were raised in these traditions or have a spouse or partner who identifies with the tradition.

Other people identify with more than one group aside from religion, which may suggest they have an affinity for many religions or all major religious traditions.

Still, other respondents – ranging from 12% among those who identify as Hindu aside from religion to 52% of those who identify as Jewish aside from religion – say they identify with one of these groups aside from religion even though they were not raised in that religion, do not have a spouse/partner who identifies with that group and do not identify with multiple traditions. Presumably, these respondents have some other connections to the traditions they identify with aside from religion that cannot be measured by this survey.

Read on for more about Americans who identify with the following traditions aside from religion:

  • Catholicism
  • Judaism
  • Buddhism
  • Islam
  • Hinduism

Catholic ‘aside from religion’

Overall, 12% of U.S. adults identify religiously as something other than Catholic but nevertheless say they think of themselves as Catholic “aside from religion” – for example culturally, ethnically, or because of their family background.

Table showing the share of U.S. adults identifying as Catholic ‘aside from religion’ in the U.S.

Among this group (people who identify as Catholic aside from religion), 57% say they were raised in the Catholic faith as children. And 12% say they currently have a spouse or partner who is Catholic by religion.

Altogether, 62% of people who identify as Catholic aside from religion were either raised Catholic or have a Catholic spouse or partner.

In terms of their current religion, 39% of people who consider themselves Catholic aside from religion identify as Christians – though not as Catholics by religion – while 7% identify with other (non-Christian) religions and 51% are religiously unaffiliated (i.e., atheist, agnostic or “nothing in particular”).

Overall, 13% of people who identify as Catholic aside from religion also say they identify with one or more additional religious traditions aside from religion, indicating that they feel connections to multiple religions.

Jewish ‘aside from religion’

Past Pew Research Center surveys have examined U.S. adults who are not Jewish by religion but consider themselves Jewish for other reasons, such as ancestry or culture.

Table showing the share of U.S. adults identifying as Jewish ‘aside from religion’ in the U.S.

The current RLS finds that 3% of all U.S. adults are not Jewish by religion but consider themselves Jewish for reasons aside from religion, such as their ethnicity, culture, or family background.

About one-in-ten people in this group (11%) say they were raised Jewish by religion. And 5% have a spouse or partner who is Jewish by religion. Altogether, 16% were either raised Jewish themselves or have a spouse or partner who is Jewish.

Slightly more than half of people who identify as Jewish aside from religion identify religiously today as Christians, and 9% identify with another religion (other than Christianity or Judaism). One-third are religiously unaffiliated.

Overall, 35% of people who identify as Jewish aside from religion also identify with one or more additional religious traditions aside from religion.

Buddhist ‘aside from religion’

About 3% of U.S. adults consider themselves to be Buddhist aside from religion.

Table showing the share of U.S. adults identifying as Buddhist ‘aside from religion’ in the U.S.

Within this group, 13% say they were raised Buddhist in childhood. And 5% say they have a Buddhist spouse or partner today. Altogether, 16% were either raised Buddhist or have a Buddhist spouse or partner.

The survey finds that among the people who identify as Buddhist aside from religion, 43% also identify with one or more other religious traditions aside from religion.

Muslim ‘aside from religion’

Overall, 1% of U.S. adults say they identify as Muslim aside from religion.

Table showing the share of U.S. adults identifying as Muslim ‘aside from religion’ in the U.S.

One-in-five people in this group were either raised Muslim (17%) or have a Muslim spouse or partner (5%).

About six-in-ten people who identify as Muslim aside from religion (58%) also identify with at least one other religious tradition aside from religion.

Hindu ‘aside from religion’

Among all respondents in the new survey, 1% say they think of themselves as Hindu aside from religion.

Table showing the share of U.S. adults identifying as Hindu ‘aside from religion’ in the U.S.

Within this group, 16% say they were raised Hindu and 6% have a Hindu spouse or partner. Altogether, 18% were either raised Hindu or have a Hindu spouse or partner.

Among people who identify as Hindu aside from religion, 72% also identify with at least one other religious tradition aside from religion.

4. Religious intermarriage

In the new Religious Landscape Study (RLS), nearly three-quarters of U.S. adults who are currently married (74%) say they have the same religion as their spouse, a similar share as in the 2014 RLS (75%).

Bar chart showing 26% of married Americans have a spouse of another religion

And 26% of married U.S. adults in the new study say their spouse has a religious identity that is different from their own. They include:

  • 13% of married U.S. adults who are Christians paired with a religiously unaffiliated spouse, or vice versa;
  • 7% of married U.S. adults who are Christians and whose spouse is part of a different Christian tradition, such as a Catholic married to a Protestant; and
  • 6% of married people who are in other types of interfaith pairings, such as between a Jew and a Catholic, or between a Muslim and a religious “none.”

The survey also finds that 51% of married U.S. adults say their religious beliefs are very similar to their spouse’s beliefs. And 36% say they talk about religion with their spouse at least once a week.

Compared with people in religiously mixed marriages, respondents who are “in-married” (married to a person of the same religion) are more likely to say they share similar beliefs and talk about religion weekly or more often with their spouse.

All these findings depend, of course, on how one defines a religious intermarriage.

The analysis in this chapter is based on current, intact marriages. It compares the respondent’s current religion with their description of their spouse’s current religion at the time of the survey. (Spouses were not interviewed.)

This analysis does not include marriages that have ended – whether through divorce, annulment or death. Nor does it hinge on whether one spouse switched religions to join the other’s religion. For example, a former Christian who converted to Islam before (or after) marrying a Muslim would be counted as in-married – not as religiously intermarried – if they were married and shared a religion at the time of the survey.

In addition, this analysis treats Protestants, Catholics, Orthodox Christians and members of the Church of Jesus Christ of Latter-day Saints (widely known as Mormons) as separate religious groups. Marriages between people in any two of these traditions (such as between a Protestant and a Catholic) are counted as intermarriages throughout this chapter.

However, all varieties of Protestantism are treated as one religious group – meaning that a Baptist married to a Lutheran, or a Methodist married to a nondenominational Protestant, are not counted as intermarried.

Similarly, all religiously unaffiliated Americans are considered as one group. An atheist who is married to an agnostic, for instance, doesn’t count as religiously intermarried for the purposes of this analysis.

Jump to sections in this chapter about:

  • Intermarriage across religious traditions
  • Religiousness and intermarriage
  • Similarities in religious views between spouses
  • Similarities in the importance of religion between spouses
  • Frequency of religious discussions in marriages
  • Religion among unmarried people who are living with a partner

Intermarriage across religious traditions

Overall, 74% of married respondents in the survey say their spouse has the same religion they do, while 26% say their spouse identifies with a different religion, using the definitions outlined above.

Roughly nine-in-ten married Latter-day Saints (87%) have a spouse who is of the same religion, making people in this group more likely than married people in any other U.S. religious group we analyzed to be religiously in-married.

Meanwhile, 81% of married Protestants have spouses who also are Protestant, while 10% are married to religiously unaffiliated spouses and 7% have Catholic spouses.

Among married Catholics, three-quarters have spouses who are Catholic, 12% are married to Protestants, and 9% have spouses who are religiously unaffiliated.

Roughly two-thirds of married religiously unaffiliated people (68%) have a spouse who is religiously unaffiliated. A similar share of married Jewish respondents (65%) say they have a Jewish spouse.42

The survey did not include enough interviews with married people in other religious traditions – including Muslims, Buddhists, Hindus and others – to be able to analyze their intermarriage patterns.

Table showing latter-day Saints are most likely to have a spouse of the same religion

Religiousness and intermarriage

People who identify with the same religion as their spouse tend to have higher levels of religiousness than people married to someone of a different religion.43

Table showing intermarried adults tend to be less religious than those married to a person of the same religion

For example, among Protestants who are married to other Protestants, 62% are highly religious, compared with 27% of Protestants who are married to non-Protestants.

And 46% of Catholics who are married to other Catholics display a high level of religious engagement, compared with 24% of Catholics married to non-Catholics.

Among Jewish respondents with Jewish spouses, 29% are highly religious. That is the case for 4% of Jewish respondents whose spouses are not Jewish.

Few religiously unaffiliated respondents are highly religious, regardless of whether their spouse identifies with a religion. That said, unaffiliated respondents whose spouses identify with a religion are less likely to exhibit low levels of religious engagement than are unaffiliated respondents whose spouses also are unaffiliated (60% vs. 72%).

The survey did not include enough interviews with married people in other religious traditions – including Muslims, Buddhists, Hindus and others – to be able to analyze their intermarriage patterns. It also did not include enough married Latter-day Saints to analyze those who are intermarried.

These results don’t necessarily show that being in a religiously mixed marriage causes people to become less religious. Indeed, the causal arrow could just as easily point in the opposite direction: People who aren’t particularly religious may be more inclined to enter into a religiously mixed marriage.

Similarities in religious views between spouses

When asked to compare their own religious beliefs with those of their spouse, 51% of married respondents say their beliefs are very similar. An additional 30% say their beliefs and their spouse’s beliefs are somewhat similar, while 14% say they are not too similar or not at all similar.

Among married people whose spouse shares their religious identity, 62% report that their spouse has very similar religious beliefs. By contrast, among married people whose spouse does not share their religious identity, 21% say they and their spouse hold very similar religious beliefs.

Table showing 51% of married U.S. adults say they and their spouse share ‘very similar’ religious beliefs

Similarities in the importance of religion between spouses

Among married people who say religion is very important in their own life, 68% say it also is very important in their spouse’s life.

Table showing most married U.S. adults who say religion is very important to them also say it’s very important to their spouse

And among married people who say religion is not too or not at all important in their own life, 78% also say this is the case in their spouse’s life.

Frequency of religious discussions in marriages

Among married respondents, 36% report discussing religion with their spouse weekly or more often. And 47% say they discuss religion monthly or less often with their spouse, while 16% say they never talk with their spouse about religion.

People in same-religion marriages are more likely to discuss religion with their spouse than are people in interfaith relationships, according to the survey. Among U.S. adults married to someone of the same religion, 43% say they talk with their spouse about religion weekly or more often. Among those in mixed marriages, the corresponding share is 16%.

Table showing 36% of married Americans discuss religion with their spouse at least weekly

Religion among unmarried people who are living with a partner

Overall, 62% of unmarried people living with a partner identify with the same religion their partner does, while 38% say their partner has a different religious identity. By comparison, 74% of married people report that their spouse shares their religion, while 26% say their spouse has a different religious identity.

Table showing about 6 in 10 adults living with a romantic partner are in a same-religion relationship

5. Religious upbringing and childhood education

The vast majority of Americans were raised in a religion. Fully 86% say that as children, they identified with Protestantism, Catholicism, Judaism, Islam or another religion. Just 13% of U.S. adults say that as children, they did not identify with any religion.

The Religious Landscape Study (RLS) shows, furthermore, that 68% of U.S. adults say they grew up attending religious services at least once or twice a month, including 56% who say they went at least once a week.

Seven-in-ten U.S. adults say they received at least some formal religious education as children, attending either a private religious school or other religious education programs such as Sunday school or CCD (Confraternity of Christian Doctrine). This includes 35% of Americans who received a lot of formal religious education (seven or more years attending either type).

Bar chart showing most Americans say they were raised in a religion, grew up going to religious services at least monthly

In addition, 45% of Americans say religion was very important to their family when they were children.

The survey shows a clear relationship between people’s religious upbringing and how religious they are now. People raised in highly religious families are more likely to be religious themselves as adults.

Bar chart showing 55% of Americans who grew up in families in which religion was very important say religion is very important in their own lives today

For example, among adults who say religion was very important to their family when they were children, 55% say religion is very important in their own lives today. Far fewer people who grew up in families in which religion was less important say it is very important in their own lives today.

Still, growing up in a religious home is no guarantee that a person will view religion as very important as an adult. Among adults who say they were raised in homes where religion was very important to their family, 24% say religion is somewhat important to them today, and an additional 20% say it is not too important or not at all important.

Age plays a role in how people answer these questions. The younger they are, the less likely U.S. adults are to say they were raised in religious homes. And the “stickiness” of a religious upbringing may be declining: In general, younger U.S. adults who were raised in highly religious homes are less religious today than older U.S. adults who were raised in highly religious homes.

Read more in this chapter about:

  • Childhood religious identity
  • Religious service attendance during childhood
  • Importance of religion during childhood
  • Childhood religious education
  • Age differences in religious upbringing
  • Connection between religious upbringing and religious outcomes
  • Age differences in the ‘stickiness’ of religious upbringing

While this chapter includes data on U.S. adults’ religious affiliation and attendance at religious services as children – and on the importance of religion to them while they were growing up – you can read more about U.S. adults’ current levels of religious affiliation in Chapter 1, about current levels of religious attendance in Chapter 8, and about religion’s current importance to adults in Chapter 7.

Childhood religious identity

The vast majority of U.S. adults – 86% – say they were raised in a religion. This includes 80% who were raised as Christians and an additional 6% who were raised in other, non-Christian religions.

Table showing 86% of Americans were raised in a religion

Overall, 46% of U.S. adults say they were raised as Protestants, and 30% say they were raised as Catholics. Smaller shares were raised as members of the Church of Jesus Christ of Latter-day Saints, widely known as Mormons (2%); Orthodox Christians (1%); and Jehovah’s Witnesses (1%).

Among the survey’s respondents, 2% say they were raised Jewish by religion, 1% say they were raised Muslim, 1% were raised Buddhist, and 1% grew up Hindu.

In addition, 1% of U.S. adults say they were raised as atheists, 1% were raised as agnostics, and 11% say they were raised in no particular religion.

Religious service attendance during childhood

A majority of U.S. adults (56%) say they went to religious services weekly or more often as children, and an additional 11% say they grew up going to religious services once or twice a month.

Table showing that among Americans raised as Christians, 78% say they grew up going to church at least once a month

Looking just at people raised as Christians, 78% say they grew up going to church at least monthly, including 63% who say they went at least weekly.

People raised in religions other than Christianity report having attended religious services at lower rates as children.

Among people who say they were raised religiously unaffiliated, 17% say they grew up going to religious services at least monthly.

Importance of religion during childhood

Overall, 45% of U.S. adults say that religion was very important to their family when they were growing up.

Table showing 45% of Americans say religion was very important to their family growing up

Looking just at people who were raised as Christians, half say religion was very important to their family when they were children, including 49% of those raised Protestant and 51% of those raised Catholic.

Among U.S. adults raised in non-Christian religions, the shares who say religion was very important to their family when they were children range from 27% among those raised Buddhist to 66% among those raised Muslim.

Most adults who were raised without a religious affiliation say religion was not too or not at all important to their family when they were growing up (69%), while 15% say religion was very important to their family.

Far fewer Americans say religion was very important to them personally when they were children than say it was very important to their family while they were growing up. This pattern is seen among people raised in a wide variety of religious traditions.

Childhood religious education

Most Americans (69%) say they received at least some formal religious education as children. This includes 62% of U.S. adults who say that as children, they attended Sunday school, CCD or some other kind of religious education for one to three years (20%), four to six years (13%), or seven or more years (28%).

Fewer people (24%) say they attended a private religious school as a child for at least one to three years.

Table showing most U.S. adults say they received at least some formal religious education as a kid

We combined these two questions (about attendance at Sunday school or other religious education programs, and attendance at private religious schools) to construct a scale measuring levels of religious education.

Table showing 35% of U.S. adults received ‘a lot’ of formal religious education as children

According to the scale, 35% of U.S. adults received a lot of religious education, meaning they attended either a private religious school or an extracurricular religious program for seven or more years.

An additional 18% received a fair amount of religious education. By this we mean people who attended private religious school or religious education programs (or both) for four to six years, as well as those who attended one to three years of both kinds of programs.

Another 16% of Americans received a little religious education – meaning they attended a private religious school for one to three years or an extracurricular religious program for one to three years.

Three-in-ten Americans say they received no religious education as children.44

Among people who were raised as Christians, 41% received a lot of religious education when they were growing up, as did 37% of people raised Jewish. Smaller shares of people raised in other religions received a lot of religious education as children.

Most people who were raised religiously unaffiliated say they had no formal religious education as children.

Age differences in religious upbringing

Older adults are generally more likely than younger adults to have been raised with religion in their lives, according to several measures in the survey. For example, 94% of people born before 1950 say they were raised in a religion, compared with 81% of those born from 1990 to 1999, and 75% of adults born between 2000 and 2006.

Table showing that compared with older U.S. adults, fewer young people say they were raised in a religion or received a lot of religious education

There’s a similar age-related pattern when it comes to attendance at religious services when growing up and receiving a lot of formal religious education as children.

The survey’s question about the importance of religion to people’s families while they were growing up is an exception to this pattern. The youngest adults are no less likely than the oldest adults to say religion was very important to their family while they were children.

Connection between religious upbringing and religious outcomes

People who say they were raised in religious homes are more likely – compared with people who were not raised that way – to be religious in adulthood.

Table showing people who went to religious services at least monthly growing up say they go more regularly now as adults than do people who went less often growing up

For example, there are more religious service attenders among people who say they grew up going to religious services at least monthly than among people who didn’t attend religious services as often growing up (40% vs. 17%).

Similarly, U.S. adults who say religion was very important to their family when they were children are more apt to say religion is very important in their lives today than are people raised in homes where religion was less important.

Moreover, the survey shows that among people raised Protestant or Catholic, those who grew up in highly religious environments have retained their childhood religious identity at higher rates than those who were raised in less religious families.

For example, among people who were raised Protestant and grew up attending church monthly in families in which religion was very important, 80% still identify as Protestant today. By contrast, among people who were raised Protestant and grew up attending church a few times a year or less often in families in which religion was not very important, 57% are still Protestant today.

But many people raised in a religious home don’t grow up to be particularly religious. For example, among Catholics who were raised in religious families, three-in-ten are now either religiously unaffiliated (16%) or identify with a religion other than Catholicism (15%).

Table showing that among U.S. adults who were raised Protestant or Catholic, those who grew up in religious homes are more likely to have retained their religious identity

Age differences in the ‘stickiness’ of a religious upbringing

In general, the survey data also suggests that a religious upbringing is less “sticky” among today’s young adults than among older age groups.

Table showing that among U.S. adults raised in families in which religion was very important, younger ones are less likely to say religion is very important to them now
Importance of religion

People in the youngest cohorts of adults who were raised in families in which religion was very important are far less likely than older adults raised in such families to say religion is very important to them now.

Religious affiliation

Among people who were raised as Protestants, older adults are more likely to still identify with Protestantism today than are younger Americans. For example, roughly eight-in-ten adults born in the 1950s or earlier who were raised Protestant still identify that way today, compared with roughly six-in-ten adults born since 1980 who were raised Protestant.

Among people who were raised Catholic, six-in-ten or more who were born in the 1960s or earlier are still Catholic today, compared with about half of those who were born in the 1980s or later.

The pattern plays out differently for religious “nones,” in that older U.S. adults who were raised religiously unaffiliated are less likely to still be religiously unaffiliated than are younger adults who were raised that way.

Table showing that among Americans raised as Protestants, young adults are less likely than older adults to identify as Protestant today; the same is true for Catholics
Attendance at religious services

Among those born in 1949 or earlier who grew up attending religious services at least monthly, more than half (53%) say they still attend monthly today. That’s a far higher rate of religious attendance than is reported by adults born in the 1980s (35%), the 1990s (33%), or born between 2000 and 2006 (35%).

Table showing that compared with older U.S. adults, fewer young people who grew up attending religious services monthly still attend monthly as adults

6. Religion, fertility and child-rearing

The new Religious Landscape Study (RLS) shows that average family size varies by religious affiliation.

To compare how many children are born to parents in various groups, we asked all respondents how many biological children they have ever had during their lives. Since most Americans have completed childbearing by the time they reach ages 40 to 59, we focus on answers from respondents in this age group to estimate “completed fertility.”

Chart showing 27% of U.S. Christians have children under 18 at home

In the new RLS, Christians have a higher completed fertility rate (2.2 children per respondent) than religiously unaffiliated Americans (1.8) and Americans who belong to non-Christian religions (1.8).

Another way to gauge family size is by asking respondents whether they are currently parents or guardians of children under the age of 18 living in their home. Overall, Christian adults (27%) are a little less likely to be living with minor children than are religiously unaffiliated adults (29%) or adults who identify with non-Christian religions (31%).

How is it that U.S. Christians are less likely than other Americans to have children under 18 at home, but also that they’ve had more children over the course of their lives than other Americans, on average? A key factor is age. U.S. Christians are older, on average, than religiously unaffiliated people and people who identify with other religions. Just 42% of the Christian respondents in the RLS are between the ages of 25 and 54 – ages in which children are often present in homes – compared with 60% of religiously unaffiliated people and 56% of people who belong to other religions.

In addition to asking about family size, the survey also asked parents whether they engage in various religious activities with their children under 18 who live at home, and if these children receive specific types of religious education.45

Approximately four-in-ten respondents who are parents or guardians of minor children at home say they pray or read scripture with at least one of their children. About a third of parents of minor children say they send their kids to a religious education program, and 17% say they opt for homeschooling or private religious schooling instead of public school.

Among parents who are highly religious, 81% say they pray or read scripture with their children; 66% say they send their children to a religious education program; and 29% say they homeschool or send their children to a private religious school instead of a public school. Overall, 89% of highly religious parents say they do at least one of these things.46

Bar chart showing 8 in 10 highly religious parents say they pray or read scripture with their children

Read more about how religious groups answer the survey’s questions about:

  • Parental status and fertility
  • Parents’ religious activities with children

Parental status and fertility rates across religious groups

Overall, 28% of U.S. adults report being the parent or guardian of at least one child under 18 currently living with them.

Table showing fertility, parental status among U.S. religious groups

Similar shares of religiously affiliated (28%) and religiously unaffiliated (29%) adults say this, although sizable differences exist within these groups.

Among people identifying with a religion, for example, Hindus (44%) and Muslims (42%) are most likely to be raising children at home. At the other end of the spectrum, 22% of Jewish adults and 21% of mainline Protestants say they are the parent or guardian of a minor child in their home.

(On average, Jewish Americans and mainline Protestants are much older than Hindus and Muslims. Therefore, Jewish and mainline Protestant respondents are more likely than Hindu and Muslim respondents to be past the period of their lives when parents typically have minor children living with them. Refer to Chapter 24 for additional details about the age of people in various religious groups.)

The survey finds that among adults between the ages of 40 and 59, Christians have had 2.2 children, on average. Jewish Americans ages 40 to 59 report having had 2.0 children during their lifetimes, on average, while religiously unaffiliated adults in this age range have had an average of 1.8 children. 

Parents’ religious activities with children

Among Christians in the new survey who are currently the parents or guardians of at least one child in their home, 58% say they pray or read scripture with their children. About half (48%) say they send their child to a religious education program, and 22% say they homeschool their children or send them to a private religious school instead of public school.

Table showing 58% of U.S. Christian parents say they pray or read scripture with their children

In total, 70% of Christian parents engage in at least one of these forms of religious education for their children.

Parents who identify as evangelical Protestants (82%) or members of the Church of Jesus Christ of Latter-day Saints (84%) – who are widely known as Mormons – are even more likely than Christian parents overall to say they do at least one of these things with their children.

Far fewer religious “nones” who are parents of children under 18 living at home say they participate in these kinds of religious activities with their children. For example, just 9% say they send their child to a religious education program.

(The survey did not include enough responses from Orthodox Christian, Jewish, Muslim, Buddhist or Hindu respondents who are currently parenting minor children to be able to report their answers to these questions.)

7. Importance of religion and the Bible

The percentage of Americans who say religion is very important in their lives has been relatively stable in recent years, though it appears to be lower than it was in the 2007 and 2014 Religious Landscape Studies.

Today, about four-in-ten Americans say religion is very important to them. That’s what we’ve found both in the 2023-24 Religious Landscape Study (RLS) and in other surveys we have conducted since 2021.47

Line chart showing the share of Americans who say religion is very important has declined over the long term, but is more stable recently

In contrast, more than half of U.S. adults said religion was very important in their lives in 2007 (56%) and 2014 (53%). 

Some of this decline reflects the growth of religiously unaffiliated Americans: Adults who identify as atheist, agnostic or “nothing in particular” rarely say religion is very important to them personally.

The decline also may be partly due to a “mode effect,” as Pew Research Center has changed the way it conducts surveys. Unlike the 2007 and 2014 landscape studies, which were conducted by telephone, the new RLS was administered primarily online and on paper. The Center’s National Public Opinion Reference Survey (NPORS), repeated annually since 2020, also is conducted online and by paper.

A companion study conducted alongside the new RLS suggests that people are somewhat more inclined to say religion is very important in their lives when speaking to a live interviewer over the telephone than when reading questions by themselves and responding online or on paper. This aligns with social scientists’ findings that people taking surveys sometimes give more socially desirable answers when talking with another person, perhaps unconsciously leaning toward the answers they think the other person expects or wants to hear. The size and direction of this “mode effect” can vary, depending on the question.48

Bar chart showing most Christians in the U.S. say the Bible is very or extremely important in their lives

On the other hand, the percentage of Americans who say religion is very important in their lives was already slipping before we transitioned to online and paper surveys, and the mode effect on this question does not appear to be big enough to account for the entire decline since 2014.

The 2023-24 RLS also asked respondents about the importance of the Bible in their lives. While most Christians say the Bible is either extremely important or very important, most adults in other U.S. religious groups say the Bible is not too important or not at all important.

Read on for more details about how specific groups answer questions about the importance of religion and the importance of the Bible.

Religion’s importance

Nearly two-thirds of U.S. adults say religion is very important or somewhat important in their lives. But there are sharp differences across religious groups.

Table showing the slim majority of religiously affiliated Americans say religion is very important in their lives

Among members of the Church of Jesus Christ of Latter-day Saints (widely known as Mormons), members of historically Black Protestant denominations, and evangelical Protestants, roughly seven-in-ten say religion is very important to them personally.

Fewer than half of mainline Protestants and Catholics say religion is very important to them.

Most U.S. Muslims (60%) say religion is very important in their lives, while Buddhists and Hindus are more likely to say religion is somewhat important than to say it is very important.

Jewish Americans are among the most likely of the religiously affiliated groups studied to say religion is not too important or not at all important in their lives – though 27% say it is very important.

Most people who are religiously unaffiliated say religion is not important in their lives, including 98% of atheists who say it is not too important or not at all important.

The Bible’s importance

Overall, 44% of U.S. adults say the Bible is extremely important or very important in their lives, while 19% say the Bible is somewhat important, and 37% say the Bible is not too important or not at all important.49

Table showing most evangelicals and members of historically Black Protestant churches say the Bible is extremely or very important to them

A majority of U.S. Christians say the Bible is extremely important or very important in their lives, but there are large differences across Christian subgroups.

The vast majority of members of historically Black Protestant denominations, evangelical Protestants, and Latter-day Saints say the Bible is extremely or very important in their lives. Fewer than half of mainline Protestants and Catholics say this.

Most Americans who identify with non-Christian religions say the Bible is not too important or not at all important to them personally, though roughly one-quarter of Jews (22%) and Muslims (25%) say the Bible is extremely or very important in their lives.

Relatively few religiously unaffiliated adults (10%) say the Bible is extremely or very important in their lives. This modest share comes almost exclusively from people who say their religion is “nothing in particular,” rather than from atheists or agnostics.  

This question was not asked in previous RLS surveys, so we are not able to show trends over time.

8. Religious attendance and congregational involvement

One-third of U.S. adults say they attend religious services in person at least once a month, including 25% who report going at least once a week.

Chart showing 33% of U.S. adults attend religious services in person at least monthly

Far more Americans (67%) say they attend religious services in person a few times a year or less often. This includes about half of U.S. adults who seldom or never attend services.

Chart showing 23% of U.S. adults participate in virtual religious services at least monthly

In response to a separate question, the new survey finds that 23% of Americans watch religious services online or on TV at least once a month, while the majority (76%) do so a few times a year or less often.

Chart showing 40% of U.S. adults attend religious services in person or watch them online (or on TV) at least monthly

Looking at these two questions together allows us to see, more broadly, how many Americans participate in religious services. The 2023-24 Religious Landscape Study (RLS) finds that 40% of U.S. adults say they do so at least once a month, either in person or online, or both ways: 16% say they participate both ways, 17% attend only in person, and 8% watch only online or on TV.

Why we don’t compare these findings with 2014

In 2014, the last time we conducted a Religious Landscape Study, we asked a single question about religious participation – “How often do you attend religious services?” – without asking separately about in-person attendance and virtual participation. We did not begin asking respondents whether they watch religious services online/on TV until 2020, when the COVID-19 pandemic caused many congregations to restrict in-person attendance and begin livestreaming their services.

Another difference between this survey and the previous RLS is that the 2014 study was conducted entirely by telephone, while the new survey was conducted mainly online and on paper.50 Research shows that telephone surveys tend to produce higher estimates of religious attendance than web/paper surveys do.

Because of these changes, the results of the two surveys on religious service attendance are not directly comparable. What might appear to be a sharp drop from 50% of U.S. adults describing themselves as regular (at least monthly) attenders in 2014 to 33% describing themselves that way in 2023-24 does not necessarily reflect a real change in behavior. The difference between the two surveys is caused, at least in part, by changes in the ways the surveys were conducted.

That said, the Center’s telephone surveys were picking up a decline in religious attendance in the years before we switched over to online/paper surveys. The share of Americans who reported attending religious services at least monthly dropped from 54% in 2007 to 50% in the 2014 RLS and had fallen to 45% by the time the Center transitioned away from phone surveys in 2018-19.

This chapter covers the new RLS findings about:

  • Attending religious services in person
  • Watching religious services online or on TV
  • Participating in religious services either in person or online/on TV
  • Belonging to religious and nonreligious organizations

Attending religious services in person

One-third of U.S. adults say they attend religious services in person at least once or twice a month, while 18% report attending services a few times a year, and 49% seldom or never attend religious services in person.

Most members of the Church of Jesus Christ of Latter-day Saints (widely known as Mormons) say they attend religious services in person at least monthly (76%), as do 60% of evangelical Protestants.

Table showing 33% of Americans say they attend religious services in person at least monthly

Fewer Muslim Americans (46%), members of the historically Black Protestant tradition (46%), Catholics (40%), Orthodox Christians (37%), Hindus (35%) and mainline Protestants (34%) say they go to religious services once a month or more often.

Jewish adults (23%) and Buddhists (17%) are among the least likely groups of religiously affiliated Americans to say they attend religious services in person at least monthly. Among religiously unaffiliated adults – those who describe themselves as atheist, agnostic or “nothing in particular” – very few regularly attend religious services in person.

Watching religious services online or on TV

Overall, 16% of U.S. adults say they watch religious services online or on TV at least once a week. An additional 7% say they participate virtually once or twice a month, and 11% do so a few times a year. Most Americans (65%) say they seldom or never watch religious services online or on television.

Members of the historically Black Protestant tradition are among the most likely to say they watch religious services online or on TV at least monthly.

Table showing 54% of members of historically Black Protestant churches watch religious services online or on TV at least monthly

Participating in religious services either in person or online/on TV

When we combine these two questions about attending religious services in person and watching them online or on television, we find that 40% of U.S. adults say they participate in religious services at least once a month in some way – whether in person, online or both.

Table showing 4 in 10 U.S. adults participate in religious services in person or online at least monthly

Latter-day Saints (80%), evangelical Protestants (71%) and members of the historically Black Protestant tradition (66%) report the highest rates of participation in religious services, one way or another, at least monthly.

Latter-day Saints are especially likely to say they attend religious services monthly in person but do not watch services online (52%). Members of historically Black Protestant churches are especially likely to do the reverse (20%).

Participation varies somewhat across demographic groups:

  • Older Americans are more likely than younger Americans to say they participate in religious services in some way – in person, online or both – at least monthly.
  • A higher percentage of Black Americans than White, Hispanic or Asian Americans report that they participate at least monthly in religious services in person and/or online.
  • Generally, women are more likely than men to say they participate (one way or another) in religious services.
Table showing older Americans are more likely than younger ones to participate in religious services at least monthly in person, online or both

The survey did not include enough interviews with people who belong to many other U.S. religious groups – such as Orthodox Christians, Muslims, Buddhists and Hindus – to be able to subdivide them and analyze their attendance patterns by most demographic variables like sex, age, education, or race and ethnicity.

Belonging to religious and nonreligious organizations

Overall, 37% of U.S. adults say they, personally, are members of a church, synagogue, mosque or other house of worship, including 54% of Christians.

Table showing 86% of Latter-day Saints say they personally belong to a congregation

A large majority of Latter-day Saints (86%) belong to a congregation, as do 61% of evangelical Protestants and 56% of members of the historically Black Protestant tradition.

While Jewish Americans are less likely than U.S. Christians to attend religious services monthly or more often, 42% of Jewish Americans say they personally belong to a synagogue, temple or other congregation. This is on par with the share of “Jews by religion” (i.e., people who answer a question about their present religion by saying they are Jewish) who reported in our 2020 survey of Jewish Americans that they, personally, are synagogue members.

Overall, 3% of U.S. adults say they participate in organizations for atheists or nonbelievers.

9. Race and ethnicity in religious congregations

Americans who go to religious services tend to worship where most other congregants and senior leaders share their race or ethnicity.

Chart showing most U.S. adults who attend religious services worship where they are in the racial majority

Two-thirds of U.S. adults who attend religious services in person at least a few times a year (called “attenders” in this chapter) say they go to a church, synagogue, mosque, temple or other house of worship in which all or most other congregants share their race or ethnicity.

Two-thirds also go to congregations where the senior religious leaders share their race or ethnicity.

Bar chart showing growing up, most Americans attended religious services with people of their own race

The new Religious Landscape Study (RLS) also asked about the religious composition of the congregation that respondents attended as children. Most people who grew up attending religious services at least a few times a year (78%) say they went to religious services in which most other congregants had the same race or ethnicity as they did.

One-in-ten say that as children they went to a house of worship where most attendees were of a different race than their own. A similar share (10%) say they attended a congregation where no single racial group made up a majority.

Chart showing half of Americans who attend religious services go to congregations where most attendees are White

Today, half of U.S. adults who attend religious services at least a few times a year report that all or most other people in their house of worship are White, 11% say most of their fellow congregants are Hispanic, 10% say most are Black, and 4% say most are Asian.

And when it comes to leadership in their houses of worship, 53% of U.S. adults who attend services at least a few times a year say that all or most of the senior leaders there are White, 11% say most are Black, 10% say most are Hispanic, and 4% say most are Asian.

Additionally, 21% of attenders go to congregations where no one racial or ethnic group accounts for a majority of congregants, and 18% go to a congregation where no one racial or ethnic group makes up a majority of senior leaders.

Read more about how religious service attenders answer the survey’s questions about the racial and ethnic compositions of congregations and congregational leaders.

The racial and ethnic composition of congregations

Two-thirds of Americans who attend religious services at least a few times a year say that all or most of their fellow worshippers are the same race or ethnicity as themselves. An additional 11% say they go to a congregation where all or most other congregants have a different race or ethnicity than they do, and 21% attend a congregation in which no single racial group makes up a majority.

Table showing 66% of U.S. adults who attend religious services say most other congregants at their place of worship are the same race or ethnicity as they are

Most Jews (81%) worship where all or most attendees are the same race or ethnicity as themselves, as do 73% of mainline Protestants, 72% of members of the historically Black Protestant tradition, and 71% of Hindus.

Muslim Americans are an exception. Just 35% of Muslim Americans say they worship in congregations where they share the race or ethnicity of all or most of their fellow worshippers. A majority of Muslims who attend religious services do so either where all or most congregants are a different race than they are (26%), or where no one racial group makes up a majority (39%).

We do not discuss results for religious “nones” in this section because the vast majority of them – 88% – seldom or never attend religious services. Most of the rest say they attend religious services a few times a year (9%). Just 3% of religious “nones” say they attend religious services at least once or twice a month.

The survey did not include enough interviews with Orthodox Christians or members of other religiously affiliated groups who attend religious services in person at least a few times a year to be able to show their results.

The survey finds that 85% of Jewish attenders say they go to a congregation in which all or most other congregants are White, as do 70% of members of the Church of Jesus Christ of Latter-day Saints (widely known as Mormons), 70% of mainline Protestants and 61% of evangelical Protestants.

Table showing 70% of mainline Protestants and 85% of Jews who attend U.S. religious services do so where all or most congregants are White

Two-thirds of attenders who identify with the historically Black Protestant tradition say they go to a congregation in which all or most other people are Black or African American.51 And about three-quarters of Hindu attenders (77%) report that all or most of their fellow worshippers are Asian or Asian American.

Nearly half of Catholic attenders (47%) go to Mass at a church in which all or most other congregants are White, while 27% of Catholic attenders go to a church that is mostly Hispanic or Latino, and 19% say they attend a church where no racial group makes up a majority.

The differences across religious groups in the way respondents describe the racial and ethnic makeup of their congregations partly reflects the racial and ethnic composition of the groups themselves. For details on the racial and ethnic composition of people within these religious categories, refer to Chapter 24.

The racial and ethnic composition of congregational leaders

As with the racial and ethnic composition of congregants, two-thirds of Americans who attend religious services say they go to congregations in which all or most of the senior religious leaders are the same race or ethnicity as they are.

Table showing most attenders go to a congregation in the U.S. with religious leaders who have the same race as they do

Here again, Muslims are a notable exception. Fewer than half of Muslim respondents say they share the same race as most of the religious leaders at their mosque.

Roughly nine-in-ten Jewish Americans who attend religious services at least a few times a year say all or most of the leaders at their congregation are White. Three-quarters of Latter-day Saints and mainline Protestants say the same, as do two-thirds of evangelical Protestants.

About half of Catholics say all or most of the senior religious leaders at their parishes are White.

Table showing most Jews, Latter-day Saints, evangelicals and mainline Protestants in the U.S. attend congregations led mostly by White religious leaders

10. Prayer and other religious practices

Fewer than half of Americans (44%) say they pray each day. This is a substantial decline from the first Religious Landscape Study (RLS) conducted in 2007, when 58% said they prayed at least once a day.52

Most of the decline occurred between 2015 and 2021, a period in which the shares of U.S. adults who reported praying daily tumbled from 57% to 45%. Since 2021, the percentages who say they pray at least once a day have been relatively stable.

Line chart showing fewer Americans are praying daily

At least two factors help explain the long-term decline. First, the share of Americans who are religiously unaffiliated – those who answer a question about their religion by saying they are atheist, agnostic or “nothing in particular” – has increased by 6 percentage points since 2014. This group, sometimes called the “nones,” is less inclined than other Americans toward frequent prayer.

Second, the self-reported frequency of prayer has declined among U.S. adults in some of the largest religious groups, such as Catholics, evangelical Protestants and mainline Protestants.

This chapter discusses the findings of the 2023-24 RLS about the religious practices of the U.S. public. Unlike the question about prayer, however, we do not have valid data on trends over time for most of these questions. Some were asked for the first time as part of the new RLS. Others cannot be compared with previous surveys because of changes in methodology or question wording. (Read Appendix A for more details.)

Bar chart showing 33% of Americans often or always say grace or pray before meals

Among the key findings on religious practices:

  • 33% of U.S. adults often or always say grace before meals.
  • 29% read scripture at least monthly.53
  • 28% read other holy texts, devotions or inspirational literature (aside from scripture) at least monthly.
  • 19% participate in prayer groups, scripture-study groups or religious educational programs at least monthly.
  • 18% share their views about religion with people from other religious backgrounds at least monthly.

Read more about how Americans in different religious groups answer the survey’s questions about:

  • Personal prayer
  • Reading scripture, other holy texts and inspirational literature
  • Grace before meals
  • Participation in prayer or scripture-study groups
  • Sharing religious views with others

For details on religious service attendance and congregation involvement, read Chapter 8.

Personal prayer

More than four-in-ten Americans (44%) report that they pray at least once a day, and an additional 23% say they pray weekly or a few times a month. Nearly one-third of U.S. adults seldom or never pray.

Table showing Latter-day Saints are among the most likely to pray daily

Most members of the Church of Jesus Christ of Latter-day Saints, widely known as Mormons, (73%); evangelical Protestants and people who identify with the historically Black Protestant tradition (72% each); and Muslim Americans (67%) pray daily.

The share of Americans who pray daily has dropped 14 points since 2007. This decline has been fairly widespread: Catholics, all three major Protestant traditions and religiously unaffiliated adults all have shown statistically significant declines in daily prayer of between 6 and 10 points since 2007.

Table showing daily prayer has declined in the U.S. since 2007

Overall, Black Americans are more likely to report praying daily (64%) than Hispanic (47%), White (40%) and Asian (34%) Americans.

Also, women are more likely than men to pray daily (50% vs. 37%), and older Americans are more likely than younger ones to say they pray once or more per day.

The survey did not include enough interviews with Orthodox Christians, Muslims, Buddhists, Hindus or people in other small religious groups to be able to subdivide them by sex, age, education and race.

Table showing women, Black Americans, older Americans and those with lower levels of educational attainment are more likely than others to pray daily

Reading scripture, other holy texts and inspirational literature

Upward of one-in-five Americans (22%) report that they read scripture outside of religious services at least once a week, while 7% say they do so once or twice a month, and 9% read scripture several times a year. Most U.S. adults (61%) seldom or never read scripture outside of religious services.

Latter-day Saints (59%) and people who belong to the evangelical Protestant (51%) and historically Black Protestant (46%) traditions are the religious groups whose members are most likely to read scripture outside of religious services at least once a week.

Table showing most Latter-day Saints read scripture outside of church at least weekly

One-in-five Americans say they read other holy texts, devotions or inspirational literature (besides scripture) at least weekly. An additional 8% say they do this monthly and another 11% do it yearly, while 60% say they seldom or never read other holy texts.

Latter-day Saints (48%) and people who identify with historically Black (41%) and evangelical (39%) Protestant churches are the most likely to say they read other holy texts at least once a week.

Religiously unaffiliated Americans are much less likely than those who identify with a religion to read other holy texts, devotions or inspirational literature on a weekly basis (4% vs. 27%).

Table showing 20% of Americans read holy texts aside from scripture at least weekly

Putting these two questions together, we see that about a third of U.S. adults (35%) read either scripture or other holy texts, devotions or inspirational literature at least once a month.

Table showing 35% of U.S. adults read either scripture or other holy texts at least monthly

Grace before meals

One-third of Americans always or often say grace or pray before meals, and an additional 18% do this sometimes, according to the 2023-24 RLS. Nearly half of Americans (48%) seldom or never say grace or offer prayers before meals.

Table showing most Latter-day Saints and members of historically Black Protestant churches say grace before meals

About two-thirds of Latter-day Saints (68%) and people who belong to churches in the historically Black Protestant tradition (67%) always or often say grace or pray before meals. Large shares of evangelicals (58%) and Muslims (54%) also do this regularly.

People in other religious groups are far less likely to report that they pray or say grace before they eat.

Participation in prayer or scripture-study groups

Overall, 13% of Americans say they participate at least once a week in prayer groups, Bible-study or other scripture-study groups, or religious education programs. An additional 6% report that they participate in such groups once or twice a month, and 7% participate several times a year. Nearly three-quarters of U.S. adults seldom or never participate in these groups.

Table showing 13% of Americans participate in prayer groups, scripture-study groups or religious education programs on a weekly basis

Weekly participation in prayer and scripture-study groups appears to have declined since the previous religious landscape survey conducted in 2014, when 24% of adults surveyed said they took part in such groups each week. But methodological changes may account for some of the difference.54

In the 2023-24 RLS, Latter-day Saints are the most likely to participate in prayer or scripture-study groups on a weekly basis (45%). Among evangelical Protestants, 30% participate in such groups this often, as do 28% of members of historically Black Protestant churches and 25% of Muslims. Smaller shares of people affiliated with other religions say they participate weekly in such groups.

Sharing religious views with others

When it comes to sharing their views about religion with people from other religious backgrounds, 9% of U.S. adults say they do this at least once a week.55 An additional 9% share their views on religion once or twice a month, and 16% say they do this several times a year.

Table showing 9% of Americans discuss their religious views with people from other faith backgrounds at least weekly

About two-thirds of U.S. adults (65%) say they seldom or never share their religious views with people of other faiths or religious backgrounds.

11. Religious and spiritual beliefs

Belief in a spiritual realm beyond the physical world remains very common among U.S. adults, the 2023-24 Religious Landscape Study (RLS) finds.

Roughly eight-in-ten Americans believe “there is something spiritual beyond the natural world, even if we cannot see it.” Similar or slightly larger numbers say they believe that God or a universal spirit exists (83%), and that humans have a soul or spirit in addition to a physical body (86%).

Large majorities of Christians and Muslims hold each of these beliefs, as do more than half of all Buddhists, Hindus, Jews and religiously unaffiliated adults.

Belief in heaven and belief in hell are less widespread, but still held by most Americans, including most Christians and Muslims.

In addition, Americans across religious categories – including most religiously unaffiliated adults – say they have spent at least some time in recent years thinking about God and religion.

Bar chart showing most U.S. adults believe in God or a universal spirit, the existence of a human soul, and that there is something spiritual beyond the natural world

Over the years, Americans overall have become slightly less likely to believe in heaven or hell, or to believe in God or a universal spirit with absolute certainty. This partly reflects the fact that religiously unaffiliated adults – those who identify as atheist, agnostic or “nothing in particular” – make up a growing share of the population, and they are less likely than other groups to hold these types of beliefs.

The survey also asked about human evolution. Most U.S. adults believe that humans have evolved over time, including 33% who say that God had no role in human evolution, and 47% who say that humans have evolved due to processes that were guided or allowed by God or a higher power. A smaller share of the public (17%) believes humans have existed in their present form since the beginning of time.

Read on for specific religious groups’ beliefs about:

  • Something spiritual beyond the natural world
  • Human souls
  • Belief in heaven
  • Belief in hell
  • Belief in God
  • Human evolution
  • Thinking about God and religion

Something spiritual beyond the natural world

A large majority of Americans (79%) believe there is something spiritual beyond the natural world, even if we can’t see it. Far fewer (19%) say they believe the natural world is all there is.

Bar chart showing most religiously unaffiliated Americans believe there is something spiritual beyond the natural world

Nine-in-ten Christians say they believe in something beyond the natural world, including 93% of members of the Church of Jesus Christ of Latter-day Saints (widely known as Mormons), 92% of Protestants, 86% of Catholics and 77% of Orthodox Christians.

Of the non-Christian religious groups we analyzed, Muslims are the most likely to believe there is something spiritual beyond the natural world: 80% say this, compared with smaller majorities of Buddhists (70%), Hindus (69%) and Jews (60%).

Among Americans who are religiously unaffiliated, there is a wide range of views. The vast majority of self-described atheists (80%) say the natural world is all there is, though 19% say there is something spiritual beyond the natural world. Two-thirds of Americans who describe their religious identity as “nothing in particular” and 55% of agnostics believe in something beyond the natural world.

Human souls

The vast majority of Americans (86%) believe that humans have a soul or spirit in addition to their physical bodies. This view is held by nearly all Christians (95%) along with 90% of Buddhists and 88% of Muslims. Large majorities of Hindus (84%), people who say their religion is “nothing in particular” (79%), Jews (74%) and agnostics (67%) also believe that humans have a soul.

Again, atheists stand out from other religiously unaffiliated adults: Just one-third of atheists say they believe that humans have a soul.

Bar chart showing the vast majority of U.S. adults believe people have souls

Belief in heaven

Most Americans say they think there is a heaven “where people who have led good lives are eternally rewarded.”

Table showing belief in heaven is stable among religiously affiliated Americans

Among Americans who are affiliated with a religion, the share who believe in heaven has been stable since 2007.56

However, the share of all U.S. adults who believe in heaven has declined. This is driven partly by the growing segment of Americans who describe themselves as atheist or agnostic, or who say their religion is “nothing in particular.” These religious “nones” have become less likely to believe in heaven since 2007, even as their ranks have grown.

Belief in heaven, as defined in the survey, is most common among Christians (85%) and Muslims (83%). It is less common among Buddhists (52%), Hindus (48%) and Jews (39%).

Nearly half of adults who describe themselves as having no particular religion say they think there is a heaven where people who have led good lives are eternally rewarded, as do 17% of agnostics and a relatively small share of atheists (5%).

Belief in hell

The survey also asked about the existence of a hell “where people who have led bad lives, and die without being sorry, are eternally punished.”

Table showing belief in hell is up among U.S. Catholics

Belief in hell is somewhat less common than belief in heaven (55% vs. 67%). But the share of religiously affiliated Americans who believe in hell has ticked up slightly over the years.

Belief in hell is most common among evangelical Protestants (82%), members of historically Black Protestant traditions (81%) and Muslims (77%). Somewhat smaller shares of Catholics (69%), Orthodox Christians (60%), mainline Protestants (59%) and Latter-day Saints (54%) say they believe in hell.

In contrast, 43% of Buddhists and 42% of Hindus surveyed say they believe in hell as defined in the survey, as do 25% of religiously unaffiliated adults and 22% of Jews.

Belief in God

Most Americans believe in God or a universal spirit, and slightly more than half of all U.S. adults say they are absolutely certain in this belief.

Table showing most Americans believe in God

As in our past surveys, the vast majority of Christians (97%) and Muslims (93%) say they believe in God, and most people in these religious groups express this belief with absolute certainty.

Belief in God is less universal, but still fairly common, among Hindus (85%), Buddhists (74%) and Jews (72%).

Even among religiously unaffiliated Americans, more than half say they believe in God or a universal spirit. This view is partly driven by the 69% of adults who say their religion is “nothing in particular.” In comparison, 43% of agnostics and 7% of atheists hold this view.

Belief in God over time

The share of U.S. adults who believe in God or a universal spirit has declined over time, and the share who hold this belief with absolute certainty has declined even more.57

Table showing Americans overall are becoming less certain that God exists

Today, 83% of U.S. adults believe in God (9 percentage points less than in 2007). And 54% of U.S. adults believe in God with absolute certainty (17 points less than in 2007).

Since 2007, most religiously affiliated groups have seen a decline in the share who are certain that God exists. For example, the share of Christians who say they are absolutely certain that God exists has ticked down from 80% in 2007, to 76% in 2014, to 73% in 2023-24.

Don’t believe in God

Relatively few U.S. adults are absolutely certain that God does not exist.

Atheists stand out as an exception. Not only do the vast majority of atheists reject belief in God or a universal spirit, but at least half also say they are absolutely certain in this belief.

The new survey’s estimate of the share of Americans who don’t believe in God or a universal spirit cannot be directly compared with results from our previous religious landscape studies. That’s because the new survey was conducted mainly online and on paper, whereas both the 2007 RLS and the 2014 RLS were conducted by telephone.

Table showing half of U.S. atheists say they are absolutely certain there is no God

We conducted a telephone “bridge study” (for testing purposes only) to gauge the impact of this mode switch. Compared with respondents in the telephone bridge study, respondents in the main survey (conducted mainly online or on paper) were more likely to say they don’t believe in God. So the estimate of the share of people who don’t believe in God or a universal spirit in the new survey cannot be directly compared with the previous results. (Refer to Appendix A for additional details.)

However, both the 2023-24 RLS and the companion bridge study suggest that nonbelief has risen since 2007. The upshot is that we can be confident that the share of Americans who do not believe in God is higher than it was in 2007, but we cannot say by exactly how much.

(These “mode differences” are smaller in the “Yes, believe in God or a universal spirit” category. Additional details are provided in Appendix A.)

Human evolution

When asked about evolution, U.S. adults most commonly say that humans have evolved over time due to processes that were guided or allowed by God or a higher power.58

Table showing most U.S. Muslims and Christians say that human evolution was guided by God

The view that evolution has been guided or allowed by God is held by 47% of U.S. adults, including most Muslims (63%) and Christians (61%).

On the other hand, one-third of adults believe that humans have evolved over time due to processes such as natural selection and that God or a higher power had no role in this process.

This view is held by most Jews (64%), Buddhists (58%) and religiously unaffiliated adults (66%), as well as by roughly half of all Hindus.

Very few evangelical Protestants (6%) or members of historically Black Protestant churches (12%) believe humans evolved without involvement from God.

Some Americans believe that humans have not evolved – that they have existed in their present form since the beginning of time. This view is held by 17% of U.S. adults, including 10% or more of all the groups in this analysis except for atheists and agnostics. Notably, about a quarter of evangelical Protestants (26%) and Orthodox Christians (23%) say humans have existed in their present form since the beginning of time.

Thinking about God and religion

Nearly two-thirds of Americans say they have thought about God and religion a great deal or quite a bit in recent years.

Table showing most U.S. adults think about religion

This includes the vast majority of evangelical Protestants (90%) and members of the historically Black Protestant tradition (90%), as well as 86% of Latter-day Saints.

Smaller shares of people in other U.S. religious groups also say they’ve thought about God and religion quite a bit or a great deal. This includes 68% of mainline Protestants, 70% of Catholics and 74% of Muslims.

Among religious groups in this analysis, around half or fewer of Hindus, Jews and Buddhists say they have thought about God and religion either a great deal or quite a bit.

Religiously unaffiliated adults are among the least likely to say they think about God and religion, but 56% say they have thought at least some about these topics. Atheists are the only group in which most adults say they have given little or no thought to God and religion in recent years.

12. Spiritual experiences

How often do Americans think about spiritual matters or feel moved in spiritual ways? Large majorities of U.S. adults say they experience various kinds of spiritual thoughts and feelings at least several times a year, according to the new Religious Landscape Study (RLS).

For example, 93% of U.S. adults say that they feel a sense of awe at the beauty of nature several times a year or more often. This includes 61% who say they experience this feeling at least once a week.

Bar chart showing more than 6 in 10 Americans say they feel awe, gratitude at least weekly

Nearly as many (91%) say they feel a strong sense of gratitude or thankfulness at least several times a year, including 62% who report feeling deeply grateful on a weekly basis or more often. Large shares of Americans also say they think about the meaning and purpose of life at least several times a year (84%) and feel a deep sense of wonder about the universe (80%) that often.

Smaller majorities of U.S. adults say they feel a deep sense of spiritual peace and well-being (74%), a deep sense of connection with humanity (72%), or the presence of something from beyond this world (61%) several times a year or more often.59

Jump to sections in this chapter on the survey’s questions about:

  • Feeling a sense of awe at the beauty of nature
  • Feeling a strong sense of gratitude or thankfulness
  • Thinking about the meaning and purpose of life
  • Feeling wonder about the universe
  • Feeling spiritual peace and well-being
  • Feeling a connection with humanity
  • Feeling the presence of something from beyond this world

Feeling a sense of awe at the beauty of nature

Upward of six-in-ten Americans (61%) say they feel a sense of awe at the beauty of nature at least once a week. An additional 32% report that they feel awed by nature once or twice a month or several times a year. Relatively few (6%) say they seldom or never feel a sense of awe at the beauty of nature.

Members of the Church of Jesus Christ of Latter-day Saints (widely known as Mormons) and evangelical Protestants are especially likely to say they feel awe at the beauty of nature weekly or more often (74% and 72%, respectively).

Table showing most Americans feel a sense of awe at the beauty of nature at least weekly

Feeling a strong sense of gratitude or thankfulness

Most Americans (62%) feel a strong sense of gratitude or thankfulness weekly or more often, and an additional 29% feel this way once or twice a month or several times a year. Relatively few Americans (8%) seldom or never feel a strong sense of gratitude.

Among Christian groups large enough to analyze in the survey, the shares saying they feel a strong sense of gratitude or thankfulness at least weekly range from 59% of Orthodox Christians to 78% each among evangelical Protestants and Latter-day Saints. Most Muslim Americans (61%) also say they feel a strong sense of gratitude or thankfulness that often.

Roughly half of Jewish Americans (52%), Buddhists (47%) and Hindus (47%) say they experience a strong sense of gratitude or thankfulness on a weekly basis, along with 46% of religiously unaffiliated adults.

Table showing 62% of Americans feel a strong sense of gratitude or thankfulness at least weekly

Thinking about the meaning and purpose of life

Overall, 46% of Americans say they think about the meaning and purpose of life at least once a week, and 38% say they think about this on a monthly or yearly basis. Another 15% of U.S. adults say they seldom or never think about the meaning of life.

Majorities of Latter-day Saints (65%), people who belong to historically Black Protestant churches (64%) and evangelical Protestants (58%) say they think about the meaning and purpose of life at least weekly. 

Table showing 46% of Americans say they think about the meaning and purpose of life at least weekly

Feeling wonder about the universe

Upward of four-in-ten Americans (41%) say they feel a deep sense of wonder about the universe weekly or more often. An additional 39% say they experience this once or twice a month or several times a year, and 19% seldom or never feel a deep sense of wonder about the universe.

Overall, 42% of adults who identify with a religion and 39% of religiously unaffiliated people say they feel a deep sense of wonder about the universe at least weekly.

Table showing41% of Americans say they feel a deep sense of wonder about the universe at least once a week

Feeling spiritual peace and well-being

Four-in-ten Americans feel a deep sense of spiritual peace and well-being at least once a week, while an additional 34% say they feel this kind of peace on a monthly or yearly basis. Meanwhile, 25% say they seldom or never feel a deep sense of spiritual peace.

Table showing 40% of Americans feel a deep sense of spiritual peace on a weekly basis

Among Christians, 49% report feeling a deep sense of spiritual peace on a weekly basis, including most Latter-day Saints (64%) and members of evangelical (60%) and historically Black Protestant (59%) churches.

People who identify with religions other than Christianity are somewhat less likely than Christians to report feeling a deep sense of spiritual peace on a weekly basis (38% vs. 49%).

About one-in-five religiously unaffiliated adults feel a deep sense of spiritual peace at least weekly, including 24% of those who say their religion is “nothing in particular,” 16% of agnostics and 15% of atheists.

Feeling a connection with humanity

Upward of one-third of Americans (34%) say they feel a deep sense of connection with humanity at least once a week. An additional 37% feel this way once or twice a month or several times a year, and 26% seldom or never feel a deep sense of connection with humanity.

Nearly half of U.S. Muslims (48%), members of the historically Black Protestant tradition (47%) and Latter-day Saints (46%) feel a deep sense of connection with humanity at least weekly.

Table showing 34% of Americans feel a deep sense of connection with humanity at least weekly

Feeling the presence of something from beyond this world

One-third of U.S. adults say they feel the presence of something from beyond this world at least once a week, and 28% report having such an experience on a monthly or yearly basis. An additional 38% seldom or never feel the presence of something from beyond this world.

Table showing 33% of Americans feel the presence of something from beyond this world at least once a week

Latter-day Saints (56%) and evangelical Protestants (52%) are especially likely to feel the presence of something from beyond this world on a weekly basis.

Religiously unaffiliated adults, on the other hand, are far less likely to say they have such an experience weekly or more often. Most atheists (84%) and agnostics (66%) say they seldom or never feel the presence of something from the beyond.

13. Spiritual activities

How often do Americans engage in spiritual activities? The Religious Landscape Study (RLS) asked U.S. adults about six activities they might do for spiritual purposes. Here are some key findings:

  • 48% say they listen to music for spiritual reasons weekly or more often.
  • 40% find time to look inward or center themselves weekly or more often.
  • 30% exercise for spiritual reasons weekly or more often.
  • 23% meditate weekly or more often.
  • 15% visit a nature spot such as a waterfall, mountaintop or river for spiritual reasons weekly or more often.
  • 7% practice yoga for spiritual reasons weekly or more often.

Overall, 63% of Americans report that they engage in at least one of these six activities, for spiritual reasons, at least once a week.

Bar chart showing 63% of U.S. adults say that they do at least 1 thing weekly for spiritual reasons

Americans who identify with a religion are more likely than religiously unaffiliated adults (those who identify religiously as atheist, agnostic or “nothing in particular”) to say they participate on a weekly basis in at least one of these spiritual activities (71% vs. 45%).60

The survey also finds that 3% of U.S. adults say they go on a spiritual retreat more than once a year. An additional 11% say they do this about once a year or every few years.

Read more about Americans’ self-reported participation in the following spiritual activities:

  • Listening to music
  • Looking inward or centering yourself
  • Exercise
  • Meditation
  • Visiting a nature spot
  • Practicing yoga
  • Spiritual retreats

Listening to music

Nearly half of U.S. adults (48%) say they listen to music for spiritual reasons at least weekly.

Table showing 55% of Christians listen to music at least weekly for spiritual reasons

An additional 6% do this monthly, while 12% do this less often. And 33% say they never listen to music for spiritual purposes.

These rates vary widely across religious groups. Roughly seven-in-ten members of historically Black Protestant churches (72%) say they listen to music for spiritual reasons on a weekly basis, as do 65% each among evangelical Protestants and members of the Church of Jesus Christ of Latter-day Saints (widely known as Mormons).

Jewish Americans and religiously unaffiliated adults are much less likely to say they listen to music for spiritual reasons.

Looking inward or centering yourself

Four-in-ten Americans say they find time to look inward or center themselves for spiritual reasons at least once a week. About three-in-ten say they do this for spiritual reasons monthly (11%) or less often (20%), while 28% say they never do this for spiritual reasons.

Table showing most Latter-day Saints find a moment to look inward for spiritual reasons at least weekly

About six-in-ten Latter-day Saints (61%) report that they look inward or center themselves for spiritual reasons at least once a week, as do 55% of members of historically Black Protestant churches.

By comparison, religiously unaffiliated adults – particularly atheists – are less likely to do this. Indeed, two-thirds of atheists (68%) say they never center themselves for spiritual reasons.

Exercise

Three-in-ten Americans say they exercise for spiritual reasons at least weekly, while an additional 6% say they do so monthly, and 16% do so less often.

Adults who identify with a religion are far more likely than religiously unaffiliated Americans to say they exercise weekly for spiritual purposes (34% vs. 21%).

Table showing 30% of Americans say they exercise at least weekly for spiritual reasons

Meditation

Overall, 23% of U.S. adults say they meditate for spiritual reasons at least once a week, and an additional 7% report doing so monthly. Upward of one-fifth of Americans (21%) meditate for spiritual purposes less often than that, while 48% say they never meditate for spiritual reasons.

Table showing 23% of U.S. adults say they meditate at least weekly for spiritual reasons

Roughly three-in-ten or more members of historically Black Protestant churches (39%), Buddhists (38%), Hindus (36%), Latter-day Saints (34%) and Muslim Americans (32%) say they meditate weekly or more often.

Jewish Americans and religiously unaffiliated adults are among the least likely to say they meditate for spiritual reasons.

Visiting a nature spot

Three-in-ten Americans say they spend time in nature (for example, by visiting a waterfall, mountaintop or river) for spiritual reasons at least once a month, including 15% who say they do so weekly.

An additional 29% of U.S. adults say they experience nature this way, but less often. And 39% say they never visit nature spots for spiritual reasons.

Table showing 3 in 10 Americans say they visit a nature spot for spiritual reasons at least monthly

Practicing yoga

One-in-ten Americans say they practice yoga weekly (7%) or monthly (3%) for spiritual reasons.61

Hindu Americans are especially likely to engage in yoga for spiritual reasons: 32% say they do this once a week or more often. An additional 11% of Hindu Americans say they do this monthly, while 25% do so less often and 30% say they never do this.

Table showing 1 in 10 Americans say they practice yoga at least monthly for spiritual reasons

Spiritual retreats

Overall, 3% of Americans say they go on spiritual retreats more than once a year. An additional 11% say they do this annually or every few years, and 13% do this less often. More than seven-in-ten (72%) never go on spiritual retreats.

Table showing 72% of Americans never go on spiritual retreats

Hindus and Latter-day Saints are among the religious groups that are most likely to participate in a spiritual retreat.

14. Spiritual and religious self-descriptions

Americans are more likely to say they are spiritual than to say they are religious. Nearly three-quarters of Americans say they are either very spiritual or somewhat spiritual, while 58% say they are very or somewhat religious.

Bar chart showing 74% of U.S. adults identify as spiritual

Combining these measures, upward of half of U.S. adults (53%) say they are both spiritual and religious, while 21% say they are spiritual but not religious. Just 5% say they are religious but not spiritual, and 21% say they are neither spiritual nor religious.62

Jump to details on how Americans answer questions in the 2023-24 Religious Landscape Study (RLS) about:

  • Being a spiritual person
  • Being a religious person
  • Being spiritual but not religious

Being a spiritual person

Nearly three-quarters of U.S. adults consider themselves at least somewhat spiritual, including 32% who describe themselves as very spiritual and 42% who say they are somewhat spiritual. A quarter of Americans say they are not too, or not at all, spiritual.63

Table showing about 9 in 10 or more Latter-day Saints, evangelicals and people in the historically Black Protestant tradition say they are very or somewhat spiritual

The vast majority of Christians (85%) say they are at least somewhat spiritual, as do 77% of people who identify with non-Christian religions. Jewish Americans (60%) are the least likely of the religiously affiliated groups large enough to analyze to describe themselves this way.

Half of all religiously unaffiliated adults say they are at least somewhat spiritual people – though atheists (24%) are notably less likely to say this than are agnostics (47%) and people who describe their religion as “nothing in particular” (58%).

Being a religious person

Nearly six-in-ten Americans say they are at least somewhat religious, including 19% who describe themselves as very religious and 38% who say they are somewhat religious. Upward of four-in-ten Americans (42%) say they are not too, or not at all, religious.64

About half of members of the Church of Jesus Christ of Latter-day Saints (widely known as Mormons) say they are very religious, as do roughly a third or more of Muslims, evangelical Protestants and people who identify with the historically Black Protestant tradition.

Table showing 58% of Americans say they are a somewhat or very religious person

Being spiritual but not religious

Combining these two questions, we see that a little more than half of Americans – 53% – say they are both spiritual and religious (i.e., at least somewhat spiritual and at least somewhat religious).

Table showing 21% of Americans are spiritual but not religious

Smaller shares say they are spiritual but not religious (21%); religious but not spiritual (5%); and neither spiritual nor religious (21%).65

Among religiously unaffiliated adults – often called religious “nones” – 37% say they are spiritual but not religious, while 48% say they are neither spiritual nor religious.

Seven-in-ten religiously affiliated Americans say they are both spiritual and religious. Latter-day Saints (88%) and members of historically Black Protestant (80%) and evangelical Protestant (79%) churches are more likely than members of other religious groups large enough to be analyzed to say they are spiritual as well as religious.

15. Religion, partisanship and ideology

The religious profiles of U.S. adults – how religious they are and what religion they identify with – are closely aligned with their partisan political identities, according to the new Religious Landscape Study (RLS).

Bar chart showing large U.S. partisan divides by level of religiousness

Generally speaking, Americans who are highly religious are the most solidly Republican constituency. U.S. adults with lower levels of religious engagement more commonly identify with or lean toward the Democratic Party.66

However, Black Americans are a notable exception: At all levels of religiousness, most identify as Democrats or lean toward the Democratic Party.

White Americans are far more divided than other racial groups by level of religiousness.

Among highly religious White Americans, a solid majority identify with the Republican Party or lean Republican (77%). Among White Americans with low levels of religious engagement, a sizable majority identify with or lean toward the Democratic Party (68%).

Bar chart showing that for White U.S. adults, partisanship is closely tied to level of religiousness

Hispanic Americans, Asian Americans and Americans of other races and ethnicities also are somewhat politically divided by their levels of religiousness, but the gaps are not as wide as among White Americans. 

For example, 48% of highly religious Hispanic Americans identify as Republican or Republican-leaning and 40% identify as Democratic or Democratic-leaning. (The rest say they do not lean toward either party.) Among Hispanic Americans with low levels of religious engagement, a clear 68% majority lean toward the Democratic Party.

Bar chart showing highly religious Hispanic Americans are about equally likely to favor Republicans, Democrats

Black Americans largely support the Democratic Party regardless of their level of religiousness, with about three-quarters in both the high and low religiousness categories siding with the Democratic Party.

Bar chart showing Black U.S adults tend to prefer the Democratic Party, regardless of how religious they are

(Results about partisanship and ideology from this new survey cannot be compared with the previous 2007 and 2014 Religious Landscape Studies due to differences in the way the surveys were conducted.67)

Read on to learn about the political and ideological views of specific religious groups.

Political orientation and political ideology by religious affiliation

The U.S. public is very evenly divided politically: In the 2023-24 RLS, 46% of Americans identify with or lean toward the Republican Party, and 46% identify with or lean toward the Democratic Party.

Table showing U.S. evangelicals and Latter-day Saints mostly favor the Republican Party

The remaining 8% of U.S. adults consider themselves independents or “something else,” or did not answer the question and don’t lean toward either party.

(Read our recent analysis of trends in party identification over time.)

Some religious groups strongly favor one party over the other:

  • Evangelical Protestants and members of the Church of Jesus Christ of Latter-day Saints (widely known as Mormons) largely identify with or lean toward the Republican Party (70% and 73%, respectively).
  • Historically Black Protestant church members (72%), Jewish Americans (66%) and Hindus (62%) mostly identify with or lean toward the Democratic Party, as do atheists (82%) and agnostics (76%).

Mainline Protestants favor the GOP (51%) over the Democratic Party (41%). Among Catholics, 49% are Republicans and GOP leaners while 44% are Democrats or Democratic leaners.

Within some religious groups, there are large differences by race:

  • Hispanic Catholics tend to favor the Democratic Party (54%), while White, non-Hispanic Catholics favor the GOP (60%).
  • Among evangelical Protestants, the Republican preference is much more pronounced among White evangelicals (80%) than among Hispanic evangelicals (58%).

On a separate question asking respondents to describe their political views, 33% of U.S. adults identify as conservative or very conservative and 24% identify as liberal or very liberal. An additional 38% identify as moderate, and 4% say they don’t know or give no answer.

Table showing majorities of U.S. atheists and agnostics identify as ideologically liberal

Religious groups’ responses about political ideology generally track partisan patterns, though most religious groups also have substantial shares that describe themselves as politically moderate.

The only groups in which about half or more adults identify as ideologically conservative are evangelical Protestants (59%) and Latter-day Saints (56%).

And the only groups with a majority who identify as ideologically liberal are atheists (67%) and agnostics (57%).

About half of members of the historically Black Protestant tradition, Orthodox Christians, Muslims, Buddhists and Americans who identify religiously as “nothing in particular” say they are moderate or give no answer.

16. Religion and views on LGBTQ issues and abortion

In the 2023-24 Religious Landscape Study (RLS), 59% of adults who identify with a religion say that homosexuality should be accepted by society, up a bit from 55% in 2014 and from 46% in 2007. 68

This view is more widespread among Americans who are religiously unaffiliated (that is, those who identify as atheist, agnostic or “nothing in particular” when asked about their religion) than among those who identify with a religion. In the 2023-24 survey, 87% of religiously unaffiliated respondents say homosexuality should be accepted by society, compared with 83% in 2014 and 71% in 2007.

Line chart showing 57% of U.S. Christians say homosexuality should be accepted by society; 55% say same-sex marriage should be legal

In the new RLS, 55% of Christians say they favor allowing same-sex couples to marry legally, up from 44% in 2014. Support for legal same-sex marriage is generally higher among Hindus (88%), Buddhists (87%), Jews (82%) and religiously unaffiliated Americans (88%) than it is among Christians.

When it comes to acceptance of people who are transgender (that is, those who identify as a gender that is different from the sex they were assigned at birth), Americans who identify with a religion are more likely to say that greater social acceptance of transgender people has been a “change for the worse” (45%) than a “change for the better” (32%). By contrast, religiously unaffiliated Americans are much more likely to describe this as a change for the better (58%) than as a change for the worse (22%).

Bar chart showing 45% of Americans who identify with a religion see increased acceptance of transgender people as a change for the worse

(Pew Research Center did not ask about acceptance of transgender people in either the 2014 or 2007 RLS.)

All three Religious Landscape Studies have asked about abortion. And all three studies have found that support for legal abortion is much higher among religiously unaffiliated Americans than among U.S. Christians. (More information about long-term trends in the public’s abortion views is available in the Center’s fact sheet “Public Opinion on Abortion.”)

Table showing 52% of U.S. Christians say abortion should be legal in most or all cases; 47% say it should be illegal

The rest of this chapter describes how people from different religious groups answer the survey’s questions about LGBTQ issues and abortion.

(In addition to religion, views on these topics also are linked with political partisanship, age and other factors. More details about how public opinion varies on LGBTQ issues and abortion are available on our website.)

Read more on how religious groups answer questions about:

  • Acceptance of homosexuality
  • Same-sex marriage
  • Acceptance of transgender people
  • Abortion’s legality

Acceptance of homosexuality

In all three Religious Landscape Studies, large majorities of religiously unaffiliated Americans have said homosexuality should be accepted by society. Most Jews and Buddhists also have consistently expressed this view, as have seven-in-ten or more Hindus in both 2014 and in the new survey.

Table showing 57% of U.S. Christians say homosexuality should be accepted by society

A smaller majority of Christians say homosexuality should be accepted by society. Most Catholics, mainline Protestants and members of historically Black Protestant churches say homosexuality should be accepted, while most evangelical Protestants say homosexuality should be discouraged by society. Members of the Church of Jesus Christ of Latter-day Saints (widely known as Mormons) are divided on this question.

Still, Christians overall are more accepting of homosexuality today than they were when the first RLS was conducted in 2007. Some Christian groups exhibited increased acceptance between 2007 and 2014 and then a leveling off, while others continued to exhibit increased acceptance between the 2014 survey and the new study.

Same-sex marriage

Since the last RLS, nearly every Christian group large enough to be analyzed has become more likely to favor allowing same-sex couples to marry legally. None of the U.S. religious groups analyzed here have shown a decline in support for same-sex marriage.

Table showing support for same-sex marriage has increased across many religious groups

For example, 70% of Catholics favor same-sex marriage in the new survey, up from 57% in 2014. And 56% of adults in the historically Black Protestant tradition now favor it, up from 40% in 2014.

At the same time, the survey shows that most evangelical Protestants (62%) continue to oppose same-sex marriage, as do 56% of Latter-day Saints.

Acceptance of transgender people

Religiously unaffiliated Americans are a lot more likely than those who identify with a religion to say that increased acceptance of people who are transgender is a “change for the better” (58% vs. 32%).

Table showing 58% of religiously unaffiliated Americans say greater acceptance of people who are transgender is a change for the better

Majorities of Hindus (67%) and Jews (59%) in the U.S. also see transgender acceptance as a change for the better.

Taking the other position, 47% of U.S. Christians and 48% of Muslims say that increasing acceptance of transgender people is a “change for the worse.” Among Christians, this includes:

  • 64% of evangelical Protestants
  • 55% of Latter-day Saints
  • 50% of Orthodox Christians

Catholics, mainline Protestants and members of historically Black Protestant churches are more divided on this question. For example, 39% of mainline Protestants say greater social acceptance of people who are transgender is a change for the better, while 37% say it is a change for the worse.

Abortion’s legality

In the new survey, roughly two-thirds of Latter-day Saints (69%) and evangelical Protestants (65%) say abortion should be illegal in most or all cases. Majorities in most other groups, by contrast, say abortion should be legal in most or all cases.

Table showing most evangelicals and Latter-day Saints say abortion should be illegal in most or all cases; majorities in most other groups say it should be legal

17. Religion and views on gender, parenting and workforce participation

The more religious they are, the more likely Americans are to express traditional views about gender roles when asked about parenting and women’s participation in the paid labor force.

A majority of U.S. adults (55%) say it’s better for a child with two parents to have one stay at home to focus on the family, according to the 2023-24 Religious Landscape Study (RLS). This includes 33% who say, in a follow-up question, that it doesn’t matter which parent stays home, 22% who say it’s generally better if the stay-at-home parent is the mother, and less than 1% who say it’s better if the father stays at home.

An additional 43% say children in two-parent families are “just as well off when [both of] their parents work outside the home.”

Table showing about two-thirds of highly religious Americans think it’s better for 1 parent to stay home to focus on family

Among highly religious Americans (on a scale combining these four measures), 65% say it’s better when one parent stays home to focus on the family, including 34% who say it should be the mother and 31% who say it doesn’t matter which parent stays home. In contrast, 55% of Americans with relatively low levels of religious engagement say children are just as well off when both their parents work outside the home.69

Bar chart showing Americans hold positive opinions about women’s increased workforce participation

At the same time, a majority of highly religious Americans (64%) say that rising numbers of women in the workforce has been a change for the better. Even larger percentages of U.S. adults with lower levels of religious engagement hold this view.

Read more on how Americans in various religious groups answer questions about:

  • Parents and child care
  • Women in the paid labor force

Parents and child care

About one-third of U.S. Muslims (36%) and a quarter of U.S. Christian adults (27%) believe that children with two parents are better off when the mother stays home to focus on the family. One-fifth of U.S. Buddhists say this, as do 18% of Hindus and 14% of Jews.

Among Christians, the share who say children are best off when their mother stays home includes:

  • 41% of members of the Church of Jesus Christ of Latter-day Saints (widely known as Mormons)
  • 35% of evangelical Protestants
  • 26% of Orthodox Christians
  • 25% of Catholics

Roughly one-in-three Christians (32%) say children are better off when one parent stays home to focus on the family, but that it doesn’t matter which one. And 39% of Christians say children of two parents are just as well off when both parents work outside the home.

The view that children with two parents are better off when the father is the one to stay home to take care of the family is extremely rare across all religious groups.

Table showing 60% of Christians believe it is better for children if 1 parent stays home; 52% of people in other religious groups and 47% of religiously unaffiliated adults say this

Women in the paid labor force

Majorities of all religious groups say that more women in the workforce is a “change for the better.” Support for this view has ticked up slightly or stayed the same among most religious groups since the question was asked in the 2014 RLS.

Among Christians, 69% of respondents believe that women’s increased labor force participation is a “change for the better.” This share is highest among members of historically Black Protestant churches (77%), mainline Protestants (76%) and Catholics (75%). It is somewhat lower among Orthodox Christians (64%), Latter-day Saints (61%) and evangelical Protestants (60%).

Large majorities of adherents of non-Christian religions look favorably on the increased number of women in the workforce. For example, support for this position is expressed by 89% of Hindus, 81% of Jewish Americans, 76% of Buddhists and 66% of Muslims.

Among the religiously unaffiliated, nearly nine-in-ten atheists (86%) and agnostics (87%) see women’s increased participation in the labor force as a change for the better. About three-fourths of those who say their religion is “nothing in particular” (77%) say the same.

Table showing majorities across religious groups support women’s increased presence in the paid labor market


18. Religion and views on immigration and diversity

Most U.S. adults express positive views about America’s openness to people from around the world, the new Religious Landscape Study (RLS) finds.

This is true across the religious spectrum. Upward of half of members of all major U.S. religious groups – and majorities of people at all levels of religious engagement – say “openness to others from around the world is essential to who we are as a nation.”70

Bar chart showing 7 in 10 U.S. adults say America’s openness to people from around the world is essential to national identity

But the public is more divided over whether a growing population of immigrants has been a change for the better, a change for the worse, or hasn’t made much difference.

On this question, the most common view among highly religious Americans is that increased immigration has been a change for the worse. By contrast, the most common view among Americans with low levels of religious engagement is that increased immigration has been a change for the better.

Americans with low levels of religious engagement are more likely than highly religious people to view rising immigration as good

This chapter explores how Americans in different religious groups and with different levels of religious engagement answer survey questions about immigration, racial and ethnic diversity, and religious diversity. But readers should bear in mind that other factors – such as race and ethnicity, political party identification, education and age – also underlie public opinion on these questions.

For example, Republicans and those who lean toward the Republican Party are far less likely than Democrats and Democratic-leaning Americans to say the country’s openness to newcomers is essential to who we are. And Republicans are far more likely than Democrats to say that the growing population of immigrants has been a change for the worse.

Highly religious people are more likely than those who are not religious to be Republicans or lean toward the Republican Party, while people who are not religious are more likely to be Democrats and Democratic leaners than are highly religious people. (For more on the connection between religion and partisanship, refer to Pew Research Center’s “Changing Partisan Coalitions in a Politically Divided Nation.”)

The new survey also shows that the connection between religiousness and views on these topics varies across racial and ethnic groups.

Table showing among White U.S. adults, highly religious people are less positive about rising immigration than people with low levels of religious engagement

For example, among White Americans, highly religious people are 29 percentage points less likely than those with a low level of religious engagement to say that a growing population of immigrants has been a change for the better (19% vs. 48%). But among Hispanic Americans, the gap is only 9 points, and among Black Americans and Asian Americans, it is 7 points.

When asked about the country’s racial and ethnic diversity, majorities in all the religious categories analyzed in this report and at every level of religious engagement say the fact that the United States is made up of people of many different races and ethnicities strengthens American society.

Bar chart showing 71% of U.S. adults say the country’s racial and ethnic diversity strengthens American society

Here again, though, highly religious Americans are somewhat less likely than those with low levels of religious engagement to express a positive view of the country’s diversity.

In response to a separate question, 52% of Americans say the country’s religious diversity (including people who are not religious) strengthens society, while 18% say religious diversity weakens society, and 29% say it doesn’t make much difference.

Read on for more information about how U.S. religious groups answer questions about:

  • America’s openness to people from around the world
  • America’s growing immigrant population
  • Whether racial diversity strengthens or weakens society
  • Whether religious diversity strengthens or weakens society

Views on America’s openness to people from around the world

Most U.S. adults view America’s openness to people from all over the world as essential to who we are as a nation.

Table showing 9 in 10 atheists say openness to people from around the world is essential to U.S. identity

Likewise, upward of half of people in every religious group in this analysis view America’s openness as essential to the country’s national identity.

Atheists (89%) and agnostics (88%) are among the most likely of all groups to say that the country’s openness is essential.

Americans who identify with non-Christian religions are more likely than Christians to view America’s openness to people from all over the world as essential to the country’s identity (81% vs. 62%).

Evangelical Protestants are more divided compared with other religious groups. Just over half of evangelicals (54%) say “America’s openness is essential to our identity,” while just under half (45%) say that “we risk losing our identity as a nation if America is too open to people from all over the world.”

Views on America’s growing immigrant population

U.S. adults as a whole are split on whether a growing population of immigrants has been good for the country (35%), bad for the country (38%), or not made much difference (26%).71

Table showing 55% of U.S. evangelical Protestants say the growing immigrant population is a change for the worse

Christians (46%) are twice as likely as Americans of other religions (23%), and twice as likely as those with no religion (23%), to say that a growing population of immigrants has been a change for the worse.

More than half of evangelical Protestants (55%) take this position.

Members of the historically Black Protestant tradition are notably less likely than Christians as a whole to view immigration negatively (26% vs. 46%).

In the U.S., about half or more of Buddhists (50%), Jews (50%), Muslims (57%) and Hindus (73%) say that a growing population of immigrants is a change for the better. (Hindus, Muslims and Buddhists in the U.S. are largely composed of first-generation immigrants.)

A majority of atheists (62%) and agnostics (56%) also view the growing immigrant population as a change for the better.

Views on whether racial diversity strengthens or weakens society

Seven-in-ten U.S. adults – including majorities in all religious groups analyzed – say the country’s racial diversity strengthens American society.

Table showing majorities in all American religious groups view racial diversity as a strength to society

Atheists (89%) and agnostics (88%) are among the most likely to view racial diversity as a strength.

Eight-in-ten or more Hindus, Jews, Muslims and Buddhists also say the country’s racial and ethnic diversity strengthens American society.

Among Christian groups, the share saying the country’s racial diversity is a strength ranges from 61% among evangelical Protestants to 76% among members of the Church of Jesus Christ of Latter-day Saints (widely known as Mormons).

Views on whether religious diversity strengthens or weakens society

Overall, 52% of U.S. adults say the fact that the U.S. population is made up of people from many different religions, including people who are not religious, strengthens American society.72

Table showing 52% of U.S. adults say religious diversity strengthens American society

This view is especially common among atheists (75%) and agnostics (76%), as well as U.S. adults who identify as Jewish (73%) or Hindu (79%).

Latter-day Saints are more likely than other Christians to view religious diversity as strengthening society. Latter-day Saints are themselves a minority religious group in America, making up roughly 2% of the population.

Evangelical Protestants (38%) are notably more likely than other religious groups to say the country’s religious diversity weakens American society.

19. Religion and views on the environment

Most U.S. adults believe that God gave humans a duty to protect and care for the Earth (66%), and 57% believe that God gave humans the right to use the Earth for humanity’s benefit, according to the 2023-24 Religious Landscape Study (RLS).

Bar chart showing most Americans believe God gave humans a duty to protect the Earth

Highly religious Americans are the most likely to say that God gave humans a duty to protect and care for the Earth (94%) and that God gave people the right to use the Earth for humanity’s benefit (89%).

Few Americans with low levels of religious engagement believe that God gave humans a duty to protect the Earth or the right to use it for humanity’s benefit (largely because many people in these groups do not believe in God).73

The idea that “God gave humans a duty to protect and care for the Earth” is sometimes associated with the theological concept of “stewardship.” The notion that “God gave humans the right to use the Earth for humanity’s benefit” reflects more of a “dominionist” perspective.

Slightly more than half of Americans (54%) agree with both perspectives, saying that God has given humans a duty to care for the Earth and also a right to use it for humanity’s benefit. Just 3% say that humans have a right to use the Earth but do not have a duty to protect and care for it.

Bar chart showing 54% of U.S. adults say humans have both a God-given duty to protect Earth and a God-given right to use it

The survey also shows that Americans who are very religious are less likely than those with low and medium-low levels of religious commitment to view stricter environmental regulations as worth the cost, and to say that the Earth is getting warmer mostly because of human activity.

The differences between highly religious Americans and those who are not religious on these questions reflect big partisan differences between these groups. Indeed, prior research shows that the main driver of U.S. public opinion about the climate is political party, not religion.

Table showing highly religious Americans are less likely than people with low levels of religious engagement to say stricter environmental laws are worth the cost

Highly religious Americans tend to identify with or lean toward the Republican Party, and Republicans are less inclined than Democrats to support environmental regulations or to believe the Earth is warming because of human activity. People who are not religious tend to identify with or lean toward the Democratic Party, and Democrats are more inclined than Republicans to support environmental regulations, and to believe the Earth is warming because of human activity.

Read our previous study about religion and Americans’ attitudes on environmental issues.

Jump to sections on religious groups’ views about:

  • Whether humans have a God-given duty to protect/use the Earth
  • Whether stricter environmental regulations are worth the cost
  • Climate change

Views on whether humans have a God-given duty to protect/use the Earth

All respondents who said they believe in God and/or a universal spirit were asked several questions that were not offered to others.

Specifically, we asked them how closely each of these statements reflect their own views: “God gave humans a duty to protect and care for the Earth, including the plants and animals,” and “God gave humans the right to use the Earth, including the plants and animals, for humanity’s benefit.”

(This was not a choice between the two statements. Respondents were able to say they hold both views or to reject both views.)

Table showing 91% of evangelical Protestants say God gave humans a duty to protect and care for the Earth

Two-thirds of U.S. adults say the notion that God gave humans a duty to protect the Earth completely or mostly describes their views. Slightly fewer (57%) say the notion that God gave humans the right to use the Earth completely or mostly describes their views.

Majorities of all religiously affiliated groups say God gave humans a duty to protect and care for the Earth – with the exceptions of Jews and Buddhists (who are less likely than other affiliated groups to believe in God).

And across the religiously affiliated groups, the view that God gave humans a duty to protect the Earth is generally more common than the view that God gave humans a right to use the Earth.

When we combine these questions, we find:

  • Slightly more than half of Americans (54%) say humans have both a God-given duty to protect the Earth and a God-given right to use the Earth for humanity’s benefit.
  • 13% affirm a God-given duty to protect the Earth but no God-given right to use the Earth for humanity’s benefit.
  • Just 3% say humans have a God-given right to use the Earth without a duty to also protect it.
  • 13% say neither of these statements completely or mostly describes their views.
  • 17% of U.S. adults do not believe in God or a universal spirit (or didn’t answer the question about whether they believe in God); as a result, they were not asked the questions about whether God gave humans a right to use or a duty to protect the Earth.

Evangelical Protestants (81%); members of the Church of Jesus Christ of Latter-day Saints, who are widely known as Mormons (80%); and members of the historically Black Protestant tradition (78%) are among the mostly likely religious groups to affirm both a God-given duty to protect the Earth and a God-given right to use the Earth for humanity’s benefit.

Table showing few Americans say ‘God gave humans the right to use the Earth’ without also saying ‘God gave humans the duty to protect and care for the Earth’

Hindus (29%) and mainline Protestants (20%) are more likely than most other religious groups to say that humans have a God-given duty to protect and care for the Earth, without a God-given right to use the Earth.

Few Americans in any of the religious or nonreligious groups say that God gave humans a right to use the Earth for humanity’s benefit without also saying we have a duty to protect and care for the Earth.

Views on whether stricter environmental regulations are worth the cost

The 2023-24 RLS asked respondents to choose which of two statements comes closest to their view: “Stricter environmental laws and regulations cost too many jobs and hurt the economy,” or “Stricter environmental laws and regulations are worth the cost.”

Table showing that support for stricter environmental regulations is highest among atheists in the U.S.

Six-in-ten U.S. adults say stricter environmental regulations are worth the cost, while 38% say they cost too many jobs and hurt the economy.

The balance of opinion on this question is similar to what we found in the 2014 RLS, when 57% said environmental regulations are worth the cost and 38% said they cost too many jobs and hurt the economy. In 2007, 61% said environmental regulations are worth the cost and 30% said they cost too many jobs and hurt the economy.74

Atheists (87%) and agnostics (83%) are the most likely to support stricter environmental regulations. Evangelical Protestants (44%) and Latter-day Saints (46%) are among the least likely to say regulations are worth the cost. These differences correspond to broader political differences between these groups. Atheists and agnostics mostly identify with or lean toward the Democratic Party, and Democrats tend to support environment regulations. Evangelical Protestants and Latter-day Saints mostly identify with or lean toward the Republican Party, and Republicans are less supportive of environmental regulations.

Other religious groups lie somewhere between, but Americans who identify as Hindu, Jewish and Buddhist are more likely than Christians overall to say stricter environmental regulations are worth the cost.

Views on climate change

The survey also asked respondents to choose which of these three statements comes closest to their view: 1) “The Earth is getting warmer mostly because of human activity such as burning fossil fuels”; 2) “The Earth is getting warmer mostly because of natural patterns in the Earth’s environment”; or 3) “There is no solid evidence that the Earth is getting warmer.”

Table showing that in the U.S., majorities in all religious groups say the Earth is getting warmer

Overall, most respondents (70%) say the Earth is getting warmer, including 48% who say it is getting warmer mostly due to human activity and 22% who say it is getting warmer mostly due to natural patterns.

Atheists (83%), agnostics (78%) and Hindu Americans (81%) are the groups most likely to say the Earth is getting warmer mostly because of human activity.

In addition, Jews (65%), Buddhists (65%) and Muslims (60%) are more likely than Christians to say the Earth is getting warmer primarily due to human activity.

Among Christian subgroups, evangelical Protestants (28%) and Latter-day Saints (29%) stand out as being the least likely to believe the Earth is getting warmer mostly due to human activity.

Here again, these religious differences are in line with partisan gaps. The religious groups that are least likely to say they think the Earth is warming because of human activity are largely Republican and Republican-leaning groups. The religious groups that are most likely to say they think the Earth is warming because of human actions are largely Democratic and Democratic-leaning groups.

20. Religion and views on the role of government

U.S. adults with low levels of religious engagement are much more likely than highly religious Americans to say the government should provide more assistance to people in need (58% vs. 35%).

About one-third of highly religious Americans (36%) say the government should provide less assistance to people in need – twice the share of Americans with low levels of religious engagement who take the same position (18%).

Bar chart showing highly religious Americans are less likely to say the government should give more help to people in need

Underlying these differences are patterns in political partisanship. Chapter 15 of this report shows that highly religious White Americans tend to be a solidly Republican constituency, while White adults with lower levels of religious engagement more often favor the Democratic Party, and Black Americans at all levels of religious commitment tend to identify as Democrats.

Moreover, Republicans and those who lean toward the GOP are far more likely than Democrats and Democratic leaners to say the government should provide less assistance to people in need, while Democrats are far more inclined than Republicans to say the government should provide more help to people in need.

This chapter focuses on attitudes toward government among Americans with different religious affiliations and levels of religiousness.

Most Americans with low (65%), medium-low (57%) and medium-high (57%) levels of religious engagement say they would rather have a bigger government providing more services than a smaller government providing fewer services.75

Bar chart showing two-thirds of U.S. adults with low levels of religious engagement favor a bigger government that provides more services

But among highly religious Americans, 52% say they prefer a smaller government that provides fewer services, while 45% say they would prefer a bigger government that provides more services.

The scale of religiousness used for this analysis is based on how often respondents say they pray, how often they say they attend religious services, whether they believe in God and/or a universal spirit and how important they say religion is in their lives.76

Read on to see how different religious groups answer the survey’s questions about:

  • Government aid to people in need
  • Preferences for government size

Government aid to people in need

Most religiously unaffiliated Americans (60%) say the government should provide more assistance to people in need.

Table showing 72% of atheists say the government should provide more assistance to those in need

U.S. adults who are affiliated with non-Christian religions are more likely than Christians, as a whole, to say the government should provide more assistance to the needy (57% vs. 38%).

But Christian subgroups differ substantially on this question.

A clear majority of members of the historically Black Protestant tradition (69%) favor the government providing more assistance to people in need.

Among mainline Protestants and Catholics, greater numbers say the government should provide more assistance than say it should provide less assistance. About three-in-ten adults in each group say the government is providing about the right amount of assistance.

Among evangelical Protestants and members of the Church of Jesus Christ of Latter-day Saints (widely known as Mormons), greater numbers say the government should provide less assistance to those in need than say it should provide more assistance.

Preferences for government size

Members of the historically Black Protestant tradition (83%) are among the most likely of all U.S. religious groups to say they favor a bigger government providing more services.

Table showing U.S. Christians equally divided on the question of having a bigger or smaller government

Most Hindu (72%), Muslim (71%), Buddhist (68%), Jewish (63%) and religiously unaffiliated Americans (66%) also say they would rather have a bigger government providing more services.

On the other hand, majorities of Latter-day Saints (63%) and evangelical Protestants (60%) say they would rather have a smaller government providing fewer services.

A slim majority of Catholics (54%) favor a bigger government providing more services. Among Orthodox Christians, 52% say they would prefer a smaller government. And mainline Protestants are split right down the middle, with 48% expressing a preference for a bigger government and 48% saying they prefer a smaller government.

When this question was asked by telephone in our previous religious landscape surveys, conducted in 2007 and 2014, some participants volunteered the response “It depends,” which was not an option in the new study, conducted mostly online and on paper. This makes the new results difficult to compare with those of the earlier studies.77

Additionally, the broader finding that 55% of U.S. adults favor a bigger government providing more services, while 42% favor a smaller government providing fewer services, is somewhat different from what we have found on other recent surveys. Recent waves of our American Trends Panel find a roughly equal balance of opinion on the question of a bigger or smaller government.

The different results may be caused by asking the same question in differing contexts. In the 2023-24 Religious Landscape Study, the question about the size of government came immediately after the question about assistance to people in need, which may have influenced how some respondents thought about the size of government.

21. Religion and views of right and wrong

A majority of U.S. adults (55%) say that whether something is right or wrong often depends on the situation. Fewer than half say there are clear and absolute standards by which to decide whether something is right or wrong, according to the 2023-24 Religious Landscape Study (RLS).

In response to a separate question, the survey finds that 68% of Americans say it is possible to be moral and have good values without believing in God. Just 30% say it is necessary to believe in God in order to be moral and have good values.

Bar chart showing 3 in 10 Americans say it is necessary to believe in God to be moral

Half of highly religious Americans say that belief in God is necessary to be moral and have good values, and 61% say there are clear and absolute standards for right and wrong.78

The survey also asked Americans about various factors they may consider when making moral decisions.

Slightly more than half of Americans (53%) say religious teachings and beliefs are extremely important or very important when making decisions between right and wrong. But the percentage of U.S. adults who say this is considerably lower than the shares who view practical experience and common sense (93%), logic and reason (92%) and scientific information (75%) as extremely or very important for moral decision-making.

Bar chart showing just over half of U.S. adults view religious teachings and beliefs as important for moral decisions

The vast majority of U.S. adults at all levels of religiousness say that “practical experience and common sense” and “logic and reason” are extremely or very important for deciding between right and wrong.

Highly religious Americans are less likely than those with low levels of religious engagement to consider scientific information to be an important factor in moral decisions. Nevertheless, a clear majority of the highly religious (67%) view scientific information as important.

Not surprisingly, Americans who are highly religious are much more likely than those with low religious engagement to view religious principles as important for deciding between right and wrong. Overall, 94% of highly religious Americans say religious teachings and beliefs are extremely or very important to how they think about matters of right and wrong.79

Jump to sections about religious groups’ views on:

  • Whether moral standards are absolute
  • Whether belief in God is necessary to be moral
  • Factors that guide moral decision-making

Are moral rules absolute or do they depend on the situation?

Overall, 55% of U.S. adults say that whether something is right or wrong often depends on the situation (55%), while 44% say there are clear and absolute standards for right and wrong.

Table showing religiously affiliated Americans are almost evenly split on whether morality depends on the situation or if there are absolute standards

Majorities of Hindus (73%), Buddhists (70%), religiously unaffiliated Americans (69%) and Jewish Americans (66%) say whether something is right or wrong often depends on the situation.

Muslims (58%), members of the historically Black Protestant tradition (56%), mainline Protestants (54%) and Catholics (53%) also are more likely to say that right and wrong depends on the situation, rather than that there are clear and absolute standards.

Evangelical Protestants and members of the Church of Jesus Christ of Latter-day Saints (widely known as Mormons) are the only religious groups analyzed in which a majority of adults say there are clear and absolute standards for what is right and wrong.

Does belief in God matter for being moral and having good values?

More than two-thirds of Americans (68%) say it is possible to be moral and have good values without believing in God.

Table showing majority of adults in the historically Black Protestant tradition say believing in God is necessary to be moral

Americans of nearly all religious and nonreligious backgrounds lean toward the notion that belief in God is not necessary to be moral. But among members of the historically Black Protestant tradition, a majority (57%) say it is necessary to believe in God in order to be moral and have good values.

How much does religion matter for morality, relative to other factors?

When asked whether religious teachings and beliefs are important for deciding between right and wrong, just over half of Americans (53%) say religion is either extremely important or very important in such decisions. This is considerably lower than the shares who say that “practical experience and common sense,” “logic and reason” and “scientific information” are extremely or very important.

Table showing practical experience and common sense are top factors for deciding between right and wrong

Among every religious group analyzed, larger numbers say “practical experience and common sense” and “logic and reason” are important than say “religious beliefs and teachings” are important in these kinds of decisions.

In many religious groups, larger percentages also ascribe importance to “scientific information” than to religious beliefs in moral decision-making. The exceptions are evangelical Protestants, members of the historically Black Protestant tradition and Latter-day Saints. More people in those three groups consider religious principles than scientific information to be important in discerning right from wrong.

22. Religion’s role in public life

On balance, U.S. adults are more likely to view religion as helpful than as harmful: 44% say religion does more good than harm, while 19% say it does more harm than good. About one-third think it does equal amounts of good and harm.80

Bar chart showing 44% of Americans think religion does more good than harm

What, specifically, do Americans think are some of the helpful and harmful effects of organized religion? The survey asked respondents whether they agree or disagree with six statements – three positive and three negative – about churches and other religious organizations. Majorities agree with each of the six statements, but higher shares agree with the positive ones:

  • 80% agree that churches and other religious organizations bring people together and strengthen community bonds.
  • 78% agree that they play an important role in helping the poor and needy.
  • 64% agree that they protect and strengthen morality in society.

Smaller majorities agree with the negative statements:

  • 59% of Americans agree that churches and other religious organizations are too concerned with money and power.
  • 54% agree that they focus too much on rules.
  • 54% agree that they are too involved with politics.
Bar chart showing Americans say religious institutions play positive roles, but most also see negative qualities

When these questions are combined in a scale, the results indicate that Americans are more likely to voice positive opinions about religious institutions than to voice negative ones.81

Bar chart showing 51% of Americans express mostly positive opinions about religious institutions, 29% mostly negative

Overall, 51% of Americans express positive views of churches and other religious organizations, while 29% express negative views. The remainder hold mixed views.

We also asked these questions about religious institutions in the 2014 Religious Landscape Study. Compared with 2014, Americans now express less positive views of churches and other religious organizations.82 The share of U.S. adults who express a very or somewhat positive view of religious institutions has declined from 63% in 2014 to 51% today.

The new survey also included a series of questions about separation of church and state, asking whether the federal government should declare the United States a Christian nation, whether teachers should be allowed to lead prayers in public schools and whether municipalities should be allowed to display religious symbols on government property. We do not have clear historical trends on these questions, because we have asked them in different ways over the years, and the results depend greatly on the exact wording of the questions and response options.

Jump to findings on how religious groups answered questions about:

  • Whether religion does more good than harm
  • Positive and negative statements about religious institutions
  • Religion and public life

Views on whether religion does more good than harm in American society

A little more than half of Americans who identify with a religion (56%) see religion as doing more good than harm in society. Just 10% of religiously affiliated adults say it does more harm than good, and about a third say it does equal amounts of good and harm.

Table showing religiously unaffiliated adults are most likely to say religion does more harm than good in the U.S.

In contrast, just 16% of religiously unaffiliated adults (those who answer a question about their religion by saying they are atheist, agnostic or “nothing in particular”) take the position that religion does more good than harm. Most of the unaffiliated say that it does more harm than good (40%) or that it does equal amounts of good and harm (43%).

Among Christians, members of the Church of Jesus Christ of Latter-day Saints (widely known as Mormons) and evangelical Protestants are most strongly inclined to say religion does more good than harm (72% and 68%, respectively). Smaller shares of Catholics, mainline Protestants, people who identify with the historically Black Protestant tradition and Orthodox Christians take this view.

Hindus (33%), Jews (32%) and Buddhists (31%) are less likely than people in other religious groups to think that religion does more good than harm.

Positive and negative statements about religious institutions

Large majorities of the public say religious organizations help bring people together and strengthen community bonds (80%) and that religious institutions play an important role in helping the poor and needy (78%). Additionally, 64% of U.S. adults say religious organizations help protect and strengthen morality in society.

Even among religiously unaffiliated adults, 67% say religious organizations help bring people together and 61% say religious organizations play a key role in helping the poor.

At the same time, many people also think religious organizations have some negative attributes. Six-in-ten Americans – including 78% of religiously unaffiliated adults – say religious organizations are too focused on money and power. And slightly more than half of U.S. adults say religious organizations focus too much on rules and are too involved with politics.

Table showing most Americans agree that religious organizations do good things in society, but many also think religious organizations do some negative things

When we combine these questions into a scale, it shows that 51% of U.S. adults express a positive view of religion – i.e., they agree with more positive statements about religious organizations than negative statements. That is 12 percentage points lower than in 2014, when 63% of U.S. adults expressed a positive view of religion.

Meanwhile, the share of people who agree with more negative than positive statements about religion has increased by 11 points since 2014, from 18% to 29%.

These changes reflect, in part, drops in the shares expressing positive views about religion among most Christian subgroups, including Catholics, mainline Protestants and people who identify with historically Black Protestant churches. Evangelical Protestants are an exception, with a relatively stable share expressing net positive views of churches and other religious organizations (78% in 2014, 75% in the new RLS).

Jews, Muslims and Hindus also have become less positive in their views of religious institutions. And among religiously unaffiliated adults, the share expressing net positive views has dropped 17 points, from 40% in 2014 to 23% in the new survey.

Table showing overall balance of perceptions about religious institutions has shifted in the U.S.

Religion and public life

Declaring the U.S. a Christian nation

Americans are about evenly divided on whether the federal government should declare the U.S. a Christian nation, with 47% either favoring or strongly favoring the idea and 50% either opposing or strongly opposing it.

Table showing nearly half of evangelicals strongly favor the government declaring the U.S. a Christian nation

Among religious groups, this idea is most widely supported by evangelical Protestants, 78% of whom say that they favor or strongly favor the federal government declaring the U.S. a Christian nation.

About two-thirds of Latter-day Saints and six-in-ten members of historically Black Protestant churches also take this position.

How survey question wording, response options can affect answers

Over the years, we have asked Americans many questions about how much influence religion should have in U.S. public life. This includes several questions asking, in various ways, whether religion (and Christianity, in particular) should hold a privileged status in society and play a special role in shaping U.S. laws and policies. We’ve learned that response patterns vary considerably on these questions depending on their specific wording and structure.

One factor influencing how people respond to questions about the separation of church and state (or, looked at from another direction, the integration of religion and public life) is that Americans often have widely differing understandings of what being “a Christian nation” or promoting “Christian values” would entail, in practical terms.

The new RLS asked Americans if they favor or oppose the federal government declaring the U.S. a “Christian nation,” but it did not ask those who favor it to elaborate on what they mean by Christian nation. However, in a 2022 survey, we asked Americans if the U.S. “should be a Christian nation,” and then we asked a follow-up question: “In your own words, what does the phrase ‘Christian nation’ mean to you?”

While some respondents defined Christian nation as a country where laws are based on Christian tenets and leaders are Christian, a much more common response was that a Christian nation involves people being broadly guided by Christian values or belief in God, even if the laws are not explicitly, or exclusively, Christian.

Furthermore, Americans who said the U.S. should not be a Christian nation often envisioned a Christian nation as a theocracy in which the government makes laws and policies based directly on Christian teachings. But those who said the U.S. should be a Christian nation tended to reject the idea of a theocracy and, rather, envisioned a country where most people are Christians and/or where people have good morals and treat each other well.

Another factor influencing responses to these types of questions is that, in general, when respondents are given the option to say they have no opinion or that neither of the two options provided represents their views, smaller shares favor integrating religion into public life than is the case when there is no “neutral” option. In other words, many Americans choose not to take a clear stance on church-state relations if they can opt out of doing so in a survey.

When questions do not offer a “neutral” option and respondents must choose between stances that either clearly favor or clearly oppose church-state integration, larger shares favor the integration of religion and public life. Put differently, when forced to choose between the privileging of Christianity in public life versus Christianity having no special status, respondents who would otherwise say they have no opinion or no preference (if given that choice) may lean toward saying Christianity should have special status.

For example, in March 2021, when we asked Americans to pick which of two statements they agreed with more, just 15% selected “The federal government should declare the United States a Christian nation,” while 69% selected “The federal government should never declare any religion an official religion.” An additional 15% explicitly selected “Neither/No opinion” as their choice.

On the 2023-24 RLS, respondents were asked a similar question: “Do you favor or oppose the federal government declaring the U.S. a Christian nation?” However, this time, they were given four response options (“Strongly favor,” “Favor,” “Oppose” and “Strongly oppose”) with no “neutral” option.

When the question was posed this way, 47% of U.S. adults favor or strongly favor the federal government declaring the U.S. a Christian nation. This is three times the share who chose the comparable option in the other question format from March 2021 – a striking demonstration of how much the results on these survey questions depend on nuances in the wording of the question and the response options offered.

Prayer in public schools

The new Religious Landscape Study finds that about half of Americans, or a little more, support allowing teacher-led prayer in public schools, whether that be praying to Jesus explicitly (52%) or, alternatively, praying to God without mentioning any specific religion (57%). Seven-in-ten U.S. Christian adults say they favor permitting teacher-led prayers to Jesus in public schools and 73% say they favor teacher-led prayers to God that don’t mention any specific religion.

Compared with Christians, far lower shares of religiously unaffiliated Americans (28%) and adults who affiliate with other, non-Christian religions (39%) say they favor public school teachers leading classes in prayers that refer to God without mentioning any specific religion. There is even less support among non-Christian groups for allowing public school teachers to lead classes in prayers to Jesus.

Table showing most Christians favor allowing public school teachers to lead their classes in nonsectarian prayers; most others oppose the idea
How survey question wording, response options can affect answers

These questions about school prayer provide another example of how the decision to include a “Neither/No opinion” option can have a big impact on survey findings. In a March 2021 survey, we asked respondents to choose which of the following statements came closest to their view:

  • “Teachers in public schools should be allowed to lead students in Christian prayers.”
  • “Teachers in public schools should not be allowed to lead students in any kind of prayers.”
  • “Neither/No opinion”

In response, 30% of U.S. adults said teachers in public schools should be allowed to lead students in Christian prayers, which is on par with the 27% of respondents in the new survey who say they strongly favor allowing teacher-led Christian prayers in public schools.

Meanwhile, 46% of respondents in the March 2021 survey said teachers in public schools should not be allowed to lead students in any kind of prayers, which is similar to the share in the new survey who say they oppose allowing teachers to lead Christian prayers in public schools.

About a quarter of respondents in the 2021 survey (24%) selected “Neither/No opinion” as their choice. The findings of the new survey suggest that many of the respondents in the March 2021 survey who chose “Neither/No opinion” when asked about prayer in schools may, on balance, favor allowing it when presented with a question (like the one in the new survey) that doesn’t explicitly offer a “Neither/No opinion” option. But they may not feel particularly strongly about the issue.

Displays of religious symbols

About half of Americans (53%) favor or strongly favor allowing cities and towns to display religious symbols on public property. Support for this stance is particularly strong among Christians, including 80% of evangelical Protestants and 73% of Latter-day Saints who favor or strongly favor allowing public displays of religious symbols.

Table showing about half of Americans support allowing religious displays on public property

Much lower shares of Buddhists (39%), Muslims (35%), Hindus (31%) and Jews (25%) say they favor allowing religious displays on public property.

In a March 2021 survey, we asked about religious displays on public property in a different way. We asked respondents which of these statements came closer to their opinion:

  • “Cities and towns in the U.S. should be allowed to place religious symbols on public property.”
  • “Cities and towns in the U.S. should keep religious symbols off public property.”
  • “Neither/No opinion”

In response, 39% of respondents said cities and towns in the U.S. should be allowed to place religious symbols on public property, while 35% said they should keep religious symbols off public property, and 26% selected “Neither/No opinion.”

CORRECTION (July 1, 2025): A previous version of the table titled “Most Christians favor allowing public school teachers to lead their classes in nonsectarian prayers; most others oppose the idea” misstated the percentage of Latter-day Saints who say that they oppose allowing public school teachers to lead their classes in prayers that refer to Jesus. The table has been replaced. This change does not substantively affect the findings of this report.

23. Religion and views of science

The question of whether science and religion are at odds or generally compatible has long been a topic of interest to philosophers, theologians and scientists, among others.

Bar chart showing Americans are divided on whether science and religion are mostly in conflict

In the Religious Landscape Study (RLS), we asked respondents whether science and religion are “mostly in conflict” or “mostly compatible,” and Americans are basically split on this topic. Half of U.S. adults say that science and religion are mostly in conflict, while 47% say that science and religion are mostly compatible.

The more religious they are, the more likely Americans are to say science and religion are mostly compatible. The less religious they are, the more likely they are to see conflict between science and religion.

Among Americans with low levels of religious engagement, 73% say science and religion are mostly in conflict, roughly twice the share of highly religious Americans who take the same position (35%).83

The survey also finds that Americans of all religious backgrounds are more likely to view science as beneficial than as harmful for American society. About half of U.S. adults (52%) say science does “more good than harm.”

Bar chart showing 52% of Americans say science does more good than harm in society; 7% say it does more harm than good

Just 7% of Americans overall say that science does “more harm than good.”

Meanwhile, 39% say science does “equal amounts of good and harm.” 

At the same time, most Americans do not expect science to have answers to everything. Nearly seven-in-ten U.S. adults say “there are some things that science cannot possibly explain.” About three-in-ten say “there is a scientific explanation for everything, even if we don’t understand how everything works.”

Even most Americans with positive views about science’s impact believe that science cannot explain everything. About six-in-ten who say science does more good than harm also say there are some things that science cannot possibly explain.

Read more about how religious groups answer questions about:

  • The compatibility of science and religion
  • Whether science does more good or harm in American society
  • Whether science can explain everything

Views on compatibility of science and religion

Religiously unaffiliated Americans – people who identify as atheist, agnostic or “nothing in particular” – are more likely than U.S. adults who identify with a religion to say that religion and science are mostly in conflict (68% vs. 42%).

And, among the unaffiliated, atheists (83%) are more likely than agnostics (69%) and those who describe their religion as “nothing in particular” (64%) to think that science and religion conflict.

Looking just at Christian subgroups, 74% of members of the Church of Jesus Christ of Latter-day Saints (widely known as Mormons) say that science and religion are mostly compatible, as do 56% of Protestants and 52% of Catholics.

Two-thirds of Muslims also see science and religion as compatible, while 56% of Buddhists say science and religion are in conflict.84

Table showing 68% of religiously unaffiliated Americans say religion and science are mostly in conflict

Views on whether science does more good or harm in American society

Nearly half of Americans who identify with a religion say science does more good than harm (48%), while 8% say it does more harm than good. The remaining 43% say it does equal amounts of good and harm.85

Table showing that across all religious groups, more say science is helpful than harmful

Among Christian subgroups, there are some differences on this question. About half or more of Orthodox Christians (58%), mainline Protestants (55%), Latter-day Saints (55%) and Catholics (51%) see science as doing more good than harm, compared with 40% of members of the historically Black Protestant tradition and 39% of evangelical Protestants.

Meanwhile, a majority of U.S. adults of non-Christian religions (62%) say science does more good than harm, higher than the 46% of Christians overall who take this stance.

Among religiously unaffiliated Americans, 63% say science does more good than harm. This includes:

  • 85% of atheists;
  • 77% of agnostics; and
  • 54% of those who describe their religion as “nothing in particular.”

Views on whether science can explain everything

Religiously unaffiliated Americans are a lot more likely than U.S. adults who identify with a religion to say there is a scientific explanation for everything (49% vs. 21%). They are a lot less likely to say that there are some things that science cannot possibly explain (49% vs. 77%).86

Table showing about half or more of adults in all religiously affiliated groups say there are things science can’t explain

Among the unaffiliated, 81% of atheists see science as holding the answers to everything, compared with 61% of agnostics and 38% of those who describe their religion as “nothing in particular.”

Meanwhile, majorities of nearly every religiously affiliated group analyzed say “there are some things science cannot possibly explain.”

Jewish Americans are an exception among the religiously affiliated, with 51% saying there are some things science cannot explain and 48% saying there is a scientific explanation for everything.

24. Age, race, education and other demographic traits of U.S. religious groups

Like the country’s overall population, many U.S. religious groups have experienced a decline in the share of adults who identify as White, according to the 2023-24 Religious Landscape Study (RLS).

Today, 61% of U.S. Christians are non-Hispanic White, compared with 66% in 2014 and 70% in 2007. There has been a similar decline in the share of White adults in the religiously unaffiliated category.87

Table showing trends in the racial composition of U.S. Christians and religiously unaffiliated adults

Meanwhile, there has been growth or stability in the shares of Christians who identify as Black, Hispanic or Asian.88

For example, Hispanic Americans now make up 18% of Christians, compared with 13% in 2007. And Asian Americans now make up 7% of the religiously unaffiliated, compared with 4% in 2007.

There have been other demographic changes as well. The median age of Christians has risen to 54, from 49 in 2014 and 46 in 2007. The median age of adults who identify with other religions is lower (41) and has not changed much since 2014 and 2007. The median age of religiously unaffiliated adults in the new survey is 38, which also is in line with both 2014 and 2007.

Line chart showing the median age of U.S. Christian adults is higher now than in 2007

Women continue to make up a majority of Christians. But, today, women also account for nearly half of all religiously unaffiliated Americans (47%). In the 2007 and 2014 Religious Landscape Studies, the religiously unaffiliated population was composed much more heavily of men than of women.

Read on for more details about the demographic traits of U.S. religious groups:

  • Race and ethnicity
  • Immigration and region of birth
  • Citizenship and civic engagement
  • U.S. geographic distribution
  • Age
  • Gender and sexual orientation
  • Education
  • Income and employment status

Race and ethnicity

Many of the country’s large religious groups – including evangelical Protestants, mainline Protestants and Catholics – continue to have White, non-Hispanic majorities. So does the country’s religiously unaffiliated population. Among “nones” – i.e., people who answer a question about their current religion by saying they are atheist, agnostic or “nothing in particular” – 63% identify as non-Hispanic White.

Among evangelical Protestants, 70% are White, 12% are Hispanic and 7% are Black. Among mainline Protestants, 79% are White and 6% each are Black or Hispanic. Members of the historically Black Protestant tradition continue to be predominantly Black, though about 3% of U.S. adults who affiliate with that tradition identify as White and 4% are Hispanic.

Table showing racial and ethnic composition of U.S. religious groups

Among U.S. Catholics, the share of Hispanic adults has increased from 29% in 2007 to 36% in the 2023-24 Religious Landscape Study (RLS).89 U.S. Jews remain predominantly White and non-Hispanic (90%).90

Meanwhile, 84% of Hindus are Asian, as are 56% of Buddhists. Among U.S. Muslims, 30% are Asian, 30% are White, 20% are Black, 11% are Hispanic and 7% are multiracial or identify with another race. White Americans make up roughly three-quarters of adults who identify as atheist (75%) or agnostic (74%), but just 57% of adults who identify religiously as “nothing in particular.”

Immigration and region of birth

Immigrants make up much higher percentages of some non-Christian religions than they do of U.S. Christians.91

Table showing most U.S. Hindu, Buddhist and Muslim adults were born in another country or have at least one parent who was born outside the U.S.

People born outside the United States account for notably large shares of Hindus (77%), Muslims (59%) and Buddhists (55%). Foreign-born Hindus and Buddhists most often were born in the Asia-Pacific region, while Muslim immigrants’ regions of origin are more varied.

Orthodox Christians also include a relatively high percentage of immigrants (42%), including 21% who were born in Europe. An additional 27% of Orthodox Christians have at least one parent who was born outside the U.S.

Much smaller shares of Christians as a whole (17%), the religiously unaffiliated (16%) and Jews (13%) were born outside the U.S. Most Christians, Jews and religiously unaffiliated Americans say their families have been in the U.S. for at least three generations.

(Read more about the religion of immigrants to the U.S. in our recent report “The Religious Composition of the World’s Migrants.”)

Table showing two-thirds of U.S. Hindus and 45% of Buddhists were born in the Asia-Pacific region

Citizenship and civic engagement

Citizenship

Most U.S. religious groups are comprised largely of U.S. citizens. This includes majorities of Jews (98%), Christians (93%), Buddhists (89%) and Muslims (78%). Hindus (57%) living in the United States are less likely to be U.S. citizens.

Table showing 93% of U.S. Christians and religiously unaffiliated adults are American citizens

Voter registration

About three-quarters of Christians and Jews are registered to vote, as are roughly two-thirds of religiously unaffiliated adults.

Table showing roughly three-quarters of U.S. Christians and Jews are registered voters, as are two-thirds of religiously unaffiliated adults

The survey finds that 56% of Buddhists, 55% of Muslims and 42% of Hindus are registered to vote. The share of Buddhists who say they are not sure if they are registered to vote stands at 21% – higher than among other groups.

Relatively large shares of Muslims and Hindus indicate that they are not citizens and so are not eligible to vote.

Volunteering

Members of the Church of Jesus Christ of Latter-day Saints (widely known as Mormons) are the only group in this analysis with more than half of adults who say they have volunteered for any organization in the past 12 months (72% say this).

Table showing 72% of Latter-day Saints say they volunteered in the past year

U.S. geographic distribution

Overall, 42% of U.S. Christians live in the South. That includes 64% of adults in the historically Black Protestant tradition and 52% of evangelical Christians.

Table showing 64% of members of historically Black Protestant churches, 52% of evangelicals live in the South

Roughly seven-in-ten Latter-day Saints live in the West, as do around half of Buddhists.

About four-in-ten Jews (42%) live in the Northeast.

Religiously unaffiliated adults are less likely than Christians to live in the South.

Age

Mainline Protestants, Catholics and evangelical Protestants are among the country’s oldest religiously affiliated populations. People ages 50 and older make up a majority of mainline Protestants (64%), Catholics (57%) and evangelical Protestants (54%).

Muslims and Hindus are much younger, on average, than other U.S. religious groups: About three-quarters of adults in each group are under 50. And a third of U.S. Muslim adults are younger than 30.

The country’s religiously unaffiliated population is relatively young as well. Roughly seven-in-ten U.S. adults with no religion are under 50, compared with 44% of religiously affiliated adults.

Table showing most evangelicals, mainline Protestants and Catholics are ages 50 and older; roughly three-quarters of Muslims, Hindus, atheists and agnostics are under 50

The median age of Christians overall has risen from 46 in 2007 to 54 in 2024. This is a trend that can be seen within most of the Christian subgroups large enough to analyze in this survey.

Among the religiously unaffiliated and adherents of non-Christian religions, the median age has remained relatively stable since 2007.

Table showing the median age of U.S. Christians is up from 2007

Gender and sexual orientation

Most Christian groups in this analysis have more women than men. The gap is widest among members of historically Black Protestant churches (64% women, 35% men). 

Table showing women make up a majority of U.S. Christians but fewer than half of atheists and agnostics

On the other hand, atheists and agnostics have greater shares of men than women.

Surveys consistently show that in the U.S., women, on average, are more religious than men on a variety of measures. (Read more about the connections between gender and religiousness in the report Overview.)

At the same time, the gender ratio of the religiously unaffiliated has become more balanced over time. In 2007, about 41% of religiously unaffiliated adults were women, while 59% were men. Today, 47% of unaffiliated Americans are women, 50% are men and 3% identify in some other way (an option that was not available in the 2007 and 2014 Religious Landscape Studies).92

Table showing U.S. ‘nones’ are more likely than Christians to identify as gay, lesbian or bisexual

There are more men than women among Jewish, Muslim and Buddhist respondents in the survey. However, given the relatively small samples sizes of these groups, the shares of these groups who are men are not statistically significantly larger than the shares who are women.93

In terms of sexual orientation, atheists and agnostics are notably more likely than other U.S. adults to describe their sexual orientation as gay, lesbian or bisexual.

Education

Hindus and Jews are, on average, the most highly educated religious groups in the U.S. Roughly seven-in-ten Hindus and two-thirds of Jews have a bachelor’s degree or more education.

Roughly half of agnostics (53%) and atheists (48%) have a bachelor’s degree or more education, as do 32% of Christians.

Table showing that on average, Hindus and Jews have the highest levels of educational attainment among U.S. religious groups

Income and employment status

Of the religious groups in this analysis, Hindus and Jews tend to have the highest family incomes. Roughly half or more of adults in each of these two groups report an annual household income of $100,000 or more.

Table showing that among U.S. religious groups, Hindus and Jews have the highest household incomes

Additionally, roughly three-in-ten Catholics and mainline Protestants report annual household incomes of $100,000 or more.

Relatively few members of historically Black Protestant churches (14%) are in this highest income bracket.

Among religiously unaffiliated Americans, 48% of atheists and 43% of agnostics have a household income of $100,000 or more.

Among religiously unaffiliated adults, 55% are currently working full time for pay, as are 58% of Hindu adults. Half of Muslim adults are working full time, as are 48% of Buddhists, 46% of Jews and 44% of Christians.

About a quarter of Christians (27%) and Jews (24%) are retired. Christians and Jews also are among the religious groups most likely to be ages 65 or older.

Table showing that in the U.S., Christians and Jews are more likely than others to be retired

CORRECTION (Sept. 29, 2025): A previous version of this report included an incorrect value for the median age of Christians overall in 2024, which has since been updated. This change does not substantively affect the findings of this report. The figures shown in the accompanying graphic were correct and remain unchanged.

Acknowledgments

The Religious Landscape Study (RLS) was made possible by The Pew Charitable Trusts, which received support from the Lilly Endowment Inc., Templeton Religion Trust, The Arthur Vining Davis Foundations and the M.J. Murdock Charitable Trust. Pew Research Center is a subsidiary of The Pew Charitable Trusts, its primary funder.   

This report is a collaborative effort based on the input and analysis of the following individuals. Find related reports online at pewresearch.org/religion.

Research team

Gregory A. Smith, Senior Associate Director, Religion Research
Alan Cooperman, Director, Religion Research
Becka A. Alper, Senior Researcher
Besheer Mohamed, Senior Researcher
Chip Rotolo, Research Associate
Patricia Tevington, Research Associate
Justin Nortey, Research Analyst
Asta Kallo, Research Assistant

Methods team

Ashley Amaya, Associate Director, Survey Methods
Andrew Mercer, Principal Methodologist
Courtney Kennedy, Vice President, Methods and Innovation
Dorene Asare-Marfo, Senior Panel Manager          
Dana Popky, Associate Panel Manager
Anna Brown, Research Methodologist
Arnold Lau, Research Methodologist

Editorial and graphic design

Jeff Diamant, Senior Writer/Editor
Dalia Fahmy, Senior Writer/Editor
Rebecca Leppert, Copy Editor
Bill Webster, Senior Information Graphics Designer

Communications and web publishing

Kim Arias, Video Lead
Chris Baronavski, Lead Engineer, Editorial Content
Peter Bell, Associate Director, Design and Production
Kelly Browning, User Experience Manager
Andrea Caumont, Associate Director, Digital Outreach
Justine Coleman, Associate Digital Producer
Shannon Greenwood, Digital Production Manager
Stacy Rosenberg, Director, Digital Strategy
Seth Rubenstein, Platform Lead, Engineering Team
Anna Schiller, Associate Director, Strategic Communications
Kyhry Taylor, Temporary User Experience Specialist
Blythe Thomas, Director, Strategic Communications
Ben Wormald, Senior Engineer
Nick Zanetti, Associate Engineer

Many individuals contributed to this survey’s data collection and methodology. In particular, Pew Research Center is grateful to Emily Alvarez, Leah Christian, David Dutwin, Ned English and Martha McRoy from NORC at the University of Chicago for their many contributions to this project.

Others at Pew Research Center who contributed to this report include Claudia Deane, executive vice president; Neha Sahgal, vice president of research; Mark Hugo Lopez, director of race and ethnicity research; Kim Parker, director of social trends research; Conrad Hackett, associate director of religion research and senior demographer; Juliana Menasce Horowitz, senior associate director of social trends research; Jocelyn Kiley, senior associate director of political research; Sahana Mukherjee, associate director of race and ethnicity research; Alec Tyson, associate director of science and society research; Rick Fry, senior researcher; Scott Keeter, senior survey advisor; Jens Manuel Krogstad, senior writer/editor; Jeffrey S. Passel, senior demographer; Luis Noe-Bustamante, research associate; and Achsah Callahan, former communications manager.

In addition, the Center is grateful to expert advisers who provided valuable advice on this project: R. Khari Brown, professor of sociology at Wayne State University; Mark Chaves, Anne Firor Scott distinguished professor of sociology and professor of religious studies and divinity at Duke University; Penny Edgell, professor of sociology at the University of Minnesota; John C. Green, director emeritus of The Ray C. Bliss Institute of Applied Politics and distinguished professor emeritus of political science at The University of Akron; Corwin E. Smidt, professor emeritus of political science at Calvin University; and David Voas, emeritus professor of social science at University College London.

Methodology

The Religious Landscape Study (RLS), on which this report is based, is a national cross-sectional survey conducted for Pew Research Center by NORC at the University of Chicago.

It was conducted in English and Spanish from July 17, 2023, to March 4, 2024, among a nationally representative sample of 36,908 U.S. adults.

A geographically stratified address-based sample was drawn from the United States Postal Service’s Computerized Delivery Sequence File (CDS).

The survey was designed to produce reliable state and national estimates of the U.S. adult population. In geographies with a sufficiently large number of completed interviews, metropolitan statistical area (MSA) estimates are also available.

Table showing the sample sizes and margins of sampling error, by religious group

A total of 205,100 sampled addresses were mailed survey invitations. Respondents were given a choice to complete the survey online, by mail, or by calling a toll-free number and completing the survey over the phone with an interviewer. Of the 36,908 U.S. adults who completed the survey, 25,250 did so online, 10,733 did so by mail, and 925 did so by phone.

After accounting for the complex sample design and loss of precision due to weighting, the national margin of sampling error for these respondents is plus or minus 0.8 percentage points at the 95% level of confidence.

The research plan for this project was submitted to NORC’s institutional review board (IRB), which is an independent committee of experts that specializes in helping to protect the rights of research participants. This research was declared exempt under category 2 of IRB code (approval #: FWA 00000142).

Sample design

The survey has a complex sample design constructed to ensure reliable estimates for the nation as a whole, for each state (and the District of Columbia), and for some of the largest MSAs.

The sample frame of the 2023-24 RLS is an address-based sample (ABS) comprised of addresses from the USPS CDS file. It is maintained by Vericast and is updated monthly. All residential addresses on the ABS frame were geocoded and assigned to one of 93 strata.

Addresses were initially stratified by state and the District of Columbia. When sample sizes were large enough, states were further partitioned into target MSA strata and non-MSA state strata. For example, the entire state of Connecticut is comprised of one stratum, but five strata cover California (Los Angeles-Long Beach-Anaheim; San Francisco-Oakland-Berkeley; Riverside-San Bernardino-Ontario; San Diego-Chula Vista-Carlsbad; and all other addresses within California). Strata were defined at the county level and respected state boundaries.

The sample was proportionally allocated but adjusted to account for differential nonresponse and to ensure that a minimum of 300 people in each state completed the survey. Additionally, allocation was optimally adjusted within states so that the survey obtained at least 250 completed surveys from respondents in at least 32 large MSAs while balancing overall design effects due to unequal probability of household selection.94 Addresses were randomly selected within each stratum.

Once an address was sampled, an invitation was mailed to the address. The invitation asked the adult in the household with the next birthday to complete the survey.

Sampled addresses were contacted in two batches. Addresses in the first batch were first contacted on July 14, 2023, while those in the second batch were first contacted on Oct. 27, 2023. Response rates from the first batch informed the size of the second batch, to ensure the study reached the targeted number of completed interviews.

Data collection

The survey used a sequential mixed-mode protocol in which sampled households were first invited to respond online and then, if they did not respond online, mailed a paper version of the questionnaire. A toll-free phone number was included in all contact attempts, and individuals were told they could call it to complete the survey over the phone with an interviewer.

The first mailing included a letter introducing the survey and providing the information needed to respond online or by phone (website URL, unique access PIN, and phone number). A pre-incentive of $2 was included in the mailing and could be seen through a windowed envelope. The letter promised an additional $10 once the survey was complete.95 The invitation was generic; it asked respondents to “answer some questions in a short online survey” and said that “the survey asks about a variety of topics that affect you and your community.” We intentionally avoided telling respondents in the letter that the survey focused heavily on religion, because we wanted to minimize the risk of biasing the survey’s results by appealing disproportionately to people who are interested in religion. Materials were sent in both English and Spanish to 15% of addresses, and in English only to 85% of addresses.

One week after the first mailing, NORC sent a postcard reminder to all sampled individuals, followed a week later by a reminder letter to nonrespondents.

After that, a 16-page paper version of the survey, postage-paid return envelope, cover letter and another $2 prepaid incentive were mailed to nonrespondents. The timing and postage method for this mailing varied. Addresses sampled as part of the first batch were mailed these materials 10 days after the reminder letter was sent out, whereas addresses in the second batch were mailed two months after the reminder letter. The second batch delay was designed to avoid sending mail over the holiday season from Thanksgiving through New Year’s Day. Mailings to the first batch of addresses and 75% of the second batch were sent using first class mail. The remaining 25% of addresses in the second batch were sent via UPS Mail Innovations. This change was made to increase the response rate while respecting budget limitations.

One to two weeks later, a reminder postcard followed the paper surveys.

A sample of 60% of nonresponding addresses in the first sample batch also received a second paper version of the survey approximately one month after the first; this sample was drawn proportional to the household’s response propensity estimated through predictive modeling using big data classifiers. This mailing included a copy of the paper questionnaire, a cover letter, postage-paid envelope, and an additional prepaid incentive. The hardest-to-reach nonrespondents received a $5 incentive while others received a $2 incentive. This final mailing was not sent to the second sample batch due to budget and time constraints.

In addition to the above protocol, a methodological contact experiment was built into the 2023-24 RLS. When available, cellphone numbers were appended to nonresponding addresses and a random subsample of these numbers received a text message. The text message contained either a link to the web survey or gave recipients both the web link and the toll-free telephone number for completing the survey via phone. In the first sample batch, text messages were sent following the final mailing. In the second sample batch, they were sent following the reminder web letter and before the first paper questionnaire was sent.

Languages

English materials were mailed to all sampled addresses while Spanish materials were also included in mailings to the 15% of addressees identified as most likely to have a Spanish speaker. Addresses that were likely to be home to Spanish-speaking people were identified using a combination of vendor-provided commercial flags, Bayesian Improved Surname and Geocoding (BISG), and isolated Spanish language Census tracts.

For the web survey, the landing page was displayed in English initially but allowed respondents to toggle between English and Spanish. Respondents who called in to complete the survey over the phone were routed to an English or bilingual interviewer as appropriate. Paper questionnaires in both languages were sent to households flagged to receive bilingual materials.

Weighting and variance estimation

Household-level weighting

The first step in weighting was to create a base weight for each sampled mailing address, to account for its probability of selection into the sample. The base weight for mailing address k is called BWk and is defined as the inverse of its probability of selection. The addresses had a probability of selection based on the stratum from which they were sampled.

Each sampled mailing address was assigned to one of four categories according to its final screener disposition. The categories were 1) household with a completed interview, 2) household with an incomplete interview, 3) ineligible (i.e., not a household; these were primarily postmaster returns), and 4) addresses for which status was unknown (addresses that were not identified as undeliverable by the post office but from which no survey response was received).

The next step in the weighting process was to adjust the base weight to account for eligibility and nonresponse within each stratum. The proportion of ineligible households in each stratum was calculated under the assumption that all sampled households with unknown eligibility (category 4) were, in-fact, eligible. The proportion of ineligible households was then used to estimate the total number of eligible households in each stratum on the sampling frame. The base weights for responding households in each stratum (category 1) were then scaled so that their sum was equal to these estimated totals.

Person-level weights for national and state-level analysis

An initial adult base weight was calculated for the cases with a completed interview as the product of the truncated number of adults in the household (max value of 3) multiplied by the household weight. This adjustment accounted for selecting one adult in each household.

Next, an adaptive mode adjustment factor was applied to the adult base weight so that the relative weights for respondents who completed the survey in an offline mode (PAPI or CATI) were increased by a factor of two.

Table showing the 2023-24 Religious Landscape Study raking dimensions

The final step in the adult weighting was to calibrate the adult weights for respondents who completed the survey, so that the calibrated weights (i.e., the estimated number of adults) aligned with benchmarks for noninstitutionalized U.S. adults (refer to the benchmarks listed in the accompanying table). For some raking dimensions that include the cross-classification of demographic variables within states (State x Race/Ethnicity, State x Gender x Education, and State x Age x Education), cells with fewer than 30 completed interviews were collapsed with neighboring cells to prevent the creation of extreme weight values and to ensure the convergence of the raking process. These weights were then trimmed separately within each stratum at the 1st and 99th percentiles, to reduce the loss in precision stemming from variance in the weights.

Person-level weights for the analysis of MSAs

An additional set of weights was created for the purpose of producing estimates for the 34 MSAs in which there were at least 250 completed interviews.96 To create this weight, the person-level weight for respondents living in these MSAs was further calibrated on the following dimensions within each MSA:

  • Race/Ethnicity
  • Age
  • Gender
  • Education
  • Gender x Age
  • Gender x Education
  • Age x Education

Because MSA is not available on the American Community Survey 1-Year Public Use Microdata Sample, weighting benchmarks were estimated by allocating each case’s weight to one or more MSAs, according to the Public Use Microdata Area (PUMA) in which they live. This allocation was performed using a crosswalk from the Missouri Census Data Center’s Geocorr 2022 that contained the share of each PUMA’s population residing in every MSA as of the 2020 decennial census.

For some raking dimensions (Race/Ethnicity, Gender x Education, and Age x Education), cells with fewer than 25 completed interviews were collapsed with neighboring cells to prevent the creation of extreme weight values and to ensure the convergence of the raking process. In a final step, the MSA weight was trimmed separately within each MSA at the 1st and 99th percentiles.

Variance estimation

Bootstrap replication was used to facilitate variance estimation and conducting tests of statistical significance. Five hundred sets of replicates were created using the Rao-Wu rescaling bootstrap procedure as implemented in the survey package for the R statistical computing platform. The entire process for creating national weights was performed on the full sample and then separately repeated for each replicate. The result is a total of 501 separate weights for each respondent that have incorporated the variability from the complex sample design and weighting.97 Replicate weights were not created for the MSA weights.

The margins of sampling error reported in the tables here and on the RLS interactive website take into account the effect of weighting but they are not calculated using bootstrap replication. Margins of error are instead calculated using a formula based on the variability of respondent weights.98 This formula can be very conservative because it assumes that the weights are unrelated to the survey variables. Variance estimates that use the bootstrap replicates will generally show a greater level of precision because they are able to account for correlations between survey variables and the weights.

Response rates

NORC assigned all sampled cases a result code and used these codes to compute response rates consistent with AAPOR definitions. The response rates are weighted by the base weight to account for the differential sampling in this survey. The AAPOR RR3 response rate was 20%.99

Table showing the AAPOR disposition codes

Sample sizes and margins of error for states and metro areas

The following tables show the unweighted sample sizes and the error attributable to sampling that would be expected at the 95% level of confidence for different groups in the survey.

Table showing the sample sizes and margins of error for states
Table showing the sample sizes and margins of error for metro areas

Appendix A: Comparing results across Religious Landscape Studies

Many questions in the 2023-24 Religious Landscape Study (RLS) previously were asked in the 2007 and 2014 landscape studies. Measuring change over time on these questions is one key goal of the new RLS.

But the 2023-24 survey was conducted using different methods from the 2007 and 2014 surveys, and this “mode switch” complicates comparisons between the results of the new survey and the findings of the previous surveys.

In the new survey, we mailed invitations to a random sample of U.S. households using address-based sampling (ABS). Participants were given the option of completing the survey online, on paper, or on the phone (by calling a toll-free number we gave them). For more details, read this report’s Methodology. Overall, 60% of the respondents in the 2023-24 RLS participated online, 37% completed the survey on paper, and 3% took the survey on the phone.

By contrast, both the 2007 and 2014 surveys were conducted entirely by phone. In both of those surveys, we recruited respondents using random-digit dialing, and the survey was administered by live interviewers who asked the questions and recorded the answers.100

Respondents answer some survey questions differently when they are talking with an interviewer (as in the 2007 and 2014 surveys) than when they participate in surveys online or on paper (as most respondents in the new survey did). This means that for some survey questions, the results we obtained in previous surveys (using an interviewer-administered mode) cannot be directly compared with the results from the new survey that we conducted using mainly self-administered modes, even if the wording of the questions is identical.101

But not all questions are equally subject to these “mode effects.” While testing indicates that some questions are not comparable across different modes, others can be safely compared, and still others fall somewhere in between – the data can provide basic information about the direction of trends, even if varying modes don’t produce identical results.

Using a bridge study and other data to decide how to compare results

To help us determine which results from the new survey are comparable with those of past surveys, we conducted a telephone bridge study using a methodological approach similar to the one we used for the 2007 and 2014 landscape studies. In the bridge study, we used a random-digit-dialing method and conducted telephone interviews with 1,519 respondents separately from the main survey. We asked these respondents the same questions that were administered to respondents in the main survey. But the 1,519 respondents in the telephone bridge study are not included in the main RLS survey; the bridge study was conducted only as a test, exclusively for the purpose of helping us determine which questions in the new survey can safely be compared with the 2007 and 2014 results, which questions clearly cannot be compared, and which fall somewhere in between. (Read about the bridge study’s Methodology.)

We compared the results of the telephone bridge study with those of the main address-based sample. For each question, we examined whether the balance of opinion was similar across the differing modes (phone for the bridge study, mostly online/paper for the main survey). We also considered whether the different survey modes led to different distributions on particular response options. For example, people who completed the survey by phone in the bridge study sometimes volunteered “I don’t know” as a response, an option that is not available to respondents on the web and mail surveys. This sometimes resulted in fewer phone respondents choosing one of the substantive response options, compared with those who completed the survey via other modes.

The bridge study is one important tool we used to help determine how to compare the results from the 2023-24 RLS with the results from the previous landscape studies, but it is not the only tool we used for this purpose. In addition to the bridge study, we also used other Pew Research Center analyses and experiences to help inform our decisions about whether to make comparisons between the new survey and previous RLS results. For example, we conducted an analysis in 2021 assessing whether it is possible to compare phone results with web results on key questions about religious identity, frequency of prayer, religious service attendance, and religion’s importance in people’s lives. Several RLS questions also have been asked on other recent Center surveys, which can provide additional information about comparability.

We drew on all this information – the telephone bridge study, previous efforts to understand mode effects, and ongoing Pew Research Center surveys – to categorize RLS questions into three buckets, color coded as green (“go”), yellow (“caution”) and red (“stop”).102

Green questions produce results in the new survey that can safely be compared with the 2007 and 2014 RLS findings. There is no evidence that these questions are subject to significant mode effects. In polling lingo, they are “trendable” even though the new RLS was conducted using different modes than the previous studies.

Red questions cannot be compared with the previous studies. The mode effects on these questions are relatively large. Comparing the results of these questions from the new study with previous studies could be misleading. Doing so might suggest that big changes have occurred in public opinion over the last 10 or 15 years when, in reality, the different results could be produced by the mode switch alone.

Yellow questions fall between the safely trendable green questions, on the one hand, and the clearly non-trendable red questions, on the other. Yellow questions appear to be subject to modest mode effects, but they nevertheless can be cautiously compared with previous results while bearing in mind the size and direction of the mode effects on the particular question at hand.  

Green: Questions we can compare with previous Religious Landscape Studies

Many key questions in the new RLS can be safely compared with the 2007 and 2014 landscape studies, including the study’s core questions about religious identity (also sometimes called religious affiliation, preference or adherence). The bridge study finds little evidence that people answer questions differently on the phone than online/on paper when asked about their current religious identity, their childhood religious identity, or the religious identity of their spouse/partner.

The bridge study yielded somewhat fewer Catholic respondents than the main survey. And among respondents who are married or living with a partner, the bridge study finds a slightly smaller share who say their spouse/partner is religiously unaffiliated. Otherwise, though, the religious composition of respondents in the bridge study was quite similar to the religious composition of respondents in the main survey. Additionally, prior Center analysis found that questions about religious identity can be safely compared between interviewer-administered and self-administered surveys (assuming there are no other differences).

The new survey’s questions about prayer frequency can also be safely compared with the prior studies. The percentage of people who say they pray daily is somewhat higher in the telephone bridge study than in the main survey (by 3 percentage points), and the share of people who say they seldom or never pray is somewhat lower in the bridge study than in the main survey (by 4 points). However, previous Center analysis found little difference in answers to this question between a telephone survey and self-administered surveys. And both the main survey and the companion bridge study suggest that the share of Americans who pray daily has declined since 2014.

Several questions in the RLS ask respondents about personal characteristics, like their age and race. Many of these demographic variables are used to “weight” the survey data to known parameters derived from the U.S. Census Bureau, to make sure that the survey’s sample is representative of the country’s broader population. These kinds of demographic traits are mostly safe to compare with the previous RLS findings.

Here is the complete list of “green” questions that can safely be compared between the new RLS and the previous surveys (refer to the Topline for full results):

  • RELIG-BRANCH (Questions about the respondent’s current religion – Protestant, Catholic, etc.)
  • PRAY (How often do you pray?)
  • BORN (Asked of Christians – Do you think of yourself as a born-again or evangelical Christian?)
  • CHRELIG/CHA3/CHBORN (Questions about the respondent’s religious upbringing – Were you raised Protestant, Catholic, etc.?)
  • SPRELIG/SPA3/SPBORN (Asked of people who are married or living with a partner – Questions about the religious identity of one’s spouse/partner)
  • RACECMB/HISP (Race/ethnicity of the respondent)
  • EDUC_ACS (Highest level of educational attainment; trendable to the 2014 survey but not the 2007 survey, which asked a different question about education)
  • YOBMOD (Used to determine the respondent’s age)
  • NATIVITY/FTHR/MTHR (Summary of information about whether the respondent and the respondent’s parents were born inside or outside of the U.S.)
  • HH1/HH3 (Household size, including how many are ages 18 or older)
  • FERT (How many children have you ever had?)103
  • MARWHEN (Asked of married people – In what year did you get married?)
  • CITIZEN (Are you a citizen of the United States?)
  • HAPPY (How happy are you with your life these days?)
  • CHNG_b (Is having more women in the workforce a change for the better or for the worse?)
  • KIDACT_c (Asked of parents of minor children – Do you homeschool or send children to private religious school?)

Red: Questions we cannot compare with previous Religious Landscape Studies

There are several questions in the 2023-24 RLS that we cannot compare with our previous landscape studies, even though the wording is the same.

When respondents complete surveys by directly talking to another person, they sometimes give more socially desirable responses or avoid potentially controversial responses. This is called “social desirability bias.” The results of the bridge study suggest that this bias may have played a role in responses to some questions.

For example, on a question about whether the country’s growing immigrant population has been a change for the better, a change for the worse, or hasn’t made much difference, the share of U.S. adults who say “change for the worse” is 15 points lower in the telephone bridge study than on the main survey. It seems that completing the survey by talking to another person over the phone may lead some respondents to avoid giving a negative opinion about the growing immigrant population.

The bridge study and previous Pew Research Center analyses also show that the share of people who say they often attend religious services is higher in telephone surveys than in self-administered surveys. As a consequence, the results of our 2023-24 RLS question about frequency of religious attendance cannot be compared with those of the 2007 and 2014 studies.

On other questions, we cannot compare results because the percentages who say they “don’t know” in the phone-based bridge study are significantly higher than in the main study. For example, on a question about political party identification, the share of respondents who say they don’t know or who don’t answer the question is 5 points higher in the bridge study. And in a follow-up question asking those who do not identify as Republicans or Democrats whether they lean Republican or Democratic, the share who say they don’t know or who decline to answer is also higher in the bridge study. Ultimately, the share of respondents who don’t identify with or lean toward either political party is 14 points higher in the bridge study than in the main survey.

Some questions are subject to potential “context effects,” suggesting they may not be comparable with previous instances in which the same question appeared in a different context. For example, the distribution of responses to the 2023-24 survey’s question about the size of the government (asking whether respondents would prefer a bigger government that provides more services or a smaller government that provides fewer services) is very different in the new survey (which finds more support for a bigger government than for a smaller one) than in other Center surveys (which find a relatively even split). In the new RLS, responses to this question might have been influenced by asking it immediately after a question on whether the government provides too little, too much, or about the right amount of assistance to people in need. In the prior RLS, this question was asked in a more neutral context, and so we have decided not to compare the new findings with the old findings.

Finally, we cannot directly compare results about income levels. On all of the surveys, we ask respondents about their total household income. But because our analysis does not adjust for inflation, the value of a $40,000-$50,000 household income, for example, is different today than it was in 2007 or 2014.

Here is a list of the RLS questions we have coded as “red,” meaning they are not comparable with the earlier studies, even though those earlier studies included similar or identical questions (in the survey’s Topline, we show only the 2023-24 results on red questions and not the prior results, since they are not trendable):

  • ATTNDPERRLS (Frequency of attendance at religious services)
  • PARTY/PARTYLN (Political party identification)
  • IDEO (Are your political views conservative, moderate or liberal?)
  • CHNG_a (Whether a growing population of immigrants is a change for the better or for the worse)
  • QB2d (Whether there are absolute standards of right and wrong)
  • GOVSIZE1 (Whether the respondent prefers a bigger government or a smaller government)
  • PRAC_b (Frequency of scripture reading)
  • EXP_a (Frequency of feeling a deep sense of spiritual peace/well-being)
  • EXP_b (Frequency of feeling a deep sense of wonder about the universe)
  • EXP_c (Frequency of feeling a deep sense of gratitude)
  • EXP_g (Frequency of thinking about the meaning/purpose of life)
  • KIDACT_a (Asked of parents of minor children – Do you pray/read scripture with your children?)
  • KIDACT_b (Asked of parents of minor children – Do you send your children to a religious education program?)
  • INC_SDT1 (Household income)
  • ORIENTMOD (Sexual orientation)

Yellow: Questions we can cautiously compare with previous Religious Landscape Studies

Finally, there are some questions that produce results that can be compared with previous surveys, as long as the comparisons are done cautiously.

One category includes “balanced choice” questions in which the main study and the phone-based bridge study get similar results for one of the substantive response options (typically the affirmative option), but slightly different results on the other substantive response option, often due to larger shares of “don’t know” responses and refusals to answer the question on the phone. For example, the difference between those who say “homosexuality should be accepted by society” in the main study and the bridge study is less than 1 point. However, the share of respondents who say they don’t know or who don’t answer the question in the bridge study is 7 points higher than in the main survey. And the share who say “homosexuality should be discouraged by society” is 7 points lower in the bridge study than in the main survey. In other words, the share of respondents who say “homosexuality should be accepted by society” can be safely compared with the prior studies, but the share who say it “should be discouraged” cannot.

Other questions that fall in this category (having similar results on one substantive response option) ask about belief in heaven, belief in hell, and views of churches and religious organizations.

On some questions, responses differ in the degree to which they affirm a response, but the total share who affirm the response, regardless of degree, is similar. For example, on a question about the legality of abortion, the share who say it should be “legal in all cases” is 3 points lower in the bridge study, but the share who say it should be “legal in most cases” is 5 points higher in the bridge study. Taken together, the total share of respondents who say abortion should be legal in all or most cases is just 2 points higher in the bridge study than in the main survey. In our analyses comparing the new survey’s findings with past surveys, we focus on this net share – those who say abortion should be legal all or most of the time.

Here is a table that lists the questions we have deemed “yellow” – cautiously trendable – with a brief explanation of some points readers should keep in mind when interpreting the trends on these questions. In the survey Topline, these questions are all clearly labeled as yellow, and the 2007 and 2014 results are described as “trends for comparison.”


‘Yellow’ trend questions

Question labelConsiderations for interpreting trends
QB2aThis question asks whether homosexuality should be “accepted by society” or “discouraged by society.” The share saying “accepted” is very similar in the main survey and the telephone bridge study, and can be safely compared with results from 2007 and 2014. However, the share saying “discouraged” is higher in the main survey than in the telephone bridge study, and the share who don’t provide an answer is lower in the main survey than in the bridge study. These categories (“Discouraged” and “No answer”) should not be compared with the 2007 or 2014 results.
QB2cThis question asks whether stricter environmental regulations “cost too many jobs and hurt the economy” or are “worth the cost.” The share saying “cost too many jobs and hurt the economy” is slightly higher (by 3 points) in the main survey than in the telephone bridge study, as is the share saying “worth the cost” (by 2 points), while the share who don’t answer the question is lower in the main survey than in the bridge survey (by 6 points). Readers should exercise caution when comparing the absolute value of the substantive responses with the prior studies, but the balance of opinion (more support for “worth the cost” option) is the same in both the main survey and the bridge study.
ABRTLGLThis question asks whether abortion should be “legal in all cases,” “legal in most cases”, “illegal in most cases,” or “illegal in all cases.” The share saying legal in all cases is somewhat higher in the main survey than in the bridge study (by 3 points), but this is offset by the lower share of respondents in the main survey who say legal in most cases (lower than the bridge study by 5 points). The combined share who say abortion should be legal in all/most cases is similar in the main survey and the bridge study, and can be safely compared with the 2007 and 2014 results.
 
However, the combined share saying abortion should be illegal in all/most cases is higher in the main survey than in the bridge study (by 6 points), and the share expressing no opinion is lower in the main survey than in the bridge study (by 5 points). These response options (“Net Illegal in all/most cases” and “No answer”) should not be directly compared with the 2007 and 2014 results. 
GAYMARRThis question asks respondents whether they strongly favor, favor, oppose, or strongly oppose allowing same-sex couples to marry legally. The combined share who say they strongly favor/favor same-sex marriage is very similar in the main survey and the bridge study, and can be compared with the 2014 results (this question was not asked in the 2007 survey).
 
However, the combined share who say they strongly oppose/oppose same-sex marriage is somewhat higher (by 5 points) in the main survey than in the bridge study, while the share who express no opinion is 6 points lower in the main survey than in the bridge study. These response options (“Strongly oppose/Oppose” and “No answer”) should not be directly compared with the previous results.
RELIMPThis question asks respondents how important religion is in their lives. The share of respondents who say it is “very important” is lower in the main survey than in the bridge study (by 6 points). Additionally, the share of respondents who say very important is lower in the main RLS survey than in other recent Center surveys, suggesting the context in which this question was asked in the RLS (after an extended series of questions about religion/spirituality) may have had an effect on responses to this question. Comparisons between the new results and the prior landscape studies should be made cautiously and with these considerations in mind. Refer to Chapter 7 for additional discussion of these issues.
MEMBThis question asks respondents whether they are members of a religious congregation. The results from the main survey are similar to the bridge study, suggesting there is no mode effect on this question. However, the wording of the question is somewhat different in 2023-24 than it was in 2014, and so the trend should be interpreted with some caution.
GOD/GOD2These questions ask respondents whether they believe in God or a universal spirit, and then (in a follow-up question) how certain they are about their belief. The share who say they believe in God/a universal spirit with absolute certainty is similar in the main survey and in the bridge study, as is the share who say they believe in God/a universal spirit but are not absolutely certain. These categories can be safely compared with the 2007 and 2014 results.
 
The share who say they do not believe in God/a universal spirit is higher in the main survey than in the bridge study (by 4 points), and should not be compared with the previous results. However, both the main survey and the bridge study suggest that the share who do not believe in God or a universal spirit is higher now than in 2007. (The share expressing no opinion is slightly lower in the main survey than in the bridge study.)
HVNThis question asks respondents whether they believe in heaven. The share saying yes is similar in the main survey and the bridge study, and hence can be safely compared with the 2007 and 2014 results.
 
However, the share saying no is higher in the main survey than in the bridge study, while the share expressing no opinion is lower in the main survey than in the bridge study. These response options (“No” and “No answer”) should not be compared with the previous results.
HLLThis question asks respondents whether they believe in hell. The share saying yes is similar in the main survey and in the bridge study, and can be safely compared with the 2007 and 2014 results.
 
However, the share saying no is higher in the main survey than in the bridge study, while the share expressing no opinion is lower in the main survey than in the bridge study. These response options (“No” and “No answer”) should not be compared with the previous results.
PRAC_aThis question asks respondents how often they participate in prayer groups or scripture-study groups. The share saying “at least once a week” is slightly lower in the main survey than in the bridge study (by 3 points), as is the share saying “once or twice a month” (also by 3 points). Meanwhile, the share saying “never” is higher in the main survey than in the bridge study (by 4 points).
 
However, both the main survey and the bridge study suggest that the share who do this weekly has declined, while the share who never participate in these kinds of groups has risen. That is, in these categories (“Weekly” and “Never”), the difference between the main survey and the bridge study on this question is appreciably smaller than the difference between the main survey and the 2014 findings. Thus, it is reasonable to conclude that the share of adults who participate weekly in prayer groups or scripture-study groups has declined since the 2014 RLS, although not necessarily by the full amount of the difference seen in results.
MARITALThis question asks respondents about their current marital status. The share of respondents in the main survey who are married is in line with U.S. Census Bureau estimates. But the share of married respondents is substantially higher in the main survey than in the bridge study, and so comparisons between the new survey and previous estimates of the shares of people in various religious groups who are married should be made with caution.
CHILDRENThis question asks respondents whether they are the parent or guardian of any children under the age of 18 living in their home. Fewer respondents say no (by 4 points) in the main survey than in the bridge study, while the share who say yes and the share who decline to answer are each slightly higher in the main survey than the bridge study.
RELINSTa-gThese six questions ask respondents whether they agree or disagree with each of six statements about religious organizations. Three statements are positive (e.g., “religious organizations protect and strengthen morality in society”) and three are negative (e.g., “religious organizations focus too much on rules.”)
 
On four of the six questions, the shares who say they agree are similar in the main survey and the bridge study. On the other two questions (asking whether religious organizations “bring people together and strengthen community bonds” and whether religious organizations “play an important role in helping the poor and needy”), the shares of respondents saying they agree are somewhat lower in the main survey than in the bridge study (by 5 points and 4 points, respectively). On these two items, both the main survey and the bridge study suggest that the shares who agree have declined over time. And so we think it is safe to cautiously compare the share expressing agreement in the new survey with the shares expressing agreement in the previous surveys.
 
However, the shares expressing disagreement are higher in the main survey than in the bridge study on all six items, and the shares expressing no opinion are lower in the main survey than in the bridge study on four items. Thus, we recommend against drawing direct comparisons between the new survey and the previous surveys on these response options (“Disagree” and “No answer”).
GENDERThe 2023-24 survey includes the following question: “Do you describe yourself as a man, a woman, or in some other way?” This approach to measuring gender is different from both the 2007 and 2014 surveys. In the 2007 survey, respondents were not directly asked about their gender; rather, the telephone interviewers were asked to use their judgment to determine whether each respondent was a man or a woman, and to record this judgment at the end of the interview.
 
In the 2014 survey, respondents were asked, “Are you male or female?” If they declined to answer or volunteered another response, the respondent’s gender was recorded based on the interviewer’s observation.
 
Despite these differences in measurement approaches, we think basic comparisons of the gender composition of religious groups (especially the ratio of men to women) can be made cautiously.

PEW RESEARCH CENTER


Bridge study methodology

The bridge study was conducted by telephone in English and Spanish from Aug. 7 to Nov. 6, 2023, among a nationally representative sample of 1,519 U.S. adults. Of those, 1,357 were completed via cellphone and 162 via landline telephone. Like the main RLS, the bridge study was conducted for Pew Research Center by NORC at the University of Chicago.

Both the cellphone and landline samples were provided by Marketing Systems Group (MSG). Sampled numbers were dialed up to five times by an interviewer to attempt to complete the survey. 

After accounting for the complex sample design and loss of precision due to weighting, the national margin of sampling error for the bridge study is plus or minus 3.3 percentage points at the 95% level of confidence.

The research plan for the RLS – including the bridge study – was submitted to NORC’s institutional review board (IRB), which is an independent committee of experts that specializes in helping to protect the rights of research participants. This research was declared exempt under category 2 of IRB code (approval #: FWA 00000142).

Sample design

The bridge study employed a dual-frame (cellphone and landline) random-digit-dialing (RDD) approach to yield a nationally representative sample to produce national estimates. Unlike the primary RLS study, it was not designed to produce state or metropolitan statistical area-level estimates.

Both frames (cellphone and landline) were stratified by census region to account for differential nonresponse. A total of 122,118 cellphone numbers and 89,017 landline numbers were drawn with the aim of yielding at least 10% of interviews from the landline sample.

The cellphone sample was drawn by MSG, using their Cell-WINS activity flags. The Cell-WINS service appends activity code information to each sampled record, flagging inactive and business cellphone lines. Any number determined to be inactive or a business was discarded prior to data collection and is not included in the sample counts in this report.

The landline sample was also drawn by MSG from 1+ 100 banks and prescreened to flag business numbers. These numbers were not dialed but are included in the sample as not eligible.104

Data collection

Sampled telephone numbers that were not removed during prescreening were called as many as five times in an effort to obtain a completed interview. Calls were staggered over times of day and days of the week to maximize the chance of making contact with potential respondents.

In the landline sample, interviewers asked to speak to the adult in the household with the next birthday. In the cellphone sample, interviews were conducted with the person who answered the phone provided that the person was age 18 or older. All respondents were offered a $10 gift card if they completed the survey.

While the bridge study mimicked the main RLS questionnaire, several questions were cut from the bridge study. Telephone interviews generally take longer to complete than web or paper interviews, and the cuts were made to keep the bridge study as short as possible. The omitted questions included those that had not previously been asked in prior iterations of the RLS and were thus not needed to assess how the results of the main survey can be compared with results from the prior landscape studies. The bridge survey took a median time of 33 minutes to complete.

Weighting

The weighting process begins with an initial base weight that accounts for each telephone number’s probability of selection from its respective sampling frame. The base weights for known eligible phone numbers were then adjusted to account for the expected proportion of eligible phone numbers among those with unknown eligibility.

For cases from the landline frame with a completed interview, the eligibility adjusted weight is multiplied by the number of adults in the household (max value of 3) to account for their probability of selection within the household. For cases from the cellphone frame, no adjustment is made as there is assumed to be only one eligible adult per cellphone.

Next, a frame membership adjustment was applied to account for individuals who live in a household with both a working landline and cellphone. Their weight was divided in half to account for their chance of selection in either frame.

Table showing the 2023-24 bridge study raking dimensions

The final step in the adult weighting was to calibrate the adult weights for respondents who completed the survey, so that the calibrated weights (i.e., the estimate of the number of adults) aligned with benchmarks for noninstitutionalized U.S. adults (refer to the benchmarks listed in the accompanying table). For raking dimensions that include the cross-classification of two demographic variables, cells with fewer than 30 completed interviews were collapsed with neighboring cells to prevent the creation of extreme weight values and to ensure the convergence of the raking process.

Response rates

NORC assigned all sampled cases a result code and used these codes to compute response rates consistent with AAPOR definitions. The AAPOR RR3 response rate for the bridge study was 7.0% and 1.9% for the cellphone and landline samples, respectively.105

Table showing the AAPOR disposition codes

Appendix B: Classification of Protestant denominations

In the Religious Landscape Study (RLS), we group Protestant respondents into one of three “traditions” – the evangelical tradition, mainline tradition or the historically Black Protestant tradition – based on the specific denomination they identify with.

For instance, all respondents who identify with the Southern Baptist Convention are classified as members of the evangelical Protestant tradition; all who identify with the American Baptist Churches USA are categorized as members of the mainline Protestant tradition; and all who say they belong to the National Baptist Convention, USA, are classified as members of the historically Black Protestant tradition.

Protestant respondents who give a vague answer to questions about their denomination (e.g., “I am just a Baptist” or “I am just Methodist” or even “I am just a Christian”) are placed into one of the three Protestant traditions based on their race and/or their response to a question that asks if they think of themselves as a “born-again or evangelical Christian.”

Overall, 36% of Protestants (including 35% of those in the evangelical tradition, 32% of those in the mainline tradition, and 50% of those in the historically Black Protestant tradition) gave a vague denominational identity and were thus categorized into one of the three Protestant traditions based on their race, their born-again status, or both. 

The list below reports all the denominational identities given by Protestant respondents in the 2023-24 RLS – including all the denominations offered to respondents as explicit answer choices in the survey, as well as all the responses that were volunteered by respondents (who were given the opportunity to write in their religious identity if they chose not to check one of the boxes provided in the survey). The list shows which identities were placed in each Protestant tradition, and describes whether and how we used race and/or born-again status in categorizing responses.

Baptist

Baptist family in the evangelical Protestant tradition

Southern Baptist Convention
Independent Baptist (if not Black)

Volunteered responses

American Baptist Association
Baptist General Association of Virginia
Baptist General Convention of Texas
Converge/Baptist General Conference/Swedish Baptist
Free Will Baptist
Full Gospel Baptist (if not Black)
General Association of Regular Baptists/Regular Baptist
Missionary Baptist/Baptist Missionary Association (if not Black)
Multiple Baptist mentions in the evangelical tradition
North American Baptist
Pentecostal Baptist (if not Black)
Primitive Baptist (if not Black)
Reformed Baptist/Calvinist Baptist
Separate Baptist/Separate Baptist in Christ
Venture Church Network/Conservative Baptist Association
Baptist, not further specified (if born-again/evangelical and not Black)
Baptist – Other/Refused/Gave name and/or location of congregation (if born-again/evangelical and not Black)

Baptist family in the mainline Protestant tradition

American Baptist Churches USA

Volunteered responses

Cooperative Baptist Fellowship/Baptist Alliance
Liberal Baptist/Moderate Baptist/Progressive Baptist
Baptist, not further specified (if not born-again/evangelical and not Black)
Baptist – Other/Refused/Gave name and/or location of congregation (if not born-again/evangelical and not Black)

Baptist family in the historically Black Protestant tradition

National Baptist Convention, USA
National Baptist Convention of America
Progressive National Baptist Convention
Independent Baptist (if Black)

Volunteered responses

Black Baptist
Full Gospel Baptist (if Black)
Fundamental Baptist Fellowship Association
Missionary Baptist/Baptist Missionary Association (if Black)
Multiple Baptist mentions in the historically Black Protestant tradition
Pentecostal Baptist (if Black)
Primitive Baptist (if Black)
Baptist, not further specified (if Black)
Baptist – Other/Refused/Gave name and/or location of congregation (if Black)

Methodist

Methodist family in the evangelical Protestant tradition

Global Methodist Church

Volunteered responses

Congregational Methodist
Independent Methodist (if not Black)
Primitive Methodist
Traditional Methodist
Methodist, not further specified (if born-again/evangelical and not Black)
Methodist – Other/Refused/Gave name and/or location of congregation (if born-again/evangelical and not Black)

Methodist family in the mainline Protestant tradition

United Methodist Church

Volunteered responses

Methodist, not further specified (if not born-again/evangelical and not Black)
Methodist – Other/Refused/Gave name and/or location of congregation (if not born-again/evangelical and not Black)

Methodist family in the historically Black Protestant tradition

African Methodist Episcopal Church (AME)
African Methodist Episcopal Zion Church (AME Zion)
Christian Methodist Episcopal Church

Volunteered responses

Independent Methodist (if Black)
Multiple Methodist mentions in the historically Black Protestant tradition
Methodist, not further specified (if Black)
Methodist – Other/Refused/Gave name and/or location of congregation (if Black)

Nondenominational Protestant

Nondenominational in the evangelical Protestant tradition

Nondenominational evangelical
Nondenominational fundamentalist
Nondenominational charismatic
Nondenominational – interdenominational (if born-again/evangelical)

Volunteered responses

Association of Bridge Churches
Community church (if born-again/evangelical)
Federated or union church (if born-again/evangelical)
Multiple nondenominational mentions in the evangelical tradition
Nondenominational Cowboy Church (if born-again/evangelical and not Black)
Nondenominational electronic ministries
Nondenominational, not further specified (if born-again/evangelical and not Black)
Nondenominational – Other/Refused/Gave name and/or location of congregation (if born-again/evangelical and not Black)

Nondenominational in the mainline Protestant tradition

Nondenominational – interdenominational (if not born-again/evangelical)

Volunteered responses

Community Church (if not born-again/evangelical)
Federated or union church (if not born-again/evangelical)
Liberal nondenominational
Nondenominational Cowboy Church (if not born-again/evangelical and not Black)
Nondenominational, not further specified (if not born-again/evangelical and not Black)
Nondenominational – Other/Refused/Gave name and/or location of congregation (if not born-again/evangelical and not Black)

Nondenominational in the historically Black Protestant tradition

Volunteered responses

Black nondenominational
Nondenominational Cowboy Church (if Black)
Nondenominational, not further specified (if Black)
Nondenominational – Other/Refused/Gave name and/or location of congregation (if Black)

Lutheran

Lutheran in the evangelical Protestant tradition

Lutheran Church-Missouri Synod

Volunteered responses

Apostolic Lutheran Church of America/Old Apostolic Lutheran Church/Laestadianism
Church of the Lutheran Confession
Free Lutheran
Lutheran Brethren
Lutheran Congregations in Mission for Christ
North American Lutheran Church
Wisconsin Evangelical Lutheran Synod (WELS)
Lutheran, not further specified (if born-again/evangelical)
Lutheran – Other/Refused/Gave name and/or location of congregation (if born-again/evangelical)

Lutheran in the mainline Protestant tradition

Evangelical Lutheran Church in America (ELCA)

Volunteered responses

American Lutheran Church (ALC)/Lutheran Church in America (LCA)
Lutheran, not further specified (if not born-again/evangelical)
Lutheran – Other/Refused/Gave name and/or location of congregation (if not born-again/evangelical)

Presbyterian

Presbyterian in the evangelical Protestant tradition

Presbyterian Church in America

Volunteered responses

Associate Reformed Presbyterian
Communion of Reformed Evangelical Churches
Cumberland Presbyterian
ECO: A Covenant Order of Evangelical Presbyterians
Evangelical Presbyterian
Independent Presbyterian
Orthodox Presbyterian
Reformed Presbyterian
Presbyterian, not further specified (if born-again/evangelical)
Presbyterian – Other/Refused/Gave name and/or location of congregation (if born-again/evangelical)

Presbyterian in the mainline Protestant tradition

Presbyterian Church (USA)

Volunteered responses

Presbyterian, not further specified (if not born-again/evangelical)
Presbyterian – Other/Refused/Gave name and/or location of congregation (if not born-again/evangelical)

Pentecostal

Pentecostal in the evangelical Protestant tradition

Assemblies of God
Church of God (Cleveland, Tennessee)

Volunteered responses

Apostolic (if not Black)
Assemblies of the Lord Jesus Christ
Calvary/Calvary Chapel
Christian Assemblies
Christian City Church International
Church of God of Kentucky
Church of God of Prophecy
Electronic ministries (if not Black)
Elim/Elim Fellowship
Evangelical Pentecostal
Foursquare
Free Will Pentecostal
Full Gospel Pentecostal (if not Black)
Independent Pentecostal/Nondenominational Pentecostal (if not Black)
La Luz del Mundo
Multiple Pentecostal mentions in the evangelical tradition
Open Bible/Open Bible Churches
Pentecostal Church of God
Pentecostal Holiness
United Pentecostal/United Pentecostal Church International
Vineyard/Vineyard Churches
Pentecostal, not further specified (if not Black)
Pentecostal – Other/Refused/Gave name and/or location of congregation (if not Black)

Pentecostal in the historically Black Protestant tradition

Church of God in Christ (COGIC)

Volunteered responses

Apostolic (if Black)
Church of God by Faith
Church of Pentecost/Church of Pentecost USA
Electronic ministries (if Black)
Full Gospel Pentecostal (if Black)
Independent Pentecostal/Nondenominational Pentecostal (if Black)
Pentecostal Assemblies of the World
Redeemed Christian Church of God
Pentecostal, not further specified (if Black)
Pentecostal – Other/Refused/Gave name and/or location of congregation (if Black)

Episcopalian/Anglican

Episcopalian in the evangelical Protestant tradition

Volunteered responses

Anglican Church in North America
Evangelical Anglican/Evangelical Episcopalian
Independent Anglican
Reformed Episcopal Church
Episcopalian/Anglican, not further specified (if born-again/evangelical)
Episcopalian/Anglican – Other/Refused/Gave name and/or location of congregation (if born-again/evangelical)

Episcopalian in the mainline Protestant tradition

Episcopal Church

Volunteered responses

Anglican/Anglican Church/Church of England
Episcopalian/Anglican, not further specified (if not born-again/evangelical)
Episcopalian/Anglican – Other/Refused/Gave name and/or location of congregation (if not born-again/evangelical)

Restorationist

Restorationist in the evangelical Protestant tradition

Church of Christ/Churches of Christ

Volunteered responses

Church of Christ/Disciples of Christ, not further specified (if born-again/evangelical)
Church of Christ/Disciples of Christ – Other/Refused/Gave name and/or location of congregation (if born-again/evangelical)

Restorationist in the mainline Protestant tradition

Disciples of Christ

Volunteered responses

Church of Christ/Disciples of Christ, not further specified (if not born-again/evangelical)
Church of Christ/Disciples of Christ – Other/Refused/Gave name and/or location of congregation (if not born-again/evangelical)

Congregational

Congregational in the evangelical Protestant tradition

Volunteered responses

Conservative Congregational Christian Conference
Evangelical Congregational
Independent Congregational
National Association of Congregational Christian Churches
Congregational, not further specified (if born-again/evangelical)
Congregational – Other/Refused/Gave name and/or location of congregation (if born-again/evangelical)

Congregational in the mainline Protestant tradition

United Church of Christ

Volunteered responses

Liberal Congregational/Progressive Congregational
Congregational, not further specified (if not born-again/evangelical)
Congregational – Other/Refused/Gave name and/or location of congregation (if not born-again/evangelical)

Holiness

Holiness in the evangelical Protestant tradition

Church of the Nazarene
Free Methodist Church

Volunteered responses

Apostolic Holiness Church (if not Black)
Christian and Missionary Alliance/Alliance
Church of God (Anderson, Indiana)/Church of God Ministries
Church of God of the Union Assembly
Holiness Baptist (if not Black)
Independent Holiness (if not Black)
Missionary Church/Missionary Church USA
Salvation Army
Wesleyan/Wesleyan Church/Wesleyan Methodist Church/Wesleyan Holiness Church
Holiness, not further specified (if not Black)
Holiness – Other/Refused/Gave name and/or location of congregation (if not Black)

Holiness in the historically Black Protestant tradition

Volunteered responses

Apostolic Holiness Church (if Black)
Church of the Living God International
Holiness Baptist (if Black)
Independent Holiness (if Black)
Holiness, not further specified (if Black)
Holiness – Other/Refused/Gave name and/or location of congregation (if Black)

Reformed

Reformed in the evangelical Protestant tradition

Christian Reformed Church

Volunteered responses

Acts 29
Calvinist (if born-again/evangelical)
Evangelical Reformed
Protestant Reformed Church/Protestant Reformed Churches in America
Reformed Church in the United States/German Reformed
United Reformed Churches in North America
Reformed, not further specified (if born-again/evangelical)
Reformed – Other/Refused/Gave name and/or location of congregation (if born-again/evangelical)

Reformed in the mainline Protestant tradition

Reformed Church in America

Volunteered responses

Calvinist (if not born-again/evangelical)
Reformed, not further specified (if not born-again/evangelical)
Reformed – Other/Refused/Gave name and/or location of congregation (if not born-again/evangelical)

Adventist

Adventist in the evangelical Protestant tradition

Volunteered responses

Advent Christian/Advent Christian Church
Church of God (Seventh Day)
Grace Communion International/Worldwide Church of God
Seventh-day Adventist
United Church of God

Anabaptist

Anabaptist in the evangelical Protestant tradition

Volunteered responses

Alliance of Mennonite Evangelical Congregations
Amish
Brethren, not further specified (if born-again/evangelical)
Brethren in Christ
Church of God in Christ, Mennonite
Covenant Brethren
Grace Brethren
Mennonite, not further specified
Mennonite Brethren
Old Order Mennonite
United Brethren in Christ/United Brethren
Other Anabaptist (if born-again/evangelical)

Anabaptist in the mainline Protestant tradition

Volunteered responses

Brethren, not further specified (if not born-again/evangelical)
Church of the Brethren
Moravian Church
Other Anabaptist (if not born-again/evangelical)

Pietist

Pietist in the evangelical Protestant tradition

Volunteered responses

Evangelical Covenant Church/Covenant
Evangelical Free Church/Free Church/Evangelical Free Mission Church

Friends

Friends in the evangelical Protestant tradition

Volunteered responses

Evangelical Friends Church/Evangelical Friends

Friends in the mainline Protestant tradition

Volunteered responses

Friends/Quaker
Society of Friends

Other evangelical/fundamentalist

Other evangelical/fundamentalist in the evangelical Protestant tradition

Volunteered responses

Bible Church/Gospel Church/Missionary Church
Born-again/Bible believer, etc.
Charismatic/Spirit-filled, etc.
Evangelical
Fundamentalist
Plymouth Brethren

Other/Nonspecific Protestant

Other/Nonspecific in the evangelical Protestant tradition

Volunteered responses

Electronic ministries (if born-again/evangelical and not Black)
Home church (if born-again/evangelical and not Black)
Just a Christian (if born-again/evangelical and not Black)
Just a Protestant (if born-again/evangelical and not Black)
Mixed Protestants (if born-again/evangelical and not Black)
Protestant – no particular denomination (if born-again/evangelical and not Black)
Sabbath keeper (if not Black)
Gave name and/or location of congregation (if born-again/evangelical and not Black)
Other/Not interpretable/Refused (if born-again/evangelical and not Black)

Other/Nonspecific in the mainline Protestant tradition

Volunteered responses

Electronic ministries (if not born-again/evangelical and not Black)
Ex-vangelical
Home church (if not born-again/evangelical and not Black)
Just a Christian (if not born-again/evangelical and not Black)
Just a Protestant (if not born-again/evangelical and not Black)
Liberal Christian
Mar Thoma
Metropolitan Community Church
Mixed Protestants (if not born-again/evangelical and not Black)
Protestant – no particular denomination (if not born-again/evangelical and not Black)
Gave name and/or location of congregation (if not born-again/evangelical and not Black)
Other/Not interpretable/Refused (if not born-again/evangelical and not Black)

Other/Nonspecific in the historically Black Protestant tradition

Volunteered responses

Electronic ministries (if Black)
Home church (if Black)
Just a Christian (if Black)
Just a Protestant (if Black)
Mixed Protestants (if Black)
Protestant – no particular denomination (if Black)
Sabbath keeper (if Black)
Gave name and/or location of congregation (if Black)
Other/Not interpretable/Refused (if Black)

Appendix C: Comparing the Center’s religion trends with those of other major surveys

Pew Research Center has tracked trends in American religion since 2007 via the Religious Landscape Study (RLS) and since 2020 using the annual National Public Opinion Reference Survey (NPORS). But the RLS and NPORS are hardly the only sources of survey data on religion in the United States. Among others, the General Social Survey (GSS) and Gallup also ask questions about Americans’ religious identity, beliefs and practices – and have done so for decades.106

Surveys by Pew Research Center, GSS and Gallup all find declines on several religion measures over the past two decades, including a decline in the percentage of U.S. adults who identify as Christians and a corresponding rise in the percentage who say they have no religion. But the data from these three sources is less clear and uniform about what has happened in the last few years, since about 2020.

This appendix explores the long-term and short-term patterns in RLS, GSS and Gallup polls on questions about:

  • Identifying as Christian
  • Identifying as religiously unaffiliated
  • Attending religious services
  • Considering religion personally important
  • Praying daily
  • Believing in God

It also explores trends in religion by birth cohort, and provides methodological details about the GSS and Gallup surveys.

About the surveys

The GSS is a national survey of American adults conducted by NORC at the University of Chicago since 1972. It generally has been conducted every two years since the 1990s. Through 2018, GSS data was collected mostly through in-person interviews. Due to the COVID-19 pandemic, the GSS was not fielded in 2020. The 2021 GSS was conducted mainly online, supplemented by telephone.

The 2022 GSS was administered to respondents using three modes: in person, online and by phone.

Gallup also asks questions about religion. Although Gallup has an online panel, most interviews for its U.S. polls are still conducted by telephone. 

The Center’s 2023-24 Religious Landscape Study was fielded from July 17, 2023, to March 4, 2024, and has a sample size of 36,908. Respondents were given the choice to complete the survey online, by mail or over the phone with an interviewer. The 2007 and 2014 landscape studies were conducted entirely by telephone and included nationally representative samples of around 35,000 respondents each.

These organizations do not always measure the same religious topics, nor do they employ identical methods or question wording. In addition, the Center and the GSS have made “mode shifts” in recent years, switching from having a live person ask the questions (and record the answers) to administering at least some of their surveys online. Mode shifts can affect how respondents answer even identically worded survey questions. Consequently, this appendix focuses mostly on the overall direction of the trends.

Share of U.S. adults who are Christian

For many years, all three data sources agreed on the broad trend: The share of Americans who identify as Christian (of all varieties) was declining. In the 1970s, both Gallup and the GSS found that around nine-in-ten U.S. adults were Christian. By 2014, both Gallup and the GSS found that Christians made up 73% of the adult population, and the 2014 RLS estimate was 71%.107

Line chart showing trends in the share of Americans who are Christian

In recent years, results from Pew Research Center surveys indicate that the share of Americans who say they are Christian may be leveling off. The 2023-24 RLS finds that Christians make up 62% of U.S. adults. That is clearly lower than in the 2007 and 2014 landscape surveys – in line with the long-term trend – but in the middle of recent annual estimates from the Center’s National Public Opinion Reference Survey. This survey (NPORS) has found the Christian share hovering between 60% and 64% each year since 2020. Refer to Chapter 1 for more about religious affiliation in NPORS.

Gallup, meanwhile, consistently found between 69% and 71% of U.S. adults identifying as Christian between 2017 and 2022, with no clear decline over that period. In 2023, Gallup’s figure ticked downward to 68%.

The GSS found that 62% of Americans identified as Christian in 2021, and that 64% did so in 2022. It is difficult to say, though, whether the GSS finds the same kind of leveling off in the Christian share of the population that is evident in Pew Research Center surveys. Both the 2021 and 2022 GSS produced substantially lower estimates of the Christian share of the population compared with the 2018 GSS. But the GSS underwent major changes between 2018 and 2021/2022, which complicates comparisons across waves. In 2018 and prior years, the GSS was mostly conducted face-to-face, whereas the 2021 GSS was conducted online with a telephone supplement, and the 2022 GSS was done using three modes: in person, online and by phone.

Additionally, the 2021 and 2022 figures are the only two GSS data points available after 2018 (as of the time this appendix was written in January 2025). The GSS was not conducted in 2019, 2020 or 2023, and GSS results for 2024 have not yet been released.

Share of U.S. adults who are religiously unaffiliated

All three polling organizations have found a similar rise in the share of religiously unaffiliated adults, also known as religious “nones” over the past few decades. These are people who identify as atheist, agnostic or as “nothing in particular” in Pew Research Center surveys, and as having “no religion” in the GSS and Gallup surveys.

Line chart showing trends in the share of Americans who are religiously unaffiliated

In the 1970s, Gallup and the GSS showed that about one-in-ten or fewer U.S. adults chose not to identify with any religion. By 2014, Gallup’s estimate of the size of the unaffiliated population had risen to 16%. The GSS found a higher share at 21%, and the 2014 Religious Landscape Study reported that the proportion was 23%.108

More recently, Pew Research Center surveys suggest that the rise of the “nones” may be slowing. Between 2019 and 2024, the Center’s surveys consistently find that 28% or 29% of U.S. adults are religious “nones.” The only exception is the 2022 NPORS, which put the religiously unaffiliated figure at 31%. Read Chapter 1 for more about religious affiliation in NPORS.

Gallup’s estimate of the size of the religiously unaffiliated population held fairly steady between 2017 and 2022, at 20% or 21% each year. In 2023, it was 22%.

The GSS tracked a steady rise in the religiously unaffiliated share of the population from the 2000s through the 2010s and reported that 23% of Americans said they had no religion as of 2018. There was no GSS in 2020. In the 2021 GSS, the share who identified as religiously unaffiliated jumped to 28%, and in 2022 it was 27%. These higher figures may be a result of the GSS’s switch in mode from mostly face-to-face interviews before the COVID-19 pandemic to a mix of in-person, online and phone modes afterward.

Share of U.S. adults who attend religious services

Both Gallup and the GSS show a long-term decline in attendance at churches and other houses of worship. Because of the “mode switch” from telephone polling to interviewing respondents mostly online and on paper, Pew Research Center does not have a long-term trend on this measure.

Line chart showing trends in the share of Americans who attend religious services at least monthly

In recent years, Gallup’s telephone polls show a continuing decline in the percentage of U.S. adults who regularly attend religious services, while the GSS – like the Center – has made methodological changes that cloud the picture.

Between 2007 and 2014, the Center’s first two Religious Landscape Studies found a dip in the share of Americans who said they attended religious services at least monthly, from 54% to 50%. However, we cannot directly compare those figures with the new RLS, because of changes in how we asked about attendance and in how the survey was administered.

In the wake of the COVID-19 pandemic, the new RLS asks about religious service attendance by posing two questions, asking Americans how often they attend religious services in person and, separately, how often they watch services online or on TV. (The figures shown in the accompanying chart are responses to the question specifying attendance in person.)

In 2007 and 2014, the RLS asked a single question – “How often do you attend religious services?” – without differentiating between virtual and in-person participation. In addition, the 2007 and 2014 landscape surveys were conducted entirely by telephone, while the 2023-24 survey was conducted mainly online and on paper. Research shows that telephone surveys tend to produce higher estimates of religious attendance than web/paper surveys do.

Because of these changes, the results of the 2023-24 RLS on religious service attendance are not directly comparable with the prior landscape studies. What might appear to be a sharp drop from 50% of U.S. adults describing themselves as regular (at least monthly) attenders in 2014 to 33% describing themselves that way in 2023-24 does not necessarily reflect a real change in behavior. The difference between the two surveys is caused, at least in part, by changes in the way they were conducted.

Like the RLS, the GSS has changed its methods in recent years. Through 2018, it consisted mostly of in-person interviews, but the 2021 GSS was conducted online, and in 2022 the GSS was available to respondents in three modes: in-person, online and by phone.

When the GSS first started asking about religious service attendance in 1972, 55% of Americans said they attended services at least monthly. In 2006 and 2008, the GSS found that 45% and 46%, respectively, attended religious services monthly, as did 42% in 2014. In the 2021 survey – which was conducted online during the COVID-19 pandemic and potentially subject to period and mode effects – and in the 2022 survey, the GSS found that 32% of U.S adults attended religious services monthly or more often.

Gallup’s telephone polls also have reported a steady long-term decline in monthly attenders, from 58% in 1992 to 53% in 2007 and 49% in 2014. Over the last five years or so, Gallup found a continuation of the downward trend, from 45% in 2019 to 41% in 2023.

Share of U.S. adults who consider religion important to them

Starting in the early 1990s, Gallup found that nearly six-in-ten Americans said religion was very important to them. That figure began dropping in the 2000s, falling to 53% in 2014 and 45% in 2023.

Line chart showing trends in the share of Americans who consider religion ‘very important’

In Pew Research Center’s 2007 RLS, 56% of Americans said religion was very important in their lives. That figure dipped to 53% in 2014 and then fell to 38% in the latest RLS. However, results from the Center’s NPORS indicate that the share of Americans who consider religion to be very important may have leveled off in recent years, at 41% in 2021, 41% in 2022, 42% in 2023, and 42% in 2024. The gap between the 2023-24 RLS and the results from the recent NPORS may be due to “context effects.” In other words, it’s possible that the order of questions in the RLS effectively prompts respondents to think about their religious identity, beliefs and practices before asking them how important religion is in their lives. NPORS contains fewer questions about religious beliefs and practices, and therefore may elicit a different response about the importance of religion in a respondent’s life.

Additionally, responses to the question about the importance of religion – like the question about attendance at religious services – may be affected by the change in survey mode. Unlike the 2007 and 2014 religious landscape surveys, which were conducted by telephone, the new RLS was conducted primarily online and on paper. The NPORS series, conducted annually since 2020, also is administered mostly online and on paper.

Line chart showing trends in the share of Americans who say they are strongly affiliated with their religion in the GSS

A companion study conducted alongside the new RLS suggests that people are somewhat more inclined to say religion is very important in their lives when speaking to a live interviewer over the telephone than when reading questions by themselves and responding online or on paper. People taking surveys sometimes give more socially desirable answers when talking with another person, though the size and direction of this “mode effect” can vary, depending on the question.109

However, the percentage of Americans who say religion is very important in their lives was already slipping before Pew Research Center transitioned to online and paper surveys, and the mode effect on this question does not appear to be big enough to account for the entire decline since 2014.

The General Social Survey does not have a long-term trend question about the importance of religion in one’s life. However, it has a different question that asks adults who identify with a religion: “Would you call yourself a strong [religious preference, e.g., Catholic] or not a strong [religious preference, e.g., Catholic]?” Using this measure, the GSS finds a slight long-term decline in the strength of religious affiliation, though it is less steep than the drop in the importance of religion measured in Gallup polls and Pew Research Center’s landscape studies.

In the 1974 GSS, 39% of U.S. adults said their religious identity was strong. This figure ticked up slightly by the early 1980s, when the GSS found the share of Americans expressing a strong religious identity hovering in the low 40% range (42% in 1983, 44% in 1984). In 2016, 35% of GSS respondents expressed a strong religious identity, as did 34% in 2018.

In 2021, 26% of GSS respondents expressed a strong religious identity, as did 31% in 2022. However, it is hard to know whether these recent estimates constitute a decline since the earlier GSS readings or were produced by the changes in GSS methodology.

Share of U.S. adults who pray daily

The GSS asks, “About how often do you pray? Several times a day, once a day, several times a week, once a week, less than once a week, or never?” In a similar vein, the RLS asks, “Outside of religious services, how often do you pray? Several times a day, once a day, a few times a week, once a week, a few times a month, seldom or never?”

Line chart showing trends in the share of Americans who pray at least once a day

Between 1983 and 2018, the GSS typically found that the share saying they pray daily or more often hovered between 49% and 58%, depending on the year. If anything, the GSS suggests that the share of people who pray daily may have risen over the period from 1983 to 2018. Both the 2021 and 2022 GSS obtained lower estimates of daily prayer than any previous GSS, but here again, it is hard to know whether this recent data reflects actual declines in the public’s prayerfulness or, instead, is an artifact of changes in the GSS methodology.

In 2007, the RLS found that 58% of U.S. adults said they prayed at least on a daily basis. In 2014, the RLS found that 55% of Americans prayed daily, and the 2023-24 RLS finds that 44% of U.S. adults say they pray at least once a day. Pew Research Center’s NPORS suggests that since 2021, the share of Americans who pray daily may have leveled off, hovering between 44% and 46% each year since 2021.

Share of U.S. adults who in believe in God

Gallup polls have asked about belief in God in a variety of ways, but it has a particularly long trend on a question that asks simply, “Do you believe in God? Yes/No.” Using this wording, Gallup found that 92% of U.S. adults believed in God in 2011, which dropped to 86% in 2014 and 81% in 2022.

Line chart showing trends in the share of Americans who believe in God or a universal spirit

In the GSS, just over 90% of respondents in 1988 and 1991 said they believe in God.110 By 2016 and 2018, just under 90% of GSS respondents said they believe in God. The 2021 and 2022 GSS surveys produced lower estimates of belief in God compared with prior GSS surveys, perhaps partly owing to changes in the GSS methodology.

The 2007 RLS found that 92% of Americans said they “believe in God or a universal spirit,” a share that declined to 89% in 2014 and to 83% in 2023-24. Because Pew Research Center’s annual NPORS does not ask about belief in God, the Center does not have comparable data on whether belief in God has been steady, rising or falling in just the last five years.

Trends in religion by birth cohort

Both the GSS and Pew Research Center generally have found that younger Americans are less religious than older Americans by a couple of traditional measures. For example, in surveys conducted recently (in the early 2020s), the GSS finds that 36% of Americans who are now between the ages of 20 and 24 say they have no religion, compared with just 14% of those ages 74 or older.

Line chart showing the share of U.S. adults who are religiously unaffiliated by birth cohort in the GSS

Moreover, the long-running GSS can be used to analyze how birth cohorts (i.e., people born in the same years) have changed as they have aged. Most birth cohorts have tended to enter adulthood with a somewhat lower level of religious affiliation than the previous (older) cohort had when it came of age.

For example, surveys conducted in the early 1970s found that 6% of Americans born in the 1940s or earlier said they were religiously unaffiliated. Among those born in the 1950s, ’60s and ’70s, between 13% and 15% said they were religious “nones” as they entered into adulthood and became eligible to take the GSS. Among those born in the 1980s and ’90s, 26% to 29% said they were religiously unaffiliated as they became adults. And 36% of Americans born in the early 2000s said they are religiously unaffiliated as they aged into the GSS conducted in the early 2020s.
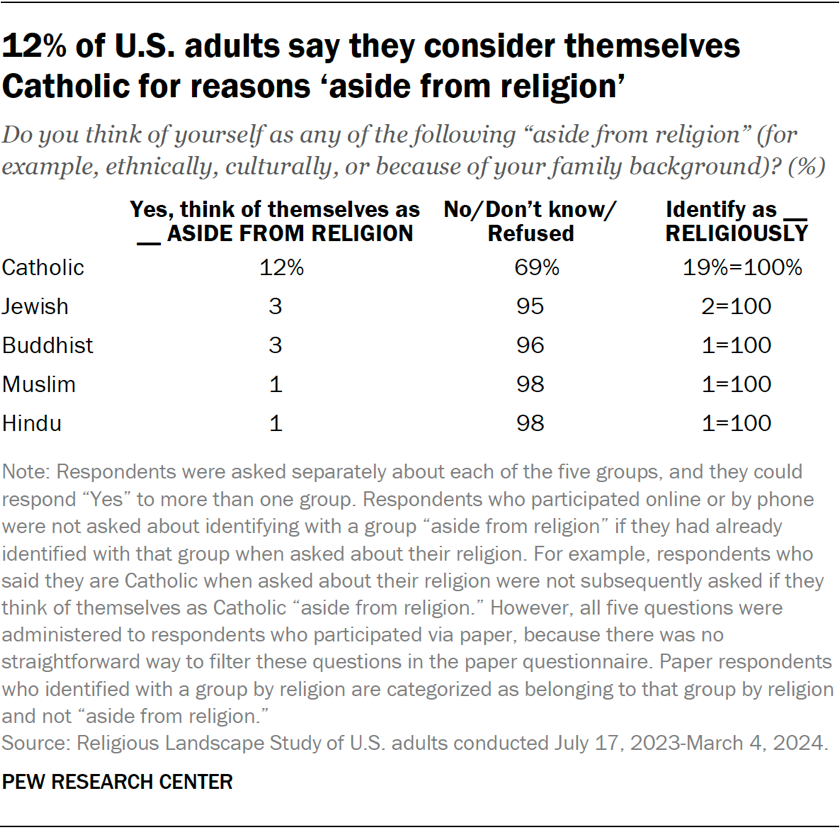
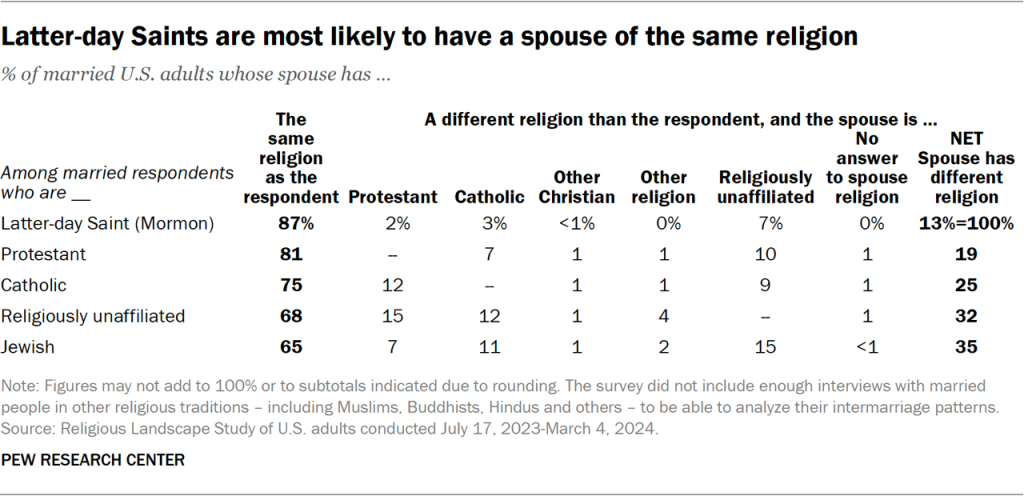
Line chart showing the share of U.S. adults who are Christians by birth cohort in the GSS
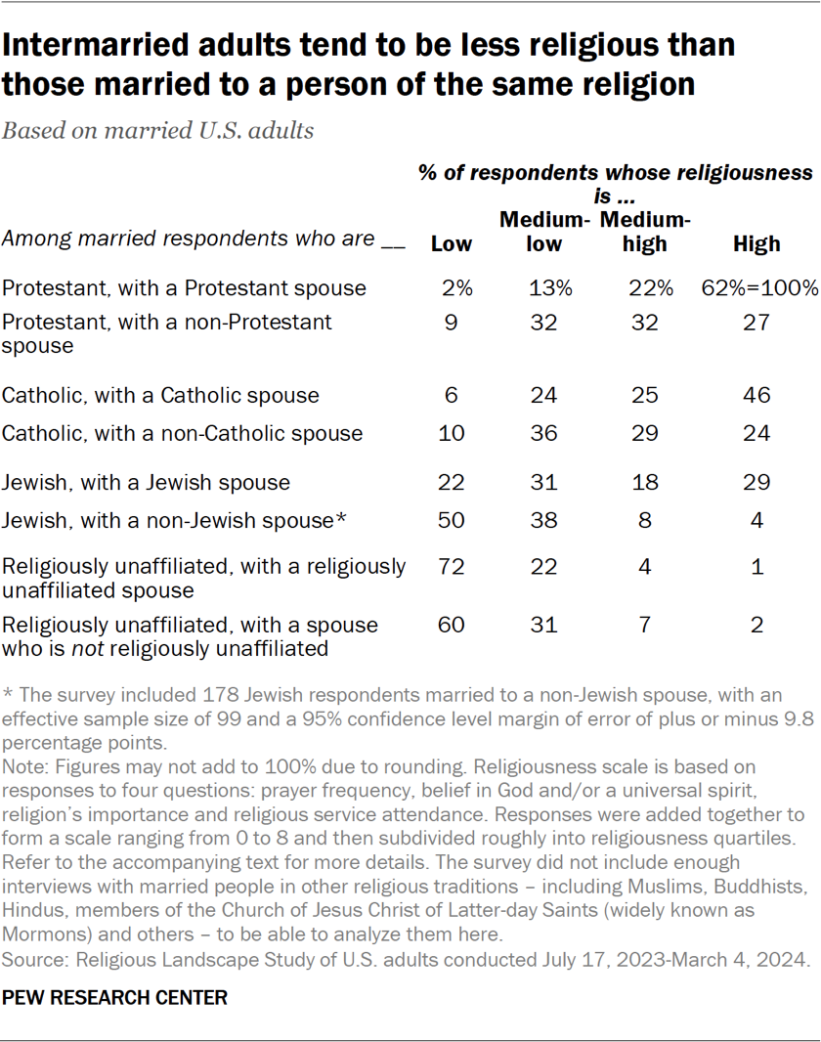
The GSS data shows, furthermore, that people within birth cohorts do not tend to become more religiously affiliated as they get older. Rather, within each birth cohort that can be analyzed in the GSS data, the share of people who say they are Christian, for example, tends to stay roughly the same or tick down somewhat as people get older. And conversely, within each birth cohort, the share of people who say they are religiously unaffiliated tends to stay about the same or tick up slightly as people get older.

The GSS data on religious attendance paints a similar picture. Broadly speaking, adults have tended to come of age with at least marginally lower rates of religious attendance than their immediate older predecessors. And within birth cohorts, the share of people who say they attend religious services regularly has not tended to go up as people get older.
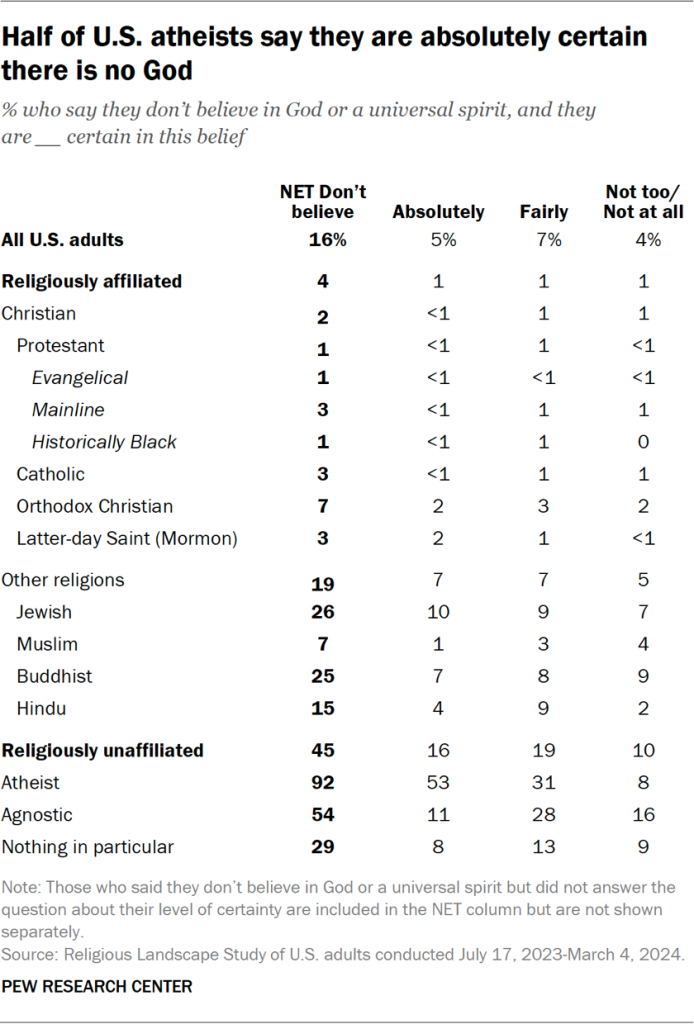
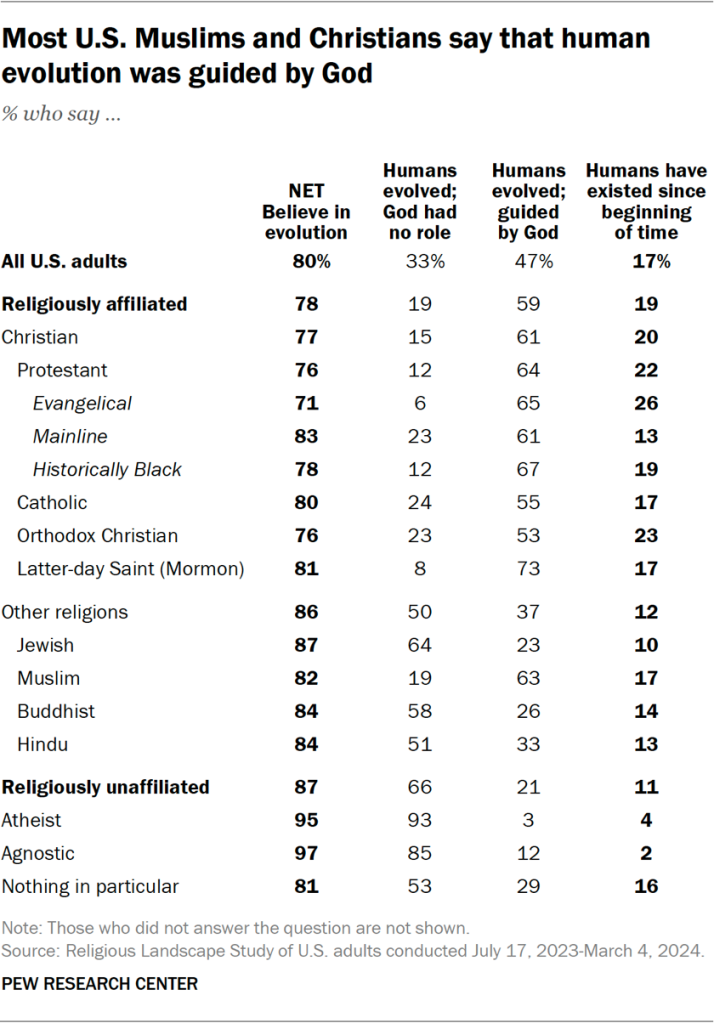
Line chart showing the share of U.S. adults who attend religious services at least monthly by birth cohort in the GSS

But the GSS data is very different when it comes to prayer frequency. Between the early 1990s and early 2010s, young people just entering adulthood have reported praying at rates similar to or slightly higher than the rates reported by people who aged into adulthood just before them. And in several birth cohorts, including those born in the 1950s, 1960s and 1970s, the share who report praying daily has increased as the people in these groups have gotten older.

Line chart showing the share of Americans who pray daily by birth cohort in the GSS

Details on the data sources

General Social Surveys are conducted by the independent research organization NORC at the University of Chicago, beginning in 1972. They were conducted annually through 1994 (with a few exceptions) and then mostly biennially thereafter.

For more information, refer to: Davern, Michael; Bautista, Rene; Freese, Jeremy; Herd, Pamela; and Morgan, Stephen L.; General Social Survey 1972-2022. [Machine-readable data file]. Principal Investigator, Michael Davern; Co-Principal Investigators, Rene Bautista, Jeremy Freese, Pamela Herd, and Stephen L. Morgan. NORC ed. Chicago, 2024. 1 datafile (Release 4) and 1 codebook (2022 Release 4).

NORC samples households, which cover almost 95% of adults, but it excludes what the U.S. Census Bureau calls “group quarters” (jails and prisons, shelters, college dorms, military barracks, assisted living and nursing homes).

Data was accessed from the GSS website. All analyses were conducted using the weight WTSSPS for years 1972-2002, and WTSSNRPS for 2004-2022.

Gallup data was accessed via their religion topic page, and drawn from their recent publication “How Religious Are Americans?”

Read Pew Research Center’s RLS and NPORS methodologies here.