Pew Research Center

FOR RELEASE JANUARY 24, 2024

Religious ‘Nones’ in America: Who They Are and What They Believe

A closer look at how atheists, agnostics and those who describe their religion as ‘nothing in particular’ see God, religion, morality, science and more

FOR MEDIA OR OTHER INQUIRIES:

Communications Department
202.419.4372
www.pewresearch.org

RECOMMENDED CITATION

Pew Research Center, January 2024, "Religious ‘Nones’ in America: Who They Are and What They Believe"

About Pew Research Center

Pew Research Center is a nonpartisan, nonadvocacy fact tank that informs the public about the issues, attitudes and trends shaping the world. It does not take policy positions. The Center conducts public opinion polling, demographic research, computational social science research and other data-driven research. It studies politics and policy; news habits and media; the internet and technology; religion; race and ethnicity; international affairs; social, demographic and economic trends; science; research methodology and data science; and immigration and migration. Pew Research Center is a subsidiary of The Pew Charitable Trusts, its primary funder.

© Pew Research Center 2026

Table of contents

  • About Pew Research Center
  • Religious ‘Nones’ in America: Who They Are and What They Believe
  • 1. Who are the ‘nones’? How are they defined?
  • 2. Why are ‘nones’ nonreligious?
  • 3. Are ‘nones’ less involved in civic life than people who identify with a religion?
  • 4. Are all ‘nones’ nonbelievers?
  • 5. Are ‘nones’ spiritual instead of religious?
  • 6. Are ‘nones’ hostile toward religion?
  • 7. How do ‘nones’ view science?
  • 8. How do ‘nones’ think about morality?
  • Acknowledgments
  • Methodology

Religious ‘Nones’ in America: Who They Are and What They Believe

A closer look at how atheists, agnostics and those who describe their religion as ‘nothing in particular’ see God, religion, morality, science and more

How we did this

Pew Research Center conducted this analysis to provide a detailed portrait of religiously unaffiliated adults in the United States.

Much of this profile comes from a survey we conducted July 31-Aug. 6, 2023, among 11,201 respondents who are members of the Center’s American Trends Panel (ATP). The survey included interviews with a total of 3,317 religious “nones” – 658 atheists, 678 agnostics and 1,981 respondents who describe their religion as “nothing in particular.”

The ATP is an online survey panel that is recruited through national random sampling of residential addresses, which gives nearly all U.S. adults a chance of selection. The survey is weighted to be representative of the U.S. adult population by gender, race, ethnicity, political party, education, religious affiliation and other categories. For more, refer to the ATP’s methodology and the methodology for the report.

In addition to the July 31-Aug. 6, 2023, survey, this analysis also draws on other ATP surveys conducted in recent years, as well as on the Center’s National Public Opinion Reference Surveys (NPORS).

Here are the survey questions being published for the first time as part of this report. Other questions discussed in this report were published previously.

Today, about 28% of U.S. adults are religiously unaffiliated, describing themselves as atheists, agnostics or “nothing in particular” when asked about their religion.

Chart shows 28% of U.S. adults are now religiously unaffiliated

At Pew Research Center, we get lots of questions about this group, often called the “nones.” What do “nones” believe? Are they opposed to religion? What are their views about science? Is their growth good or bad for society, and why?

Our survey data shows:

  • Most “nones” believe in God or another higher power. But very few go to religious services regularly.
  • Most say religion does some harm, but many also think it does some good. They are not uniformly anti-religious.
  • Most “nones” reject the idea that science can explain everything. But they express more positive views of science than religiously affiliated Americans do.

Surveys have consistently shown that many Americans view religion’s declining influence in society as a bad thing. “Nones” tend to vote less often, do less volunteer work in their communities and follow public affairs at lower rates than religiously affiliated people do.

But the latest data shows that on a variety of measures, lower rates of civic engagement are concentrated among “nones” whose religion is “nothing in particular.” Atheists and agnostics tend to participate in civic life at rates matching or exceeding religiously affiliated people.

Related: Has the rise of religious ‘nones’ come to an end in the U.S.?

Here are eight of the questions we receive most often, along with brief responses. Click the links for more information, including discussion of differences within the population of “nones” (for example, how “nones” who are men compare with those who are women) and between “nones” and U.S. adults who identify with a religion.

Q1: Who are the ‘nones’? How are they defined?

Chart shows most ‘nones’ describe their religion as ‘nothing in particular’

In public opinion surveys, people who answer a question about their religion by saying they are atheist, agnostic or “nothing in particular” are combined into a category called “religiously unaffiliated” – now widely known as the “nones.” Scholars of religion in the U.S. have been using the term “nones” since at least the 1960s, and its use has grown common in social scientific journals and the media.1

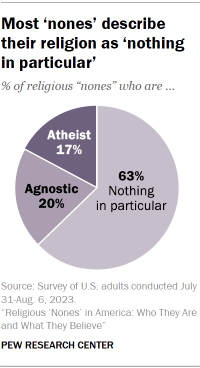
In our latest data, 17% of “nones” identify as atheist, 20% say they are agnostic and 63% choose “nothing in particular.”

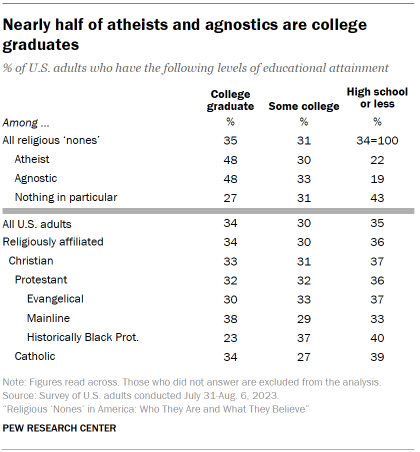
Atheists and agnostics, on average, have more education than religiously affiliated Americans. By contrast, people who describe their religion as “nothing in particular” tend to have lower levels of educational attainment than religiously affiliated U.S. adults.

Jump to more information on the demographics of “nones.”

Q2: Why are ‘nones’ nonreligious?
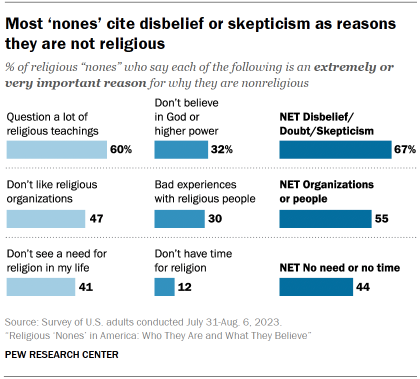
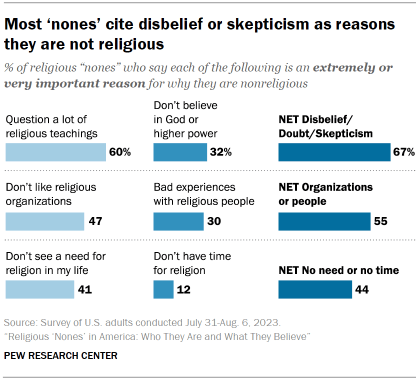
Chart shows most ‘nones’ cite disbelief or skepticism as reasons they are not religious

When asked directly why they are not religious, two-thirds of “nones” say they question a lot of religious teachings or don’t believe in God.

Many also bring up criticisms of religious institutions or people, including 47% who say that one extremely or very important reason why they are not religious is that they dislike religious organizations. And 30% say bad experiences they’ve had with religious people help explain why they are nonreligious.

Jump to more information on why “nones” say they are nonreligious.

Q3: Are ‘nones’ less involved in civic life than people who identify with a religion?

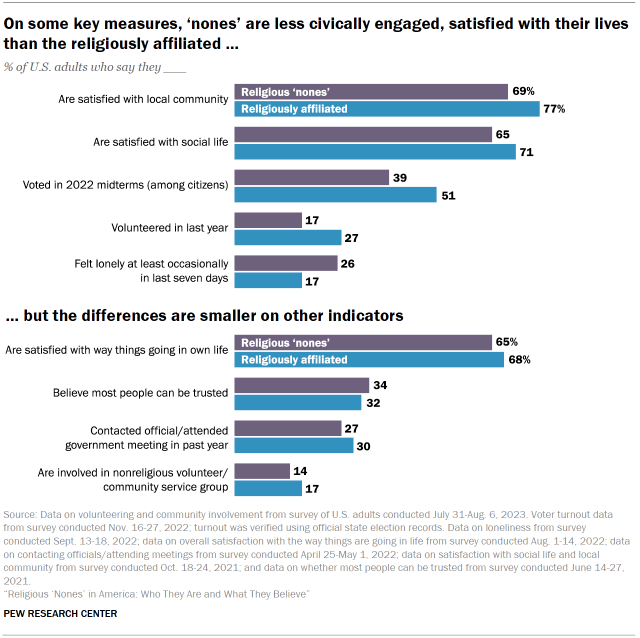
By a variety of measures, religious “nones” are less civically engaged and socially connected than people who identify with a religion. On average, they are less likely to vote, less likely to have volunteered lately, less satisfied with their local communities and less satisfied with their social lives.
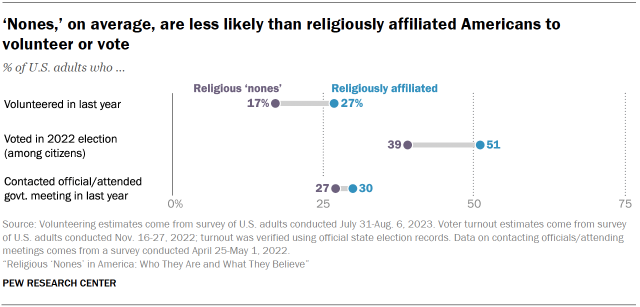
Chart shows ‘nones,’ on average, are less likely than religiously affiliated Americans to volunteer or vote

But on some related questions, the differences between “nones” and religiously affiliated people are modest. For example, 27% of “nones” and 30% of religiously affiliated Americans say they have contacted an elected official or attended a government meeting in the past year.

Moreover, lower levels of civic engagement tend to be found especially among “nones” who describe their religion as “nothing in particular” – not among atheists and agnostics. For example, atheists and agnostics turned out to vote in 2022 at rates rivaling those seen among religiously affiliated adults. Those who describe their religion as “nothing in particular” were the only subset of “nones” with lower voter turnout than religiously affiliated people.

And on some measures, attendance at religious services (not religious affiliation alone) is the key differentiator between people who are most civically involved and those who are not. For instance, religiously affiliated people who attend religious services at least once a month volunteer at much higher rates (41%) than both religiously affiliated people who don’t attend services regularly (17%) and “nones” (also 17%).

In other words, on some measures, it’s not whether a person identifies with a religion (or not) but whether they actively take part in a religious community that best predicts their level of civic engagement. In short, the link between religious disaffiliation and civic engagement is complicated.2

Jump to read more about “nones” and their civic engagement.

Q4: Are all ‘nones’ nonbelievers?

No, not all “nones” are nonbelievers. They are far less likely than religiously affiliated Americans to say they believe in God “as described in the Bible,” but most do believe in God or some other higher power. Just 29% reject the notion that there is any higher power or spiritual force in the universe.

Chart shows most ‘nones’ believe in God or higher power, but not in biblical God

Most “nones” say they were raised in a religion, usually Christianity. Yet today, they tend to be disconnected from religious institutions. Not only have they shaken off religious labels, they also have largely shaken off involvement in churches, synagogues, mosques and other religious organizations.

For example, fully 90% of religious “nones” say they seldom or never go to religious services.

Jump to more details about the religious beliefs and practices of “nones.”

Q5: Are ‘nones’ spiritual instead of religious?

Some “nones” are indeed spiritual. About half say spirituality is very important in their lives or say they think of themselves as spiritual. Most “nones” believe animals other than humans can have spirits or spiritual energies – and many say this is true of parts of nature, such as mountains, rivers or trees.
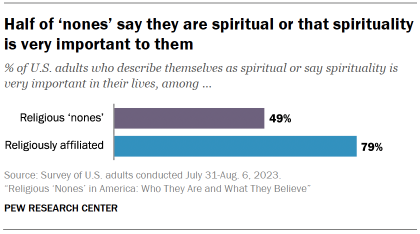
Chart shows half of ‘nones’ say they are spiritual or that spirituality is very important to them

But these spiritual identities and beliefs are not unique to “nones.” In fact, by many measures, people who identify with a religion tend to be just as spiritual, or even more spiritual, than “nones.”

Jump to more information about spirituality among “nones.”

Q6: Are ‘nones’ hostile toward religion?
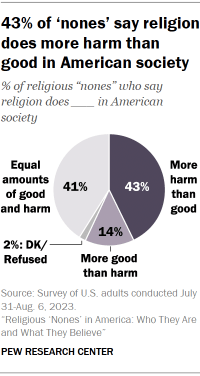
Chart shows 43% of ‘nones’ say religion
does more harm than
good in American society

Some “nones” have a very negative view of religion, but “nones” on the whole express mixed views rather than outright hostility.

Most say religion causes a variety of problems in society – like intolerance or superstition. But many “nones” also say that religion helps give people meaning and purpose, and that it can encourage people to treat each other well.

Overall, 43% of “nones” say religion does more harm than good in society, while 14% say it does more good than harm; 41% say religion does equal amounts of good and harm.

Jump ahead to read more on how “nones” view religion.

Q7: How do ‘nones’ view science?

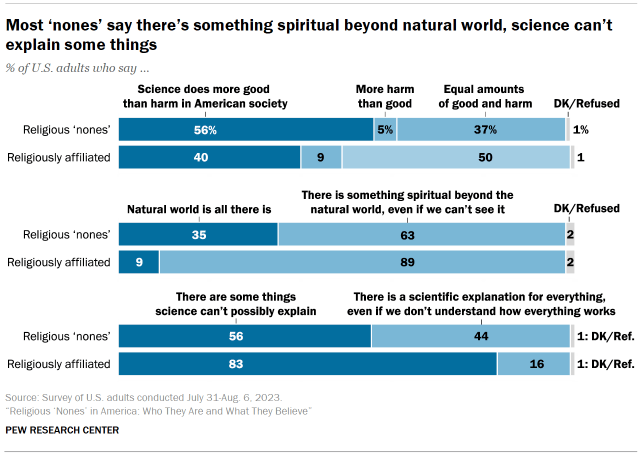
Most “nones” say science does more good than harm in American society, and on average “nones” are much more positive about science than are religiously affiliated people.

At the same time, most “nones” believe there are limits to what science can do. For example, 44% of “nones” say there is a scientific explanation for everything, while 56% say there are some things science can’t possibly explain.

Chart shows 56% of ‘nones’ say
science does more good
than harm in American
society

Read more details about how “nones” view science.

Q8: How do ‘nones’ think about morality?
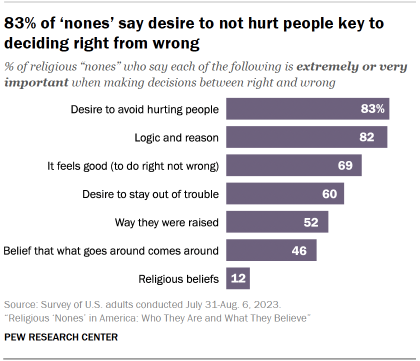
Chart shows 83% of ‘nones’ say desire to not hurt people key to deciding right from wrong

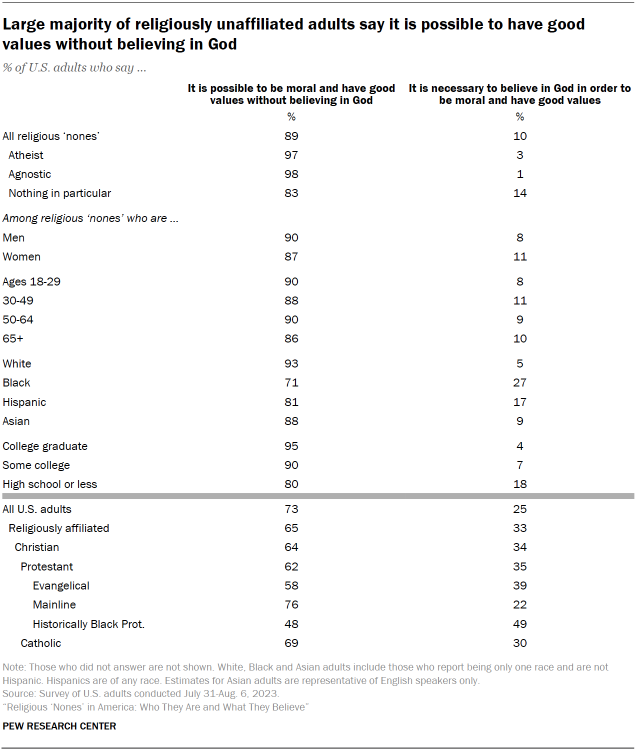
The vast majority of “nones” say it is possible to be moral and have good values without believing in God. Most religiously affiliated people agree, though by a smaller margin.

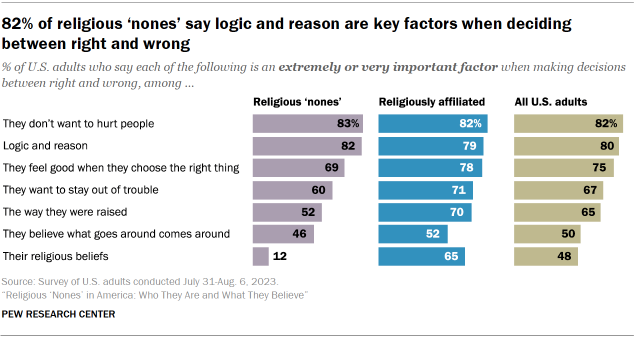
When asked how they decide between right and wrong, 83% of “nones” say the desire to avoid hurting other people is a key factor. And 82% of “nones” say logic and reason are extremely or very important when they decide between right and wrong.

Read more on how “nones” think about morality.

Much of the analysis in this report comes from a Pew Research Center survey conducted July 31-Aug. 6, 2023, among 11,201 respondents who are members of the Center’s American Trends Panel (ATP). The survey included interviews with 3,317 religious “nones” (658 atheists, 678 agnostics and 1,981 respondents who describe their religion as “nothing in particular”).

In addition to the July 31-Aug. 6, 2023, survey, this analysis also draws on a variety of other ATP surveys conducted in recent years, as well as on the Center’s National Public Opinion Reference Surveys (NPORS).

Explore the questions above in more detail:

  • Who are the ‘nones’? How are they defined? (Chapter 1)
  • Why are ‘nones’ nonreligious? (Chapter 2) 
  • Are ‘nones’ less involved in civic life than people who identify with a religion? (Chapter 3) 
  • Are all ‘nones’ nonbelievers? (Chapter 4) 
  • Are ‘nones’ spiritual instead of religious? (Chapter 5) 
  • Are ‘nones’ hostile toward religion? (Chapter 6) 
  • How do ‘nones’ view science? (Chapter 7) 
  • How do ‘nones’ think about morality? (Chapter 8) 
1. Who are the ‘nones’? How are they defined?

Religious “nones” are people who describe themselves as atheist, agnostic or “nothing in particular” when asked about their religious affiliation in our surveys.

Chart shows most ‘nones’ describe their religion as ‘nothing in particular’

To measure religious affiliation in the United States, we asked: “What is your present religion, if any?” followed by a list of options:

  • Protestant (for example, Baptist, Methodist, nondenominational, Lutheran, Presbyterian, Pentecostal, Episcopalian, Church of Christ, Congregational/United Church of Christ, Holiness, Reformed, Church of God, etc.)
  • Roman Catholic
  • Mormon (Church of Jesus Christ of Latter-day Saints or LDS)
  • Orthodox (such as Greek, Russian, or some other Orthodox Church)
  • Jewish
  • Muslim
  • Buddhist
  • Hindu
  • Atheist
  • Agnostic
  • Something else (please specify what)
  • Nothing in particular

Respondents who choose atheist, agnostic or “nothing in particular” are categorized by Pew Research Center as religiously unaffiliated – a group that the Center and many others have taken to calling “nones.”

Most “nones” describe their religion as “nothing in particular” (63%), while 17% say they are atheist and 20% say they are agnostic.

We use the terms “religiously unaffiliated” and “religious nones” interchangeably. Sometimes we also refer to the “nones” as people who claim “no religion” or people who don’t identify with any religion.

Meanwhile, we use the term “religiously affiliated” for respondents who identify with one of the religions listed above – including a relatively small number who choose “something else” and then write in what it is, as well as those who say they have more than one religion.

Demographics of religious ‘nones’

Age and gender

The population of religious “nones” in the U.S. is younger than the population of Americans who identify with a religion.

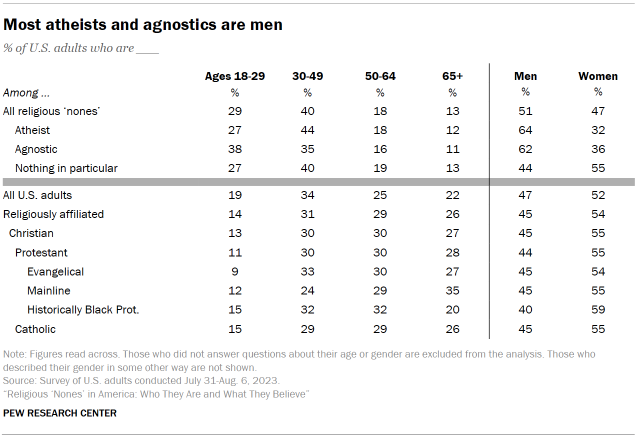
Among “nones,” 69% are under the age of 50, while 31% are 50 or older. By comparison, 45% of U.S. adults who identify with a religion are under 50, while 55% are ages 50 or older.

“Nones” overall are roughly split between men (51%) and women (47%). The populations of atheists and agnostics include far more men than women. The same is not true for people whose religion is “nothing in particular.”

(For more information on religious differences between men and women, refer to “The Gender Gap in Religion Around the World.”)

Chart shows Most atheists and agnostics are men

Race and ethnicity

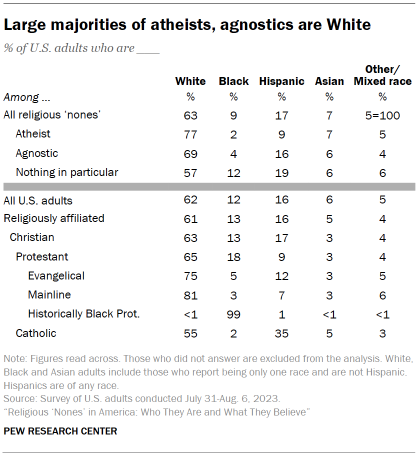
Table shows Large majorities of atheists, agnostics are White

The racial breakdown of U.S. “nones” is broadly similar to the racial breakdown of Americans who identify with a religion.

That said, White adults make up larger shares of U.S. atheists (77%) and agnostics (69%) than of people whose religion is “nothing in particular” (57%).

Just 2% of self-described atheists and 4% of agnostics are Black.

Education

Table shows Nearly half of atheists and agnostics are college graduates

The populations of “nones” and of religiously affiliated adults in the United States have similar levels of education, respectively.

Among “nones,” though, atheists and agnostics have more education than those whose religion is “nothing in particular.”

Atheists and agnostics are also more likely to have a college degree than are Americans who identify with a religion.

Party identification and political ideology of religious ‘nones’

Ideologically, American “nones” are much more likely than religiously affiliated adults to identify as liberal and less likely to identify as conservative.

Majorities of atheists (65%) and agnostics (56%) are ideologically liberal. Among those who say their religion is “nothing in particular,” the largest share identify as moderate (46%).

Overall, 62% of “nones” identify as Democrats or lean toward the Democratic Party. Atheists (78%) and agnostics (71%) are more likely to be Democrats or lean Democratic than are U.S. adults who identify religiously as “nothing in particular” (54%).

Table shows 62% of religiously unaffiliated adults are Democrats or lean Democratic

Return to the report’s Overview.  

Find answers to other questions: 

  • Why are ‘nones’ nonreligious? (Chapter 2) 
  • Are ‘nones’ less involved in civic life than people who identify with a religion? (Chapter 3) 
  • Are all ‘nones’ nonbelievers? (Chapter 4) 
  • Are ‘nones’ spiritual instead of religious? (Chapter 5) 
  • Are ‘nones’ hostile toward religion? (Chapter 6) 
  • How do ‘nones’ view science? (Chapter 7) 
  • How do ‘nones’ think about morality? (Chapter 8) 
2. Why are ‘nones’ nonreligious?

The survey asked “nones” why they are nonreligious, offering a list of six possible reasons and asking respondents to say whether each is an extremely, very, somewhat, not too, or not at all important reason why they are nonreligious. Respondents could choose multiple reasons, and many did.

Chart shows Most ‘nones’ cite disbelief or skepticism as reasons they are not religious

The reason “nones” give most often for not having a religion is that they question religious teachings: 60% say doubt about these teachings is an extremely or very important reason why they are nonreligious. In addition, 32% cite a lack of belief in God or any other higher power. Altogether, 67% cite skepticism or nonbelief (or some combination of both) as a key factor in why they are nonreligious.

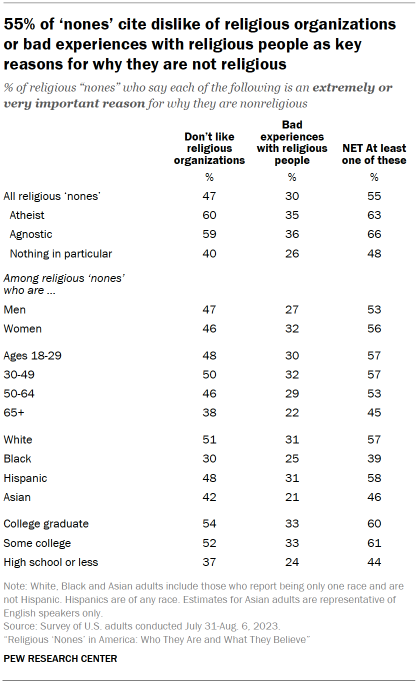
Meanwhile, 47% of “nones” say their dislike of religious organizations is an extremely or very important reason they are nonreligious. And 30% cite bad experiences with religious people. Altogether, 55% of “nones” mention religious organizations or religious people (or both) as key reasons for being nonreligious.

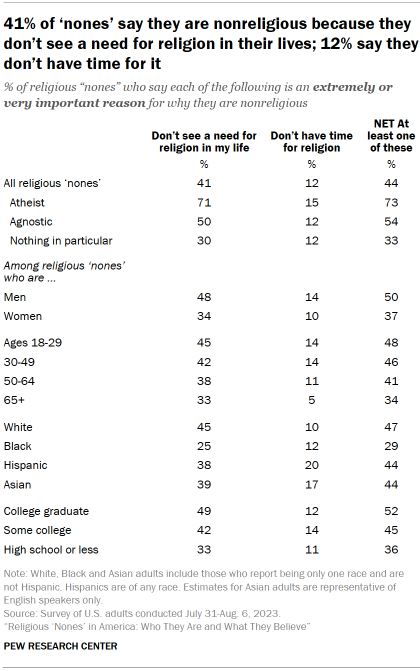
About four-in-ten “nones” attribute their lack of religiousness to not having a need for religion in their lives. And 12% say they don’t have time for religion. Altogether, 44% cite a lack of need or a lack of time (or both) as reasons for why they are not religious.

Doubts about religious teachings and lack of belief in God

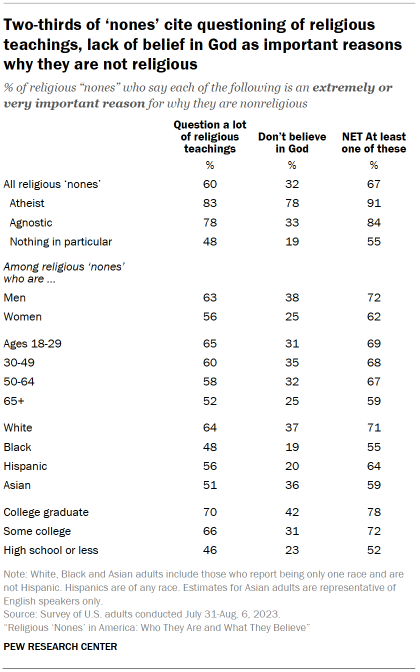
Table shows Two-thirds of ‘nones’ cite questioning of religious teachings, lack of belief in God as important reasons why they are not religious

Overall, two-thirds of “nones” say skepticism about religious teachings or lack of belief in God are key reasons for why they are nonreligious.

Fully 91% of atheists cite these matters of doubt or disbelief as factors for why they are nonreligious, as do 84% of agnostics. These reasons are cited by lower shares of “nones” (55%) who say their religion is “nothing in particular.”

Differences by gender, age, and race and ethnicity

Men who are “nones” are more likely than women to cite skepticism about religious teachings and lack of belief in God as important reasons for why they are nonreligious.

The oldest “nones” (those ages 65 and older) are somewhat less likely than younger “nones” to cite skepticism of religious teachings and a lack of belief in God as reasons for why they are nonreligious.

Higher shares of White and Asian “nones” cite a lack of belief in God as a reason for their nonreligion than do Black and Hispanic “nones.” Roughly two-thirds of White “nones” cite skepticism of religious teachings as a key reason for why they are nonreligious.

Dislike of religious organizations and bad experiences with religious people

Table shows 55% of ‘nones’ cite dislike of religious organizations or bad experiences with religious people as key reasons for why they are not religious

Overall, 55% of “nones” cite a dislike of religious organizations or bad experiences with religious people as important factors for why they are nonreligious.

Differences by education, age and gender

“Nones” under 65 are more likely than older “nones” to cite dislike of religious organizations or bad experiences with religious people as key reasons for why they are nonreligious.

And more “nones” with college experience cite these as key reasons for their lack of religiousness than do “nones” who have not attended college.

Roughly one-third of “nones” who are women (32%) say having had bad experiences with religious people is an important reason for why they are nonreligious, compared with 27% of “nones” who are men.

Lack of need for religion, no time for it

Table shows 41% of ‘nones’ say they are nonreligious because they don’t see a need for religion in their lives; 12% say they don’t have time for it

Overall, 44% of “nones” (including 73% of atheists) say they are nonreligious because they don’t see a need for religion in their lives or they don’t have time for religion.

Differences by gender, age and race and ethnicity

Among “nones,” men are more likely than women to say that not needing religion is a key reason for their lack of religiousness. And the youngest “nones” (ages 18 to 29) are more likely to say this than the oldest “nones” (65 and older).

White, Asian and Hispanic “nones” are each more inclined than Black “nones” to say not having a need for religion in their lives is a key reason for their nonreligion.

Return to the report’s Overview.  

Find answers to other questions: 

  • Who are the ‘nones’? How are they defined? (Chapter 1)
  • Are ‘nones’ less involved in civic life than people who identify with a religion? (Chapter 3) 
  • Are all ‘nones’ nonbelievers? (Chapter 4) 
  • Are ‘nones’ spiritual instead of religious? (Chapter 5) 
  • Are ‘nones’ hostile toward religion? (Chapter 6) 
  • How do ‘nones’ view science? (Chapter 7) 
  • How do ‘nones’ think about morality? (Chapter 8)
3. Are ‘nones’ less involved in civic life than people who identify with a religion?

Survey data shows that religious “nones” are, on average, less civically and politically engaged than people who identify with a religion. But the differences are often modest and tend to be concentrated among the subset of “nones” who describe their religion as “nothing in particular.”

Indeed, by several measures, atheists and agnostics are about as civically and politically engaged as U.S. adults who identify with a religion. It’s often just the “nothing in particular” group that stands out for having relatively low levels of civic behavior, such as voting and volunteering.

Why is this important? Traditionally, people who are involved with U.S. religious congregations have tended to be involved with all sorts of other organizations and activities – from PTAs and community groups to voting in elections.

This has led some observers to wonder: Could the rise of religious “nones” in the United States effectively diminish Americans’ participation in civic and community life? Put another way, could the decline of religion leave the U.S. with fewer volunteers, community activists and civic leaders?3

Others have contended that the causal arrow may point in the other direction – that the decline of religion may itself be a symptom of a broader American disengagement from institutions and organizations. According to this line of reasoning, the decline of religion is just one manifestation of disaffection from (and loss of trust in) fellow citizens and institutions of all kinds.4

It’s beyond the scope of this report to definitively answer these big questions about the impact of the decline of organized religion on U.S. civic life, or to sort out how much of religion’s decline is explained by a broader rejection of institutions and organizations. But we have collected lots of data in recent years on the connections between religion and civic engagement, and this chapter briefly reviews it.

On many measures, religious ‘nones’ are less involved in civic life

Overall, 17% of religious “nones” say they volunteered for an organization or association in the past year – 10 percentage points lower than the share of religiously affiliated people who say this.

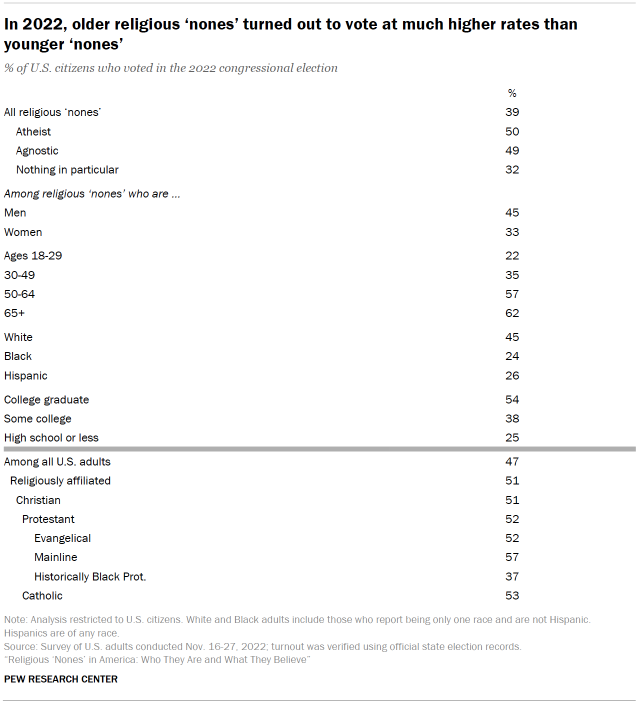
And religious “nones” are 12 points less likely than religiously affiliated citizens to have turned out to vote in the 2022 midterm elections (39% vs. 51%). (These estimates are based on an analysis that uses publicly available official state records to verify voter turnout.)

Chart shows on some key measures, ‘nones’ are less civically engaged, satisfied with their lives than the religiously affiliated

Compared with religiously affiliated people, religious “nones” are also somewhat less satisfied with various aspects of their lives, including their local community and their social lives. And in a September 2022 survey, religious “nones” were more likely than other U.S. adults to say they’d felt lonely in the preceding week, and less likely to say they’d felt hopeful.

But differences between ‘nones’ and the religiously affiliated are often modest

For example, religious “nones” are only slightly less likely than religiously affiliated people to say they are currently involved in a nonreligious volunteer or community service group, as well as to say that they’ve recently contacted an elected official or attended a government meeting – all of which are standard measures of civic engagement. And the percentage of religious “nones” who say most people can be trusted is virtually identical to the percentage of religiously affiliated people who take that position – a classic measure of social trust.

And although “nones” are somewhat less satisfied than religiously affiliated people, most “nones” say they are satisfied with their family lives, social lives and local communities. Most “nones” do not say they are lonely.

Among ‘nones,’ those describing their religion as ‘nothing in particular’ (not atheists and agnostics) often tend to be the least civically engaged

Table shows Among ‘nones,’ atheists and agnostics tend to be more civically engaged than those who say their religion is ‘nothing in particular’

In terms of political engagement, for example, atheists and agnostics are about as likely as religiously affiliated Americans to have voted in the 2022 midterm elections.

Atheists are actually more likely than religiously affiliated Americans to say they follow government and public affairs closely. Furthermore, atheists and agnostics are more likely than religiously affiliated people to say most people can be trusted.

U.S. adults who say their religion is “nothing in particular,” however, are less likely than atheists, agnostics and people who identify with a religion to say they have volunteered in the past year, to have voted in the 2022 midterms, and to say they follow government or public affairs all or most of the time.

On some measures, there is little difference between ‘nones’ and religiously affiliated people who don’t regularly attend religious services

Overall, 41% of religiously affiliated people say they go to services at least once or twice a month. Very few “nones” attend religious services.

On several key indicators of civic engagement, religiously affiliated people who regularly attend services stand out for their high levels of involvement. For example, they are far more likely to have volunteered in the last year than either “nones” or religiously affiliated people who don’t attend religious services.

Meanwhile, “nones” are about as likely as religiously affiliated people who don’t attend religious services to say they volunteered in the past year or that they are involved in a nonreligious community service group.

“Nones” are also about as likely as religiously affiliated people who don’t attend religious services to express satisfaction with their social lives and to have felt hopeful lately.

Table shows religiously affiliated adults who regularly attend services most likely to volunteer, be satisfied with their social lives

Voter turnout among the ‘nones’

In the 2022 midterm election, atheists and agnostics turned out to vote at higher levels than “nones” who describe their religion as “nothing in particular,” and at similar levels to U.S. adults who identify with a religion.

Older “nones” voted at higher levels than younger ones, and higher shares of White “nones” than Black or Hispanic “nones” turned out to vote. In addition, “nones” with more education turned out at a higher rate than those “nones” with less education. These differences within the religiously unaffiliated population mirror broader patterns in the U.S. public as a whole.

Meanwhile, “nones” who are men turned out to vote at a higher clip than “nones” who are women. This partly reflects the fact that men who are religiously unaffiliated are more likely than women to identify as atheist or agnostic, and atheists and agnostics turn out to vote at higher rates than “nones” who describe their religion as “nothing in particular.” (Among “nones” in the July 31-Aug. 6, 2023, survey who are men, 22% are atheists, 24% are agnostics and 54% describe their religion as “nothing in particular.” Among “nones” who are women, 12% are atheists, 15% are agnostics and 73% are “nothing in particular.”)

Table shows in 2022, older religious ‘nones’ turned out to vote at much higher rates than younger ‘nones’

But the data also shows that among those whose religion is “nothing in particular,” men turned out to vote at a higher clip than women (40% vs. 27%). Among atheists and agnostics, roughly equal shares of men and women turned out to vote in 2022.

Volunteerism among ‘nones’

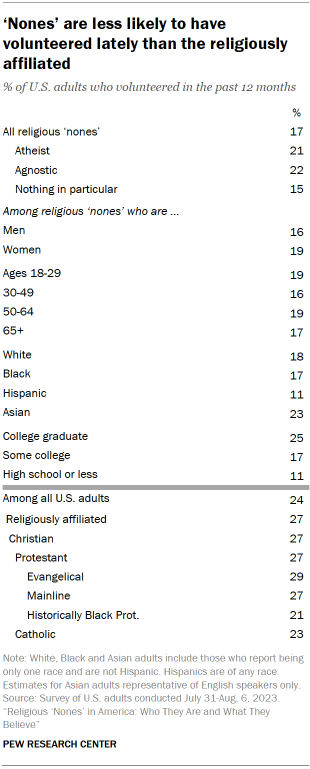
Table shows ‘Nones’ are less likely to have volunteered lately than the religiously affiliated

Religious “nones” are somewhat less likely than U.S. adults who are religiously affiliated to have volunteered in the last year. That said, atheists and agnostics are slightly more likely than people who report their religion is “nothing in particular” to have volunteered lately.

White and Asian “nones” are slightly more likely than Hispanic “nones” to have volunteered in the last year.

And “nones” who graduated from college are more likely to have volunteered in the last year than are “nones” with less education.

Following government and public affairs

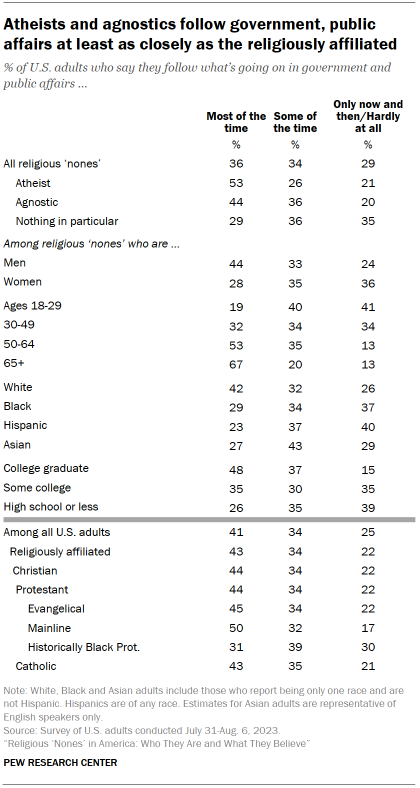
Among “nones,” 36% say they follow “what’s going on in government and public affairs” most of the time, while 34% follow public affairs some of the time. Another 29% say they do so only now and then or hardly at all.

Atheists and agnostics are more likely than U.S. adults reporting their religion as “nothing in particular” to follow government and public affairs most of the time.

Table shows Atheists and agnostics follow government, public affairs at least as closely as the religiously affiliated

Some 44% of religiously unaffiliated men report they follow public affairs most of the time, compared with 28% of religiously unaffiliated women who say they do this.

Older “nones” are much more likely than younger “nones” to follow public affairs. And “nones” with college degrees are more likely than those with less education to keep up with government and public affairs.

Satisfaction with family life, local communities, social life

About eight-in-ten religious “nones” are very or somewhat satisfied with their family lives. Around seven-in-ten are satisfied with the quality of life in their local community. And 65% are satisfied with their social lives.

While the religiously unaffiliated are somewhat less likely than Americans who identify with a religion to be satisfied in these ways, majorities in both groups report satisfaction on each of these measures.

Older “nones” tend to be more satisfied with their family lives, communities and social lives than younger “nones.”

“Nones” who have graduated from college express higher levels of satisfaction with their family lives and their local communities compared with “nones” who have not completed college.

Table shows Most religious ‘nones’ satisfied with their family lives, local communities, social ties

Return to the report’s Overview.  

Find answers to other questions: 

  • Who are the ‘nones’? How are they defined? (Chapter 1)
  • Why are ‘nones’ nonreligious? (Chapter 2) 
  • Are all ‘nones’ nonbelievers? (Chapter 4) 
  • Are ‘nones’ spiritual instead of religious? (Chapter 5) 
  • Are ‘nones’ hostile toward religion? (Chapter 6) 
  • How do ‘nones’ view science? (Chapter 7) 
  • How do ‘nones’ think about morality? (Chapter 8)
4. Are all ‘nones’ nonbelievers?

Not all ‘nones’ are nonbelievers.

Far from it.

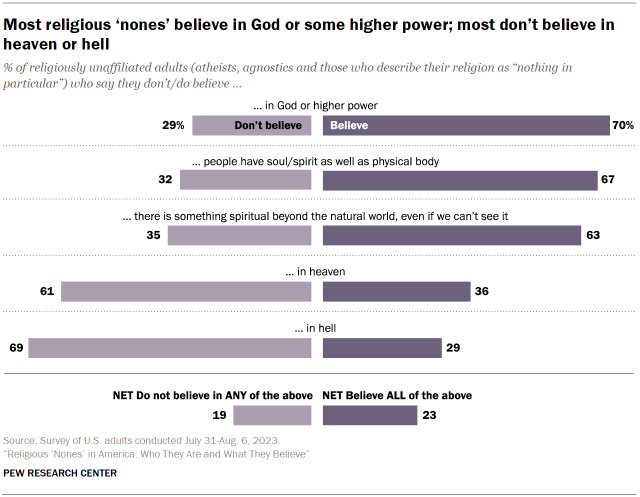
While the “nones” include many nonbelievers, 70% of “nones” say they believe in God or another higher power, and 63% say they believe in spiritual forces beyond the natural world.

Overall, 19% of religious “nones” are strict nonbelievers who don’t believe in God or any higher power, don’t believe humans have souls, don’t think there’s anything beyond the natural world, don’t think there’s a heaven and don’t believe in hell.

Chart shows Most religious ‘nones’ believe in God or some higher power; most don’t believe in heaven or hell

But 23% of “nones” say they believe in all of the above. The rest either hold some of those beliefs and reject others (55%) or else don’t answer enough of the questions to be able to classify the nature of their beliefs (3%).

But ‘nones’ are much less religious, on average, than religiously affiliated Americans.

Table shows 97% of religious ‘nones’ say they attend religious services a few times a year or less often (if at all)

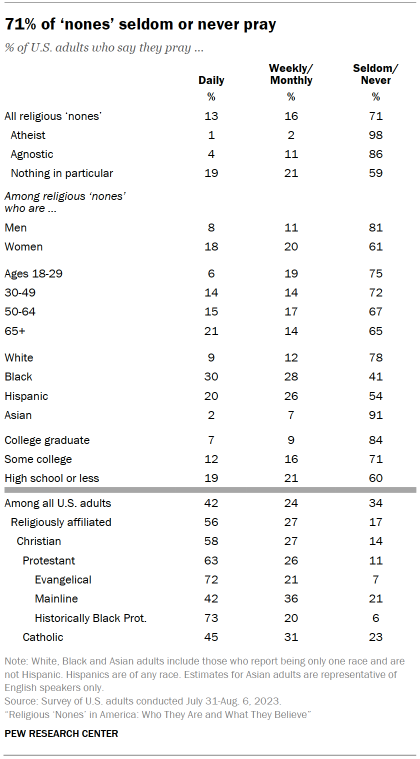
About three-in-ten religious “nones” say they pray with some regularity, but most “nones” don’t. Fully 71% say they seldom or never pray.

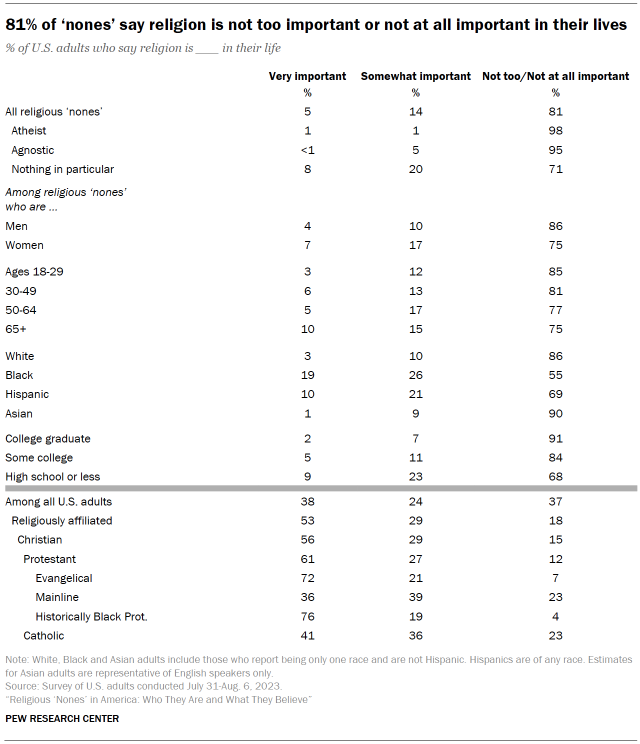
While about one-fifth of “nones” say religion is either very or somewhat important in their lives, four times as many say religion is not too or not at all important to them (81%).

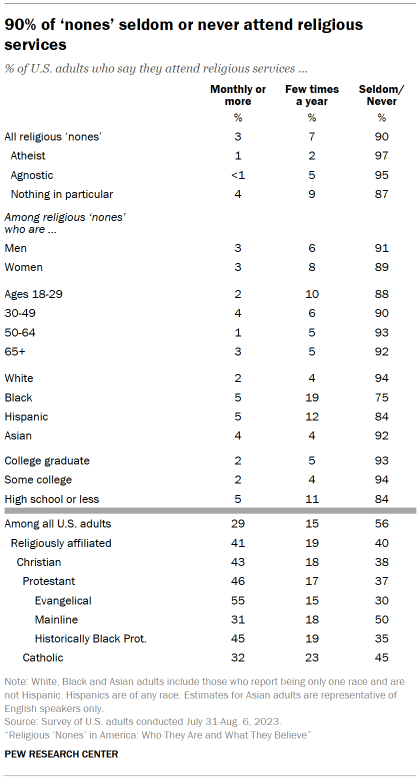
And very few “nones” say they attend religious services. Just 3% say they go to religious services once a month or more, while 97% go a few times a year or less (including 90% who say they seldom or never attend religious services).

On all these measures, religious “nones” are far less religious than Americans who identify with a religion. So religious “nones” don’t just avoid or reject religious labels. They also avoid or reject some common religious behaviors.

Beliefs about God

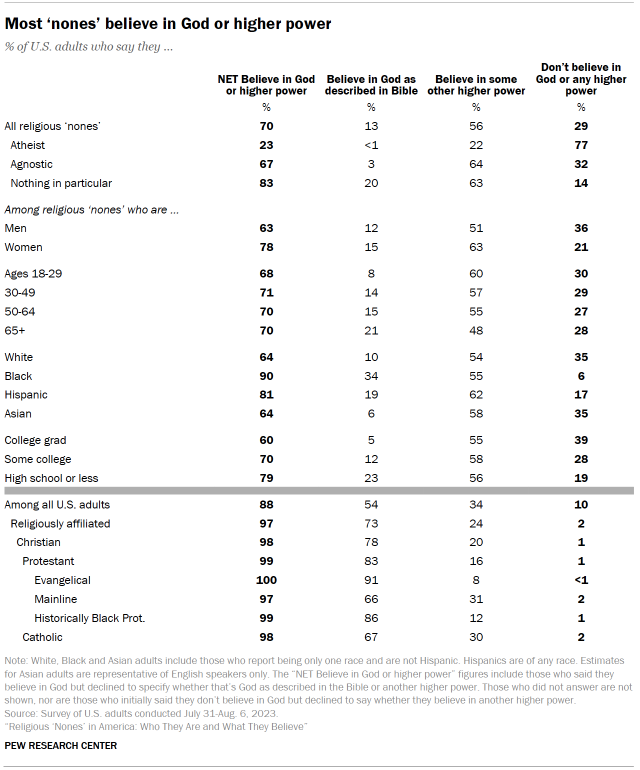
Seven-in-ten “nones” believe in God or a higher power of some kind, including 13% who say they believe in God “as described in the Bible” and 56% who say they don’t believe in God as described in the Bible but do believe in some other higher power.

About three-in-ten “nones” say they don’t believe in God or any “higher power or spiritual force in the universe.”

Most agnostics (67%) and U.S. adults who describe their religion as “nothing in particular” (83%) say they believe in God or some kind of higher power. Among atheists, almost none say they believe in God as described in the Bible, but 22% say they do believe in some other higher power or spiritual force in the universe.

Among “nones,” more men than women say they don’t believe in God or any higher power at all (36% vs. 21%). “Nones” who are women are instead more likely than “nones” who are men to believe in a higher power other than God as described in the Bible (63% vs. 51%).

There is little difference across age groups in the share of “nones” who believe in any higher power. But there are some modest differences across age categories in the share who believe in God as described in the Bible, as opposed to some other kind of higher power. The youngest “nones” are more likely than the oldest “nones” to say they believe in a higher power other than God as described in the Bible, while the oldest are more inclined than the youngest to believe in the biblical God.

Nine-in-ten Black “nones” and 81% of Hispanic “nones” believe in some higher power, but Black “nones” are more likely than Hispanic “nones” to say they believe in God as described in the Bible (34% vs. 19%).

Smaller majorities of both White and Asian “nones” (64% each) believe in a higher power.

Six-in-ten “nones” who are college graduates say they believe in a higher power, while 39% do not. Belief in a higher power is more common among “nones” with lower levels of formal education.

Table shows most ‘nones’ believe in God or higher power

Views on the existence of something spiritual beyond the natural world

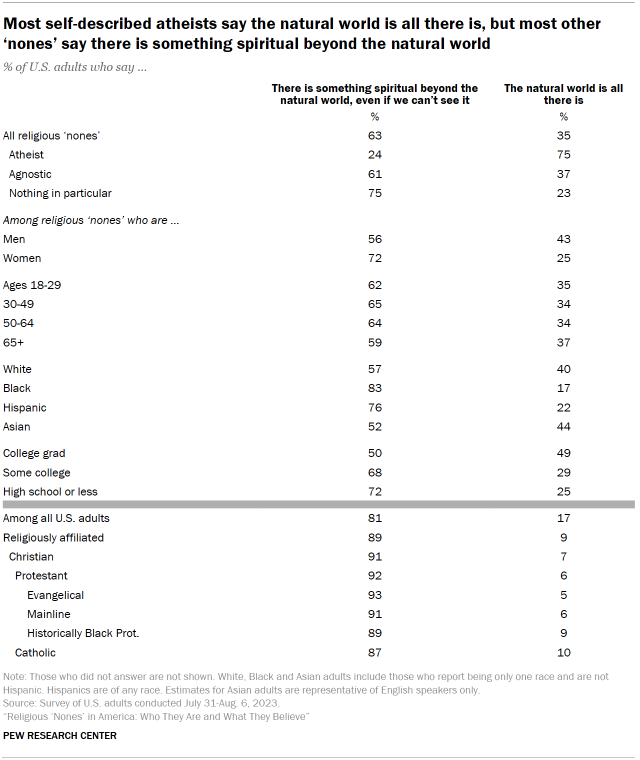
Overall, 63% of religious “nones” say there is something spiritual beyond the natural world, even if we can’t see it, while 35% express the materialist perspective, saying the natural world is all there is.

Most atheists say the natural world is all that exists. But most agnostics and those who describe their religion as “nothing in particular” say there is something spiritual beyond the natural world.

Among “nones,” women are more likely than men to say there is something spiritual beyond the natural world (72% vs. 56%).

Large majorities of “nones” who are Black or Hispanic believe there is something spiritual beyond the natural world, even if we can’t see it. Fewer White “nones” and Asian “nones” believe this.

Religious “nones” who are college graduates are evenly divided between those who think there is something spiritual beyond the natural world (50%) and those who think the natural world is all there is (49%). By contrast, a clear majority of “nones” with less than a college education say there is something spiritual beyond the natural world, even if we can’t see it.

Table shows Most self-described atheists say the natural world is all there is, but most other ‘nones’ say there is something spiritual beyond the natural world

Beliefs about whether humans have a soul or spirit

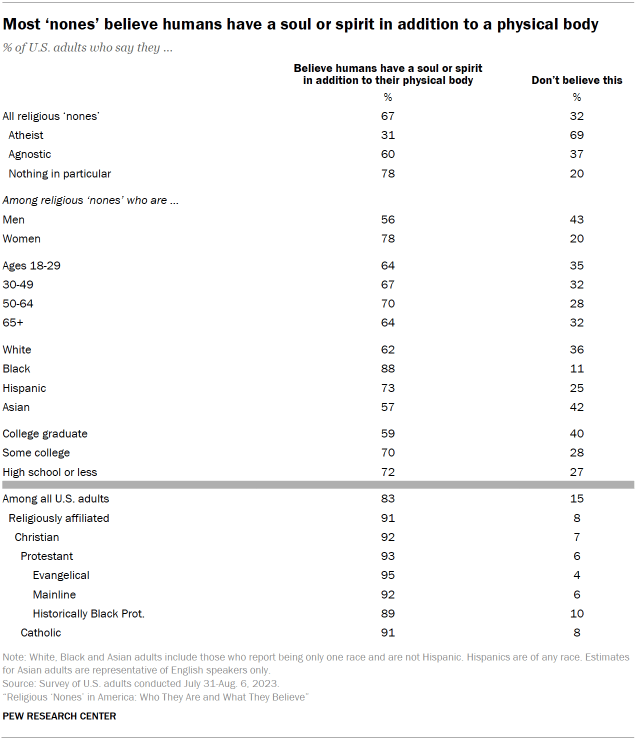
Roughly two-thirds of “nones” say they think humans have souls or spirits in addition to their physical bodies. This includes 60% of agnostics and 78% of U.S. adults whose religion is “nothing in particular.” By comparison, 31% of atheists believe a person has a soul or spirit in addition to a body.

Among “nones,” women are more likely than men to believe humans have souls or spirits. Black and Hispanic “nones” are more likely than White and Asian “nones” to believe this. And “nones” who have not completed college are more likely than college graduates to express this view.

Table shows Most ‘nones’ believe humans have a soul or spirit in addition to a physical body

Beliefs about heaven and hell

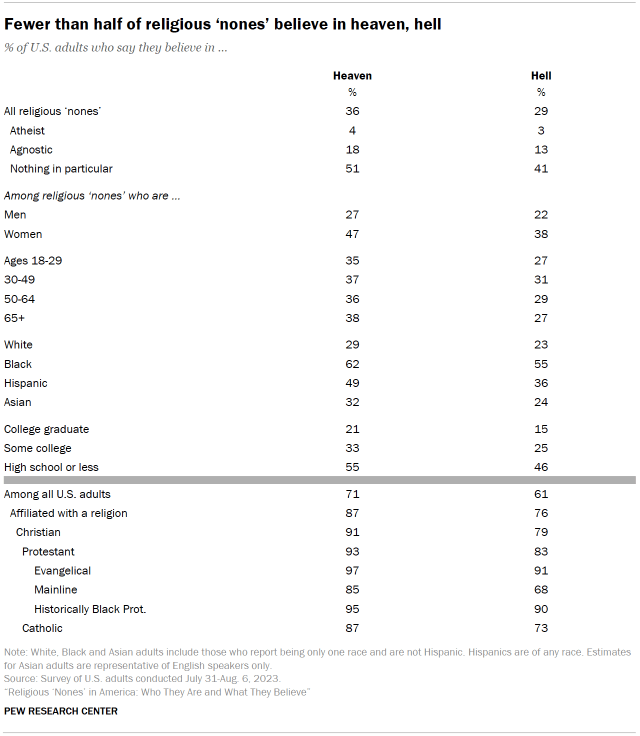
Among religious “nones,” 36% say they believe in heaven and 29% say they believe in hell.

Half of those whose religion is “nothing in particular” believe in heaven, and 41% believe in hell. Far fewer atheists and agnostics believe in either heaven or hell.

“Nones” who are women are far more likely than “nones” who are men to believe in heaven and hell.

Black and Hispanic “nones” are each more likely to believe in heaven and hell than are White and Asian “nones.”

Among “nones” with a high school education or less, 55% say they believe in heaven, and 46% believe in hell. Far fewer “nones” with college experience believe in either.

Table shows Fewer than half of religious ‘nones’ believe in heaven, hell

Overall religious commitment

We often combine questions about rates of religious attendance, frequency of prayer and religious importance to categorize Americans by their level of “religious commitment.” Though these are not the only possible measures of religious commitment, combining these three is a helpful way to see if there are clear patterns of religious engagement across different parts of the population.

In this analysis, U.S. adults who say they attend religious services at least once a week, pray daily and consider religion to be very important in their lives are categorized as having high religious commitment.

Those who say they seldom or never attend religious services, seldom or never pray, and consider religion to be not too or not at all important in their lives are categorized as having low religious commitment.

Everyone else – those who fall between the high category on one end and the low category on the other – are counted as having medium religious commitment.

A majority of “nones” (64%) fall in the low commitment category, while 35% fall in the medium category. Just 1% of “nones” exhibit high levels of religious commitment.

Half of those who identify religiously as “nothing in particular” exhibit low levels of religious commitment, and 47% exhibit a medium level of religious commitment. Most atheists and agnostics have low religious commitment.

There are big differences in the religiousness of “nones” across racial categories. A clear majority of Black “nones” (69%) fall into the medium religious commitment category, making them the “most religious” of all demographic groups analyzed. About half of Hispanic “nones” fall in the medium religious commitment category, while most White and Asian “nones” display low levels of religious commitment.

Table shows Most ‘nones’ exhibit low levels of religious commitment

Religious attendance

Table shows 90% of ‘nones’ seldom or never attend religious services

Very few “nones” attend religious services with any regularity. Fully 90% say they seldom (24%) or never (67%) attend religious services.

There are differences in rates of religious attendance by race and ethnicity.

About a quarter (24%) of Black “nones” say they attend religious services at least a few times a year, as do 16% of Hispanic “nones.” By contrast, just 6% of White “nones” and 8% of Asian “nones” report going to a church, synagogue, mosque, temple or other house of worship a few times a year or more often.

Frequency of prayer

Table shows 71% of ‘nones’ seldom or never pray

Around seven-in-ten “nones” say they seldom or never pray. Roughly three-in-ten say they pray each day (13%) or on a weekly or monthly basis (16%).

As with most other religion measures, “nones” who identify as “nothing in particular” are far more likely to say they pray than atheists or agnostics. About one-fifth (19%) of adults in the “nothing in particular” category say they pray daily.

When looking at religious “nones” of different demographic backgrounds, Black Americans, women and those with lower levels of educational attainment are more likely than their counterparts to say they pray at least monthly.

Religion’s importance

Around eight-in-ten religious “nones” say religion is not too or not at all important in their lives, while 19% say religion is somewhat or very important to them.

“Nones” who describe their religion as “nothing in particular” are more likely than atheists and agnostics to say religion is at least somewhat important to them. Still, even among those who identify as “nothing in particular,” most say religion is not too important or not at all important.

Nearly one-fifth of Black “nones” (19%) say religion is very important, while an additional 26% say it is somewhat important. This level of importance attributed to religion is much higher than for “nones” in other racial groups, particularly White and Asian “nones.”

Table shows 81% of ‘nones’ say religion is not too important or not at all important in their lives

Return to the report’s Overview.  

Find answers to other questions: 

  • Who are the ‘nones’? How are they defined? (Chapter 1)
  • Why are ‘nones’ nonreligious? (Chapter 2) 
  • Are ‘nones’ less involved in civic life than people who identify with a religion? (Chapter 3) 
  • Are ‘nones’ spiritual instead of religious? (Chapter 5) 
  • Are ‘nones’ hostile toward religion? (Chapter 6) 
  • How do ‘nones’ view science? (Chapter 7) 
  • How do ‘nones’ think about morality? (Chapter 8)

5. Are ‘nones’ spiritual instead of religious?

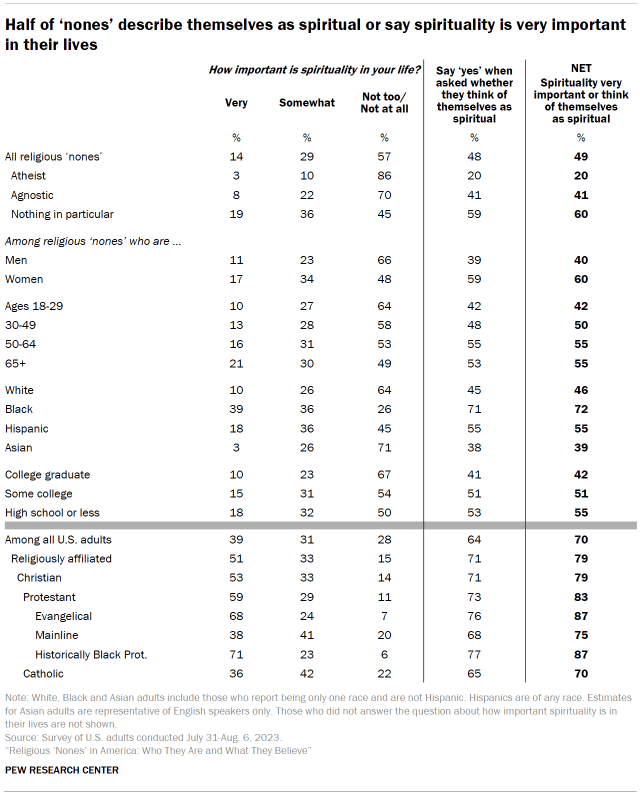
In our survey, 49% of “nones” say they think of themselves as spiritual or that spirituality is very important in their lives.

And 54% say they sometimes do things (like centering themselves, spending time in nature, meditating, exercising or practicing yoga) to connect with something bigger than themselves, with other people, or with their own “true self.”

The new survey also finds that most “nones” believe animals other than humans can have spirits or spiritual energies. Many also say this about cemeteries or other memorial sites, parts of nature like mountains and rivers, and certain objects like jewels or stones. And three-in-ten “nones” own things (like jewelry, crystals or a home shrine) or have body markings or piercings for spiritual purposes.

However, while many “nones” exhibit spirituality in these ways, these beliefs, practices and identities tend not to be unique to “nones.” In many cases, people who identify with a religion tend to be as spiritual or even more spiritual than “nones” in these ways.

For example, religiously affiliated adults are 30 percentage points more likely than “nones” to think of themselves as spiritual or to say spirituality is very important in their lives (79% vs. 49%). And religiously affiliated Americans are just as likely as “nones” to say they spend time centering themselves or spend time in nature in search of a connection with something bigger, other people or their own “true self.”

Chart shows Half of religious ‘nones’ think of themselves as spiritual or say spirituality is very important in their lives

How many ‘nones’ are spiritual?

We classify about half of U.S. “nones” as spiritual because they say “yes” when asked if they think of themselves as spiritual or they say spirituality is very important in their lives.

By comparison, 79% of religiously affiliated adults are spiritual in these ways.

Among “nones,” most people who describe their religion as “nothing in particular” are spiritual. Most agnostics and atheists are not.

Most Black “nones” (72%) are spiritual, as are 55% of Hispanic “nones.” Fewer White and Asian “nones” say they are spiritual or that spirituality is very important in their lives.

“Nones” who are women are more likely than “nones” who are men to be spiritual. And more “nones” older than 50 are spiritual compared with “nones” under 30.

Table shows Half of ‘nones’ describe themselves as spiritual or say spirituality is very important in their lives

What does being ‘spiritual’ mean to ‘nones’?

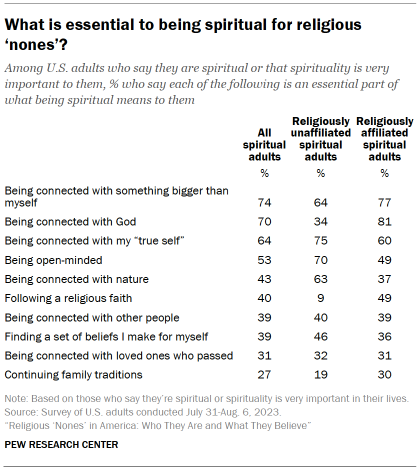
Table shows what is essential to being spiritual for religious ‘nones’?

We asked all spiritual people in the survey a series of questions about what being spiritual means to them.

Whether they are “nones” or religiously affiliated, most spiritual people say being connected with something bigger than themselves is “essential” to what being spiritual means to them. Most also say this about being connected with their “true self.”

However, majorities of spiritual “nones” say being open-minded and being connected with nature are essential parts of what being spiritual means to them, while half or fewer of spiritual people who identify with a religion say this.

Most spiritual people who identify with a religion say being connected with God is essential to what being spiritual means to them, and half say following a religious faith is a core part of their spirituality. “Nones” who are spiritual are far less likely to say these things.

Connecting with something beyond or with someone who has passed away

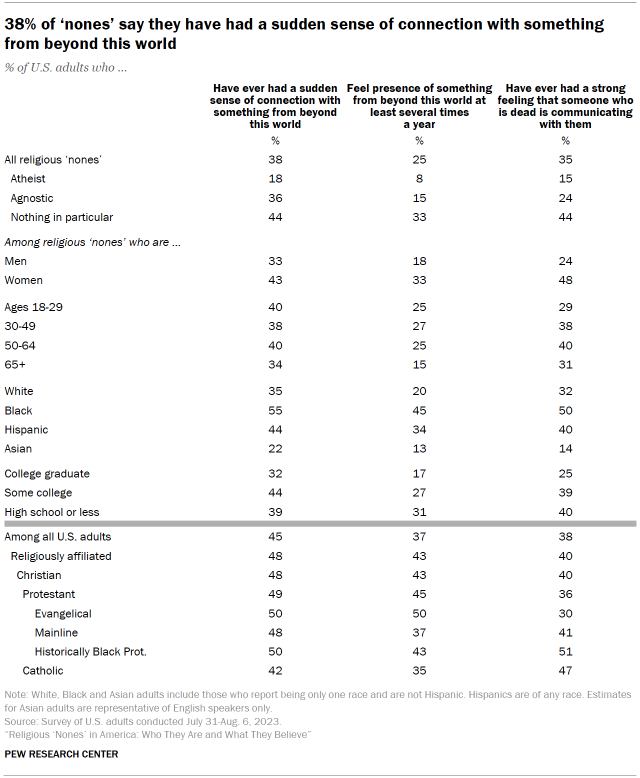
In our survey, 38% of “nones” say they have ever experienced a “sudden or unexpected feeling of connection with something from beyond this world,” while 25% say they feel the presence of something beyond this world at least several times a year.

Additionally, 35% of “nones” say they have ever experienced a strong feeling that someone who is dead is communicating with them.

Among “nones,” these experiences are all more common for those whose religion is “nothing in particular” than for atheists and agnostics.

Feelings of connection with something beyond this world are more common among “nones” who are women than “nones” who are men, and among Black and Hispanic “nones” compared with White and Asian “nones.”

Table shows 38% of ‘nones’ say they have had a sudden sense of connection with something from beyond this world

Belief that spiritual energies can be located in nature, animals, places, objects

Six-in-ten “nones” say they believe animals other than humans can have spirits or spiritual energies, while 54% say the same about parts of nature (like mountains, rivers or trees) and 47% say this about graveyards, cemeteries or other memorial sites.

Fewer “nones” say objects like crystals, jewels or stones can have spiritual energies.

Atheists are less likely than agnostics and people whose religion is “nothing in particular” to believe spiritual energies can be located in animals, parts of nature, memorial sites or objects.

And these beliefs are less common among “nones” who are men than “nones” who are women.

The survey also finds that the oldest “nones” (those older than 65) are less likely than younger “nones” to believe animals, nature, places and objects can have spirits.

Table shows 60% of ‘nones’ believe animals can have spirits; 54% say the same about parts of nature like rivers, trees

Possessions and body markings for spiritual reasons

We also asked respondents whether they have a number of things “for spiritual purposes.”

Table shows Fewer than one-fifth of ‘nones’ have crystals, jewelry, crosses for spiritual purposes

Among “nones,” 16% say they have crystals for spiritual purposes, 15% have jewelry, 13% own a cross, 11% keep a shrine, altar or icon at home, and 11% have a tattoo or piercing for spiritual purposes.

Religiously affiliated people are far more likely than “nones” to say they have a cross for spiritual purposes. Otherwise, the differences between “nones” and religiously affiliated people are fairly modest on these questions.

Return to the report’s Overview.  

Find answers to other questions: 

  • Who are the ‘nones’? How are they defined? (Chapter 1)
  • Why are ‘nones’ nonreligious? (Chapter 2) 
  • Are ‘nones’ less involved in civic life than people who identify with a religion? (Chapter 3) 
  • Are all ‘nones’ nonbelievers? (Chapter 4) 
  • Are ‘nones’ hostile toward religion? (Chapter 6) 
  • How do ‘nones’ view science? (Chapter 7) 
  • How do ‘nones’ think about morality? (Chapter 8) 
6. Are ‘nones’ hostile toward religion?

Some are. But many are not.

Chart shows Most ‘nones’ say religion causes division and superstition, but many also say it has positive effects

Around a fifth of “nones” express consistently negative views of religion. They say it does more harm than good in society, encourages superstition and causes division. These “nones” also reject a couple of positive statements about religion – that it encourages people to treat others well, and that it helps society by giving people meaning and purpose in their lives.

But most religious “nones” take a more neutral view of religion, expressing a mix of positive and negative opinions about its impact on people’s lives and on society as a whole.

Few “nones” surveyed – just 4% – express consistently positive views of religion.

Views of whether religion does more good or harm

Table shows About three-quarters of atheists say religion does more harm than good in American society

When asked directly, 43% of “nones” say religion does more harm than good in American society. A similar share says religion does equal amounts of good and harm. Fewer religious “nones” (14%) say religion does more good than harm in American society.

“Nones” are much more likely than religiously affiliated adults to believe religion does more harm than good, and much less likely to say religion does more good than harm in American society.

“Nones” with at least some college education are more likely than those with a high school diploma or less education to believe that religion does more harm than good. And White “nones” are more likely than “nones” of other races and ethnicities to believe that religion does more harm than good.

Views of whether religion fosters intolerance and superstition

Eight-in-ten “nones” agree “a great deal” or “a fair amount” with the following statement: “Religion causes division and intolerance.”

And 69% agree a great deal or a fair amount that “religion encourages superstition and illogical thinking.” This includes higher shares of atheists (91%) and agnostics (83%).

Table shows Most of the religiously unaffiliated believe that religion causes intolerance, encourages superstition

Views of whether religion can provide meaning, encourage kindness

At the same time, at least half of “nones” say religion has certain benefits for society.

Most “nones” (58%) say that the following statement – “Religion helps society by giving people meaning and purpose in their lives” – describes their own views a great deal or a fair amount, including 62% of agnostics and those who say their religion is “nothing in particular.”

A similar pattern emerges on the statement that religion “encourages people to do the right thing and treat other people well.” About half of religiously unaffiliated Americans say they agree a great deal or a fair amount that religion does this.

Table shows Half of religious ‘nones’ believe religion encourages people to do the right thing and treat others well

Return to the report’s Overview.  

Find answers to other questions: 

  • Who are the ‘nones’? How are they defined? (Chapter 1)
  • Why are ‘nones’ nonreligious? (Chapter 2) 
  • Are ‘nones’ less involved in civic life than people who identify with a religion? (Chapter 3) 
  • Are all ‘nones’ nonbelievers? (Chapter 4) 
  • Are ‘nones’ spiritual instead of religious? (Chapter 5) 
  • How do ‘nones’ view science? (Chapter 7) 
  • How do ‘nones’ think about morality? (Chapter 8)
7. How do ‘nones’ view science?

Compared with U.S. adults who identify with a religion, “nones” have a more positive view of science. At the same time, most “nones” say that there are some things science cannot explain and that there’s something spiritual beyond the natural world, even if we cannot see it.

In our survey, 56% of “nones” say they think science does more good than harm in society, which is 16 percentage points higher than the share of religiously affiliated adults who take that position.

Chart shows Most ‘nones’ say there’s something spiritual beyond natural world, science can’t explain some things

Religious “nones” are also far more likely than people who identify with a religion to say the “natural world is all there is” and “there is a scientific explanation for everything, even if we don’t understand how everything works.”

Still, most “nones” don’t think the natural world is “all there is” – 63% of “nones” say “there is something spiritual beyond the natural world, even if we cannot see it.” And 56% of “nones” say there are some things that science just can’t explain.

Views on whether science explains everything

Table shows Slight majority of religious ‘nones’ believe there are some things science cannot explain

When asked to select which of two statements comes closer to their own view, a slight majority of “nones” (56%) choose “there are some things that science cannot possibly explain,” while 44% pick “there is a scientific explanation for everything, even if we don’t understand how everything works.”

Roughly eight-in-ten atheists say there is a scientific explanation for everything, compared with 54% of agnostics and 31% of those who describe their religion as “nothing in particular.”

Among the unaffiliated, men are more likely than women to say there is a scientific explanation for everything. And White and Asian “nones” are more likely than Hispanic or Black “nones” to say this.

Over half of “nones” who are college graduates say science offers an explanation for everything (55%), compared with a third of “nones” with a high school diploma or less education (34%) who say this.

Views about impact of science on society

Table shows Majority of religious ‘nones’ say science does more good than harm in American society

A slight majority of religiously unaffiliated adults (56%) say science does more good than harm in society. Just 5% say science does more harm than good, and 37% say science does equal amounts of good and harm.

Among atheists, 79% say science does more good than harm in society, while 69% of agnostics take the same position. Fewer Americans who describe their religion as “nothing in particular” say science does more good than harm.

Unaffiliated men are more likely than unaffiliated women to say science does more good than harm. And unaffiliated adults who are college graduates express more positive views of science compared with those who have less education.

Majorities of Asian and White “nones” say science does more good than harm. Fewer Hispanic and Black “nones” say the same.

Return to the report’s Overview.  

Find answers to other questions: 

  • Who are the ‘nones’? How are they defined? (Chapter 1)
  • Why are ‘nones’ nonreligious? (Chapter 2) 
  • Are ‘nones’ less involved in civic life than people who identify with a religion? (Chapter 3) 
  • Are all ‘nones’ nonbelievers? (Chapter 4) 
  • Are ‘nones’ spiritual instead of religious? (Chapter 5) 
  • Are ‘nones’ hostile toward religion? (Chapter 6) 
  • How do ‘nones’ think about morality? (Chapter 8)
8. How do ‘nones’ think about morality?

When making decisions between right and wrong, most “nones” say they rely extensively on the desire to avoid hurting people, and on the use of logic and reason.

Overall, 83% of “nones” say the desire to avoid harming other people is extremely or very important to them when making moral decisions, while 82% say the same about the use of logic and reason.

Chart shows 82% of religious ‘nones’ say logic and reason are key factors when deciding between right and wrong

Majorities of “nones” also say feeling good when they choose right over wrong factors into their decision-making (69%), as does the desire to stay out of trouble (60%).

Like most “nones,” most religiously affiliated Americans cite each of these four considerations – not wanting to hurt people, logic and reason, feeling good when choosing the right thing, and wanting to stay out of trouble – as key factors when making decisions between right and wrong.

What most distinguishes “nones” on this survey question is a lack of reliance on religious beliefs. Just 12% of “nones” say they rely heavily on religious beliefs in deciding between right and wrong, compared with 65% of U.S. adults who identify with a religion.

Factors that influence decision-making about right and wrong

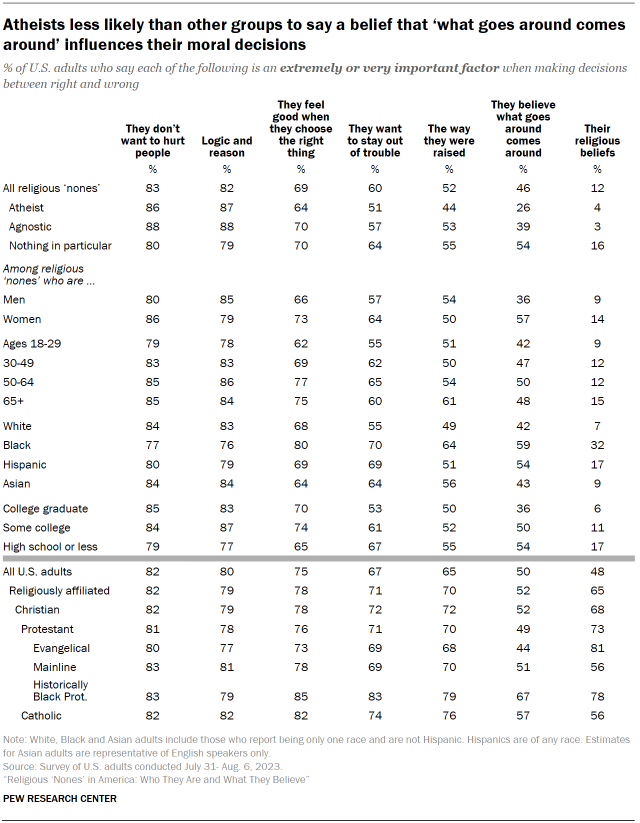
To probe the way people describe their moral calculations, the survey asked: “How important are each of the following factors when you make decisions between right and wrong?” It then listed seven possible factors, such as “your religious beliefs,” “the way you were raised,” and “logic and reason.” Respondents were asked to say whether each of the seven factors was extremely, very, somewhat, not too, or not at all important when choosing between right and wrong.

On many factors, there are relatively small differences between atheists, agnostics and adults who describe their religion as “nothing in particular.” However, just over half of respondents whose religion is “nothing in particular” say the belief that “what goes around comes around” is an extremely or very important factor when they make moral decisions, which is notably higher than the share of agnostics and atheists who say this.

Religiously affiliated adults are much more likely than “nones” to say their religious beliefs and the way they were raised play an extremely or very important role when they are making moral decisions.

Table shows Atheists less likely than other groups to say a belief that ‘what goes around comes around’ influences their moral decisions

Views on whether belief in God is necessary for morality

Almost all agnostics (98%) and atheists (97%) say it is possible to be moral and have good values without believing in God. A somewhat smaller majority of those who describe their religion as “nothing in particular” say this (83%).

Just 10% of “nones” overall say belief in God is necessary to be moral and have good values.

There are few differences by gender and age on this question among “nones.” And majorities of “nones” in all racial and ethnic categories agree it’s possible to be moral without believing in God.

However, 27% of Black “nones” say it is necessary to believe in God to be moral and have good values, which is higher than the shares of Hispanic, Asian or White “nones” who say this.

Among adults who identify with a religion, 65% say it’s possible to be moral and have good values without believing in God, while one-third say belief in God is necessary to be moral and have good values.

Table shows Large majority of religiously unaffiliated adults say it is possible to have good values without believing in God

Return to the report’s Overview.  

Find answers to other questions: 

  • Who are the ‘nones’? How are they defined? (Chapter 1)
  • Why are ‘nones’ nonreligious? (Chapter 2) 
  • Are ‘nones’ less involved in civic life than people who identify with a religion? (Chapter 3) 
  • Are all ‘nones’ nonbelievers? (Chapter 4) 
  • Are ‘nones’ spiritual instead of religious? (Chapter 5) 
  • Are ‘nones’ hostile toward religion? (Chapter 6) 
  • How do ‘nones’ view science? (Chapter 7) 

Acknowledgments

Pew Research Center is a subsidiary of The Pew Charitable Trusts, its primary funder. This report and related research on religion and spirituality in the United States was funded by The Pew Charitable Trusts with support from the Lilly Endowment Inc., Templeton Religion Trust, The Arthur Vining Davis Foundations and the M.J. Murdock Charitable Trust.

This report is a collaborative effort based on the input and analysis of the following individuals. Find related reports online at pewresearch.org/pewresearch-org/religion.

Primary Researcher

Gregory A. Smith, Associate Director, Religion Research

Research Team

Alan Cooperman, Director, Religion Research
Becka A. Alper, Senior Researcher        
Besheer Mohamed, Senior Researcher
Michael Rotolo, Research Associate     
Patricia Tevington, Research Associate
Justin Nortey, Research Analyst      
Asta Kallo, Research Assistant
Kirsten Lesage, Research Associate

Methods Team         

Courtney Kennedy, Vice President, Methods and Innovation
Andrew Mercer, Senior Research Methodologist
Scott Keeter, Senior Survey Advisor
Dorene Asare-Marfo, Panel Manager          
Dana Popky, Associate Panel Manager
Anna Brown, Research Methodologist
Arnold Lau, Research Methodologist                       

Editorial and Graphic Design

Jeff Diamant, Senior Writer/Editor
Rebecca Leppert, Copy Editor
Bill Webster, Senior Information Graphics Designer

Communications and Web Publishing

Achsah Callahan, Communications Manager
Reem Nadeem, Digital Producer    
Anna Schiller, Associate Director, Communications
Stacy Rosenberg, Director, Digital Strategy

In addition, Pew Research Center is grateful to a panel of expert advisers who provided valuable advice on this project: Nancy T. Ammerman, professor emerita of sociology of religion at Boston University; Ryan Cragun, professor of sociology at The University of Tampa; Penny Edgell, professor of sociology at the University of Minnesota; Jacqui Frost, assistant professor of sociology at Purdue University; John C. Green, director emeritus of The Ray C. Bliss Institute of Applied Politics and distinguished professor emeritus of political science at The University of Akron; Jaime Kucinskas, chair and associate professor of sociology at Hamilton College; and Brian Steensland, department chair and professor of sociology at Indiana University-Purdue University Indianapolis (IUPUI).

Methodology

The American Trends Panel survey methodology (Wave 132)

Overview

The American Trends Panel (ATP), created by Pew Research Center, is a nationally representative panel of randomly selected U.S. adults. Panelists participate via self-administered web surveys. Panelists who do not have internet access at home are provided with a tablet and wireless internet connection. Interviews are conducted in both English and Spanish. The panel is being managed by Ipsos.

Most of the data in this report is drawn from ATP Wave 132, conducted from July 31 to Aug. 6, 2023. A total of 11,201 panelists responded out of 12,932 who were sampled, for a response rate of 87%. The cumulative response rate accounting for nonresponse to the recruitment surveys and attrition is 3%. The break-off rate among panelists who logged on to the survey and completed at least one item is 1%. The margin of sampling error for the full sample of 11,201 respondents is plus or minus 1.4 percentage points.

Panel recruitment

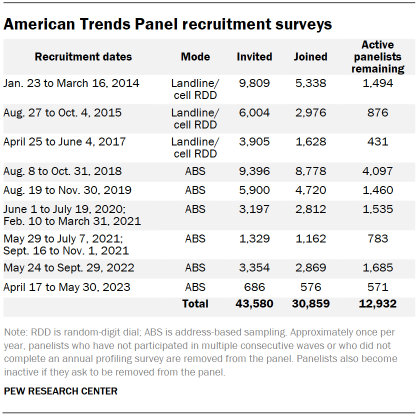
Table shows American Trends Panel recruitment surveys

The ATP was created in 2014, with the first cohort of panelists invited to join the panel at the end of a large, national, landline and cellphone random-digit-dial survey that was conducted in both English and Spanish. Two additional recruitments were conducted using the same method in 2015 and 2017, respectively. Across these three surveys, a total of 19,718 adults were invited to join the ATP, of whom 9,942 (50%) agreed to participate.

In August 2018, the ATP switched from telephone to address-based sampling (ABS) recruitment. A study cover letter and a pre-incentive are mailed to a stratified, random sample of households selected from the U.S. Postal Service’s Delivery Sequence File. This Postal Service file has been estimated to cover as much as 98% of the population, although some studies suggest that the coverage could be in the low 90% range.5 Within each sampled household, the adult with the next birthday is asked to participate. Other details of the ABS recruitment protocol have changed over time but are available upon request.6

We have recruited a national sample of U.S. adults to the ATP approximately once per year since 2014. In some years, the recruitment has included additional effort (known as an “oversample”) to boost sample size with under-represented groups. For example, Hispanic adults, Black adults, and Asian adults were oversampled in 2019, 2022 and 2023, respectively.

Across the six address-based recruitments, a total of 23,862 adults were invited to join the ATP, of whom 20,917 agreed to join the panel and completed an initial profile survey. Of the 30,859 individuals who have ever joined the ATP, 12,932 remained active panelists and continued to receive survey invitations at the time this survey was conducted.

The American Trends Panel never uses breakout routers or chains that direct respondents to additional surveys.

Sample design

The overall target population for this survey was noninstitutionalized persons ages 18 and older living in the U.S., including Alaska and Hawaii. All active panel members were invited to participate in this wave.

Questionnaire development and testing

The questionnaire was developed by Pew Research Center in consultation with Ipsos. The web program was rigorously tested on both PC and mobile devices by the Ipsos project management team and Pew Research Center researchers. The Ipsos project management team also populated test data that was analyzed in SPSS to ensure the logic and randomizations were working as intended before launching the survey.

Incentives

All respondents were offered a post-paid incentive for their participation. Respondents could choose to receive the post-paid incentive in the form of a check or a gift code to Amazon.com or could choose to decline the incentive. Incentive amounts ranged from $5 to $20 depending on whether the respondent belongs to a part of the population that is harder or easier to reach. Differential incentive amounts were designed to increase panel survey participation among groups that traditionally have low survey response propensities.

Data collection protocol

The data collection field period for this survey was July 31 to Aug. 6, 2023. Postcard notifications were mailed to all ATP panelists with a known residential address on July 31. 

Invitations were sent out in two separate launches: soft launch and full launch. Sixty panelists were included in the soft launch, which began with an initial invitation sent on July 31. The ATP panelists chosen for the initial soft launch were known responders who had completed previous ATP surveys within one day of receiving their invitation. All remaining English- and Spanish-speaking sampled panelists were included in the full launch and were sent an invitation on Aug. 1.

All panelists with an email address received an email invitation and up to two email reminders if they did not respond to the survey. All ATP panelists who consented to SMS messages received an SMS invitation and up to two SMS reminders.

Table shows Invitation and reminder dates, ATP Wave 132

Data quality checks

To ensure high-quality data, the Center’s researchers performed data quality checks to identify any respondents showing clear patterns of satisficing. This includes checking for very high rates of leaving questions blank, as well as always selecting the first or last answer presented. As a result of this checking, one ATP respondent was removed from the survey dataset prior to weighting and analysis.

Weighting

Table shows American Trends Panel weighting dimensions

The ATP data is weighted in a multistep process that accounts for multiple stages of sampling and nonresponse that occur at different points in the survey process. First, each panelist begins with a base weight that reflects their probability of selection for their initial recruitment survey. These weights are then rescaled and adjusted to account for changes in the design of ATP recruitment surveys from year to year. Finally, the weights are calibrated to align with the population benchmarks in the accompanying table to correct for nonresponse to recruitment surveys and panel attrition. If only a subsample of panelists was invited to participate in the wave, this weight is adjusted to account for any differential probabilities of selection.

Among the panelists who completed the survey, this weight is then calibrated again to align with the population benchmarks identified in the accompanying table and trimmed at the 1st and 99th percentiles to reduce the loss in precision stemming from variance in the weights. Sampling errors and tests of statistical significance take into account the effect of weighting.

The following table shows the unweighted sample sizes and the error attributable to sampling that would be expected at the 95% level of confidence for different groups in the survey.

Table shows Sample sizes and margins of error, ATP Wave 132

Sample sizes and sampling errors for other subgroups are available upon request. In addition to sampling error, one should bear in mind that question wording and practical difficulties in conducting surveys can introduce error or bias into the findings of opinion polls.

Dispositions and response rates

Table shows Final dispositions, ATP Wave 132
Table shows Cumulative response rate as of ATP Wave 132

Other data sources

In addition to Wave 132, some of the analyses in this report draws on the Center’s National Public Opinion Reference Survey (NPORS) and on the following ATP waves:

  • Wave 117, conducted Nov. 16-27, 2022
  • Wave 114, conducted Sept. 13-18, 2022
  • Wave 113, conducted Aug. 1-14, 2022
  • Wave 107, conducted April 25-May 1, 2022
  • Wave 98, conducted Oct. 18-24, 2021
  • Wave 91, conducted June 14-27, 2021

© Pew Research Center, 2023