Pew Research Center

FOR RELEASE OCTOBER 11, 2023

Religion Among Asian Americans

A rising share say they have no religion, but many consider themselves close to one or more religious traditions for reasons such as family or culture

FOR MEDIA OR OTHER INQUIRIES:

Communications Department
202.419.4372
www.pewresearch.org

RECOMMENDED CITATION

Pew Research Center, October 2023, "Religion Among Asian Americans"

About Pew Research Center

Pew Research Center is a nonpartisan, nonadvocacy fact tank that informs the public about the issues, attitudes and trends shaping the world. It does not take policy positions. The Center conducts public opinion polling, demographic research, computational social science research and other data-driven research. It studies politics and policy; news habits and media; the internet and technology; religion; race and ethnicity; international affairs; social, demographic and economic trends; science; research methodology and data science; and immigration and migration. Pew Research Center is a subsidiary of The Pew Charitable Trusts, its primary funder.

© Pew Research Center 2026

Table of contents

  • About Pew Research Center
  • Religion Among Asian Americans
  • 1. Christianity among Asian Americans
  • 2. Buddhism among Asian Americans
  • 3. Hinduism among Asian Americans
  • 4. Islam among Asian Americans
  • 5. Confucianism and Daoism among Asian Americans
  • 6. Religiously unaffiliated Asian Americans
  • Methodology: Survey
  • Methodology: Focus groups
  • Acknowledgments

Religion Among Asian Americans

A rising share say they have no religion, but many consider themselves close to one or more religious traditions for reasons such as family or culture

How we did this

Pew Research Center conducted this analysis to understand the religious identities, experiences and practices of people of Asian origin or ancestry living in the United States. The study is part of the Center’s multiyear research effort focused on the nation’s Asian population. Its centerpiece is a nationally representative survey of 7,006 Asian adults. The survey sampled U.S. adults who self-identify as Asian, either alone or in combination with other races or Hispanic ethnicity. It was offered in six languages: Chinese (Simplified and Traditional), English, Hindi, Korean, Tagalog and Vietnamese. Responses were collected from July 5, 2022, to Jan. 27, 2023, by Westat on behalf of Pew Research Center.

The survey includes a large enough sample to report on the views of the six biggest origin groups among Asian Americans: Chinese, Filipino, Indian, Japanese, Korean and Vietnamese. Together, these six groups constitute 81% of all U.S. Asian adults, according to a Center analysis of the Census Bureau’s 2021 American Community Survey (ACS). These six groups are discussed throughout the report.

Findings for Asian origin groups other than the six largest are also included in the report – in the survey findings for U.S. Asian adults overall, and in findings about the “NET East Asian,” “NET South Asian” and “NET Southeast Asian” populations. Origin groups other than the six largest each comprise about 2% or less of the Asian population in the U.S., making it challenging to recruit nationally representative samples for any of them.

Survey respondents were drawn from a national sample of residential mailing addresses, which included addresses from all 50 states and the District of Columbia. Specialized surnames list frames maintained by the Marketing Systems Group were used to supplement the sample. Those eligible to complete the survey were offered the opportunity to do so online or by mail with a paper questionnaire. For more details, read the survey Methodology. For questions used in this analysis, refer to the Topline Questionnaire.

In addition to the survey results, the report draws on guided small group discussions (focus groups) and in-depth one-on-one interviews. Details on these can be found in the focus group Methodology.

Pew Research Center is a subsidiary of The Pew Charitable Trusts, its primary funder. The Center’s Asian American portfolio was funded by The Pew Charitable Trusts, with generous support from The Asian American Foundation; Chan Zuckerberg Initiative DAF, an advised fund of the Silicon Valley Community Foundation; the Robert Wood Johnson Foundation; the Henry Luce Foundation; the Doris Duke Foundation; The Wallace H. Coulter Foundation; The Dirk and Charlene Kabcenell Foundation; The Long Family Foundation; Lu-Hebert Fund; Gee Family Foundation; Joseph Cotchett; the Julian Abdey and Sabrina Moyle Charitable Fund; and Nanci Nishimura.

We would also like to thank the Leaders Forum for its thought leadership and valuable assistance in helping make this survey possible.

The qualitative research on Asian American Muslims, and the strategic communications campaign used to promote the research portfolio, were made possible with generous support from the Doris Duke Foundation.

Terminology

Asians living in the United States/U.S. Asian population/Asian Americans: Used interchangeably throughout this report to refer to U.S. adults who self-identify as Asian, either alone or in combination with other races or Hispanic identity.

Ethnicity/Ethnic origin labels: Used interchangeably in this report for findings for ethnic origin groups, such as Chinese, Filipino, Indian, Japanese, Korean or Vietnamese. For this report, ethnicity is not nationality. For example, Chinese in this report are those self-identifying as of Chinese ethnicity, rather than necessarily being a current or former citizen of the People’s Republic of China. Ethnic origin groups in this report include those who self-identify as one Asian ethnicity only, either alone or in combination with a non-Asian race or ethnicity.

Less populous Asian origin groups/Other Asian origin groups: In this report, those who self-identify with ethnic origin groups other than the six largest Asian origin groups (e.g., those who identify as Burmese, Hmong or Pakistani). The term includes those who identify with only one Asian ethnicity. These ethnic origin groups each represent about 2% or less of the overall Asian American population and are unreportable on their own due to small sample sizes. They are collectively reportable under this broader category.

Asian origins/Asian origin groups: Used interchangeably throughout this report to describe ethnic origin groups.

Immigrant: Someone who was not a U.S. citizen at birth – in other words, someone born outside the U.S., Puerto Rico or other U.S. territories to parents who are not U.S. citizens. Also referred to as “foreign born” in this report.  

U.S. born: Those born in the 50 U.S. states or the District of Columbia, Puerto Rico or other U.S. territories.

Like the U.S. public as a whole, a growing percentage of Asian Americans are not affiliated with any religion, and the share who identify as Christian has declined, according to a new Pew Research Center survey exploring religion among Asian American adults.
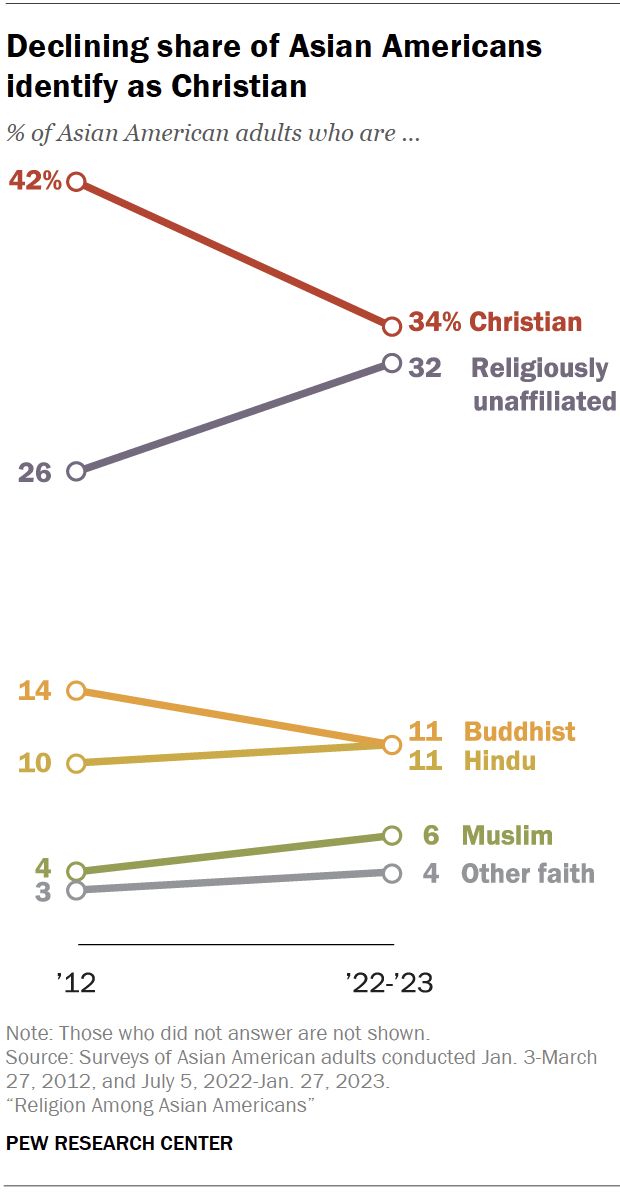
A line chart showing a declining share of Asian Americans identify as Christian.

But the survey also shows that 40% of Asian Americans say they feel close to some religious tradition for reasons aside from religion. For example, just 11% of Asian American adults say their religion is Buddhism, but 21% feel close to Buddhism for other reasons, such as family background or culture.

Religious profile of Asian Americans

  • Today, 32% of Asian Americans are religiously unaffiliated, up from 26% in 2012.
  • Christianity is still the largest faith group among Asian Americans (34%).
  • But Christianity has also seen the sharpest decline, down 8 percentage points since 2012.
  • Asian American Christians are about evenly split between Catholics and Protestants (17% and 16% of all U.S. Asian adults, respectively). Born-again or evangelical Protestants make up 10% of Asian Americans.
  • Buddhists and Hindus each account for about one-in-ten Asian Americans, while Muslims make up 6%.
  • Various other religious groups (including Daoists, Jains, Jews, Sikhs and others) together make up about 4% of all Asian American adults.

Jump to chapters on …

  • Asian American Christians
  • Asian American Buddhists
  • Asian American Hindus
  • Asian American Muslims
  • Confucianism and Daoism among Asian Americans
  • Asian Americans who are religiously unaffiliated

The survey also asked Asian Americans how important religion is in their lives (31% say it is very important), how often they attend religious services (29% report that they go at least monthly), and whether they have an altar, shrine or religious symbol that they use for home worship (36% say they do).

Of the major Asian American religious groups, Protestants and Muslims are the most likely to report that they attend religious services at least once a month. By contrast, Buddhists and Hindus are especially likely to say they worship at shrines or altars in their homes.

Differences in religious affiliation among Asian origin groups

There are large differences in religious affiliation among Asian Americans depending on their ethnic origin group. For example:

  • 56% of Chinese Americans and 47% of Japanese Americans are not affiliated with any religion – the highest percentages of “nones” among the Asian origin groups that are large enough to be analyzed in the survey.
  • Three-quarters of Filipino Americans are Christian, mostly Catholic.
  • 59% of Korean Americans are Christian, mostly Protestant – including 34% who identify as born-again or evangelical Protestants. 
  • Indian Americans are far more likely than the other large Asian origin groups to be Hindu (48%), though a fair number of Indian Americans are Christian (15%), Muslim (8%) or Sikh (8%).
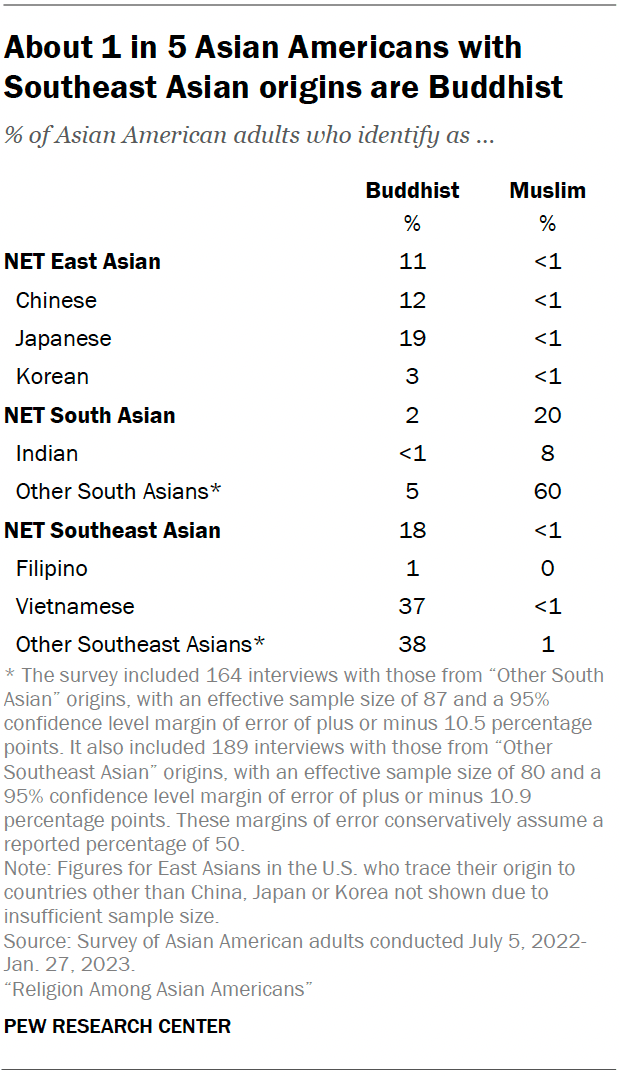
  • Vietnamese Americans are the most likely of the large origin groups to identify as Buddhist (37%).
A bar chart showing that most Filipino and Korean Americans are Christian; about half of Chinese Americans are religiously unaffiliated.
A table showing that about 1 in 5 Asian Americans with Southeast Asian origins are Buddhist.

These six Asian origin groups – Chinese, Filipino, Indian, Japanese, Korean and Vietnamese Americans – account for 81% of all Asian Americans.1

The survey did not include enough interviews with respondents in other Asian origin groups to be able to report on them separately. However, the members of less populous Asian origin groups were included in the study, and it is possible to analyze them when they are grouped together by region. Doing this reveals some additional patterns. For example:

  • 60% of South Asians in the United States other than Indian Americans (i.e., those who trace their origins to countries including Pakistan, Bangladesh, Nepal, Sri Lanka and Bhutan) are Muslim – higher than any of the six largest Asian origin groups.
  • 38% of U.S. adults who trace their origin to Southeast Asian countries other than the Philippines and Vietnam are Buddhist.

These are among the key findings of a nationally representative, multilingual survey of 7,006 Asian American adults conducted by Pew Research Center from July 5, 2022, to Jan. 27, 2023. The Center previously has published other findings from this survey. 2

Importance of religion
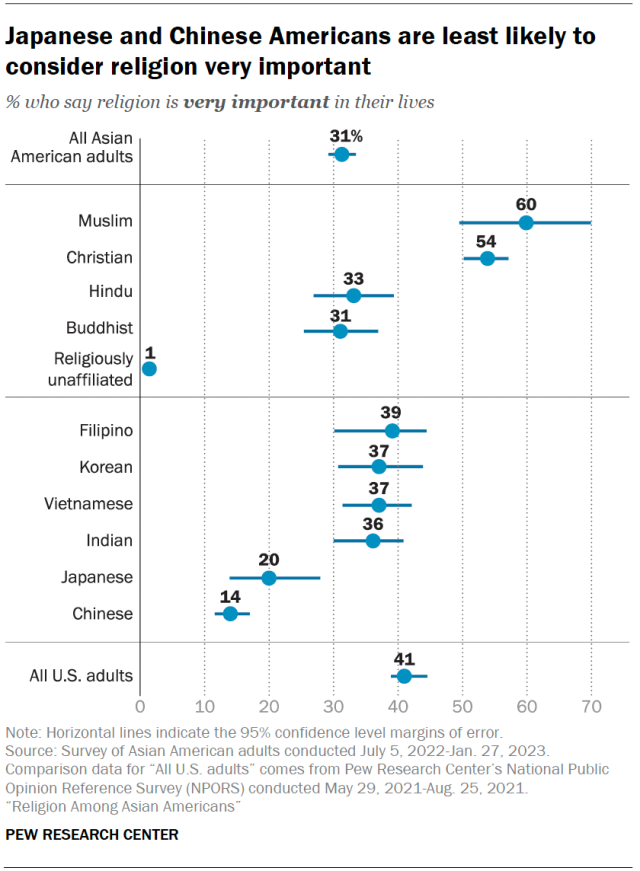
A dot plot showing that Japanese and Chinese Americans are least likely to consider religion very important.

While nearly a third of Asian Americans say religion is very important in their lives, Asian American Muslims (60%) and Christians (54%) are much more likely than Asian American Hindus (33%) and Buddhists (31%) to feel that way.

Looking at Asian Americans by their ethnic origin group, Japanese and Chinese Americans are notably less likely than members of other Asian origin groups to say religion is very important in their lives, reflecting the large number of “nones” (those who describe their religion as atheist, agnostic or “nothing in particular”) in these two groups.

As a whole, Asian Americans born in the U.S. are somewhat less likely than Asian Americans born elsewhere to say religion is very important in their lives. And Asian Americans overall are somewhat less likely than the general U.S. population to say religion is very important in their lives (31% vs. 41%).

Attending religious services
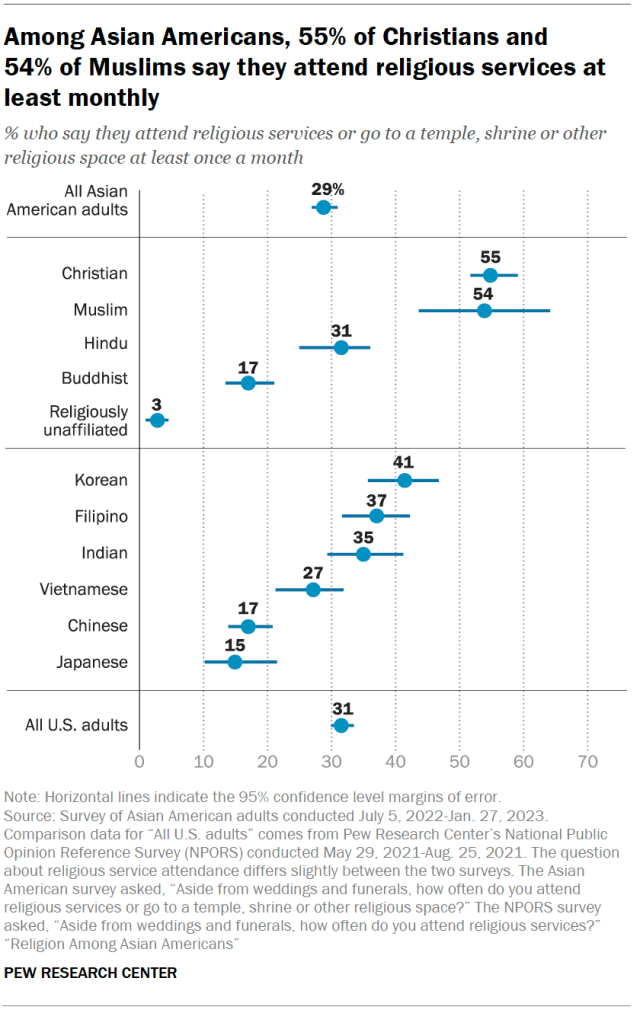
A dot plot showing that, among Asian Americans, 55% of Christians and       54% of Muslims say they attend religious services at least monthly.

About three-in-ten Asian Americans (29%) say they attend religious services or go to a temple, shrine or other religious space at least once a month, including 21% who say they do so weekly or more often.

Asian American Christians and Muslims are more likely than Asian American Buddhists, Hindus or “nones” to say they attend religious services at least monthly.

Regular religious attendance is more common among Korean and Filipino Americans than among Vietnamese, Japanese or Chinese Americans. (As previously noted, Korean and Filipino Americans are also more likely to be Christian.)

Overall, foreign-born Asian Americans are more likely than those born in the U.S. to attend religious services at least monthly (32% vs. 21%).

On this question, Asian Americans closely resemble U.S. adults as a whole, 31% of whom say they attend religious services at least once a month, including 25% who say they do so weekly or more often, according to an August 2021 survey.

Home worship: Shrines, altars and religious symbols

A dot plot showing that most Vietnamese and Indian Americans have shrine, altar or religious symbol for worship at home.

In some Asian religious traditions, religious practice is centered in the home rather than in a communal setting. About one-third of Asian Americans (36%) say their home contains an altar, shrine or religious symbol that they use for worship.

Using an altar, shrine or other religious symbol for worship in the home is most common among Vietnamese and Indian Americans, in part because this is a relatively common practice among Buddhists (who make up 37% of the Vietnamese American population) and Hindus (who make up 48% of the Indian American population).

Worshipping at home is also fairly common among Filipino Americans, owing to the large share of Catholics within the Filipino American population – 66% of Filipino Catholics in the U.S. say they have an altar, shrine or religious symbol used for worship in their home, compared with just 9% of other Filipino Americans.

A table showing that relatively few Asian Americans are both regular service attenders and have a shrine, altar or symbol for worship at home.

While 36% of Asian Americans say they use a shrine, altar or religious symbol to worship at home, and 29% say they regularly attend religious services, only 15% say they do both of these things. This pattern reflects the varying worship practices of different religious groups.

For example, about half of Asian American Protestants (53%) say they attend religious services monthly but don’t worship at a home altar. About half of Buddhists (51%) and Hindus (52%) say the opposite: They do not attend religious services monthly, but they do worship at a home altar.

Sizable numbers of Asian American Catholics (29%) and Hindus (27%) engage in both practices, attending religious services monthly and worshipping at a home altar or shrine.

Feeling ‘close to’ a religion for reasons such as family background or culture
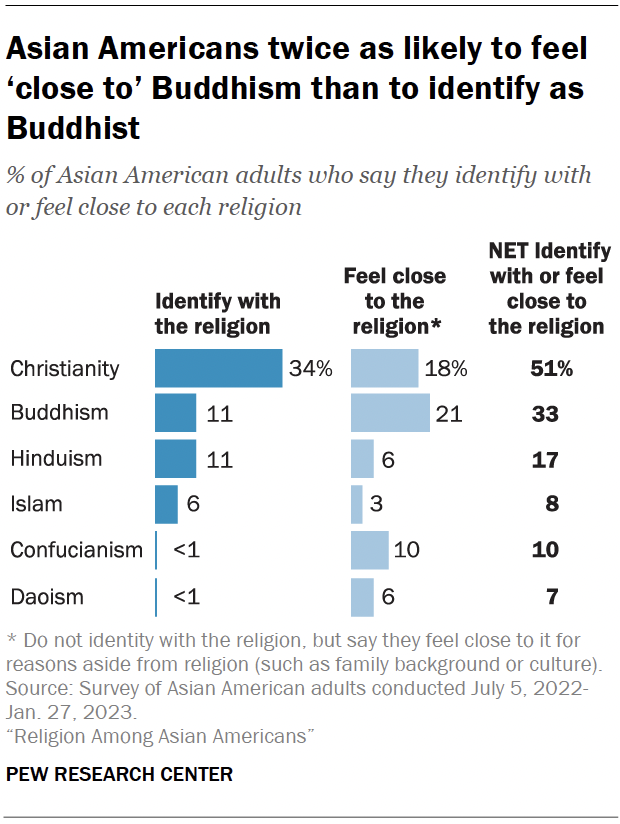
A bar chart showing that Asian Americans twice as likely to feel ‘close to’ Buddhism than to identify as Buddhist.

In the U.S., being Christian is often perceived as an exclusive religious identity with a clear set of associated beliefs (such as a creed) and normative practices (such as attending religious services). In many Asian countries, however, religion and religious identity are often understood differently.3

For example, the practices and beliefs associated with Buddhism, Hinduism, Daoism (or Taoism), Shintoism and Confucianism are often so infused in daily life in Asian countries that even people who do not identify with those religious groups may accept some of their beliefs and engage in some of their rituals.

The lines between members and nonmembers, as well as between the religious groups themselves, can be fuzzy. In China and Japan, for example, many individual temples and shrines are associated with multiple traditions. (Read the sidebar about the words for “religion” in Asian languages.)

A bar chart showing that 4 in 10 Asian Americans say they ‘feel close’ to at least one religion that they don’t personally identify with.

Asian Americans are at the intersection of these two ways of being religious. Many identify with a specific religion, such as Christianity or Islam. However, many who do not identify with a specific religion still say they consider themselves close to the religious or philosophical traditions that are common in their country of ancestry. In addition, some Asian Americans say they feel close to multiple faith traditions. 

The survey measured these ways of being religious with two questions. The first asked: “What is your present religion, if any?”4 The second question asked: “Aside from religion, do you consider yourself close to any of the following traditions for other reasons (such as your family background or culture)?”5

In total, 40% of Asian American adults express a connection to one or more groups that they do not claim as a religious identity.
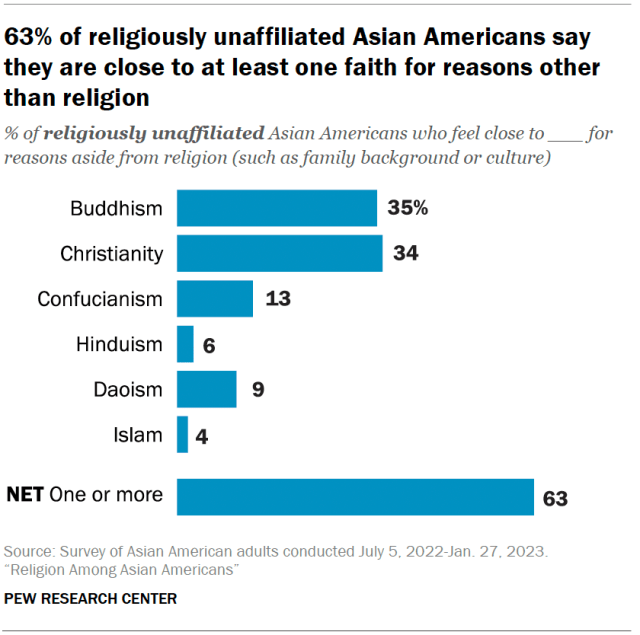
A bar chart showing that 63% of religiously unaffiliated Asian Americans say they are close to at least one faith for reasons other than religion.

For example, 21% of Asian American adults do not identify religiously as Buddhist but say they feel close to Buddhism “aside from religion,” while 18% do not identify religiously as Christian, yet say they feel close to Christianity aside from religion. And 10% express a similar connection to Confucianism.

About two-thirds of religiously unaffiliated Asian Americans (63%) say they are close to at least one of these religious traditions. (Jump to the chapter on religiously unaffiliated Asian Americans for more on this.)

The meaning of ‘religion’ in East Asia

In many East Asian languages, there is no single, literal equivalent of the English word “religion.” The modern Chinese, Japanese and Korean terms for religion – zongjiao, shūkyō and jonggyo – were all created in the early 20th century by Asian scholars working with Western texts who wanted to translate “religion” from Western languages and needed to invent a word.

Their definitions of religion were influenced by Christian religious norms, rather than developing organically from Buddhist, Confucian, Shinto, Daoist or other religious traditions that are more common in those countries, as we noted in our 2023 report, “Measuring Religion in China.”

To this day, the words for “religion” in many East Asian countries and some parts of Southeast Asia refer primarily to organized forms of religion, particularly those with professional clergy and institutional oversight. The Chinese term zongjiao and its Japanese and Korean equivalents do not typically refer to some traditional religious beliefs and practices that are common in these countries.

Across East Asia, there are many beliefs (such as in spirits) and practices (such as visiting shrines and making offerings to ancestors) that might be considered religious, broadly speaking. But there is little emphasis in these countries on membership in congregations or denominations, except among Christians and Muslims.

These differences might lead Americans of East Asian origin to say they do not identify with any religion or that religion is not very important in their lives, because they do not consider their traditional spiritual practices – or cultural customs that have a spiritual underpinning – to be “religious” in nature. In a series of small group conversations, some focus group participants made this point. And the survey data supports it: More Asian Americans say they are close to Buddhism for reasons such as ancestry or culture than say Buddhism is their religion.

A similar dynamic exists in Asian countries. In China, for example, the share of adults who consider Buddhism to be their formal religion (zongjiao) is 4%, according to the 2018 Chinese General Social Survey data. But the share who believe in Buddha and/or bodhisattvas is 33%, according to the 2018 China Family Panel Studies survey.

Findings from our focus groups

After conducting the survey, the Center arranged small group conversations (focus groups) and one-on-one interviews with a total of more than 100 Asian Americans to gain an understanding of what religion means to them in their own words.6 In the conversations, participants were asked to discuss the nature of their connections to religions they may not claim as their own.7

These are some of the most common themes that emerged on this topic:

Many people we talked to, including those who are religiously unaffiliated, expressed a cultural connection to the dominant religious tradition in their country of origin. This sentiment was also apparent in the survey results, which show, for example, that Indian Americans who are religiously unaffiliated say they feel close to Hinduism aside from religion at much higher rates than do religious “nones” of other Asian origin groups.

For some non-Christians we talked to in these conversations, feeling close to Christianity is an unavoidable result of living in the United States. One Indian American focus group participant who grew up in the U.S. and is not Christian, but who said she considers herself close to Christianity, explained: “My whole life I was exposed to Christmas and all this stuff. Even though I don’t believe in it, we had to give gifts … so it was always part of our culture, even though we don’t believe in it.” In the survey, 34% of religiously unaffiliated U.S. Asian adults (representing 18% of Asian Americans overall) said they feel close to Christianity even though they do not identify as Christians.

Some participants in these conversations said there is a natural affinity or closeness between certain pairs of religions that have shared beliefs, values or practices. For example, a Hindu participant expressed a personal connection to Buddhism “because some of the practices of Buddhists, they are very much similar to [Hindu practices].” And a Muslim participant drew parallels between Islam and Christianity, saying “in Islam and in Christianity there’s a lot common.”

Finally, some people we talked to questioned whether Confucianism or Daoism should be seen as religions. In the words of one Vietnamese Buddhist, “Confucianism and Daoism is part of my culture. However, for me, it’s a school of philosophy. I do not identify myself as being a Daoist or Confucian.” Another participant said of Confucianism, “There’s no deity there. So it’s only … a philosophy.” This view aligns with the survey’s findings on Asian Americans’ views on Confucianism and Daoism. (Jump to the chapter on Confucianism and Daoism.)

Other key findings

In addition to the overall religious profiles of Asian American ethnic groups, other key findings from the survey include:

  • 12% of Asian Americans neither identify with, nor feel close to, any of the religions or philosophical traditions measured in the survey.
  • 30% of Asian Americans say all or most of their friends have the same religion they do. This share is slightly lower among Buddhists (21%) than among Asian Americans in other religious groups analyzed.
  • 77% of Asian Americans say they would be comfortable if a family member married outside of their faith. This is slightly lower than the share saying they would be comfortable if a family member married someone who is not Asian (86%) or married someone who is Asian but has a different ethnicity (87%). Korean Americans are less likely than other Asian Americans to say they would be comfortable with a family member marrying outside of their faith.

The remainder of this report details the survey’s findings about Asian American adults who identify with – or feel close to – six religions or philosophical traditions. Click the links below to jump to each chapter.

Christianity | Buddhism | Hinduism | Islam | Confucianism and Daoism | Religiously unaffiliated
1. Christianity among Asian Americans

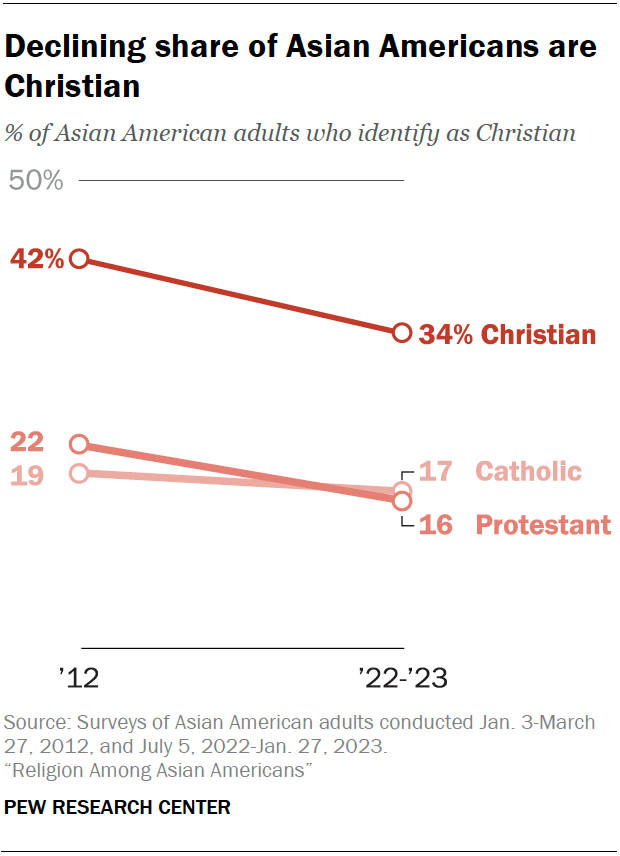
Despite recent declines, Christianity is still the most common religion among Asian Americans. About a third of Asian American adults (34%) say their present religion is Christianity, down from 42% when Pew Research Center last conducted an in-depth survey of Asian Americans, in 2012.

A line chart that shows declining share of Asian Americans are
Christian.

Looking at the largest subgroups within Christianity, Protestants now make up 16% of the Asian American population, down from 22% in 2012. (This includes 10% of Asian American adults who identify as born-again or evangelical Protestants, compared with 13% in 2012.) The Catholic share is more stable: 17% of Asian American adults are Catholic today, about the same as in 2012 (19%).

A table showing that about half of Asian Americans are either Christian or
consider themselves close to Christianity.

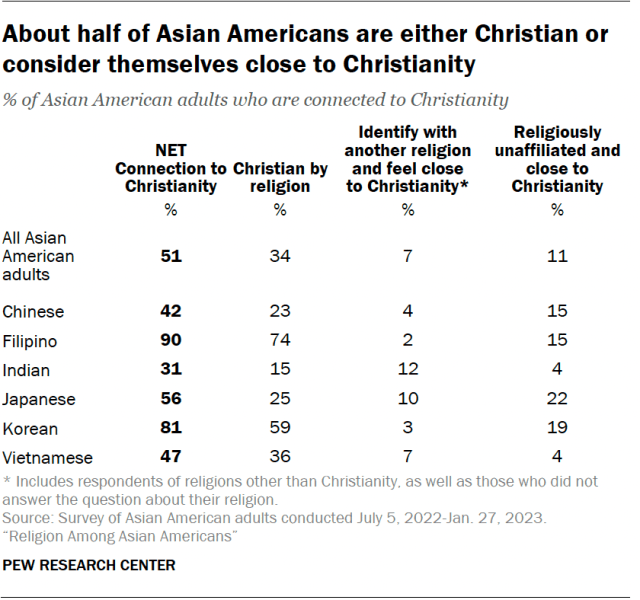
Another 18% of Asian Americans, while not identifying as Christians, say they feel “close to” Christianity “aside from religion” for reasons such as family background or culture. Combining this group with the share who say they are Christian, about half (51%) of Asian adults in the United States express a connection to Christianity. (Read more on the difference between religious identity and connections aside from religion in the Overview.)

A table showing that most Filipino Americans are Catholic.

Filipino (74%) and Korean (59%) Americans are especially likely to say their religion is Christianity. When combined with those who say they feel close to Christianity aside from religion, 90% of Filipino Americans express some connection to Christianity, as do 81% of Korean Americans.

Most Filipino Americans are Catholic (57%). Korean Americans, meanwhile, are more likely to be Protestant: 34% are evangelical Protestants and 12% are nonevangelicals.

In each of the other large Asian origin groups, well under half identify as Christian by religion. Indian Americans are among the least likely of the large Asian origin groups to identify as Christian: Just 15% say Christianity is their religion.

However, all the large Asian origin groups include substantial shares who have at least some connection to Christianity. For example, 56% of Japanese American adults express some connection to Christianity, including 25% who say Christianity is their religion, 10% who follow some other religion but feel close to Christianity aside from religion and 22% who are religiously unaffiliated but feel close to Christianity.

For more on each Asian origin group, read the report’s Overview.

Importance of religion among Christians

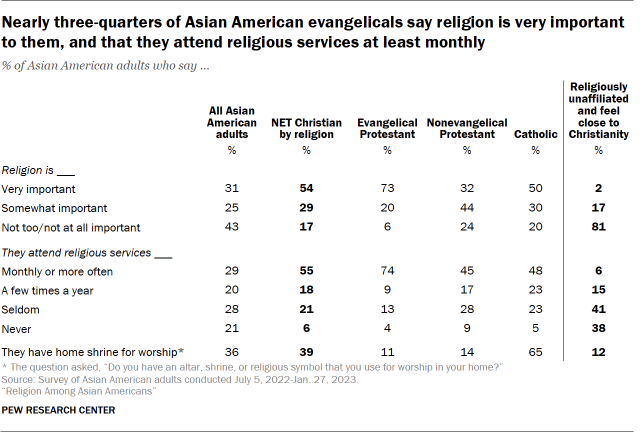
Asian Americans who say their religion is Christianity are more likely than Asian Americans overall to say that religion is very important in their lives (54% vs. 31%).

Much of the difference is due to the views of evangelical Protestants, who are more likely than other Asian American Christians to say religion is very important to them. About three-quarters of Asian American evangelicals (73%) say this, compared with half of Asian American Catholics and roughly one-third of Asian American Protestants who are not evangelicals (32%). Thus, nonevangelical Protestants are no more likely than the general Asian American population to say religion is very important in their lives.

Similar patterns are seen in attendance at religious services. Just over half of Asian American Christians say they go to church at least monthly (55%), which is significantly higher than the share of the overall Asian American population that reports going to religious services as often (29%). Evangelical Protestants are most likely to attend monthly or more (74%). Smaller shares of nonevangelical Protestants and Catholics say they attend this frequently (45% and 48%, respectively), though both report going to services more often than do Asian Americans overall.

A table showing that nearly three-quarters of Asian American evangelicals say religion is very important
to them, and that they attend religious services at least monthly.

About four-in-ten Asian American Christians (39%) say they have an altar, shrine or religious symbol that they use for worship in their home, which is on par with Asian Americans as a whole (36%). However, there are differences among Christian subgroups on this measure. Roughly two-thirds of Asian American Catholics (65%) say they have a home shrine for worship, compared with 11% of evangelical Protestants, 14% of nonevangelical Protestants and 12% of religiously unaffiliated Asian Americans who express a Christian affinity (i.e., who say they feel close to Christianity, though they do not call it their religion).

Social and demographic profile of Asian American Christians

Asian American Christians are more likely than the general Asian American population to say all or most of their friends have the same religion they do (38% vs. 30%). Evangelicals (45%) are among the most likely of all religious groups analyzed to say this.

Asian American Christians are slightly older than the Asian American population as a whole. Asian American evangelical Protestants have a median age of 51, among the highest of any Asian American religious group measured in the survey.

A table showing that more than half of Asian American evangelicals identify as or lean Republican.

While most Asian Americans identify with or lean toward the Democratic Party (62%), about half of Asian American Christians are Democrats or Democratic leaners (52%). Evangelical Protestants, in particular, stand out as the only Asian American religious group analyzed in which fewer than half (39%) identify with or lean toward the Democratic Party.

2. Buddhism among Asian Americans

About one-in-ten Asian American adults (11%) say their religion is Buddhism, a slight decline from 14% in 2012. A much larger share (21%) currently say that, aside from religion, they feel close to Buddhism for reasons such as ancestry or culture. In total, one-third of Asian Americans express at least some connection to Buddhism.8

A table showing that about 6 in 10 Vietnamese, Japanese Americans say
they are Buddhist or feel close to Buddhism.

Asian Americans of Southeast Asian origin are the most likely to actually identify as Buddhist. This includes 37% of Vietnamese Americans and 38% of Asian Americans who were born in or trace their ethnic origin to Southeast Asian countries other than Vietnam and the Philippines.

Among East Asian origin groups (Chinese, Japanese and Korean Americans), most respondents who have a connection to Buddhism do not identify as Buddhist but rather say they feel “close to” Buddhism aside from religion. The same is not true among Southeast Asians.

For example, while Vietnamese Americans and Japanese Americans are equally likely (62% each) to express some connection to Buddhism, only 19% of Japanese Americans identify as Buddhist. More Japanese Americans do not identify with any religion but say they feel close to Buddhism aside from religion (30%). Another 12% identify with a religion other than Buddhism but feel close to Buddhism aside from religion.

Importance of religion among Buddhists

A table showing that few Asian American Buddhists attend
religious services regularly, but most
worship at a home altar or shrine.

About one-third (31%) of Asian Americans who identify their religion as Buddhism say religion is very important in their lives, while another 40% say it is somewhat important.

Buddhists are less likely to say they attend religious services at least monthly than to say they use an altar, shrine or religious symbol for worship in their home (17% vs. 63%).

A table showing that among Asian American Buddhists who
say religion is very important,
32% attend services monthly or more.

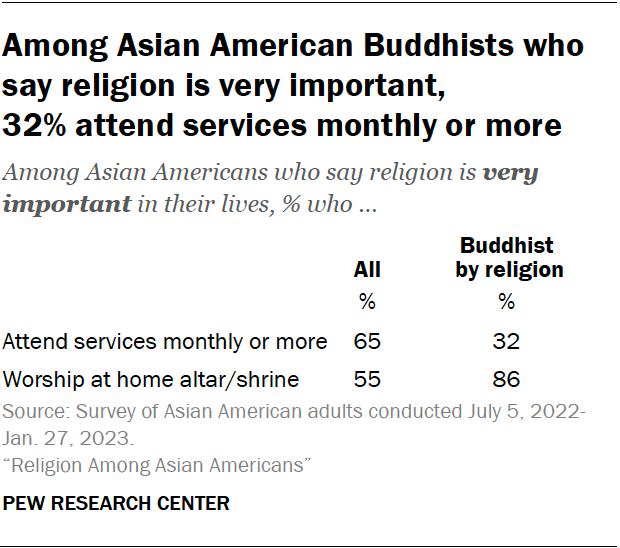
The gap between attendance at religious services and praying at a home altar is even larger among Buddhists who consider religion to have a very important place in their lives. About a third (32%) of this group report that they attend religious services at least monthly, while more than eight-in-ten say they use a shrine, altar or religious symbol for worship in their home (86%).

Yet, among all Asian Americans who say religion is very important in their lives, there is a much smaller gap between the shares who attend religious services at least monthly (65%) and those who use an altar, shrine or religious symbol for worship at home (55%). 

Social and demographic profile of Asian American Buddhists

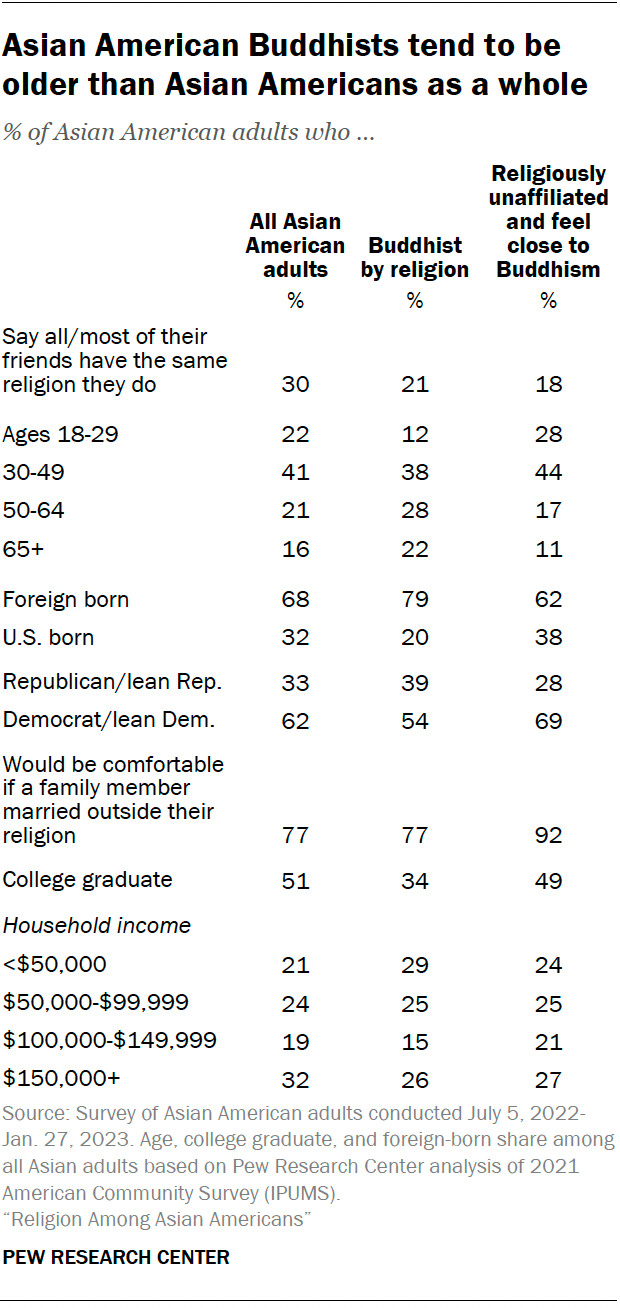
A table showing that Asian American Buddhists tend to be
older than Asian Americans as a whole.

Asian American Buddhists are less likely than Asian Americans overall to say that all or most of their friends share their religion (21% vs. 30%). They are also the oldest of the major religious groups, with half ages 50 or older.

One-fifth of Asian American Buddhists were born in the United States, slightly smaller than the share among the general Asian American population (20% vs. 32%).

3. Hinduism among Asian Americans

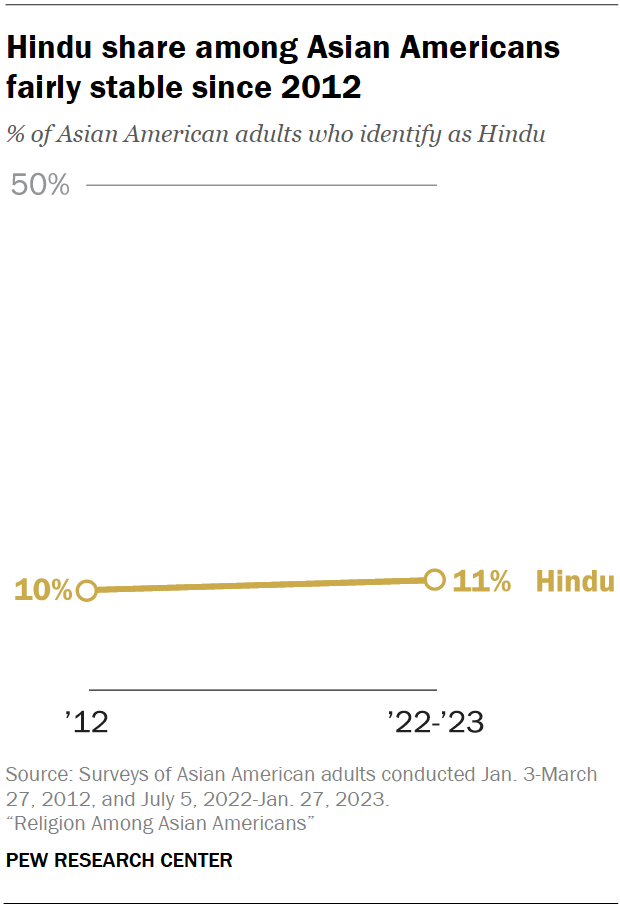
About one-in-ten Asian Americans now identify Hinduism as their religion (11%), essentially the same as in 2012 (10%). An additional 6% of all Asian Americans say they feel close to Hinduism aside from religion, for reasons such as ancestry or culture.9

A line chart showing that the Hindu share among Asian Americans has been fairly stable since 2012.

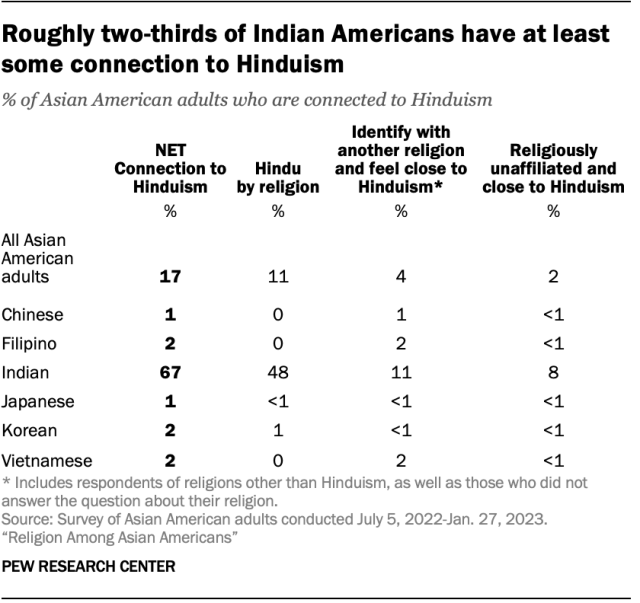
Among Asian American adults who identify as Indian, about half say their present religion is Hinduism (48%), roughly the same share as in 2012 (51%). In total, two-thirds of Indian Americans say either that they are Hindu or that they consider themselves close to Hinduism.

A table showing that roughly two-thirds of Indian Americans have at least some connection to Hinduism.

Importance of religion among Hindus

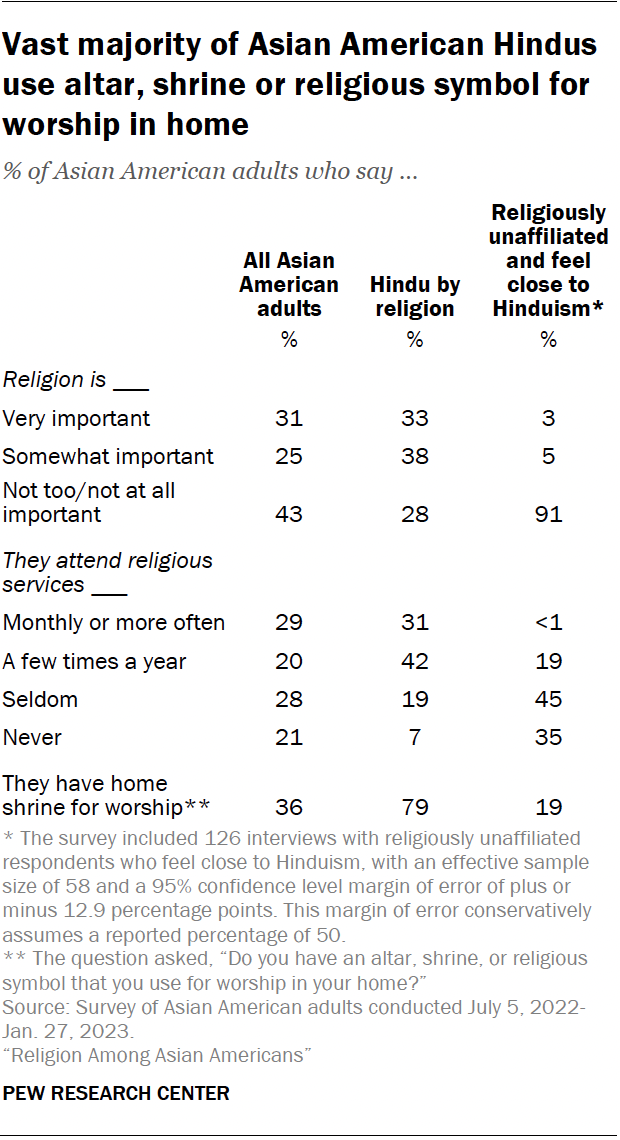
A table showing that vast majority of Asian American Hindus
use altar, shrine or religious symbol for
worship in home.

One-third of Asian American Hindus say religion is very important in their lives, while another 38% say it is somewhat important. And 31% say they attend religious services monthly or more often.

Of all the Asian American religious groups large enough to be analyzed in the survey, Hindus are by far the most likely to say they use an altar, shrine or religious symbol for worship in their home: 79% say they do this. That share increases to 89% among Hindus who say religion is very important in their lives.

Social and demographic profile of Asian American Hindus

A table showing that about 6 in 10 Asian American Hindus
have a postgraduate degree.

Four-in-ten Asian American Hindus say all or most of their friends have the same religion they do, which is significantly higher than the share of the overall Asian American population that reports such uniformity in their friendship circle (40% vs. 30%).

Demographically, Asian American Hindus stand out in a variety of other ways. About three-quarters (77%) are under age 50, making them one of the youngest Asian American religious groups, with a median age of 40.

Roughly nine-in-ten Asian American Hindu adults (92%) were born in a country other than the United States, the highest share of any Asian American religious group that was born abroad. At the same time, religiously unaffiliated Asian Americans who consider themselves close to Hinduism are more likely than those who religiously identify as Hindu to be U.S. born (35% vs. 8%).

In terms of socioeconomic status, Asian American Hindus also rank exceptionally high. About six-in-ten have a postgraduate degree (61%), compared with 22% of all Asian American adults. And 44% of Asian American Hindus have a family income of $150,000 or greater, compared with 32% of Asian Americans overall. On average, Hindu Americans have higher levels of education than any of the other Asian American religious groups large enough to be analyzed separately.

Politically, three-quarters of Asian American Hindus identify as Democrats or Democratic leaners, compared with 62% of Asian Americans overall.

4. Islam among Asian Americans

About 6% of Asian Americans now say their religion is Islam. An additional 3% say they feel close to Islam for reasons such as family background or culture, rather than religion.10

A line chart showing that 6% of Asian Americans are Muslim.
A table showing that 8% of Asian Americans are Muslim or feel connected
to Islam.

Some 13% of Indian Americans express a connection to Islam, including 8% who identify as Muslims, 3% who follow another religion but say they feel close to Islam, and 2% who don’t identify with any religion but express a feeling of closeness to Islam.

About a quarter of Asian Americans who trace their ethnic origin to South Asia have some connection to Islam (26%). And seven-in-ten Asian Americans who trace their ethnic origin to South Asian countries other than India have some connection to Islam, including 60% who say Islam is their religion. This is driven largely by Americans of Pakistani and Bangladeshi origin.

Only about 2% of Asian Americans who trace their ethnic origin to countries in Southeast Asia say they are Muslims or feel close to Islam, despite the inclusion of Muslim-majority Malaysia and Indonesia in this estimate.

Muslims make up only tiny shares of all Chinese, Filipino, Japanese, Korean and Vietnamese Americans.

Compared with other religious traditions, relatively few Asian Americans (3%) consider themselves close to Islam aside from religion. (The sample falling into this category is too small for further analysis; only respondents who identify as Muslim by religious identity can be analyzed in this survey.)

Importance of religion among Asian American Muslims

A table showing that 6 in 10 Asian American Muslims say
religion is very important in their lives.

Six-in-ten Asian American Muslims say religion is very important in their lives, which is among the highest levels seen within any religious group large enough to be analyzed in the survey. About half (54%) say they attend religious services at least monthly, which is significantly higher than the attendance rate reported by Asian American adults as a whole.

Asian American Muslims, like Asian American Christians, are much more likely than members of other faiths to say religion is very important to them and to report that they attend religious services at least monthly.

Social and demographic profile of Muslims

A table showing that 4 in 10 Asian American Muslims say
they would be comfortable if a family
member married a non-Muslim.

About three-in-ten Muslim American adults are under 30, compared with 22% of all Asian American adults.

Muslims are also less likely than other Asian Americans to identify with or lean toward the Republican Party. About a quarter of Asian American Muslims identify with or lean toward the GOP (23%), compared with a third of Asian Americans overall.

Muslims are also the least likely of all the large Asian American religious groups to say they would feel comfortable if a close family member married someone of a different religion. Just 40% of Muslims say this, compared with 77% of all Asian American adults.

5. Confucianism and Daoism among Asian Americans

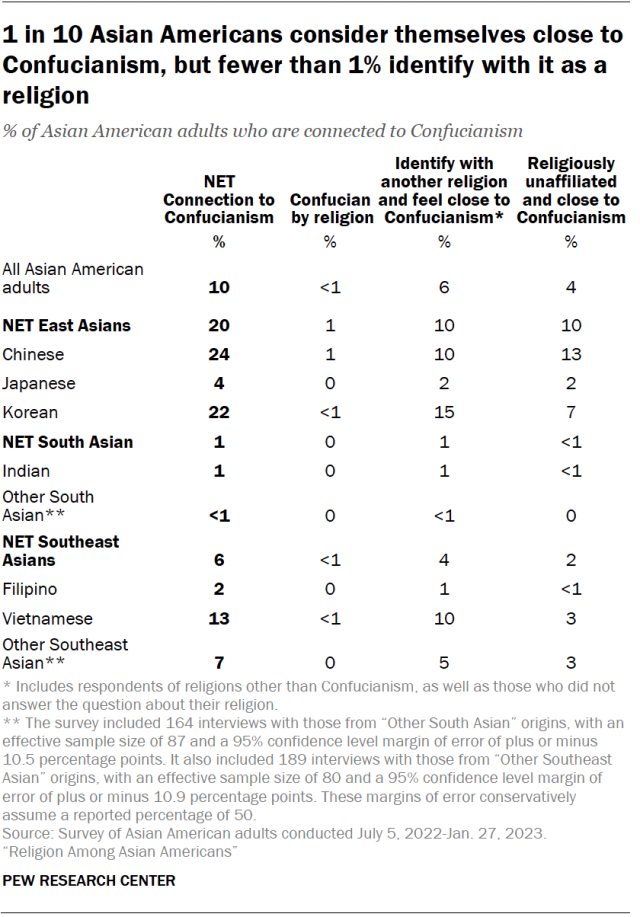
Christian, Buddhist, Hindu and Muslim are the only religious identities that are each claimed by at least 5% of Asian American adults. Fewer than 1% of Asian Americans say that their present religion is Daoism or Confucianism. However, 10% of all Asian Americans say they feel close to Confucianism for reasons of culture or ancestry, rather than religion, and 6% say the same about Daoism.

A table showing that 1 in 10 Asian Americans consider themselves close to
Confucianism, but fewer than 1% identify with it as a religion.

Connections to Confucianism

One-in-ten Asian Americans say they have some tie to Confucianism; this is almost always expressed as a connection aside from religion. In focus groups, several respondents said they considered Confucianism to be more a philosophy than a religion.

(Jump to the section on focus group conversation.)

Most Asian Americans who describe themselves as feeling close to Confucianism also identify with a different religion (generally either Christianity or Buddhism) rather than being religiously unaffiliated. 

Chinese Americans are significantly more likely than adults in any of the other large Asian origin groups to be religiously unaffiliated and, at the same time, to express a feeling of closeness to Confucianism. Some 13% of Chinese Americans say both of these things. In total, 24% of Chinese Americans express a connection to Confucianism, including 1% who identify Confucianism as their religion. Considerable shares of Korean (22%) and Vietnamese (13%) Americans also have a connection to Confucianism, though in nearly all cases as an affinity, not as their religion.

Connections to Daoism

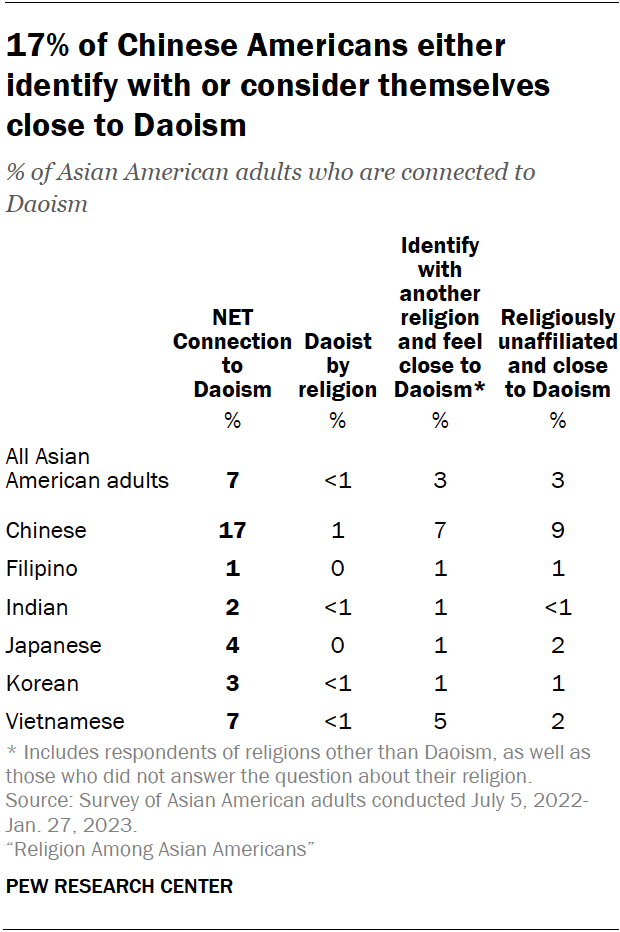
About 7% of Asian Americans express some connection to Daoism. As with Confucianism, this connection is almost always described as a matter of culture or family background, rather than of religion. Fewer than 1% of Asian American adults say Daoism is their present religion.

A table showing that 17% of Chinese Americans either
identify with or consider themselves close to Daoism.

Both Daoism and Confucianism originated in China, and they have overlapping histories and tenets, including an emphasis on filial piety, or respecting one’s elders and honoring one’s ancestors. But unlike Confucianism, Daoism has a pantheon of gods or deities along with dedicated clergy.

Roughly two-thirds (69%) of Asian Americans who say they consider themselves close to Daoism also express a similar affinity for Confucianism. About half also identify with a religion, mostly Christianity or Buddhism.

Roughly one-fifth (17%) of Chinese Americans say they have some connection with Daoism.

6. Religiously unaffiliated Asian Americans

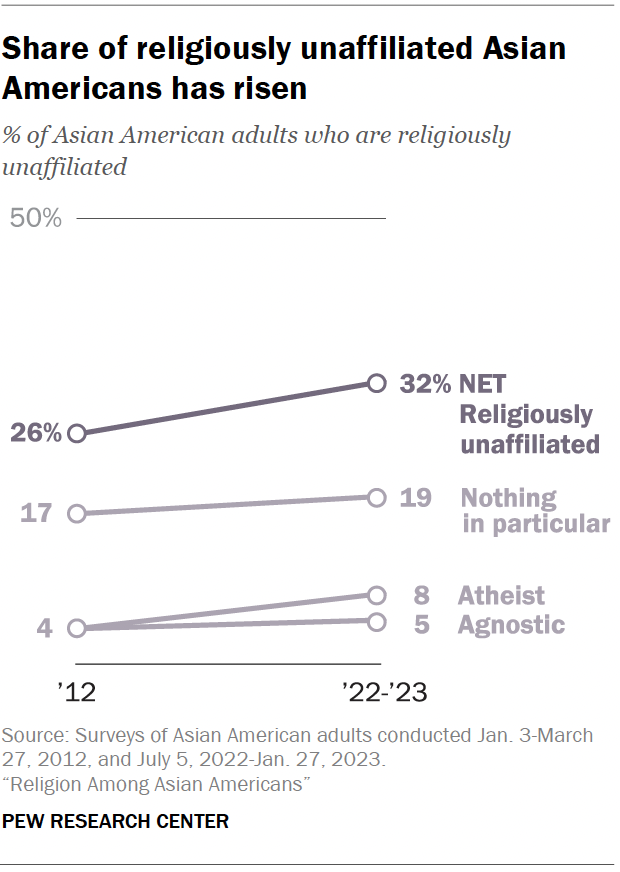
About one-third (32%) of Asian Americans have no religious affiliation, meaning that they answer a survey question about their present religion by saying they are atheist, agnostic or “nothing in particular.” As with Americans overall, this share has been growing; it was 26% in the Center’s last major survey of Asian Americans, in 2012.

A line chart showing that the share of religiously unaffiliated Asian
Americans has risen.

As in 2012, more religiously unaffiliated Asian Americans describe their religion as “nothing in particular” than identify as atheist or agnostic.

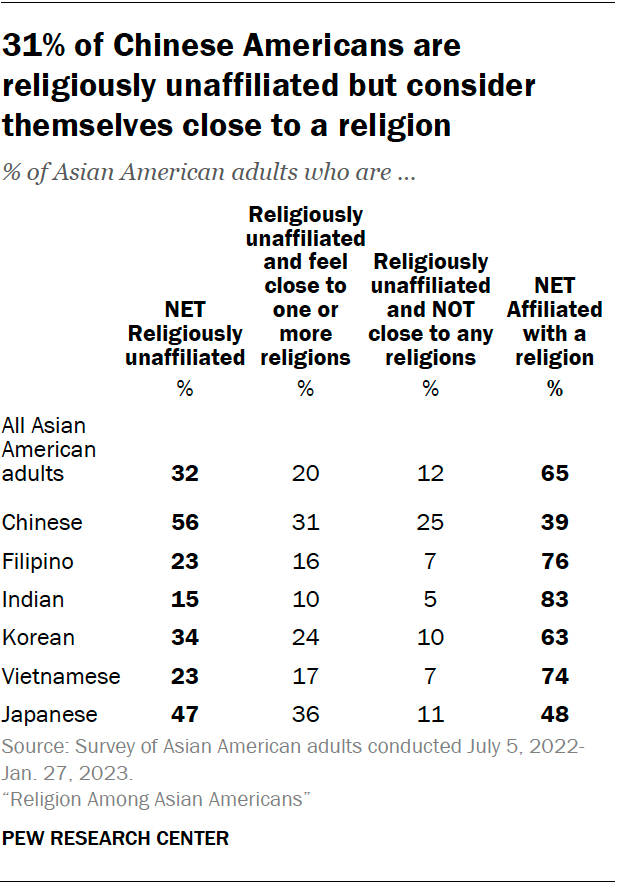
In addition, most religiously unaffiliated Asian Americans say they feel close to one or more traditions for reasons other than religion, such as ancestry or culture. Overall, just 12% of Asian Americans say they have no connection to any of the religions or philosophical traditions measured in the survey.

Chinese and Japanese Americans are more likely than other Asian Americans to be religiously unaffiliated. About half of all Japanese American adults (47%) describe themselves as atheist, agnostic, or having no particular religion, as do 56% of Chinese American adults.

Chinese (47%) and Japanese Americans (58%) are also more likely than other Asian Americans to feel close to a faith tradition for reasons aside from religion (regardless of whether they identify with a religion or are unaffiliated).

A table showing that 31% of Chinese Americans are
religiously unaffiliated but consider
themselves close to a religion.

A quarter of Chinese Americans say they have neither a religious affiliation nor feel close to any religious or philosophical tradition for other reasons, such as ancestry or culture. This is the highest share among the large Asian origin groups to reject any kind of connection to religion, and about twice the share of the overall Asian American population that does so (12%). 

A recent Pew Research Center report on religion in China showed that formal identification with religion is also low there: Chinese surveys indicate that only about one-in-ten Chinese adults say they have a religion, though much larger shares say they engage in spiritual practices such as lighting incense or making offerings to Buddha.

On the other hand, Indian (5%), Filipino (7%) and Vietnamese (7%) Americans are significantly less likely than the overall Asian American population to say both that they are religiously unaffiliated and that they have no feeling of closeness to any of the religious or philosophical traditions measured in the survey. Put another way, upward of 90% of adults in those three origin groups express some connection to a religious tradition.

Importance of religion among the unaffiliated

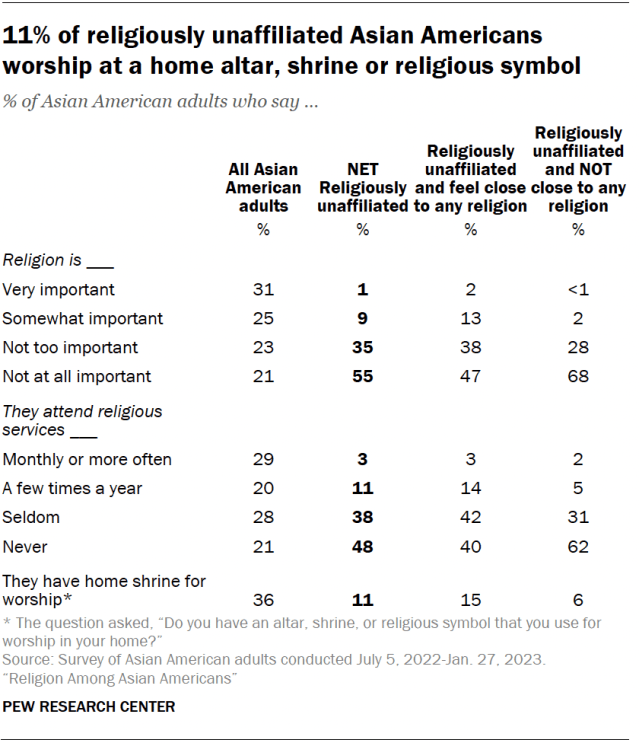
A table showing that 11% of religiously unaffiliated Asian Americans
worship at a home altar, shrine or religious symbol.

Perhaps not surprisingly, most religiously unaffiliated Asian Americans attribute little importance to religion in their lives. However, there are notable differences between those who express some closeness to a religious or philosophical tradition and those who do not. 

Religiously unaffiliated Asian Americans who are close to at least one religious tradition are more likely than those who are not to say that religion has at least some importance in their lives (15% vs. 3%).

Similarly, while religiously unaffiliated Asian Americans are less likely than Asian American adults as a whole to say they never attend religious services, there are differences between unaffiliated people who say they feel close to a religion or philosophical tradition and those who express no such closeness. About six-in-ten (62%) of those with no affiliation and no affinity to a religion say they never attend religious services, compared with four-in-ten of those who are religiously unaffiliated but say they are close to at least one tradition.
Religiously unaffiliated Asian Americans who feel close to at least one tradition (aside from religion) are also more likely than those who are not close to any religion to say they have an altar, shrine or religious symbol for worship in their home (15% vs. 6%).
Social and demographic profile of the unaffiliated

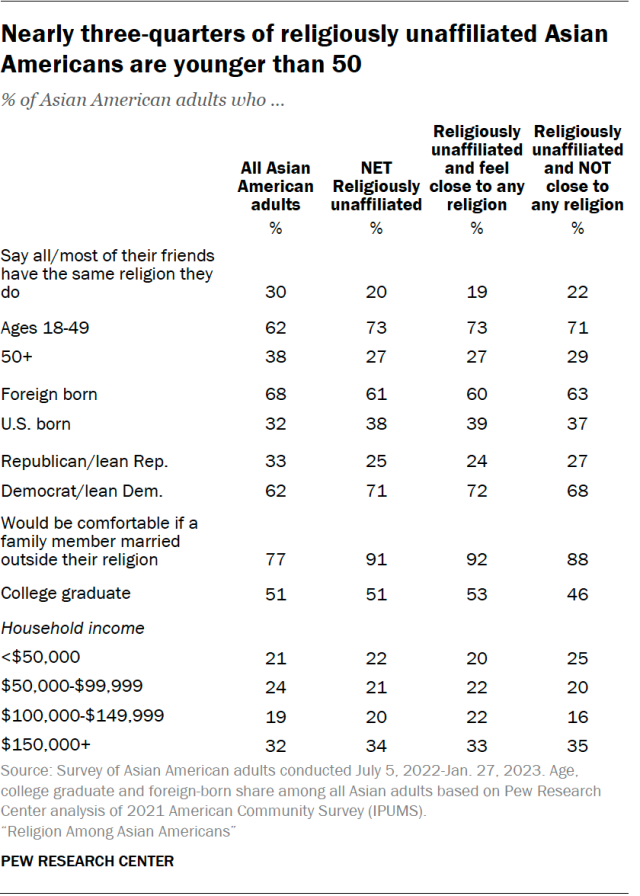
A table showing that nearly three-quarters of religiously unaffiliated Asian Americans are younger than 50.
Religiously unaffiliated Asian American adults are more likely than the overall Asian American population to be younger than age 50 (73% vs. 62%), born in the United States (38% vs. 32%), and Democrats or Democratic leaners (71% vs. 62%). There are no major differences in education or income levels between Asian Americans who are religiously unaffiliated and those who identify with a religion.
Methodology: Survey

The data in this Pew Research Center report is drawn from a national cross-sectional survey conducted by Westat. The sampling design of the survey was an address-based sampling (ABS) approach, supplemented by list samples, to reach a nationally representative group of respondents. The survey was fielded July 5, 2022, through Jan. 27, 2023.

A table showing the margins of sampling error for survey of Asian American adults.

Self-administered screening interviews were conducted with a total of 36,469 U.S. adults either online or by mail, resulting in 7,006 interviews with Asian American adults. These 7,006 Asian Americans are the focus of this report. After accounting for the complex sample design and loss of precision due to weighting, the margin of sampling error for these respondents is plus or minus 2.1 percentage points at the 95% level of confidence.

The survey was administered in two stages. In the first stage, a short screening survey was administered to a national sample of U.S. adults to collect basic demographics and determine a respondent’s eligibility for the extended survey of Asian Americans. Screener respondents were considered eligible for the extended survey if they self-identified as Asian (alone or in combination with any other race or ethnicity). Note that all individuals who self-identified as Asian were asked to complete the extended survey.

To maintain consistency with the U.S. Census Bureau’s definition of “Asian,” individuals responding as Asian but who self-identified with origins that did not meet the bureau’s official standards prior to the 2020 decennial census were considered ineligible and were not asked to complete the extended survey or were removed from the final sample. Those excluded were people solely of Southwest Asian descent (e.g., Lebanese or Saudi), those with Central Asian origins (e.g., Afghan or Uzbek) as well as various other non-Asian origins. The impact of excluding these groups is small, as together they represent about 1% to 2% of the national U.S. Asian population, according to a Pew Research Center analysis of the 2021 American Community Survey.

Eligible survey respondents were asked in the extended survey how they identified ethnically (e.g., Chinese, Filipino, Indian, Korean, Vietnamese or some other ethnicity with a write-in option). Note that survey respondents were asked about their ethnicity rather than nationality. For example, those classified as Chinese in the survey are those self-identifying as of Chinese ethnicity, rather than necessarily being a citizen or former citizen of the People’s Republic of China. Since this is an ethnicity, classification of survey respondents as Chinese also includes those who are Taiwanese.

The research plan for this project was submitted to Westat’s institutional review board (IRB), which is an independent committee of experts that specializes in helping to protect the rights of research participants. Due to the minimal risks associated with this questionnaire content and the population of interest, this research underwent an expedited review and received approval (approval # FWA 00005551).

Throughout this methodology statement, the terms “extended survey” and “extended questionnaire” refer to the extended survey of Asian Americans that is the focus of this report, and “eligible adults” and “eligible respondents” refer to those individuals who met its eligibility criteria, unless otherwise noted.

Sample design

The survey had a complex sample design constructed to maximize efficiency in reaching Asian American adults while also supporting reliable, national estimates for the population as a whole and for the five largest ethnic groups (Chinese, Filipino, Indian, Korean and Vietnamese). Asian American adults include those who self-identify as Asian, either alone or in combination with other races or Hispanic identity.

The main sample frame of the 2022-2023 Asian American Survey is an address-based sample (ABS). The ABS frame of addresses was derived from the USPS Computerized Delivery Sequence file. It is maintained by Marketing Systems Group (MSG) and is updated monthly. MSG geocodes their entire ABS frame, so block, block group, and census tract characteristics from the decennial census and the American Community Survey (ACS) could be appended to addresses and used for sampling and data collection.

All addresses on the ABS frame were geocoded to a census tract. Census tracts were then grouped into three strata based on the density of Asian American adults, defined as the proportion of Asian American adults among all adults in the tract. The three strata were defined as:

  • High density: Tracts with an Asian American adult density of 10% or higher
  • Medium density: Tracts with a density of 3% to less than 10%
  • Low density: Tracts with a density less than 3%

Mailing addresses in census tracts from the lowest density stratum, stratum 3, were excluded from the sampling frame. As a result, the frame excluded 54.1% of the 2020 census tracts, or 49.1% of the U.S. adult population, including 9.1% of adults who self-identified as Asian alone or in combination with other races or Hispanic ethnicity. For the largest five Asian ethnic subgroups, Filipinos had the largest percentage of excluded adults with 6.8%, while Indians had the lowest with 4.2% of the adults. Addresses were then sampled from the two remaining strata. This stratification and the assignment of differential sampling rates to the strata were critical design components because of the rareness of the Asian American adult population.

Despite oversampling of the high- and medium-density Asian American strata in the ABS sample, the ABS sample was not expected to efficiently yield the required number of completed interviews for some ethnic subgroups. Therefore, the ABS sample was supplemented with samples from the specialized surnames list frames maintained by the MSG. These list frames identify households using commercial databases linked to addresses and telephone numbers. The individuals’ surnames in these lists could be classified by likely ethnic origin. Westat requested MSG to produce five list frames: Chinese, Filipino, Indian, Korean and Vietnamese. The lists were subset to include only cases with a mailing address. Addresses sampled from the lists, unlike those sampled from the ABS frame, were not limited to high- and medium-density census tracts.

Once an address was sampled from either the ABS frame or the surname lists, an invitation was mailed to the address. The invitation requested that the adult in the household with the next birthday complete the survey.

Data collection

To maximize response, the survey used a sequential mixed-mode protocol in which sampled households were first directed to respond online and later mailed a paper version of the questionnaire if they did not respond online.

A table showing that sample allocation and Asian American incidence by sampling frame.

The first mailing was a letter introducing the survey and providing the information necessary (URL and unique PIN) for online response. A pre-incentive of $2 was included in the mailing. This and remaining screener recruitment letters focused on the screener survey, without mentioning the possibility of eligibility for a longer survey and associated promised incentive, since most people would only be asked to complete the short screening survey. It was important for all households to complete the screening survey, not just those who identify as Asian American. As such, the invitation did not mention that the extended survey would focus on topics surrounding the Asian American experience. The invitation was generic to minimize the risk of nonresponse bias due to topic salience bias.

After one week, Westat sent a postcard reminder to all sampled individuals, followed three weeks later by a reminder letter to nonrespondents. Approximately 8.5 weeks after the initial mailing, Westat sent nonrespondents a paper version screening survey, which was a four-page booklet (one folded 11×17 paper) and a postage-paid return envelope in addition to the cover letter. If no response was obtained from those four mailings, no further contact was made.

Eligible adults who completed the screening interview on the web were immediately asked to continue with the extended questionnaire. If an eligible adult completed the screener online but did not complete the extended interview, Westat sent them a reminder letter. This was performed on a rolling basis when it had been at least one week since the web break off. Names were not collected until the end of the web survey, so these letters were addressed to “Recent Participant.”

If an eligible respondent completed a paper screener, Westat mailed them the extended survey and a postage-paid return envelope. This was sent weekly as completed paper screeners arrived. Westat followed these paper mailings with a reminder postcard. Later, Westat sent a final paper version via FedEx to eligible adults who had not completed the extended interview online or by paper.

Incentives

A pre-incentive of $2 (in the form of two $1 bills) was sent to all sampled addresses with the first letter, which provided information about how to complete the survey online. This and subsequent screener invitations only referred to the pre-incentive without reference to the possibility of later promised incentives.

Respondents who completed the screening survey and were found eligible were offered a promised incentive of $10 to go on and complete the extended survey. All participants who completed the extended web survey were offered their choice of a $10 Amazon.com gift code instantly or $10 cash mailed. All participants who completed the survey via paper were mailed a $10 cash incentive.

In December 2022 a mailing was added for eligible respondents who had completed a screener questionnaire, either by web or paper but who had not yet completed the extended survey. It was sent to those who had received their last mailing in the standard sequence at least four weeks earlier. It included a cover letter, a paper copy of the extended survey and a business reply envelope, and was assembled in a 9×12 envelope with a $1 bill made visible through the envelope window.

In the last month of data collection, an additional mailing was added to boost the number of Vietnamese respondents. A random sample of 4,000 addresses from the Vietnamese surname list and 2,000 addresses from the ABS frame who were flagged as likely Vietnamese were sent another copy of the first invitation letter, which contained web login credentials but no paper copy of the screener. This was sent in a No. 10 envelope with a wide window and was assembled with a $1 bill visible through the envelope window.

Languages

The mail and web screening and extended surveys were developed in English and translated into Chinese (Simplified and Traditional), Hindi, Korean, Tagalog and Vietnamese. For web, the landing page was displayed in English initially but included banners at the top and bottom of the page that allowed respondents to change the displayed language. Once in the survey, a dropdown button at the top of each page was available to respondents to toggle between languages.

The paper surveys were also formatted into all six languages. Recipients thought to be more likely to use a specific language option, based on supplemental information in the sampling frame or their address location, were sent a paper screener in that language in addition to an English screener questionnaire. Those receiving a paper extended instrument were sent the extended survey in the language in which the screener was completed. For web, respondents continued in their selected language from the screener.

Weighting and variance estimation

Household-level weighting

The first step in weighting was creating a base weight for each sampled mailing address to account for its probability of selection into the sample. The base weight for mailing address k is called BWk and is defined as the inverse of its probability of selection. The ABS sample addresses had a probability of selection based on the stratum from which they were sampled. The supplemental samples (i.e., Chinese, Filipino, Indian, Korean and Vietnamese surname lists) also had a probability of selection from the list frames. Because all of the addresses in the list frames are also included in the ABS frame, these addresses had multiple opportunities for these addresses to be selected, and the base weights include an adjustment to account for their higher probability of selection.

Each sampled mailing address was assigned to one of four categories according to its final screener disposition. The categories were 1) household with a completed screener interview, 2) household with an incomplete screener interview, 3) ineligible (i.e., not a household, which were primarily postmaster returns), and 4) addresses for which status was unknown (i.e., addresses that were not identified as undeliverable by the USPS but from which no survey response was received).

The second step in the weighting process was adjusting the base weight to account for occupied households among those with unknown eligibility (category 4). Previous ABS studies have found that about 13% of all addresses in the ABS frame were either vacant or not home to anyone in the civilian, noninstitutionalized adult population. For this survey, it was assumed that 87% of all sampled addresses from the ABS frame were eligible households. However, this value was not appropriate for the addresses sampled from the list frames, which were expected to have a higher proportion of households as these were maintained lists. For the list samples, the occupied household rate was computed as the proportion of list cases in category 3 compared to all resolved list cases (i.e., the sum of categories 1 through 3). The base weights for the share of category 4 addresses (unknown eligibility) assumed to be eligible were then allocated to cases in categories 1 and 2 (known households) so that the sum of the combined category 1 and 2 base weights equaled the number of addresses assumed to be eligible in each frame. The category 3 ineligible addresses were given a weight of zero.

The next step was adjusting for nonresponse for households without a completed screener interview to create a final household weight. This adjustment allocated the weights of nonrespondents (category 2) to those of respondents (category 1) within classes defined by the cross-classification of sampling strata, census region and sample type (e.g., ABS and list supplemental samples). Those classes with fewer than 50 sampled addresses or large adjustment factors were collapsed with nearby cells within the sample type. Given the large variance in the household weights among the medium density ABS stratum, final household weights for addresses within this stratum were capped at 300.

Weighting of extended survey respondents

The extended interview nonresponse adjustment began by assigning each case that completed the screener interview to one of three dispositions: 1) eligible adult completed the extended interview; 2) eligible adult did not complete the extended interview; and 3) not eligible for the extended interview.

An initial adult base weight was calculated for the cases with a completed extended interview as the product of the truncated number of adults in the household (max value of 3) and the household weight. This adjustment accounted for selecting one adult in each household.

The final step in the adult weighting was calibrating the adult weights for those who completed the extended interview so that the calibrated weights (i.e., the estimated number of adults) aligned with benchmarks for noninstitutionalized Asian adults from the 2016-2020 American Community Surveys Public Use Microdata Sample (PUMS). Specifically, raking was used to calibrate the weights on the following dimensions:

  1. Ethnic group (Chinese, Filipino, Indian, Japanese, Korean, Vietnamese, other single Asian ethnicities, and multiple Asian ethnicities)
  2. Collapsed ethnic group (Chinese, Filipino, Indian, Korean, Vietnamese, all other single and multiple Asian ethnicities) by age group
  3. Collapsed ethnic group by sex
  4. Collapsed ethnic group by census region
  5. Collapsed ethnic group by education
  6. Collapsed ethnic group by housing tenure
  7. Collapsed ethnic group by nativity
  8. Income group by number of persons in the household

The control totals used in raking were based on the entire population of Asian American adults (including those who live in the excluded stratum) to correct for both extended interview nonresponse and undercoverage from excluding the low-density stratum in the ABS frame.

Variance estimation

Because the modeled estimates used in the weighting are themselves subject to sampling error, variance estimation and tests of statistical significance were performed using the grouped jackknife estimator (JK2). One hundred sets of replicates were created by deleting a group of cases within each stratum from each replicate and doubling the weights for a corresponding set of cases in the same stratum. The entire weighting and modeling process was performed on the full sample and then separately repeated for each replicate. The result is a total of 101 separate weights for each respondent that have incorporated the variability from the complex sample design.11

Response rates

Westat assigned all sampled cases a result code for their participation in the screener, and then they assigned a result for the extended questionnaire for those who were eligible for the survey of Asian Americans. Two of the dispositions warrant some discussion. One is the category “4.313 No such address.” This category is for addresses that were returned by the U.S. Postal Service as not being deliverable. This status indicates the address, which was on the USPS Delivery Sequence File at the time of sampling, currently is not occupied or no longer exists.

The second category is “4.90 Other.” This category contains 588 addresses that were never mailed because they had a drop count of greater than four. Drop points are addresses with multiple households that share the same address. The information available in the ABS frame on drop points is limited to the number of drop points at the address, without information on the type of households at the drop point, or how they should be labeled for mailing purposes. In this survey, all drop points were eligible for sampling, but only those with drop point counts of four or fewer were mailed. Westat treated drop point counts of five or more as out of scope, and no mailing was done for those addresses.

Westat used the disposition results to compute response rates consistent with AAPOR definitions. The response rates are weighted by the base weight to account for the differential sampling in this survey. The AAPOR RR3 response rate to the screening interview was 17.0%. 12 The RR1 response rate to the extended Asian American interview (77.9%) is the number of eligible adults completing the questionnaire over the total sampled for that extended questionnaire. The overall response rate is the product of the screener response rate and the conditional response rate for the extended questionnaire. The overall response rate for the Asian American sample in the Pew Research Center survey was 13.3% (17.0% x 77.9%).

A table showing AAPOR disposition codes.

Identifying ‘distinctive’ language in open-ended responses to hiding heritage from others

As part of the survey, respondents were asked if they have ever hidden a part of their heritage from people who are not Asian. Those who answered yes were asked in a follow-up open-ended question why they do so. Pointwise mutual information was used to identify the 100 most distinctive terms that distinguish responses from U.S.-born and foreign-born respondents. The terms identified through this method represent the language that characterizes how respondents from either group answered the open-ended question.

Methodology: Focus groups

Pew Research Center designed this focus group and interview-based study to better understand Asian Americans’ diverse perspectives on the intersection of religious identity and ethnic culture. The analysis presented in this data essay is intended to provide insight into Asian Americans’ cultural connections to religion and is not meant to be an exhaustive representation of experiences on these topics or of specific demographic groups.

About the groups

We conducted 20 focus groups and five one-on-one interviews with more than 100 Asian American adult participants from April 15 to July 19, 2023. Eight in-person focus groups were conducted in Chicago, Illinois. The remaining 12 focus groups and five interviews were conducted remotely. Each person was offered an incentive of $100 to participate. In-person focus groups were approximately two hours long, virtual focus groups were about 90 minutes, and one-on-one interviews were approximately one hour in length. All focus groups were conducted in English.

Focus groups were organized according to participants’ religious identity, level of religious commitment, ethnic origin group and immigration status. There were five Muslim groups, three Buddhist groups, three Hindu groups, two Protestant groups, two Catholic groups and five religiously unaffiliated groups. Four of the one-on-one interviews were with Asian American Muslims, and one was with an Asian American who is religiously unaffiliated. Participants represented nine different Asian origin countries and were selected to maximize gender and age diversity.
Focus groups had an average of six participants, with a minimum requirement of three participants and a maximum of nine.

The focus groups were conducted by Research Support Services Inc. (RSS) for Pew Research Center and were reviewed by Sterling IRB (internal review board) for human subject research. The interviews were conducted by Dr. Eman Abdelhadi, assistant professor in the Department of Comparative Human Development at the University of Chicago.

Topics covered

The questions asked during the focus groups and interviews were designed to explore participants’ perspectives on religion, as well as their relationships with religion, in various ways. Conversations generally included:

  • Discussion of hypothetical scenarios involving the religious lives of individuals (participants were shown photographs of individuals and were asked to rate, on a scale of one to five, how sure they are that each person is affiliated with a certain religion);
  • Discussion and debate about what is considered “essential” to various religions;
  • The participants’ responses to related questions, such as “Do you consider yourself close to any of the following traditions?” and “Do you identify with any of the following traditions?” as well as discussion about the differences between these questions;
  • Discussion of the role of religion in participants’ Asian origin countries, families and communities; and
  • Discussion about whether the participant believes it is important for future generations to have ties to their religion.

Data analysis

Focus group conversations were video recorded, and one-on-one interviews were audio recorded. All conversations were transcribed and checked for transcription errors. To analyze the focus group and interview transcripts, Center researchers utilized ATLAS.ti, a qualitative data analysis and research software.

Researchers analyzed the transcripts through multiple rounds of coding. Initially, separate codes were applied to different sections that covered participants’ discussion of religious beliefs, practices, knowledge, identification and other experiences, respectively. Researchers then worked together to identify other themes for later rounds of coding such as: participants’ reasons for being religious; details of what they said makes someone religious or not religious; and instances in which they said there were unclear boundaries between religion and the culture of their country of origin. The overlap between religion and culture was a prevailing theme of the conversations and the corresponding codes.

Quotations in the data essay have been lightly edited for grammar, spelling and clarity.

Acknowledgments

Pew Research Center is a subsidiary of The Pew Charitable Trusts, its primary funder. The Center’s Asian American portfolio was funded by The Pew Charitable Trusts, with generous support from The Asian American Foundation; Chan Zuckerberg Initiative DAF, an advised fund of the Silicon Valley Community Foundation; the Robert Wood Johnson Foundation; the Henry Luce Foundation; the Doris Duke Foundation; The Wallace H. Coulter Foundation; The Dirk and Charlene Kabcenell Foundation; The Long Family Foundation; Lu-Hebert Fund; Gee Family Foundation; Joseph Cotchett; the Julian Abdey and Sabrina Moyle Charitable Fund; and Nanci Nishimura. 

We would also like to thank the Leaders Forum for its thought leadership and valuable assistance in helping make this survey possible.

The qualitative research on Asian American Muslims, and the strategic communications campaign to promote the research portfolio, were made possible with generous support from the Doris Duke Foundation.

This report is a collaborative effort based on the input and analysis of the following individuals. Find related reports online at www.pewresearch.org/AsianAmericans and www.pewresearch.org/pewresearch-org/religion.

Primary Researchers

Besheer Mohamed, Senior Researcher
Michael Rotolo, Research Associate     

Research Team

Alan Cooperman, Director, Religion Research             
Gregory A. Smith, Associate Director, Religion Research
Becka A. Alper, Senior Researcher               
Patricia Tevington, Research Associate
Justin Nortey, Research Analyst      
Asta Kallo, Research Assistant

Coders

Jonah Causin, Daniel Jacobi and Sophie Yap

Methods Team

Courtney Kennedy, Vice President, Methods and Innovation
Ashley Amaya, Associate Director, Survey Methodology    
Andrew Mercer, Senior Research Methodologist
Scott Keeter, Senior Survey Advisor
Dorene Asare-Marfo, Panel Manager          
Dana Mildred Popky, Associate Panel Manager
Arnold Lau, Research Methodologist

Editorial and Graphic Design

Jeff Diamant, Senior Writer/Editor
Rebecca Leppert, Copy Editor
Dalia Fahmy, Senior Writer/Editor
Bill Webster, Senior Information Graphics Designer

Communications and Web Publishing

Achsah Callahan, Communications Manager
Hannah Klein, Senior Communications Manager
Beshay Sakla, Associate Digital Producer
Reem Nadeem, Digital Producer
Anna Schiller, Associate Director, Communications       
Stacy Rosenberg, Director, Digital Strategy      

Others at the Center who contributed to this report include Mark Hugo Lopez, director of race and ethnicity research; Neil G. Ruiz, associate director of race and ethnicity research; Conrad Hackett, associate director of research/senior demographer; Caileigh Stirling, research assistant; Yunping Tong, research associate; Luis Noe-Bustamante, research associate; Abby Budiman, former research associate; Carolyne Im, research assistant; and Lauren Mora, former research assistant.

In addition, Pew Research Center is grateful to a panel of expert advisers who provided advice throughout this report’s development: Eman Abdelhadi, assistant professor of comparative human development at the University of Chicago; Jerry Park, associate professor of sociology at Baylor University; Anna Sun, associate professor of religious studies and sociology at Duke University; Ajay Verghese, associate professor of political science at Middlebury College; and Duncan Ryuken Williams, professor of religion and East Asian languages and cultures at University of Southern California.