Pew Research Center

FOR RELEASE JUNE 2, 2023

Online Religious Services Appeal to Many Americans, but Going in Person Remains More Popular

About a quarter of U.S. adults regularly watch religious services online; 21% use apps or websites to help with reading scripture

FOR MEDIA OR OTHER INQUIRIES:

Communications Department
202.419.4372
www.pewresearch.org

RECOMMENDED CITATION

Pew Research Center, June 2023, "Online Religious Services Appeal to Many Americans, but Going in Person Remains More Popular"

About Pew Research Center

Pew Research Center is a nonpartisan, nonadvocacy fact tank that informs the public about the issues, attitudes and trends shaping the world. It does not take policy positions. The Center conducts public opinion polling, demographic research, computational social science research and other data-driven research. It studies politics and policy; news habits and media; the internet and technology; religion; race and ethnicity; international affairs; social, demographic and economic trends; science; research methodology and data science; and immigration and migration. Pew Research Center is a subsidiary of The Pew Charitable Trusts, its primary funder.

© Pew Research Center 2026

Table of contents

  • About Pew Research Center
  • Online Religious Services Appeal to Many Americans, but Going in Person Remains More Popular
  • 1. Americans’ experiences with virtual religious services
  • 2. Use of apps and websites in religious life
  • Acknowledgments
  • Methodology

Online Religious Services Appeal to Many Americans, but Going in Person Remains More Popular

About a quarter of U.S. adults regularly watch religious services online; 21% use apps or websites to help with reading scripture

How we did this

Pew Research Center conducted this survey to explore how Americans use technology in their religious lives. For this report, we surveyed 11,377 U.S. adults from Nov. 16-27, 2022. All respondents to the survey are part of Pew Research Center’s American Trends Panel (ATP), an online survey panel that is recruited through national random sampling of residential addresses. This way nearly all U.S. adults have a chance of selection. The survey is weighted to be representative of the U.S. adult population by gender, race, ethnicity, partisan affiliation, education, religious affiliation and other categories. For more, see the ATP’s methodology and the methodology for this report.

Read the questions used in this report.

About a quarter of U.S. adults regularly watch religious services online or on TV, and most of them are highly satisfied with the experience, according to a new Pew Research Center survey.
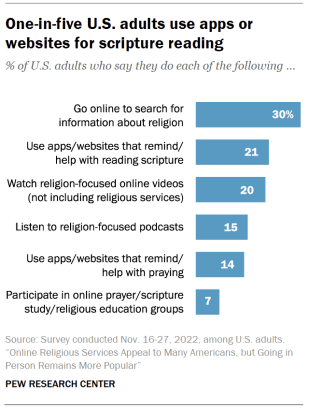
Chart shows one-in-five U.S. adults use apps or websites for scripture reading

The survey also asked about other uses of online technology, like apps and websites, for religious purposes. Key findings include:

  • 30% of U.S. adults say they go online to search for information about religion.
  • 21% use apps or websites to help them read the Bible or other religious scriptures.
  • 15% listen to religion-focused podcasts.
  • 14% use apps or websites to help or remind them to pray.

The survey of more than 11,000 U.S. adults was conducted in November 2022, well after the height of the coronavirus pandemic but before the Centers for Disease Control and Prevention declared an end to the COVID-19 public health emergency.

It’s been clear for more than two years that the video technology that helped Americans stay in touch with relatives, friends and colleagues during COVID-19 lockdowns was also helping many to connect with houses of worship. From kitchens or living rooms, in their Sunday best, pajamas or something in between, those with an internet connection and a screen could pray along with other virtual attendees, listen to sermons, and sing along with choirs, all in real time.

What wasn’t clear, though, was how people felt about these virtual experiences. Would they keep watching services on screens, even after they thought it was safe to attend in person? What did they like about joining services remotely? What didn’t they like? The survey was designed to explore these kinds of questions. 

Broadly speaking, the survey finds that most Americans who watch religious services on screens are happy with them. Two-thirds of U.S. adults who regularly stream religious services online or watch them on TV say they are either “extremely satisfied” or “very satisfied” with the services they see.
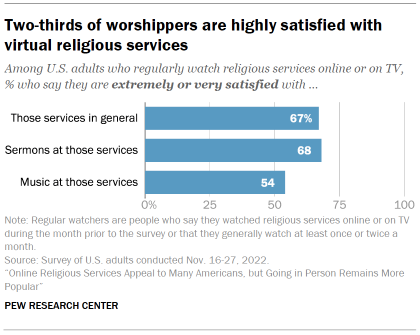
Chart shows Two-thirds of worshippers are highly satisfied with virtual religious services

Similar shares express satisfaction with the sermons they hear during virtual services. In addition, a little more than half say they are highly satisfied with the music at worship services they join online or watch on TV.

At the same time, Americans tend to give higher marks to worshipping together in person. While majorities express satisfaction with virtual services, even bigger shares of physical attenders say they feel extremely or very satisfied with the sermons (74%) and music (69%) at the services they attend in person.
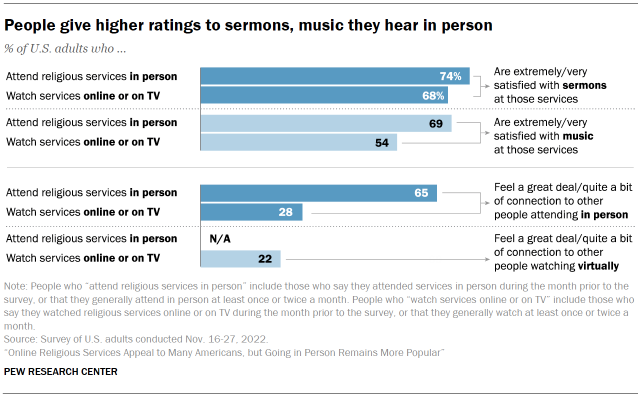
Chart shows people give higher ratings to sermons, music they hear in person

In addition, virtual viewers are much less likely to report feeling connected to other worshippers. Roughly two-thirds (65%) of regular in-person attenders say they feel “a great deal” or “quite a bit” of connection with their fellow attenders, the two highest options on a five-point scale.

By comparison, far fewer regular viewers – 28% – say they feel a strong connection with people who are attending a service in person while they, themselves, are watching on a screen. And 22% of virtual viewers say they feel strongly connected to the other people watching online or on TV.

Not everyone who watches services remotely feels fully engaged. A quarter of regular viewers say they usually feel they are an “active participant” in the service. But 32% say they feel they are watching “without truly being an active participant.” And 42% say they feel a little of both.

Pew Research Center surveys have shown that since early 2020, when the COVID-19 pandemic first struck the United States, the percentage of U.S. adults taking part in religious services in a given month – either in person, online/on TV, or both – has held remarkably steady, at about four-in-ten.

But as vaccines became widespread and the pandemic waned, the numbers attending in person rebounded and then plateaued, while the numbers watching on screens have declined.

Defining ‘regular’ watchers and ‘regular’ attenders

In this report, “regular watchers” of religious services include everyone who says they watched services online or on TV in the month prior to the survey or that they generally watch at least once or twice a month. “Regular attenders” include everyone who says they attended services in person in the month prior to the survey or that they generally attend at least once or twice a month.

Here are the attendance numbers from the latest survey, as of November 2022:

  • 16% of U.S. adults said they were regularly attending religious services only in person (and not online).
  • 10% were regularly watching services only on screens (but not regularly going in person).
  • 17% were regularly doing both.

In total, 43% reported that they generally attend and/or watch religious services at least once a month, or that they attended/watched services in the month prior to the survey.

A majority of U.S. adults (57%) said they do not generally attend religious services and did not do so in the past month, either in person or virtually.1
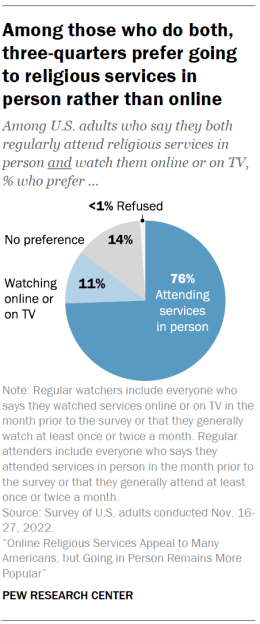
Chart shows Among those who do both, three-quarters prefer going to religious services in person rather than online

Looking at the numbers another way, the survey indicates that as the coronavirus pandemic winds down, about a quarter of Americans (27%) are still watching religious services on screens. This includes 10% who take part virtually but do not regularly attend in person, plus 17% who watch online or on TV and attend in person on a regular basis.

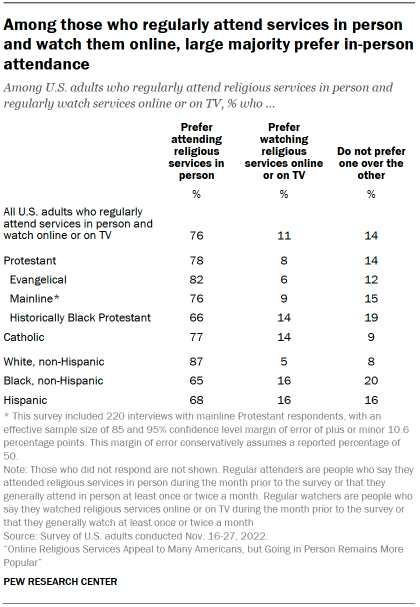
Those who do both – who watch services on screens and attend in person – overwhelmingly say they prefer going in person, by a margin of 76% to 11%. An additional 14% say they have no preference.

When asked why they watch religious services online or on TV, many regular viewers cite multiple reasons. But as the COVID-19 pandemic recedes, convenience is the most-commonly selected option – not fear of catching or spreading any illness.

Members of historically Black Protestant denominations are especially likely to be in the virtual audience for church services. While 13% of Protestants who belong to historically Black churches say they attend church in person and don’t regularly watch services virtually, most say they join services both in person and virtually (37%) or only watch remotely on screens (20%).

Part of the reason is continuing concern about COVID-19, which struck Black communities with particular force. The survey also shows that viewers who are members of historically Black Protestant churches are more likely to say they feel like active participants in these virtual services than are viewers who belong to some other faiths.

Survey respondents who said they watch religious services online or on TV were asked a follow-up question: Do they watch virtual services at the same congregation they typically attend in person, or do they sometimes go online/on TV to see services at other congregations, or both?

Among the 17% of U.S. adults who regularly do both things – attend worship services in person and watch them virtually – most say they watch services offered by a congregation other than, or in addition to, the one they typically attend in person. This represents 10% of all U.S. adults.

An additional 7% of U.S. adults say they sometimes attend in person and sometimes watch online/on TV, but they only watch services offered by the congregation they attend in person.
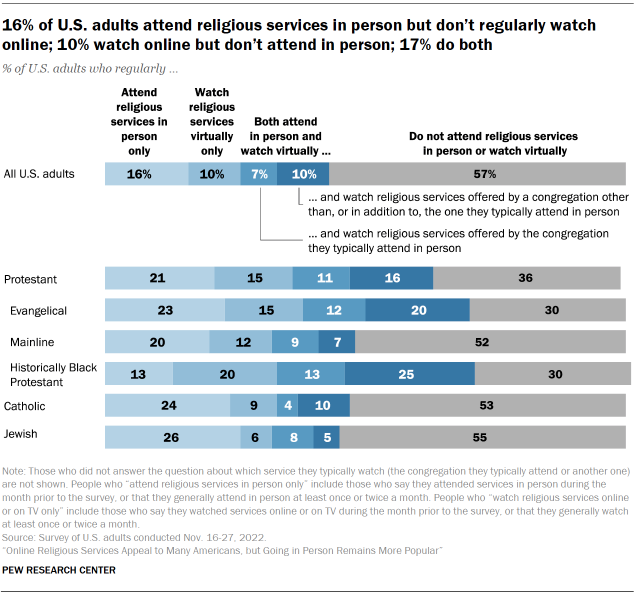
Chart shows 16% of U.S. adults attend religious services in person but don’t regularly watch online; 10% watch online but don’t attend in person; 17% do both

These are among the key findings of a new analysis of how Americans use technology in their religious lives, based on a Pew Research Center survey of 11,377 respondents conducted Nov. 16-27, 2022, on the Center’s nationally representative American Trends Panel. The Center previously published some findings from this survey.

A portrait of virtual worship

Chart shows About half of those who watch religious services online or on TV generally do so by themselves

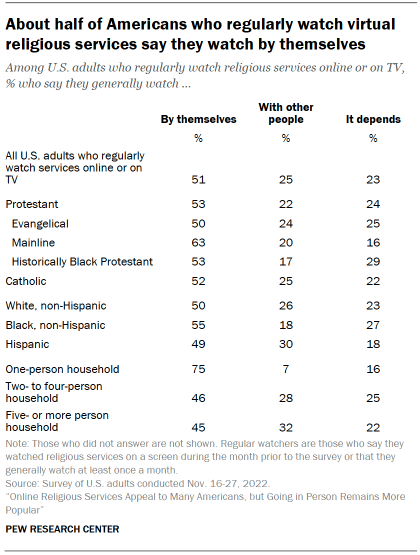
In stark contrast to the communal worship experience that churches and other houses of worship are known for – bringing people together in a building where they pray alongside each other – the experience of virtual worship is often a solitary one. About half (51%) of those who regularly watch religious services online or on TV say they generally watch these services alone. A quarter say they watch with other people, while another 23% say “it depends.”

Most regular viewers (61%) say that when they are watching services on a screen, they typically do not do things they would normally do when attending in person, such as praying out loud, singing or kneeling. For nearly four-in-ten virtual viewers (39%), though, the remote experience is similar to worshipping in person in ways such as these, all or most of the time. This is especially common among virtual worshippers who are Black (49%) and Hispanic (47%).

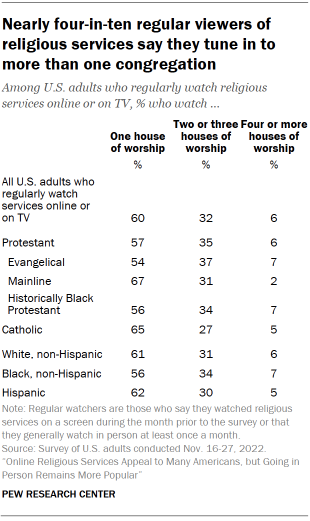
In addition, most virtual viewers (60%) watch services from just one house of worship, while 32% watch services from two or three congregations, and 6% watch services from four or more different congregations.

As for which congregations they watch, 26% of regular viewers say they exclusively watch services offered by the house of worship they generally attend. About one-in-five (18%) typically watch services offered by a different house of worship, while a similar share (20%) watch services of their own congregation and of other congregations. An additional 36% of regular viewers do not regularly attend religious services in person.

Read more about who watches religious services online or on TV, and their reasons.

Engaging with religion through technology

In addition to asking about virtual worship, the survey asked respondents whether they use online apps or web-based technology for religious purposes. Overall, three-in-ten U.S. adults say they go online to search for information about religion. Roughly one-in-five say they use apps or websites to help them read scripture or to remind them to do so, including 9% who do this daily. A similar share (20%) say they watch religion-focused online videos, such as those found on YouTube or TikTok.

Meanwhile, 15% of U.S. adults say they listen to religion-focused podcasts. A similar share (14%) say they use apps or websites to help or remind them to pray, including 8% who use prayer apps or sites daily. Fewer than one-in-ten (7%) say they participate online in prayer groups, Bible study groups or religious education programs.
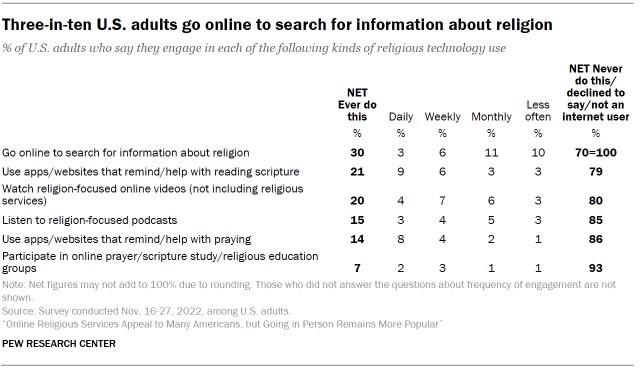
Chart shows Three-in-ten U.S. adults go online to search for information about religion

When these six questions are combined into an overall measure, four main groups of religious technology users emerge:

  • 16% of U.S. adults can be categorized as “heavy users of religious technology” who engage weekly or more often in at least two of the six kinds of religious technology surveyed about.
  • 10% of U.S. adults are “moderate users” who engage at least weekly in one kind of religious technology use.
  • 20% of U.S. adults are “light users” who engage with religious technology online occasionally, but do not use any of the six religion-related technologies on a weekly basis (or more often).
  • 54% of U.S. adults are “non-users” who never use prayer apps, consult scripture apps, watch religion-focused online videos, search for religious information online, listen to religious podcasts, or participate in online prayer/scripture study groups.
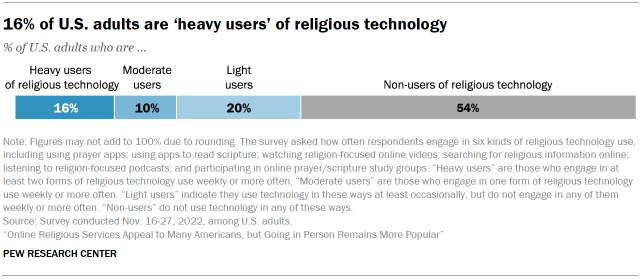
Chart shows 16% of U.S. adults are heavy users of religious technology

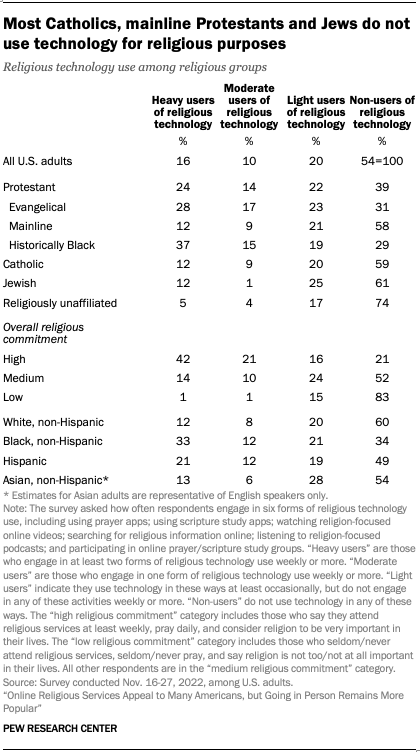
In general, adults in historically Black Protestant denominations (37%) and evangelical Protestants (28%) are more likely to be heavy users of religious technology than people in other major religious groups. Roughly one-in-ten Catholics, mainline Protestants and Jews are heavy users of religious technology (12% of each group).

For example, 47% of Americans in historically Black Protestant denominations and 39% of evangelicals use apps or websites that help or remind them to read the Bible or other scripture, compared with 18% of mainline Protestants and 15% each of Catholics and Jews.2 And 44% of those in the historically Black Protestant tradition and 38% of evangelicals watch religion-focused videos online, compared with 16% of Catholics, 15% of mainline Protestants and 14% of Jews. (Samples of other groups like Muslims, Buddhists and Hindus are too small to analyze, though members of these and many other faiths are included in the survey’s overall findings.)

Read more about the use of apps and websites for religious purposes.

Religion on social media
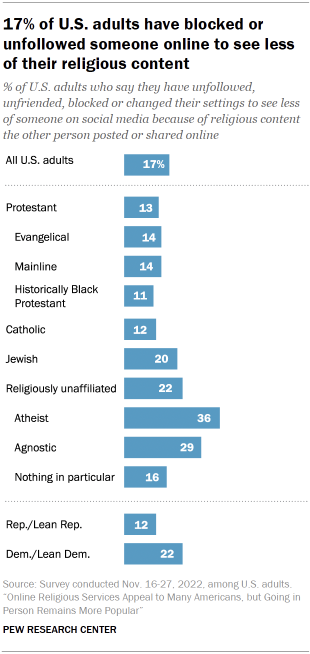
Chart shows 17% of U.S. adults have blocked or unfollowed someone online to see less of their religious content

The survey also asked about social media usage, including how often respondents post or share content about religion online. Overall, 17% of U.S. adults say they post or share things about religion, including 2% who do this daily.

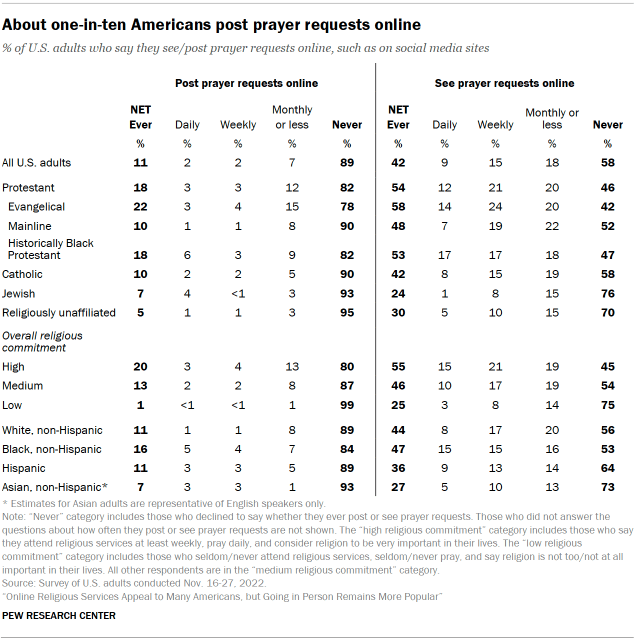
In addition, the survey asked, specifically, whether Americans post prayer requests online, including on social media sites. Roughly one-in-ten (11%) say they have posted a prayer request, while about four-in-ten (42%) have seen someone else’s prayer request online.

Meanwhile, 17% of Americans say they have unfollowed, unfriended or blocked a person on social media, or changed their social media settings to see less of a person, due to religious content they posted. And 3% say that someone else has done this to them online.

Atheists and agnostics are more likely than most other religious groups to say they have unfollowed others due to religious content. Democrats and independents who lean toward the Democratic Party are more likely than Republicans and Republican leaners to have unfollowed someone due to religious content on social media (22% vs. 12%).

Read more about the use of social media for religious purposes.

Differences in virtual worship by denomination
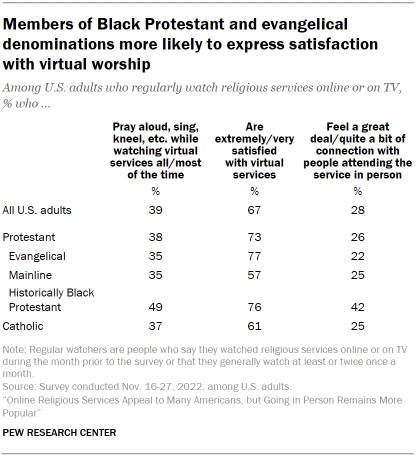
Chart shows Members of Black Protestant and evangelical denominations more likely to express satisfaction with virtual worship

Americans who belong to historically Black Protestant denominations are more frequent watchers of religious services than the other U.S. religious groups with sample sizes large enough to analyze.

For example, about six-in-ten adults in historically Black Protestant denominations (58%) say they generally watch religious services on screens at least monthly or watched them in the month prior to the survey. This compares with 47% of evangelicals, 28% of mainline Protestants, 24% of Catholics and 19% of Jews.

Among regular viewers of religious services, those in historically Black Protestant denominations are also more likely to say they feel strong connections to in-person attenders at the services they are watching. In addition, members of historically Black Protestant churches (along with evangelicals) are more likely than Catholics and mainline Protestants to express high levels of satisfaction with virtual services in general.

Read more about who watches religious services online or on TV, and their reasons.

Differences in virtual worship by race and ethnicity

Chart shows Black adults more likely than others to watch virtual religious services

Irrespective of religious denomination, Black Americans stand out from people of other racial and ethnic backgrounds as generally more engaged with digital technology in their religious lives.

For example, 48% of Black adults say they watch religious services online or on TV at least monthly, or that they did so in the month prior to the survey. That is more than twice the share of White adults (22%) and higher than the share of Hispanic adults (30%) who regularly join religious services remotely.

In addition, Black adults are more likely than White or Hispanic adults to say they use apps that help or remind them to pray or to read scripture, and to say that they participate in online prayer groups, study groups and religious education programs. For example, roughly four-in-ten Black adults (41%) say they use an app to remind or help them to read scripture, compared with 25% of Hispanic adults and 17% of White adults who say they do this. And 32% of Black adults say they use an app to remind or help them to pray, compared with 20% of Hispanic adults and 10% of White adults.

Some of the heavy engagement by Black Americans may be related to their relatively higher levels of religious commitment in general. But even when the analysis is limited to Americans who are highly religious – i.e., those who attend services at least weekly, pray daily and say religion is very important in their lives – highly religious Black adults (54%) are more likely than highly religious White adults (38%) to be heavy users of religious technology.

Chart shows One-third of Black adults are ‘heavy users’ of religious apps and websites

The survey also finds that Black and Hispanic virtual viewers are more likely than White viewers to say that while watching religious services they typically do things they would normally do if they were attending the service in person, such as praying out loud, singing and kneeling. Roughly half of Black (49%) and Hispanic (47%) adults who regularly watch services on screens say they do these things all or most of the time during virtual services, compared with 32% of White adults who regularly join religious services remotely.

Black and Hispanic adults who watch religious services regularly (33% each) are also more likely than White adults (18%) to say they usually feel like an active participant during virtual religious services.

Age differences in the use of technology for religious purposes

Overall, there are modest differences between younger and older adults in the general population when it comes to use of technology for religious purposes. Among Americans 65 and older, 13% are heavy users of religious technology, which is slightly lower than the shares of heavy users among those ages 50 to 64 (16%), ages 40 to 49 (18%) and ages 18 to 39 (16%).

That said, links between religion and technology use are complicated. Given that older people tend to be more religious than younger people, they might be expected to use religious technologies more. But it’s also true that older people are generally less likely than younger people to use technology in general. So, to get a better sense of the relationship between age and religious technology use, we analyzed the habits of only highly religious people (those who pray daily, attend religious services weekly and say religion is very important in their lives), on the grounds that they might be more inclined than other Americans to use religious technology in the first place. Looking at it this way, the age differences are more obvious. Half of highly religious Americans under 50 are heavy users of religious technology, compared with about a third of highly religious Americans ages 65 and older.
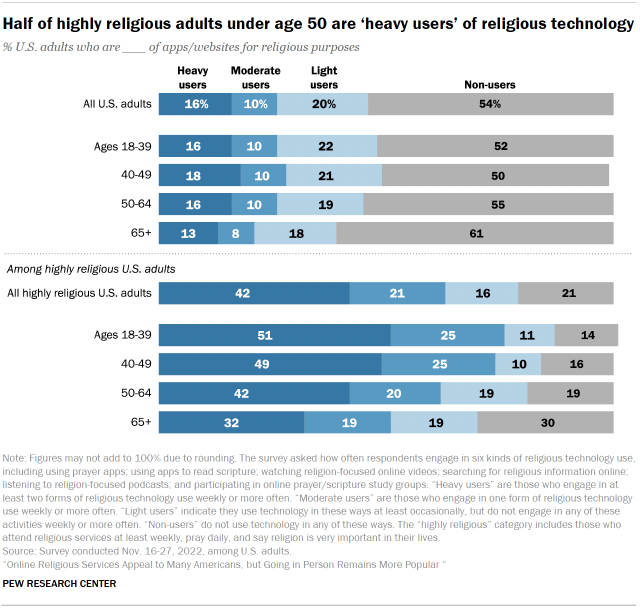
Chart shows Half of highly religious adults under age 50 are ‘heavy users’ of religious technology

Motivations for virtual viewing and for attending in person less often

There is no single reason why virtual religious services appeal to many Americans. When asked why they tune in, regular viewers tend to give multiple answers. But of six possible reasons offered in the survey, the most commonly chosen is convenience. More than four-in-ten regular watchers (43%) say convenience is a major reason they watch services on screens. The next most-cited major reason is being able to watch services that are far from their home (34% say this).

With the height of the pandemic in the rearview mirror when the survey was conducted, personal health and safety – meaning, not having to worry about catching or spreading COVID-19 or other illnesses – is tied for the third most-cited major reason for watching services online or on TV, cited by 25%. That same share says this about being able to keep up with congregations to which they previously belonged.
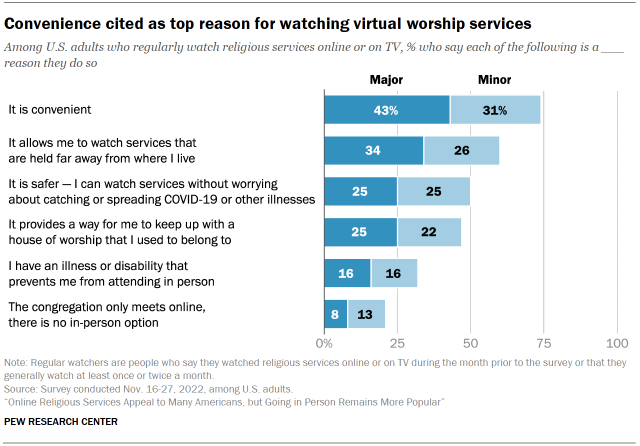
Chart shows Convenience cited as top reason for watching virtual services

Fewer regular viewers cite illness or disability (16%) or their congregation’s lack of an in-person option (8%) as a major reason they regularly watch religious services.

Additional viewers cite these as minor reasons for watching services online. In sum, around three-quarters of viewers (74%) say convenience is either a major or minor reason for viewing services virtually, while six-in-ten say this about getting to watch services held far from where they live. Roughly half say personal safety (49%) or being able to keep up with congregations they once belonged to (48%) is either a major or minor reason for watching online.

A corresponding set of questions asked about the reasons why some Americans attend in-person worship services less often than they did before the pandemic. (One-in-five U.S. adults say they attend religious services in person less often now than prior to the COVID-19 outbreak.)

The two most-cited reasons for less frequent attendance are the development of other spiritual interests and a continued concern about COVID-19. About one-fifth of less frequent attenders (21%) say they go to religious services less often now because they found other ways to pursue their spiritual interests, and a similar share say they go less often because they are still worried about COVID-19.
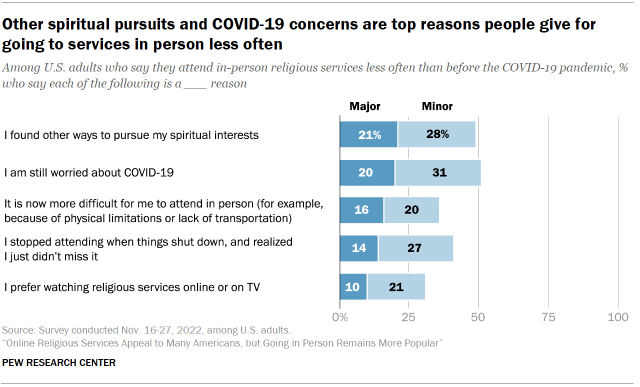
Chart shows other spiritual pursuits and COVID-19 concerns are top reasons people give for going to services in person less often

Slightly lower shares say a major reason they now attend in person less often is that there are personal difficulties related to in-person attendance (16%), they realized after the shutdown that they didn’t miss in-person attendance (14%), and that they prefer watching services online or on TV (10%).

Overall, about half of less-frequent attenders cite worries about COVID-19 or the pursuit of other spiritual interests as either a major or minor reason they attend less often now than they did prior to the pandemic.

The rest of this report explores the survey findings in more detail.
1. Americans’ experiences with virtual religious services

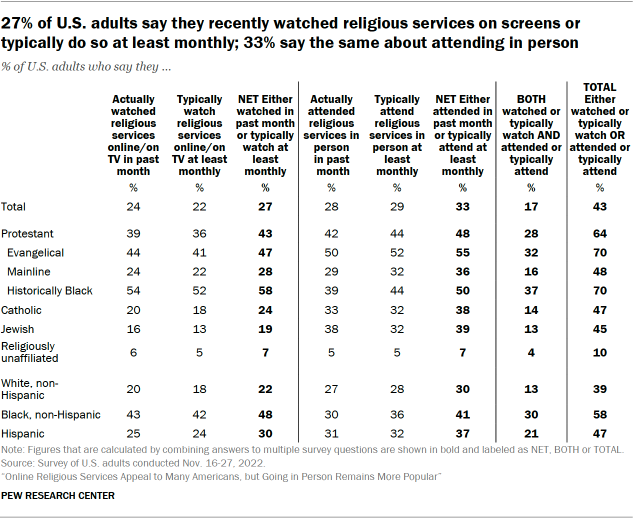
Roughly a quarter of U.S. adults (27%) regularly watch religious services online or on TV, while a third regularly attend services in person, according to a Pew Research Center survey conducted in November 2022. The survey took place as the coronavirus pandemic was winding down but before the Centers for Disease Control and Prevention declared an end to the COVID-19 public health emergency in the United States in May 2023.

Defining ‘regular’ watchers and ‘regular’ attenders

In this report, “regular watchers” of religious services include everyone who says they watched services online or on TV in the month prior to the survey or that they generally watch at least once or twice a month. “Regular attenders” include everyone who says they attended services in person in the month prior to the survey or that they generally attend at least once or twice a month.

There is a fair amount of overlap between those who go to religious services in person and those who join virtually: 17% of U.S. adults say they do both. Accounting for this overlap, the survey finds that about four-in-ten Americans (43%) regularly join in worship services one way or the other, either in person or on screens – a figure that has held steady since the pandemic hit the U.S. in early 2020.

Among the 17% of Americans who both attend services in person and watch them virtually, the clear preference is attending in person. Roughly three-quarters of those who worship both ways say they prefer going to services in person, while about one-in-ten prefer virtual services and 14% have no preference. 

In general, Americans who go in person to a church, synagogue, mosque, temple or other house of worship feel more connected to their fellow worshippers. About two-thirds (65%) of regular attenders say they feel “a great deal” or “quite a bit” of connection with others who attend in person. That’s more than twice the share of virtual worshippers who say they feel those levels of connection with people who physically attend the services they are watching (28%) and nearly three times the share of virtual worshippers who feel strongly connected to other people who – like themselves – are watching the services on screens (22%).

The survey also finds that about four-in-ten adults who regularly watch services online or on TV (39%) say that while they are watching, they do the things they normally would do if they were attending in person, such as praying or responding out loud, singing or kneeling. Overall, 25% of virtual viewers say they feel like an active participant in the services they watch. The remaining three-quarters either feel like they are watching without truly being an active participant (32%) or feel “a little of both” ways (42%).

On the other hand, most viewers see advantages in watching virtually. Of six possible reasons listed in the survey for joining religious services remotely, the top choice is convenience; 43% of people who regularly watch services online or on TV say convenience is a major reason they do so, and 31% say convenience is a minor reason. Respondents could choose multiple reasons, and other common choices are being able to watch services that are held far away from where they live, and being able to watch services without worrying about catching or spreading COVID-19 or other illnesses. Fewer say they have an illness or disability that prevents them from attending in person, that their congregation meets online only (with no in-person option), or that watching provides a way for them to keep up with a house of worship they used to belong to.

This chapter also explores other elements of watching religious services on screens, including how satisfied virtual worshippers are with the experience; whether U.S. adults tend to watch services at congregations other than the ones they attend in person; how many different congregations they join virtually; and whether the services they watch are inside or outside the area where they live.

What share of U.S. adults watch or attend religious services?

To measure the presence of U.S. adults at religious services, Pew Research Center asked two sets of questions. First, we asked Americans whether they attended or watched services in the last month. Second, we asked how often, in general, they attend or watch services.

Chart shows 27% of U.S. adults say they recently watched religious services on screens or typically do so at least monthly; 33% say the same about attending in person

Putting these figures together, 33% of Americans either say they generally attend services in person at least once a month or say they went to services in the month prior to the survey. Another 27% say they generally watch services online or on TV at least monthly or report that they did so in the month prior to the survey. This includes 17% of U.S. adults who partake in religious services both ways, attending physically and virtually. In sum, 43% of Americans indicate they were watching and/or attending religious services on a regular basis at the time of the survey in November 2022.

When did regular virtual viewers of religious services begin the habit?

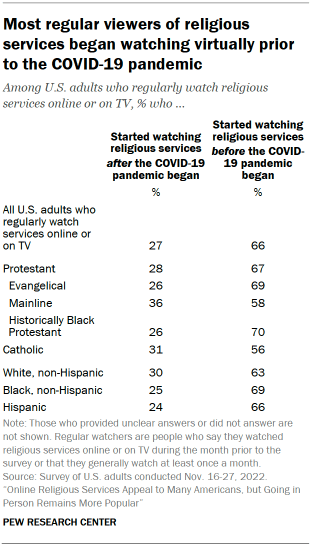
Chart shows most regular viewers of religious services began watching virtually prior to the COVID-19 pandemic

To get a broad sense of how long Americans have been streaming religious services, the survey asked when they started this habit: Was it during the COVID-19 pandemic? Or before the pandemic began?

Most regular viewers (66%) say they began watching services on screens before the pandemic. About a quarter say they started doing so during the pandemic. (The remainder either gave an inconsistent pattern of responses or declined to answer the question.)

However, it may be helpful to bear in mind that as the pandemic recedes, the percentage of Americans going to religious services in person has risen, while the share joining online or on TV has fallen. Since this question was asked only of people who currently watch religious services on screens, it does not capture substantial numbers who were watching services on screens during the height of the pandemic but no longer did so by the time the survey was conducted in November 2022 – a group that may have been more inclined to adopt the habit during the pandemic. A Center survey in July 2020 found that a third of U.S. adults had watched religious services online or on TV in the previous month, and a little more than half of them said they did so for the first time during the pandemic.

Most common reasons for virtual viewing

The survey also asked regular viewers of religious services about their reasons for watching remotely. People in this group (27% of U.S. adults) were presented with six possible reasons and were asked whether each was a “major reason,” a “minor reason,” or “not a reason” why they choose to watch religious services virtually.

The most common reason Americans give for watching services online or on TV is simply that “it is convenient,” with 43% of regular viewers citing this as a major reason and an additional 31% describing it as a minor reason. Six-in-ten remote viewers cite the ability to watch services that are held far away from where they live, including about a third (34%) who say this is a major reason why they watch services virtually.

Chart shows a quarter of U.S. adults who regularly watch religious services online or on TV cite COVID-19 as major reason for doing so

About half of all virtual viewers say that being able to worship without worrying about catching or spreading COVID-19 or other illnesses is a reason, including a quarter who describe this concern as a major incentive for watching religious services online or on TV. Similar numbers say it provides a way for them to keep up with a house of worship they used to belong to. Smaller shares say a disability or illness prevents them from attending services in person – about a third say this is either a major or minor reason – or say their congregation only offers virtual services.

Regular viewers who belong to historically Black Protestant denominations are more likely than those in any other major U.S. religious group to cite safety from contagious diseases; 38% say it is a major reason why they choose to worship remotely. Members of historically Black Protestant churches and evangelical Protestants also are especially likely to say they watch virtually because it allows them to see services far away from where they live.

The virtual worship experience

Chart shows 39% of those who watch religious services on screens say they usually participate physically in similar ways as they would in person

Another gauge of the virtual worship experience is whether Americans physically participate in the same ways they would if they were present in person. The survey asked regular watchers of religious services how often during virtual services “do you do the things you would normally do if you were attending the service in person, like praying out loud, saying responses out loud, singing or kneeling?” About four-in-ten regular religious service viewers (39%) say they do such things “all the time” or “most of the time” while watching services.

Members of churches in the historically Black Protestant tradition are more likely than other Christian groups to report engaging in these activities all or most of the time when they watch services virtually.

Chart shows about half of Americans who regularly watch virtual religious services say they watch by themselves

Yet many members of historically Black Protestant churches who stream religious services online or watch on TV do so alone (53%), which is also the case for virtual worshippers as a whole. About half (51%) of U.S. adults who regularly watch religious services online or on TV say they watch by themselves. A quarter of virtual worshippers say they generally watch with other people, while 23% say “it depends.” Mainline Protestants are somewhat more likely than members of other Christian subgroups to say they watch virtual services by themselves (63%).

Do watchers of religious services feel like active participants?

Chart shows 25% of those who regularly watch religious services online say they feel like active participants

A quarter of U.S. adults who regularly watch religious services online or on TV say that when they watch, they feel they are an active participant in the services, while slightly more (32%) say they watch without feeling they are “truly” being an active participant. Meanwhile, a plurality (42%) say that they feel a little bit of both ways while watching services on screens.

Protestants in the historically Black tradition (32%) and Catholics (31%) who regularly watch services online or on TV are more likely than evangelical Protestants (18%) and mainline Protestants (20%) to say they feel they are actively participating when they watch. Additionally, regular viewers who are White (18%) are less likely than those who are Black or Hispanic (33% each) to report feeling this way while watching services.

Virtual worshippers who report doing the things they normally would do at services in person – like praying or responding aloud, singing or kneeling – are more likely to feel like active participants than those who don’t engage in those kinds of behaviors.

Satisfaction with virtual services

About two-thirds of U.S. adults who regularly watch religious services online or on TV say they are generally “extremely” or “very” satisfied with these services. Nearly three-in-ten virtual worshippers (28%) say they are “somewhat” satisfied with the services they watch, and 5% say they are “not too” or “not at all” satisfied.

Chart shows two-thirds of adults who regularly watch religious services virtually are satisfied with the experience

About three-quarters of evangelicals (77%) and Protestants in historically Black denominations (76%) who regularly watch religious services on screens report high levels of satisfaction with them, which is notably higher than the shares of mainline Protestant (57%) and Catholic (61%) viewers who say the same.

Satisfaction with sermons at virtual religious services also tends to be high – though not as high as for sermons at the worship services Americans attend in person.

Chart shows about two-thirds of regular watchers of virtual religious services are highly satisfied with the sermons

About two-thirds (68%) of virtual viewers say they are extremely or very satisfied with the sermons they hear online or on TV. This is slightly lower than the 74% of regular attenders who say they are extremely or very satisfied with the sermons they hear when they go to religious services in person.

Meanwhile, about eight-in-ten (81%) evangelicals who are regular viewers of virtual services report being highly satisfied with the sermons they hear, as do roughly three-quarters (76%) of viewers who affiliate with historically Black Protestant churches. Both groups are more likely than mainline Protestants (63%) and Catholics (57%) who regularly watch religious services online or on TV to say they are extremely or very satisfied with the sermons.

Chart shows Protestants in the historically Black tradition are especially likely to be satisfied with music at virtual services

Looking at differences by race and ethnicity apart from religious affiliation, about three-quarters of both Black (74%) and White (73%) Americans who regularly watch services online or on TV say they are extremely or very satisfied with the sermons at these services. A smaller share of Hispanic adults in this group express a high level of satisfaction (60%).

In general, regular viewers are less satisfied with the music at virtual services than with the sermons. And the gap between satisfaction with music at virtual services and at services attended in person is larger than the corresponding gap on sermons. A little more than half of regular viewers (54%) say they are extremely or very satisfied with the music they hear when watching services online or on TV, compared with 69% of regular attenders who say this about the music at in-person services.

Among regular viewers, those in the historically Black Protestant tradition are most likely to say they are extremely or very satisfied with the music they hear online or on TV when watching religious services (69%). Smaller shares of evangelical Protestant (57%), Catholic (50%) and mainline Protestant (47%) viewers say the same. And irrespective of religious denomination, Black (65%) and Hispanic (60%) viewers are more likely than those who are White (51%) to say they are highly satisfied with the music at religious services online or on TV.

How connected do virtual viewers feel to other worshippers?

Chart shows virtual watchers of religious services feel far less connected with others than do in-person attenders

Respondents who regularly watch virtual services were asked to rate how connected they feel both with the people attending the same services in person and with those who, like themselves, are watching virtually. Separately, Americans who regularly attend services in person were asked to rate how connected they feel with others attending the services alongside them, physically.

Overall, 28% of people who regularly watch services online or on TV say they feel either “a great deal” (14%) or “quite a bit” (14%) of connection with people attending the same service in person; an additional 22% say they feel “some” connection, and 44% say they feel “a little” or “no” connection.

Meanwhile, among regular viewers, smaller numbers express a strong connection (i.e., a great deal or quite a bit) with other worshippers who are also watching the service virtually. Regular viewers who belong to churches in the historically Black Protestant tradition are more likely than those in other Christian groups to say they feel strong levels of connection to in-person attendees and to others watching on screens. For example, 42% of these viewers say they feel a strong connection to the people attending a service in person while they themselves are watching virtually, compared with 25% of Catholics, 25% of mainline Protestants and 22% of evangelicals who say this.

In addition, viewers who typically do things like praying out loud, singing or kneeling while watching services are more likely than those who don’t do these things to say they feel strong connections with other watchers and with people attending the service physically. Viewers who watch services with others, rather than by themselves, are also more likely to feel connected to other virtual worshippers and to those worshipping at the same services in person.

In general, adults who regularly attend services in person report much stronger feelings of connection to other worshippers than those who view services virtually do. Roughly two-thirds of regular attenders say they feel a great deal (35%) or quite a bit (30%) of connection with the other people in attendance. Protestant attenders (71%) are much more likely than those who are Catholic (50%) to report feeling this level of connection with their fellow churchgoers.

Clear preference for in-person services among those who also watch virtually

Chart shows among those who regularly attend services in person and watch them online, large majority prefer in-person attendance

Among U.S. adults who both watch services online or on TV and attend them in person on a regular basis, there is no ambiguity about which mode of worship they prefer. Roughly three-quarters (76%) say they prefer attending in person, while about one-in-ten (11%) say they prefer online services. An additional 14% say that they have no preference.

Large majorities of every religious group with large enough sample sizes for analysis say they prefer attending services in person to watching them virtually, though members of historically Black Protestant denominations are somewhat less likely than evangelicals and Catholics to say this.

Leaving religious denomination aside to consider differences by race and ethnicity only, roughly two-thirds of Hispanic (68%) and Black (65%) Americans who both physically attend and watch services online on a regular basis say they prefer attending services in person. The two groups are equally likely (16% each) to say they prefer watching services on screens. White Americans are much more likely to prefer in-person attendance (87%) and less likely to prefer watching virtually (5%).

How many different congregations do virtual worshippers watch?

Chart shows nearly four-in-ten regular viewers of religious services say they tune in to more than one congregation

Overall, a majority of U.S. adults who regularly watch religious services online or on TV (60%) say they stream or tune in to the services of just one house of worship. About a third (32%) say they watch two or three congregations, and an additional 6% say they remotely watch the services of four or more congregations.

Some religious groups are more likely than others to say they watch services offered by multiple congregations. Among regular viewers, evangelical Protestants (45%) are more likely than mainline Protestants (33%) and Catholics (32%) to say they watch the services of two or more houses of worship.

Majority of virtual service viewers watch a non-local congregation

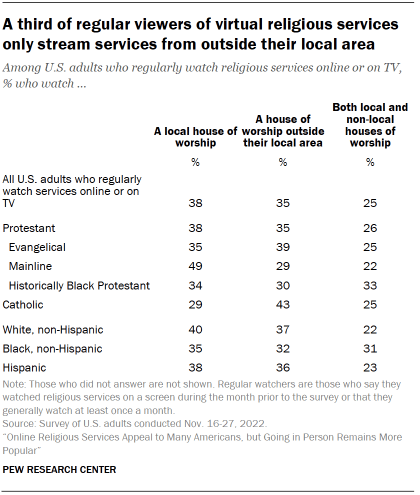
Nearly four-in-ten adults (38%) who regularly watch services online say the services they watch are offered by a house of worship in their local area. About a third (35%) say they watch services offered by a house of worship outside their local area, while a quarter say they watch services offered both by local and non-local congregations.

Chart shows a third of regular viewers of virtual religious services only stream services from outside their local area

Among regular online viewers, mainline Protestants stand out as the group most likely to say they watch services only of local congregations in their area: About half (49%) say this. Regular virtual viewers who affiliate with denominations in the historically Black Protestant tradition are the most likely to watch services offered by both local and non-local houses of worship, with a third saying they do this.

Another way the survey explored viewership of religious services was by asking regular viewers whether they stream or tune in to virtual services only at their in-person congregation, or whether they watch services offered by other houses of worship.

Chart shows about four-in-ten U.S. adults who regularly watch virtual religious services watch congregations aside from one they attend in person

Nearly three-quarters of virtual viewers watch services at a congregation they do not attend in person. This includes those who watch at least one congregation other than the one they attend most often in person (38% of virtual viewers) as well as those who do not have an in-person congregation (36%). Both of those figures are higher than the 26% of virtual viewers who watch services only of their own, in-person congregation.

Roughly four-in-ten regular viewers who are Catholic (43%), belong to the historically Black Protestant tradition (43%), or are evangelical Protestants (42%) say they regularly attend services in person and also watch services of at least one congregation that is not their own. By comparison, a smaller number of mainline Protestant viewers (24%) say they do this.

2. Use of apps and websites in religious life

Technological innovations brought on by the internet have touched virtually all aspects of human life, including religion. In addition to letting people stream religious services, apps and websites can help people pray, read scripture, learn about religion, and participate in online prayer groups, among other things.

Still, the usage of some comparable “analog” technologies is more common. For example, 79% of highly religious U.S. adults read religion-focused books, higher than the 45% who watch religion-focused videos online. Nearly six-in-ten highly religious adults (57%) listen to religion-focused radio stations, higher than the 38% who listen to religion-focused podcasts. And 61% of highly religious adults go to prayer groups or scripture study groups in person, compared with 19% who join such groups online.

That said, digital technology clearly has a foothold among highly religious Americans (defined, for the purposes of this analysis, as U.S. adults who say they attend services weekly, pray daily and consider religion to be very important in their lives). About half of Americans with this high level of religious commitment say they use an app or website to help them or remind them to read scripture (52%) or go online to search for information about religion (53%). Nearly three-in-ten (28%) say they use an app or website to help them or remind them to pray.

In the population at large, on the other hand, three-in-ten U.S. adults (including those who are not religious) say they go online to search for information about religion. Roughly two-in-ten say they use apps or websites as aids or reminders for scripture reading (21%) or to watch religion-focused videos on platforms such as YouTube or TikTok (20%), while 14% use apps to help them or remind them to pray.

Among the country’s large religious groups, members of historically Black Protestant denominations tend to use digital technology in their religious lives more than others do.

Americans ages 65 and older are slightly less likely than younger adults to use apps and websites for religious purposes. According to a scale measuring overall usage of multiple kinds of religious technology, 13% of people 65 and older are “heavy users” of apps and websites for religious reasons, compared with 16% to 18% of those in younger age brackets. The difference is larger when looking just at highly religious Americans: 32% of highly religious adults 65 and older are heavy users of religious technology, compared with 42% of those 50 to 64; 49% of those 40 to 49; and 51% of those 18 to 39. (More details about the scale of religion-related technology use can be found here. A table showing the differences by age can be found in the Overview of this report.)

Regarding social media use, the new survey also shows that 17% of U.S. adults say they have ever unfollowed, unfriended, blocked someone, or changed their social media settings to see less of someone online because of religious content the person posted. A lower share (3%) say they themselves have been unfollowed or blocked by someone else for sharing religious content online.

In addition, the survey asked about using apps for a couple of purposes that some people may consider religious or spiritual, while others may not. These findings show that 18% of U.S. adults use apps or websites to help them or remind them to meditate, and an identical share say they use apps or websites to help them or remind them to be grateful.

Roughly four-in-ten Americans have used an app or site that reminds or helps them to pray, read scripture, meditate or be grateful

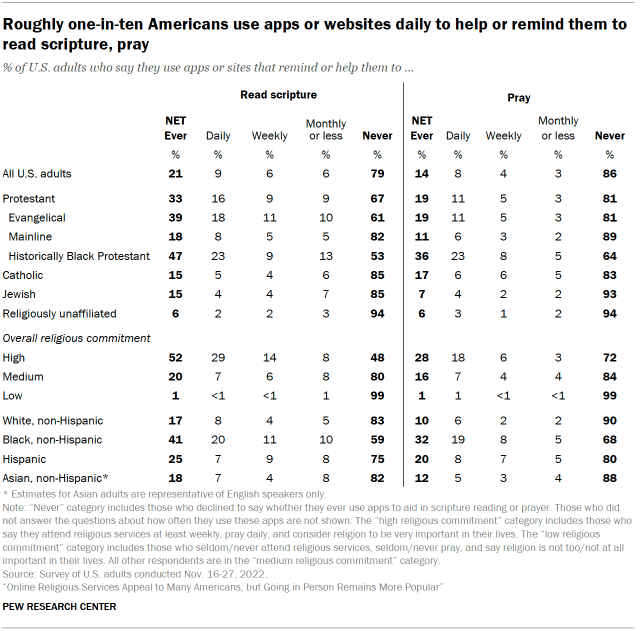
About two-in-ten or fewer U.S. adults take to their online devices to help them or remind them to read scripture (21%), meditate (18%), be grateful (18%) or pray (14%) either daily, weekly, monthly or less often. More than a third of U.S. adults (37%) say they ever use apps or websites for at least one of these four purposes.

Frequency of usage of these apps and websites varies widely. Still, roughly one-in-ten U.S. adults say they use an app or website every day to help them or remind them to read scripture (9%), pray (8%) or be grateful (8%). And 5% say the same about apps or websites that help (or remind) them to meditate.

Notably, usage tends to be higher among members of the historically Black Protestant tradition, who are, for example, more than twice as likely as the general adult population to say they ever use apps or websites for reading scripture (47% vs. 21%). Close to a quarter of adults who belong to historically Black Protestant denominations say they use apps or websites every day for reading scripture or for praying (23% for each activity). All in all, 59% of adults in the historically Black Protestant tradition report that they ever use apps or websites in at least one of the four ways listed.

Looking at other religious groups, evangelical Protestants also stand out as heavy users of apps and websites that help them or remind them to read scripture: 39% say they use these technologies, including 18% who say they use such apps or sites daily. Evangelicals also use prayer apps or websites at above-average rates.

Jews are less likely than people in most other U.S. religious groups to say they use apps or websites to help (or remind) them to pray than are people in most other religious groups that are large enough to analyze separately. Just 7% of Jews say they use these technologies for prayer.

About half (52%) of U.S. adults with high levels of religious commitment say they use apps or websites to help them or remind them to read scripture, including about three-in-ten (29%) who do this every day. And 28% of Americans in the highly religious category say they use prayer apps or sites, including 18% who do so daily.

Irrespective of religious traditions, Black adults are more likely than other Americans to use apps or sites to help them pray or read scripture. For example, 41% of Black Americans use apps or sites to help them read scripture, compared with 25% of Hispanic adults, 18% of Asian adults and 17% of White adults.3

Chart shows roughly one-in-ten Americans use apps or websites daily to help or remind them to read scripture, pray

And, by just a slight margin, younger adults outpace older adults in using apps or sites that encourage meditation. Roughly a quarter of adults under 50 (22%) say they use apps or sites to help (or remind) them to meditate, compared with 16% of those ages 50 to 64 and 9% of those 65 and older.

Chart shows about one-in-five U.S. adults use apps and websites to help or remind them to meditate

Following religious leaders digitally

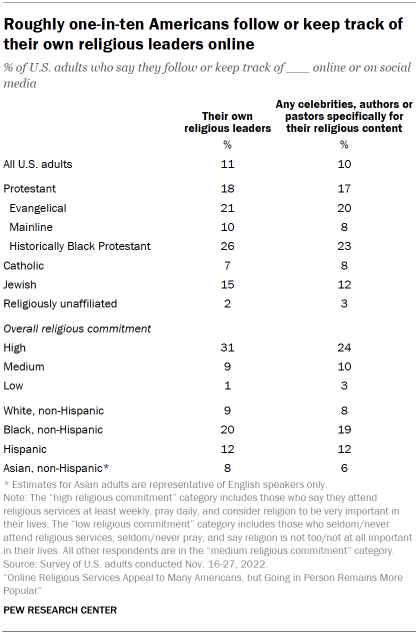
Chart shows roughly one-in-ten Americans follow or keep track of their own religious leaders online

Overall, 11% of U.S. adults say they follow or keep track of their own religious leaders online or on social media. Similarly, one-in-ten say they follow or keep track of anycelebrities, authors or pastors specifically for their religious content online.

About a quarter of Americans who affiliate with historically Black Protestant churches say they use the internet or social media to follow or keep track of their own religious leaders (26%) or any celebrities, authors or pastors specifically for their religious content (23%). Evangelical Protestants are the next most likely religious group of those analyzed to say they do these things; about one-fifth of evangelicals follow their own clergy or other creators of religious content online.

Using digital tools to seek information about religion

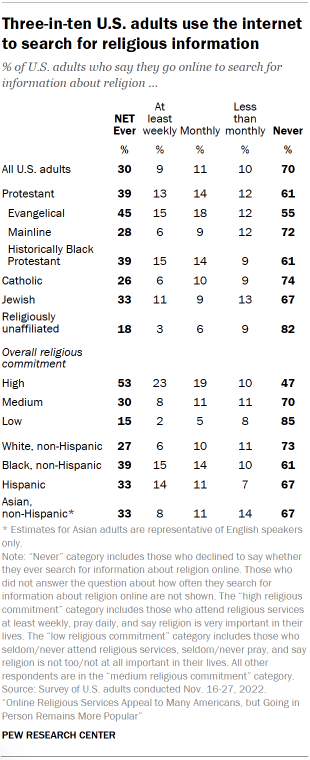
Chart shows three-in-ten U.S. adults use the internet to search for religious information

The survey assessed Americans’ general online religious curiosity and activity by asking whether – and how often – they take to the internet to search for information about religion. Three-in-ten U.S. adults say they do this, including 9% who say they search online for religious information weekly or more often, 11% who do it monthly, and 10% who do it on occasion but less than monthly. Still, a large majority of U.S. adults (70%) say they never go online to search for information about religion.

Among U.S. adults who affiliate with either evangelical Protestant denominations or historically Black Protestant churches, 15% say they use the internet to search for religious information at least weekly, compared with just 3% of the religiously unaffiliated (those who identify as atheist, agnostic or nothing in particular).

Across religious lines, roughly half of adults with a high level of religious commitment (53%) say they search online for information about religion. This includes 23% who say they do so at least once a week.

Watching online videos and podcasts for religious content

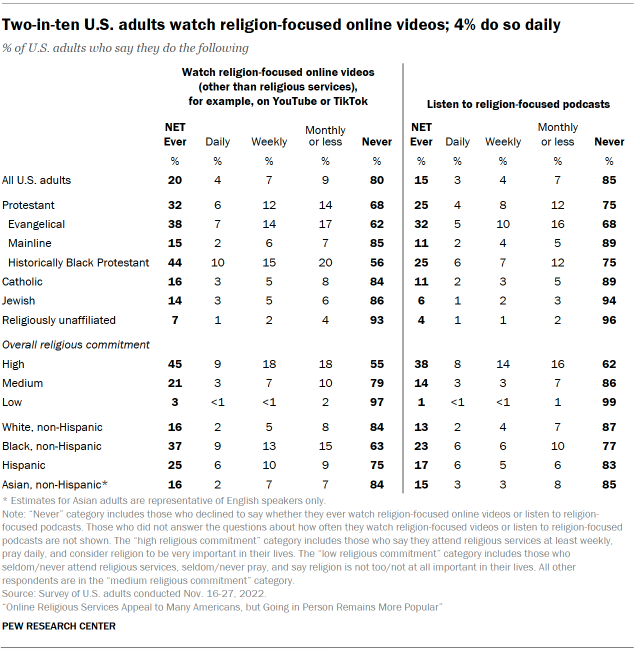
Two-in-ten U.S. adults say they consume religious content through online videos, for example, on YouTube or TikTok, and 15% say they listen to religion-focused podcasts. (The question about online videos asked whether respondents watch online videos other than religious services. Other questions in the survey asked specifically about watching religious services online.)

While younger adults use YouTube and TikTok more often than older adults in general (meaning, for all online content, about all topics), there is essentially no variation by age among those who say they watch videos specifically about religion. A similar pattern emerges when comparing general podcast consumption with podcasts that focus on religion. This could be because younger Americans tend to be less religious than older ones.

Overall, adults in the historically Black Protestant tradition and evangelicals are more likely than other religious groups to say they ever watch religion-focused videos online (44% and 38%, respectively). And nearly one-in-ten (9%) Black adults overall (irrespective of religious tradition) say they watch religion-focused online videos every day (9%), compared with 4% of the general adult population.

Chart shows two-in-ten U.S. adults watch religion-focused online videos; 4% do so daily

Engaging with religion through books and radio

In addition to asking about the use of digital technology to get religious content, the survey also asked about more traditional ways of accessing information about religion.

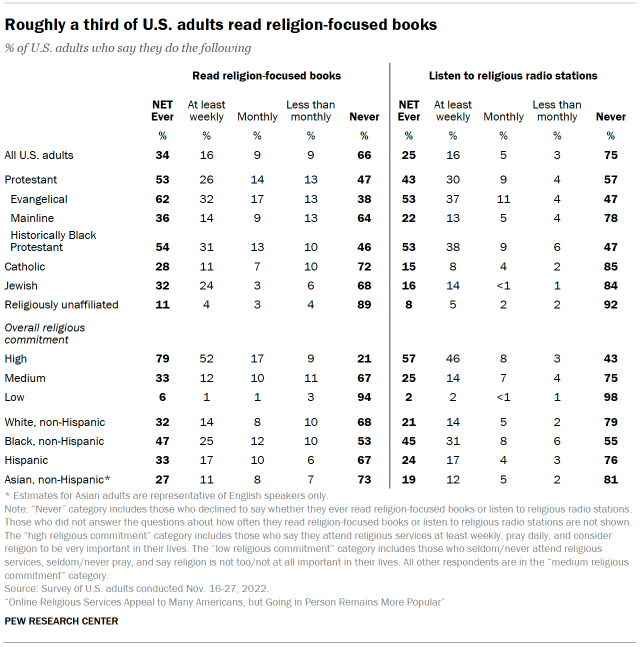
About a third of U.S. adults (34%) say they read religion-focused books, which is more than the 20% who say they watch religion-focused videos online. And a quarter of U.S. adults report listening to religious radio stations – more than the 15% who listen to religion-focused podcasts.

Among Protestants, majorities of evangelicals and those in the historically Black tradition read books which focus on religion or listen to religious radio stations, including about three-in-ten adults in both groups who say they do this at least weekly. Meanwhile, about a quarter of U.S. Jews (24%) read religion-focused books at least weekly, and 14% listen to religious radio stations weekly. By contrast, only about one-in-ten or fewer religiously unaffiliated Americans say they ever do these things.

Looking at age differences, U.S. adults ages 65 and older are much more likely than Americans ages 18 to 29 to say they ever read books focused on religion (42% vs. 23%) as well as to report that they do so at least weekly (23% vs. 11%).

Chart shows roughly a third of U.S. adults read religion-focused books

Online and in-person participation in religious learning programs

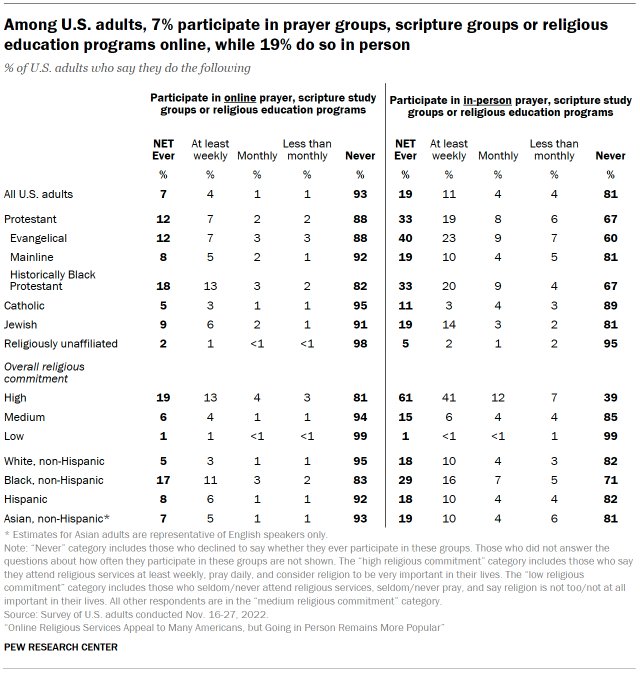
Overall, fewer than one-in-ten Americans (7%) say they ever participate in online prayer groups, scripture study groups or religious education programs, compared with more than twice as many (19%) who say they say participate in such groups in person. Just 4% engage in these activities online at least weekly, compared with 11% who do so in person that frequently.

Evangelical Protestants (23%) and those in the historically Black Protestant tradition (20%) stand out when it comes to meeting in person for at least one of these activities at least weekly. Meanwhile, 14% of Jews say they do this.

Overall, 4% of U.S. adults say they participate at least once a month in both online and in-person versions of prayer groups, scripture study groups or religious education programs.

Chart shows among U.S. adults, 7% participate in prayer groups, scripture groups or religious education programs online, while 19% do so in person

Sharing content about religion and prayer requests on social media

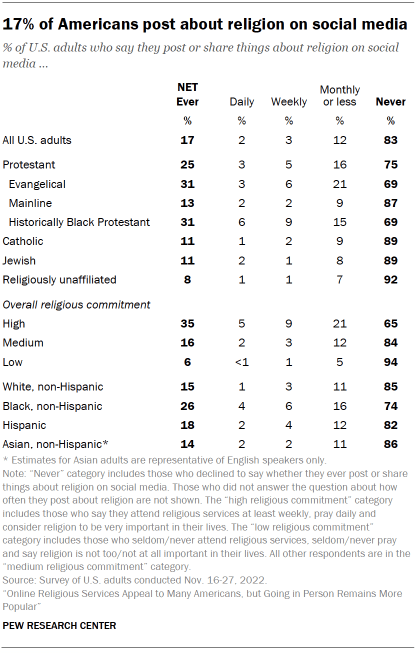
Chart shows 17% of Americans post about religion on social media

The survey finds that 17% of all Americans post or share things about religion on social media, including 2% who do this daily, 3% who do it weekly, and 12% who do it monthly or less often. The vast majority of Americans (83%) do not post or share things about religion on social media.

Evangelical Protestants and those in the historically Black Protestant tradition are more likely to post about religion on social media (31% of each say they ever do this), including 6% of members of historically Black Protestant churches who report doing so daily.

Meanwhile, about one-in-ten U.S. adults (11%) say they post prayer requests online, such as on social media sites, including 2% who say they do this daily. Not surprisingly, far more (42%) say they see other people’s prayer requests online, including 9% who say they see these types of posts daily.

Chart shows about one-in-ten Americans post prayer requests online

Blocking or unfollowing people due to religion content posted online

Chart shows nearly two-in-ten U.S. adults have taken steps to see less religious content from someone on social media

Some 17% of U.S. adults say they have unfollowed, unfriended, blocked, or changed their settings to see less of someone on social media because of religious content the person posted or shared online.

Younger adults are slightly more likely to say they have ever done this on social media. About a quarter of Americans ages 18 to 29 say they have done so (23%), compared with 7% of those 65 and older.

Atheists and agnostics are more likely than people in most other religious affiliation categories to say they have blocked, unfollowed, unfriended, or changed their settings to see less of someone online due to religious content on social media. Just over a third of atheists (36%) and 29% of agnostics say they have done this.

The survey also asked respondents whether, as far as they know, they have ever been unfollowed, unfriended or blocked by someone who wanted to see less of them on social media because of religious content they posted or shared. Only 3% of U.S. adults say this has happened to them.

Scale of religious technology use online

Chart shows most Catholics, mainline Protestants and Jews do not use technology for religious purposes

Researchers combined six of the questions explored in this chapter into a single, overall indicator (or scale) of religion-related technology use online. The six items are: using apps or websites to help with prayer; using apps or websites to help with reading scripture; watching religion-focused online videos; searching for religious information online; listening to religion-focused podcasts; and participating in online prayer groups, scripture study groups or religious education groups. The scale can be used to categorize Americans as “heavy users,” “moderate users,” “light users” and “non-users” of religious technology online.

Overall, 16% of U.S. adults are heavy users of religious technology, meaning they engage in two or more kinds of online technology for religious purposes at least once a week. An additional 10% are moderate users, engaging in one kind of religious technology use at least weekly. One-fifth of U.S. adults are light users who engage in religious technology at least occasionally, but not weekly or more often. The remaining 54% are categorized as non-users of religious technology since they do not use online technology in any of these ways.

Notable differences by religious affiliation emerge from this analysis. Members of the historically Black Protestant tradition are more likely than people in other religious groups to be heavy users of technology for religious reasons (37%). At the other end of the scale, non-users include majorities of mainline Protestants (58%), Catholics (59%) and Jews (61%). Roughly three-quarters (74%) of religiously unaffiliated adults (those who describe themselves as atheist, agnostic or nothing in particular) are also non-users of religious technology.

Acknowledgments

This report is a collaborative effort based on the input and analysis of the following individuals. Find related reports online at pewresearch.org/pewresearch-org/religion and pewresearch.org/pewresearch-org/internet.

Research Team        

Gregory A. Smith, Associate Director, Religion Research   
Michelle Faverio, Research Analyst 
Justin Nortey, Research Analyst      
Alan Cooperman, Director, Religion Research        
Lee Rainie, Director, Internet and Technology Research   
Monica Anderson, Associate Director, Internet and Technology Research           
Becka A. Alper, Senior Researcher               
Colleen McClain, Research Associate          
Besheer Mohamed, Senior Researcher       
Michael Rotolo, Research Associate
Patricia Tevington, Research Associate

Methods Team         

Courtney Kennedy, Vice President, Methods and Innovation
Andrew Mercer, Senior Research Methodologist
Scott Keeter, Senior Survey Advisor
Ashley Amaya, Senior Survey Research Methodologist      
Dorene Asare-Marfo, Panel Manager          
Dana Mildred Popky, Associate Panel Manager
Arnold Lau, Research Methodologist                       

Editorial and Graphic Design

Jeff Diamant, Senior Writer/Editor
Michael Lipka, Editorial Manager
David Kent, Senior Copy Editor                               
Rebecca Leppert, Editorial Assistant                      
Bill Webster, Senior Information Graphics Designer

Communications and Web Publishing

Reem Nadeem, Associate Digital Producer
Stacy Rosenberg, Associate Director, Digital
Kelsey Beveridge, Communications Associate        
Anna Schiller, Senior Communications Manager
Achsah Callahan, Communications Manager

Methodology

The American Trends Panel survey methodology

Overview

The American Trends Panel (ATP), created by Pew Research Center, is a nationally representative panel of randomly selected U.S. adults. Panelists participate via self-administered web surveys. Panelists who do not have internet access at home are provided with a tablet and wireless internet connection. Interviews are conducted in both English and Spanish. The panel is being managed by Ipsos.

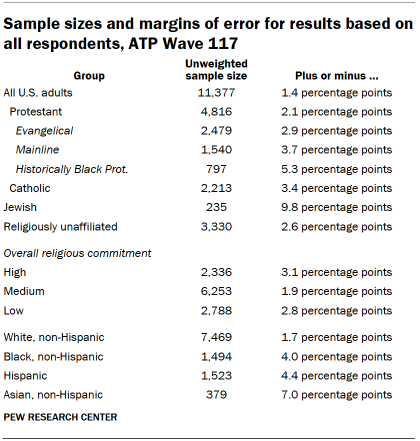
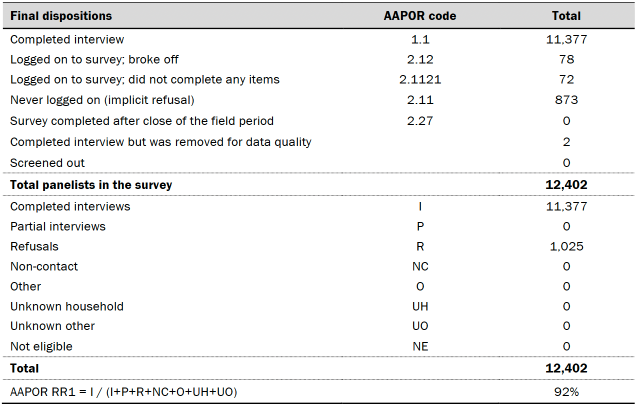
Data in this report is drawn from the panel wave conducted from Nov. 16-27, 2022. A total of 11,377 panelists responded out of 12,402 who were sampled, for a response rate of 92%. The cumulative response rate accounting for nonresponse to the recruitment surveys and attrition is 4%. The break-off rate among panelists who logged on to the survey and completed at least one item is 1%. The margin of sampling error for the full sample of 11,377 respondents is plus or minus 1.4 percentage points.

Panel recruitment

Table shows American Trends Panel recruitment surveys

The ATP was created in 2014, with the first cohort of panelists invited to join the panel at the end of a large, national, landline and cellphone random-digit-dial survey that was conducted in both English and Spanish. Two additional recruitments were conducted using the same method in 2015 and 2017, respectively. Across these three surveys, a total of 19,718 adults were invited to join the ATP, of whom 9,942 (50%) agreed to participate.

In August 2018, the ATP switched from telephone to address-based recruitment. Invitations were sent to a stratified, random sample of households selected from the U.S. Postal Service’s Delivery Sequence File. Sampled households receive mailings asking a randomly selected adult to complete a survey online. A question at the end of the survey asks if the respondent is willing to join the ATP. In 2020 and 2021 another stage was added to the recruitment. Households that did not respond to the online survey were sent a paper version of the questionnaire, $5 and a postage-paid return envelope. A subset of the adults who returned the paper version of the survey were invited to join the ATP. This subset of adults received a follow-up mailing with a $10 pre-incentive and invitation to join the ATP.

Across the five address-based recruitments, a total of 23,176 adults were invited to join the ATP, of whom 20,341 agreed to join the panel and completed an initial profile survey. In each household, one adult was selected and asked to go online to complete a survey, at the end of which they were invited to join the panel. Of the 30,283 individuals who have ever joined the ATP, 12,402 remained active panelists and continued to receive survey invitations at the time this survey was conducted.

The U.S. Postal Service’s Delivery Sequence File has been estimated to cover as much as 98% of the population, although some studies suggest that the coverage could be in the low 90% range.4 The American Trends Panel never uses breakout routers or chains that direct respondents to additional surveys.

Sample design

The overall target population for this survey was non-institutionalized persons ages 18 and older, living in the U.S., including Alaska and Hawaii. All active panel members were invited to participate in this wave.

Questionnaire development and testing

The questionnaire was developed by Pew Research Center in consultation with Ipsos. The web program was rigorously tested on both PC and mobile devices by the Ipsos project management team and Pew Research Center researchers. The Ipsos project management team also populated test data that was analyzed in SPSS to ensure the logic and randomizations were working as intended before launching the survey.

Incentives

All respondents were offered a post-paid incentive for their participation. Respondents could choose to receive the post-paid incentive in the form of a check or a gift code to Amazon.com or could choose to decline the incentive. Incentive amounts ranged from $5 to $20 depending on whether the respondent belongs to a part of the population that is harder or easier to reach. Differential incentive amounts were designed to increase panel survey participation among groups that traditionally have low survey response propensities.

Data collection protocol

The data collection field period for this survey was Nov. 16-27, 2022. Postcard notifications were mailed to all ATP panelists with a known residential address on Nov. 16. 

Invitations were sent out in two separate launches: soft launch and full launch. Sixty panelists were included in the soft launch, which began with an initial invitation sent on Nov. 16. The ATP panelists chosen for the initial soft launch were known responders who had completed previous ATP surveys within one day of receiving their invitation. All remaining English- and Spanish-speaking panelists were included in the full launch and were sent an invitation on Nov. 17.

All panelists with an email address received an email invitation and up to two email reminders if they did not respond to the survey. All ATP panelists that consented to SMS messages received an SMS invitation and up to two SMS reminders.

Table shows Invitation and reminder dates, ATP Wave 117

Data quality checks

To ensure high-quality data, the Center’s researchers performed data quality checks to identify any respondents showing clear patterns of satisficing. This includes checking for very high rates of leaving questions blank, as well as always selecting the first or last answer presented. As a result of this checking, two ATP respondents were removed from the survey dataset prior to weighting and analysis.

Weighting

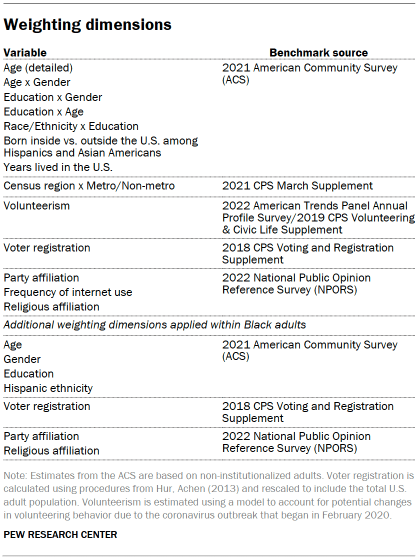
Table shows weighting dimensions

The ATP data is weighted in a multistep process that accounts for multiple stages of sampling and nonresponse that occur at different points in the survey process. First, each panelist begins with a base weight that reflects their probability of selection for their initial recruitment survey. These weights are then rescaled and adjusted to account for changes in the design of ATP recruitment surveys from year to year. Finally, the weights are calibrated to align with the population benchmarks in the accompanying table to correct for nonresponse to recruitment surveys and panel attrition. If only a subsample of panelists was invited to participate in the wave, this weight is adjusted to account for any differential probabilities of selection.

Among the panelists who completed the survey, this weight is then calibrated again to align with the population benchmarks identified in the accompanying table and trimmed at the 1st and 99th percentiles to reduce the loss in precision stemming from variance in the weights. Sampling errors and tests of statistical significance take into account the effect of weighting.

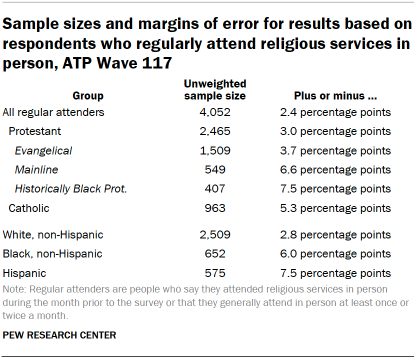
The following tables show the unweighted sample sizes and the error attributable to sampling that would be expected at the 95% level of confidence for different groups in the survey.

Table shows sample sizes and margins of error for results based on all respondents, ATP Wave 117
Table shows sample sizes and margins of error for results based on respondents who regularly attend religious services in person, ATP Wave 117
Table shows sample sizes and margins of error for results based on respondents who regularly attend religious services in person and regularly watch them online/on TV, ATP Wave 117
Table shows Sample sizes and margins of error for results based on respondents who regularly attend religious services in person and regularly watch them online/on TV, ATP Wave 117

Sample sizes and sampling errors for other subgroups are available upon request. In addition to sampling error, one should bear in mind that question wording and practical difficulties in conducting surveys can introduce error or bias into the findings of opinion polls.

Dispositions and response rates

Table shows Dispositions
Table shows response rates