In U.S., Far More Support Than Oppose Separation of Church and State
But there are pockets of support for increased church-state integration, more Christianity in public life
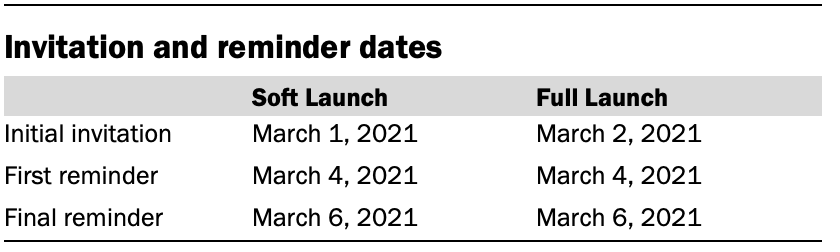
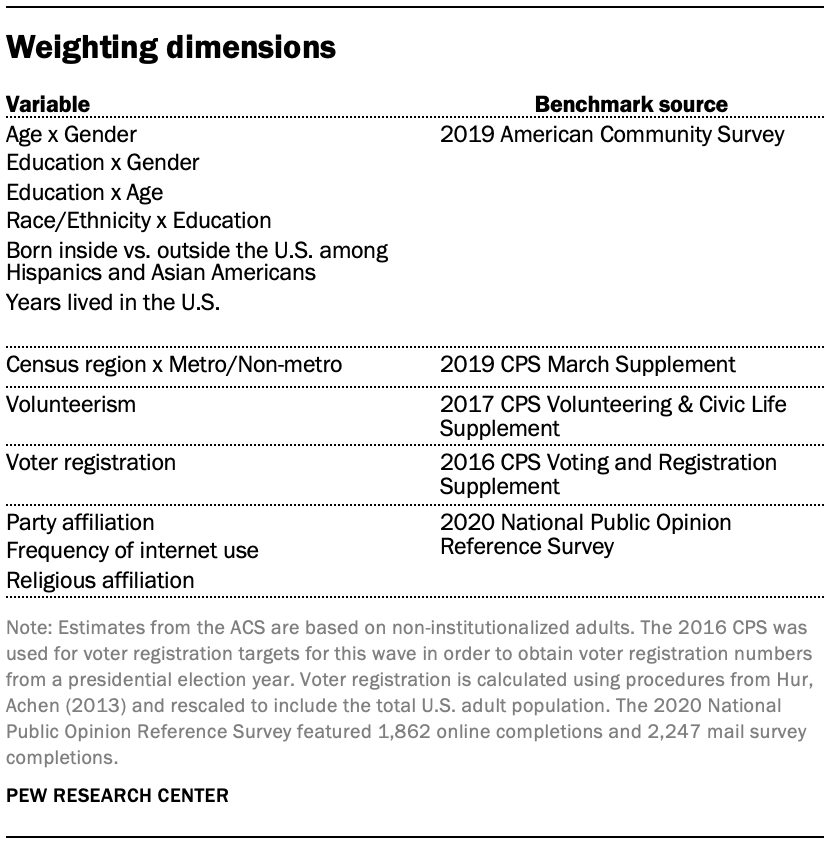
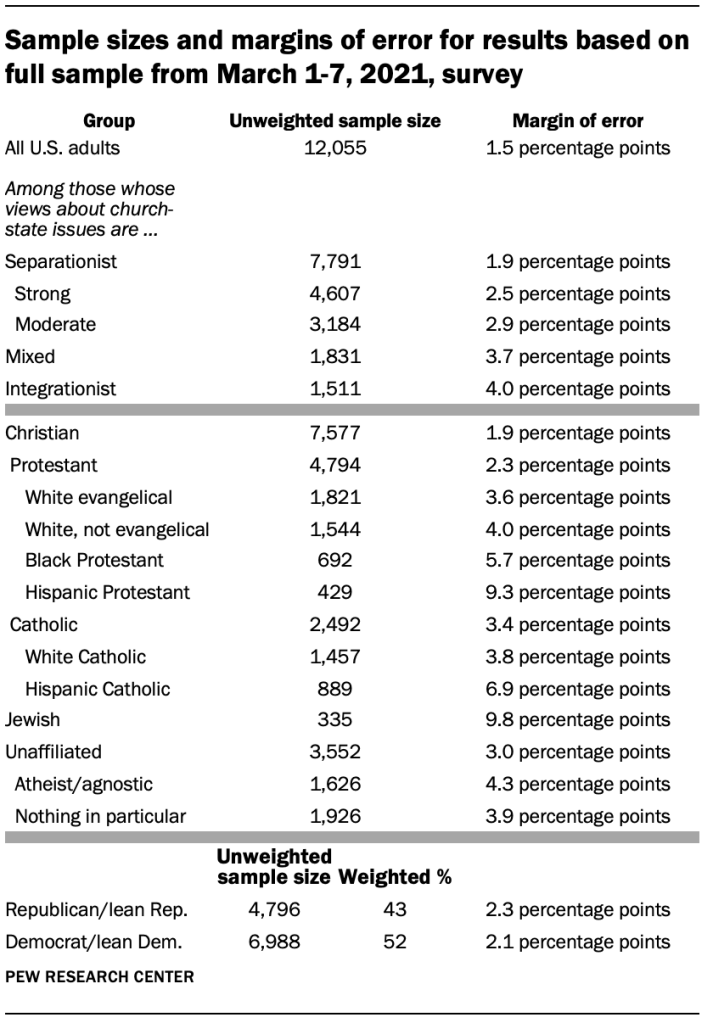
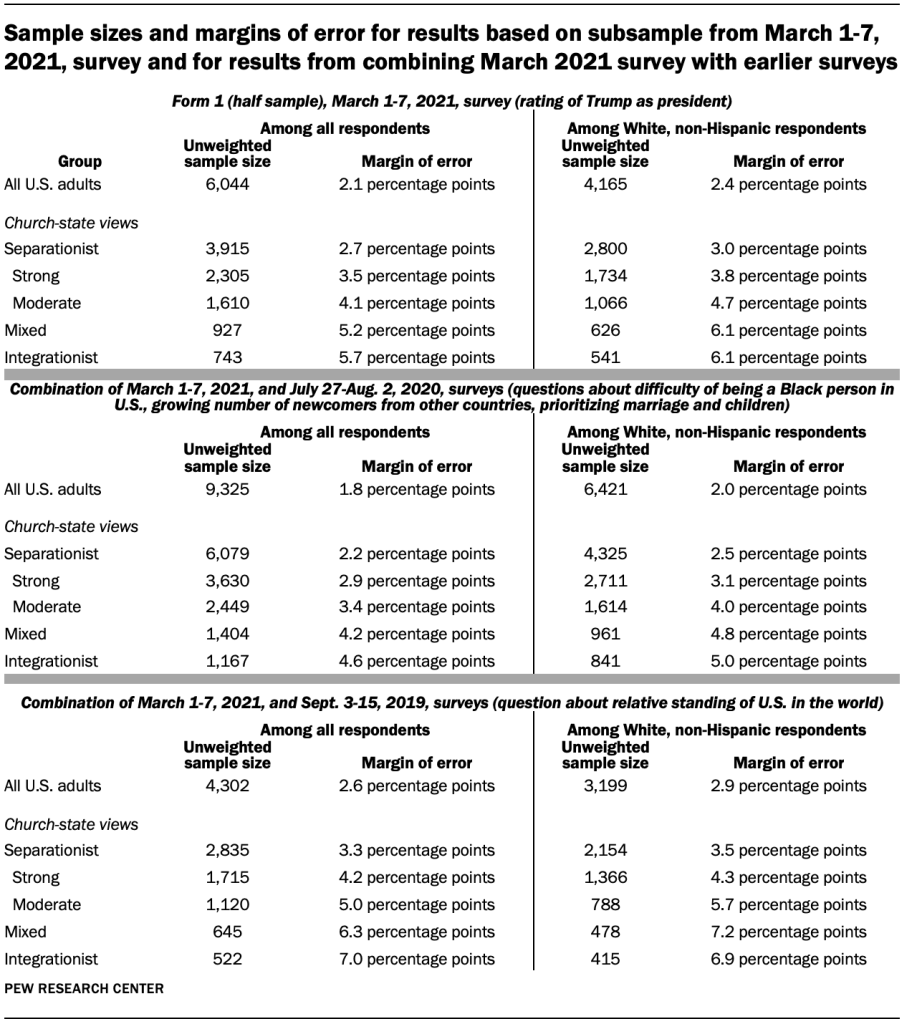
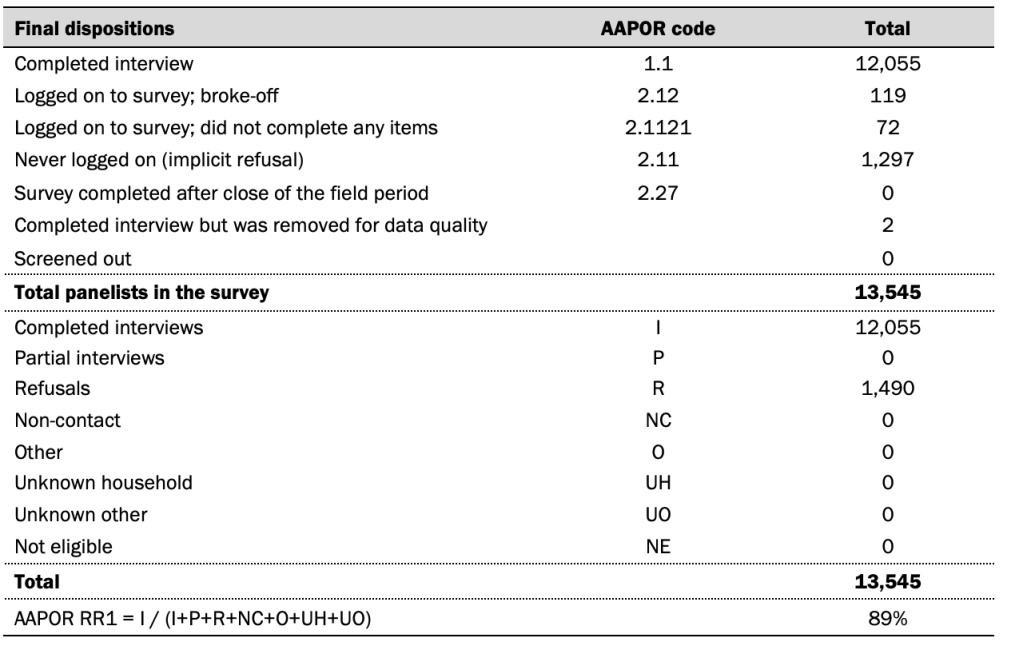
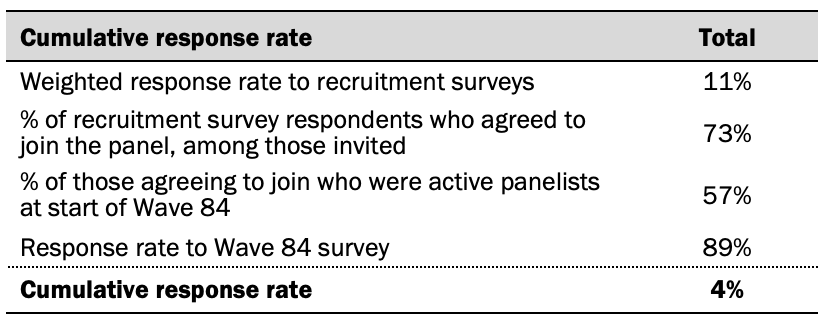
Pew Research Center conducted this survey to help gauge Americans’ views on the relationship between church and state. For this report, we surveyed 12,055 U.S. adults from March 1 to 7, 2021. All respondents to the survey are part of Pew Research Center’s American Trends Panel (ATP), an online survey panel that is recruited through national random sampling of residential addresses. This way nearly all U.S. adults have a chance of selection. The survey is weighted to be representative of the U.S. adult population by gender, race, ethnicity, partisan affiliation, education, religious affiliation and other categories. For more, see the ATP’s methodology and the methodology for this report.
The questions used in this report can be found here.

The First Amendment to the United States Constitution states that the country shall have no official religion. At the same time, Christians continue to make up a large majority of U.S. adults – despite some rapid decline in recent years – and historians, politicians and religious leaders continue to debate the role of religion in the founders’ vision and of Christianity in the nation’s identity.
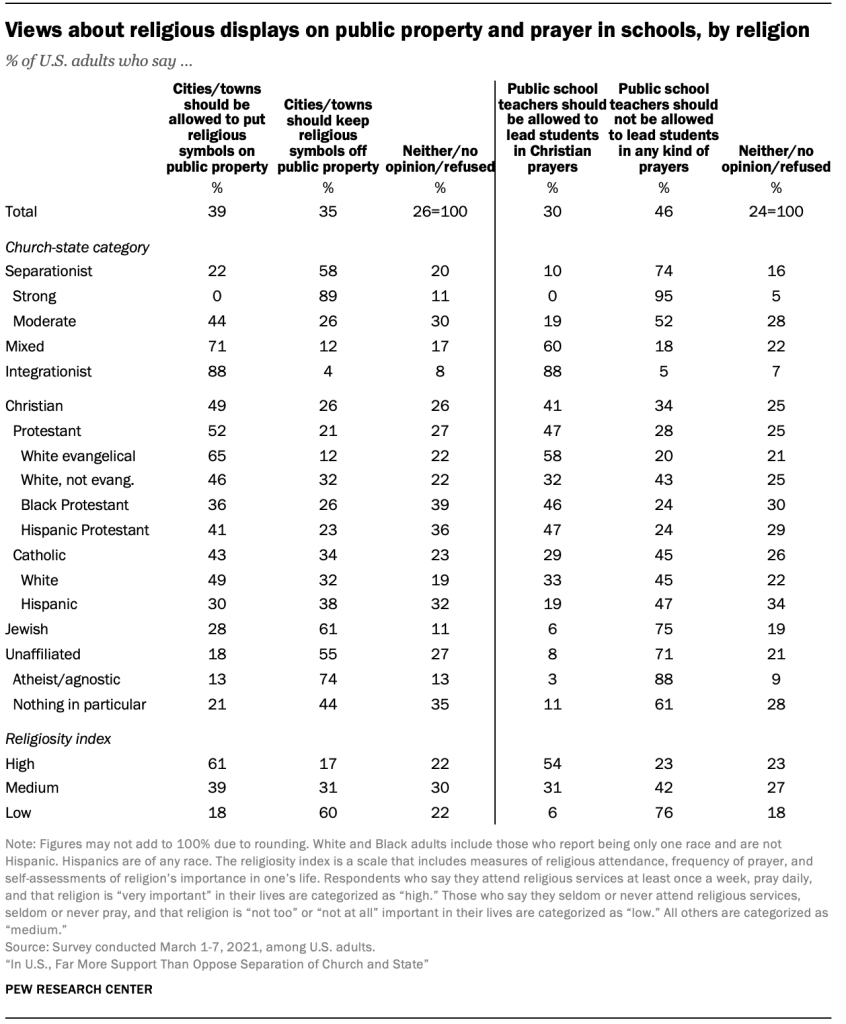
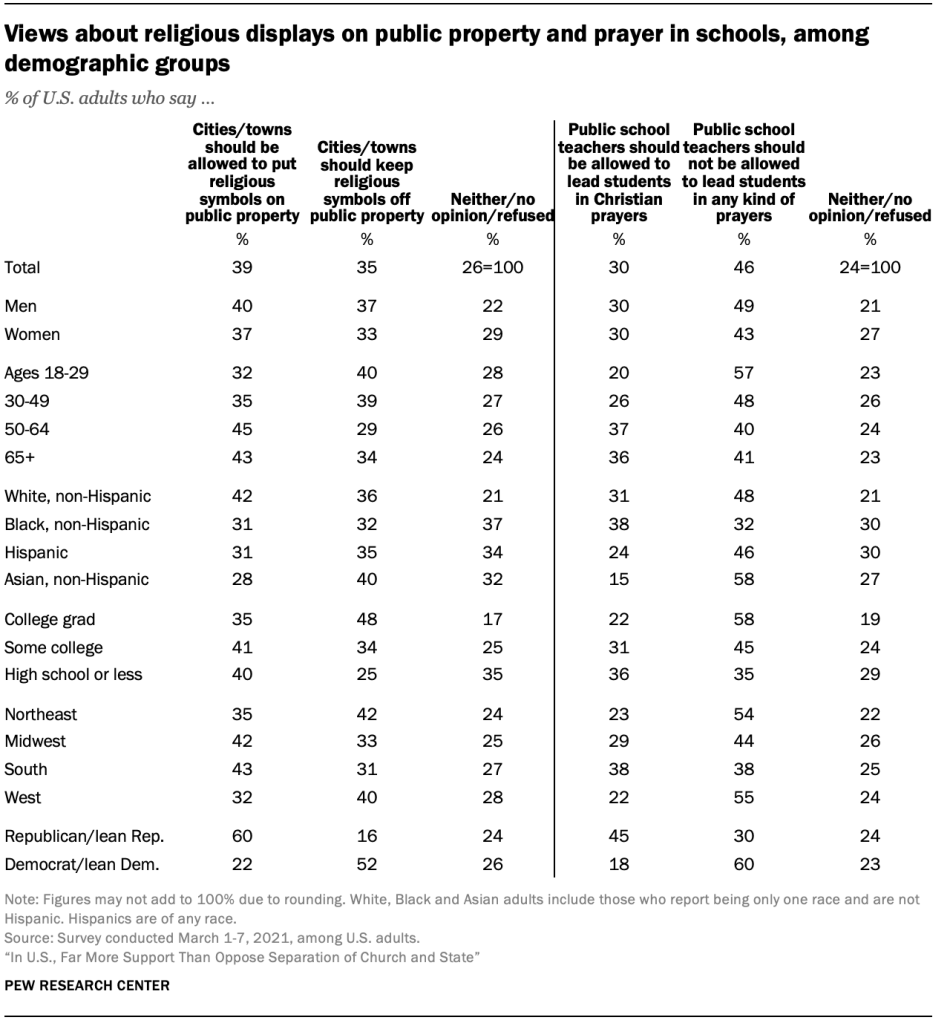
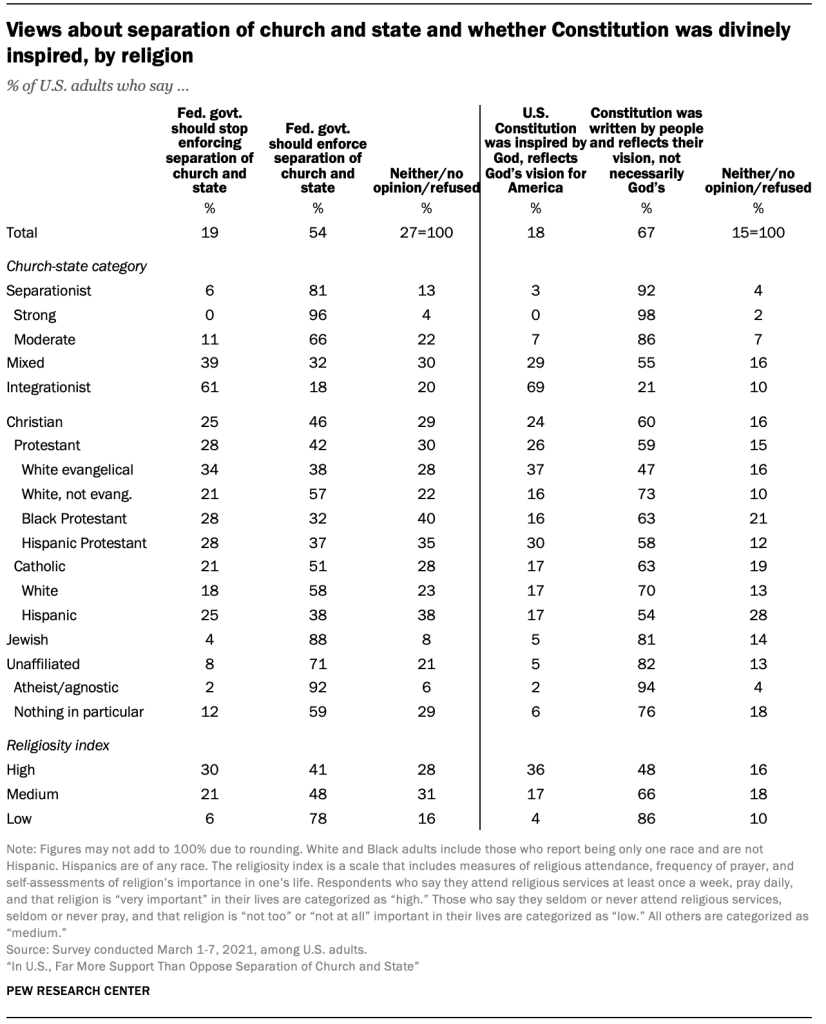
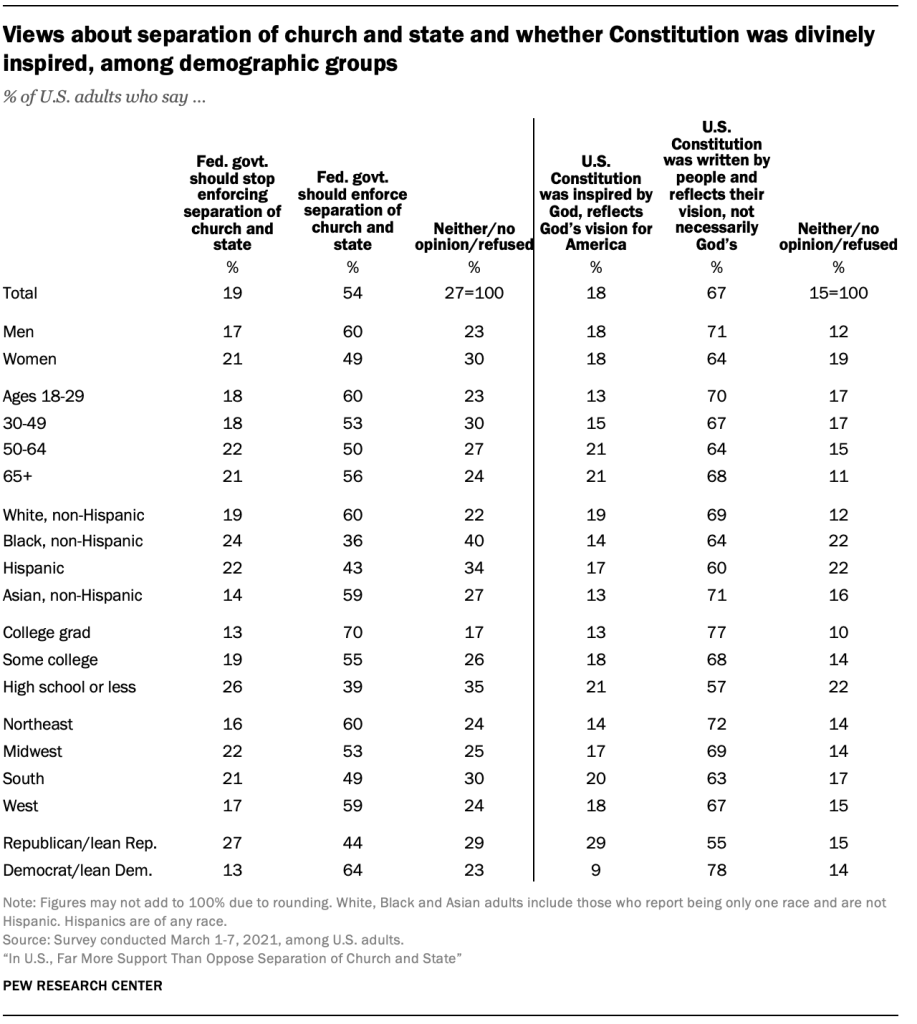
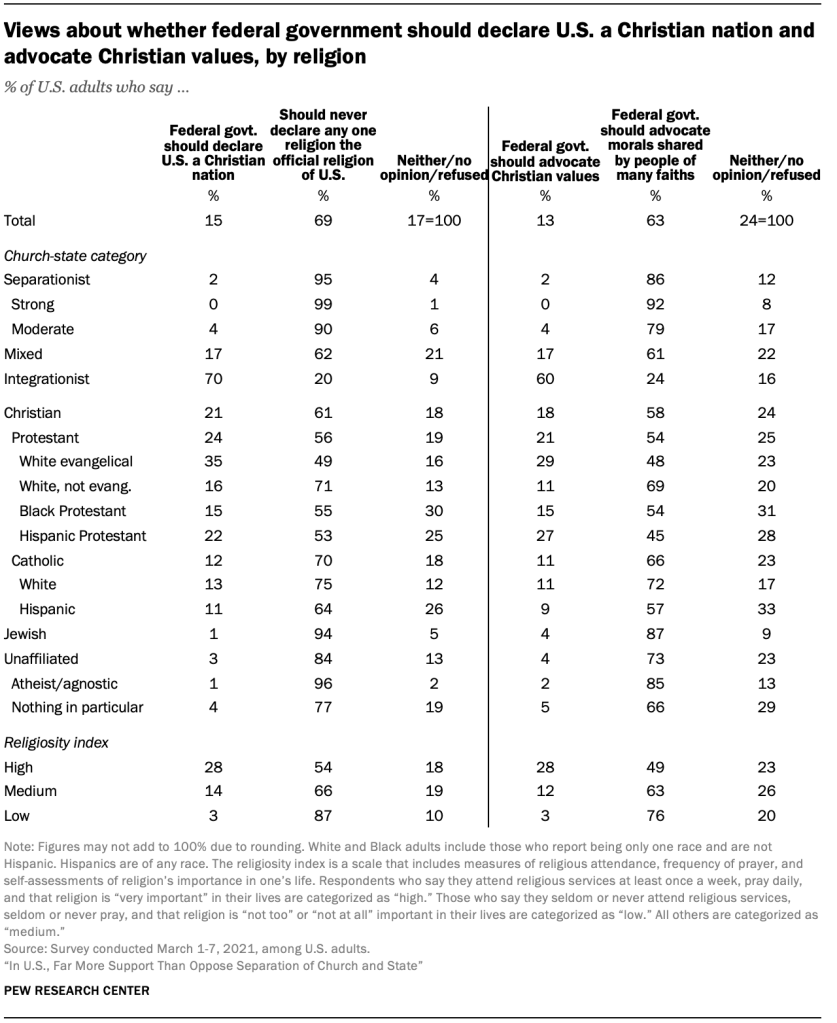
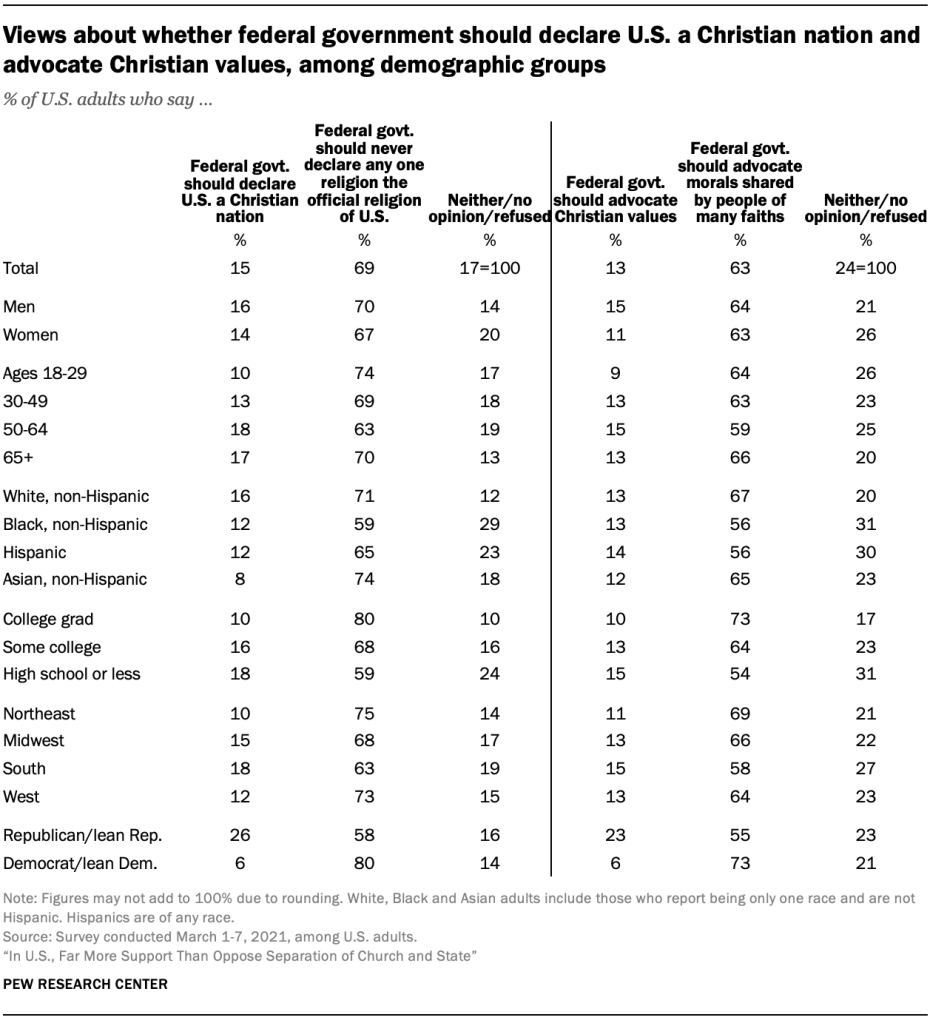
Some Americans clearly long for a more avowedly religious and explicitly Christian country, according to a March 2021 Pew Research Center survey. For instance, three-in-ten say public school teachers should be allowed to lead students in Christian prayers, a practice that the Supreme Court has ruled unconstitutional. Roughly one-in-five say that the federal government should stop enforcing the separation of church and state (19%) and that the U.S. Constitution was inspired by God (18%). And 15% go as far as to say the federal government should declare the U.S. a Christian nation.
On the other hand, however, the clear majority of Americans do not accept these views. For example, two-thirds of U.S. adults (67%) say the Constitution was written by humans and reflects their vision, not necessarily God’s vision. And a similar share (69%) says the government should never declare any official religion. (Respondents were offered the opportunity to reply “neither/no opinion” in response to each question, and substantial shares chose this option or declined to answer in response to all of these questions, suggesting some ambivalence among a segment of the population.)
Perhaps not surprisingly, the survey finds that Christians are much more likely than Jewish or religiously unaffiliated Americans to express support for the integration of church and state, with White evangelical Protestants foremost among Christian subgroups in this area. In addition, Christians who are highly religious are especially likely to say, for example, that the Constitution was inspired by God. But even among White evangelical Protestants and highly religious Christians, fewer than half say the U.S. should abandon its adherence to the separation of church and state (34% and 31%, respectively) or declare the country a Christian nation (35% and 29%).

Politics also is a major factor. Republicans and those who lean toward the Republican Party are far more likely than Democrats and Democratic leaners to want to secure an official place for Christianity in the national identity. However, for the most part, Republicans do not directly voice a preference for the integration of church and state. For instance, 58% of Republicans and Republican leaners say the federal government should never declare any religion as the official religion of the United States, while a quarter of Republicans (26%) say that the government should declare the U.S. a Christian nation. By comparison, among Democrats and those who lean toward the Democratic Party, 80% say the government should never declare any official religion, and just 6% want the government to declare the U.S. a Christian nation.

While the above-average level of support for an overtly Christian government among Republicans and White evangelical Protestants may come as no surprise to close observers of American politics, some of the other patterns in the survey are perhaps more unexpected. For example, many Black and Hispanic Americans – groups that are heavily Democratic – are highly religious Christians, and on several of the questions in the survey, they are just as likely as White Americans, if not more likely, to say they see a special link between Christianity and America.
Nearly four-in-ten Black Americans (38%) say public school teachers should be allowed to lead students in Christian prayers, somewhat higher than the 31% of White Americans who say this. And about one-in-five U.S. Hispanics (22%) say the federal government should stop enforcing the separation of church and state, roughly on par with the 19% of White Americans who say this.

These are among the key findings of a Pew Research Center survey conducted March 1-7, 2021, among 12,055 U.S. adults on the Center’s online, nationally representative American Trends Panel (ATP). These questions about the relationship between church and state can be combined into a scale that sorts respondents into one of four categories – “Church-state integrationists” (who say they would favor the intermingling of religion with government and public life); “church-state separationists” (who favor a wall of separation between religion and state); those who express “mixed” views about these matters; and those who largely express no opinion. When the questions are scaled together this way, they show there is far more support for church-state separation than for church-state integration in the U.S. public at large.
How categories on church-state separation scale were defined
First, all respondents who said “neither/no opinion” or refused to answer in response to four or more of the six items are placed in the “no opinion” category.
Next, all remaining respondents are sorted into one of three categories – “church-state integrationists,” “church-state separationists,” and “mixed.” Those who offered four or more church-state integrationist answers (e.g., “Cities and towns in the U.S. should be allowed to place religious symbols on public property” or “The federal government should stop enforcing separation of church and state”) are placed in the “church-state integrationists” category. Those who offered three church-state integrationist answers also are placed in this category if they offered only one or zero church-state separationist answers.
Those who offered four or more church-state separationist answers (e.g., “Cities and towns in the U.S. should keep religious symbols off public property” or “The federal government should enforce separation of church and state”) are placed in the “church-state separationist” category. Those who offered three church-state separationist answers also are placed in this category if they offered only one or zero church-state integrationist answers.
Respondents who offered three of one kind of answer and at least two of the other kind are placed in the “mixed” category, as are those who offered two of one kind of answer and two or one of the other kind of answer.
Finally, because it is so large, the “church-state separationist” category is sometimes divided into two groups in this report. “Strong” church-state separationists are those who give five or six church-state separationist responses and zero church-state integrationist responses. All other respondents in the larger “church-state separationist” category are classified as “moderate” separationists.
See Methodology for additional details.

Overall, more than half of U.S. adults (55%) express clear support for the principle of separation of church and state when measured this way. This includes 28% who express a strong church-state separationist perspective (they prefer the church-state separationist view in five or six of the scale’s questions and the church-state integrationist position in none) and an additional 27% who express more moderate support for the church-state separationist perspective. By contrast, roughly one-in-seven U.S. adults (14%) express support for a “church-state integrationist” perspective as measured by the survey.
Slightly fewer than one-in-five U.S. adults (18%) have mixed views – expressing support for church-state separation on some of the survey’s questions and support for increased church-state integration on about as many. And one-in-eight offer no opinion on a majority of these questions.
The survey shows, furthermore, that even in the groups that tend to express the most support for the intermingling of church and state, the “church-state integrationist” perspective is the exception, not the norm. Among White evangelical Protestants, for example, fewer than half (36%) express consistent support for a church-state integrationist perspective, although this is larger than the share of White evangelicals who favor the separation of church and state (26%). An additional 28% have mixed views.
Hispanic Protestants (26%) are among the other groups whose sympathy for church-state integration is higher than average. By contrast, a desire for church-state integration is almost nonexistent among U.S. Jews (1%) and the religiously unaffiliated (2%), who consist of those describing their religious identity as atheist, agnostic or “nothing in particular.” Among self-identified atheists and agnostics, fully 96% fall into the church-state separationist category.
Most Democrats and those who lean toward the Democratic Party (72%) prefer church-state separation, compared with 38% of Republicans – although even Republicans are more likely to express this view than to consistently favor the integration of church and state (25%).

The survey finds support for church-state integration is slightly higher among White respondents (16%) than among Hispanic Americans (11%). But at the same time, White people also are most likely to voice support for church-state separation, whereas Hispanic and Black Americans are more inclined than White adults to express no opinion on these questions. The survey finds little difference on these questions between U.S.-born adults and those born outside the U.S.
Support for separation of church and state is slightly higher among men than women; women are more likely than men to be in the “no opinion” category. College graduates are far more supportive of church-state separation than are those with lower levels of education. Similarly, young adults (ages 18 to 29) are more likely than their elders to consistently favor the separation of church and state.
Support for separation of church and state is lower in the South than in other parts of the country. Still, even in the South, fewer than one-in-five people consistently express a desire for the integration of church and state.

A closer look at the church-state scale
What, specifically, do people in each category desire in terms of the relationship between church and state? On each of the six scale items, majorities of those in the church-state integrationist category express support for the intermingling of religion and government, ranging from 60% who say the federal government should advocate Christian religious values to 88% who favor allowing towns to exhibit religious displays and public school teachers to lead Christian prayers. By contrast, most church-state separationists take the opposite position on all six questions, ranging from 58% who say religious displays should be kept off public property to 95% who say the federal government should never declare any official religion. These patterns are unsurprising, given the criteria for the categories.
But those in the “mixed” category are perhaps more interesting. Most people in this group say they think religious displays should be permitted on public property (71%) and are comfortable with public school teachers leading Christian prayers (60%). But far fewer think the government should stop enforcing separation of church and state (39%) or that the U.S. Constitution was divinely inspired (29%). And clear majorities say the federal government should never declare an official religion (62%) and should advocate moral values shared by many faiths (61%) rather than Christian values.

Church-state views, or White Christian nationalism?
The questions in the new survey gauging American attitudes on church-state issues are similar (but not identical) to questions used by other scholars to measure what they call “Christian nationalism.”1 Research on Christian nationalism shows that it is correlated with attitudes about race, immigration, gender roles, the place of the U.S. in the world, and much more.
The new survey also finds a clear connection between views on church-state issues and attitudes on many other social and political topics, including matters of race and immigration. Most people who support separation of church and state are Democrats or lean toward the Democratic Party, think Donald Trump was a “poor” or “terrible” president, say immigrants strengthen American society, and reject the notion that society is better off if people prioritize getting married and having children. More than half of people with a church-state separationist perspective say it is “a lot” more difficult to be a Black person than a White person in the U.S., and that while the U.S. is one of the greatest countries in the world, there are other countries that are also great.
By comparison, people who favor church-state integration are mostly Republicans and Republican leaners, think Trump was a “good” or “great” president, say the growing numbers of immigrants in the U.S. threaten traditional American values, and feel that society would be better off if more people prioritized getting married and having children. Church-state integrationists are far more inclined than church-state separationists to say that it is “no more difficult” to be Black than White in American society (42% vs. 13%), and that the U.S. “stands above” all other countries (40% vs. 15%).
These are just a few examples of the connection between church-state views and attitudes about social and political issues. Similar correlations exist between church-state views and responses to many other questions about race, immigration, gender, and the place of the U.S. in the world.

The data shows, furthermore, that these connections are at least as pronounced – if not more so – among White Americans as among the public as a whole. White adults with church-state integrationist views are much more likely than White church-state separationists to say Trump was a good or great president (by a margin of 59 percentage points), to identify with or lean toward the Republican Party (by 54 points), to say that immigrants threaten traditional American customs and values (47 points), and to say that society is better when people prioritize getting married and having children (42 points). They also are 35 points more likely to say that being Black is no more difficult than being White in the U.S. today, and 32 points more likely to say the U.S. has a unique place above all other countries in the world.
These results are consistent with much of the existing research on Christian nationalism, which demonstrates that among White people, Christian nationalism is linked with support for the Republican Party, enthusiasm for Trump, hostility toward immigrants and denial that racism is pervasive or systemic in America. But the survey also shows that White church-state integrationists are far from alone in their attitudes on these matters. Indeed, majorities of White people with “mixed” church-state views, as well as of those with a “moderate” church-state separationist perspective, also identify with or lean toward the Republican Party and view Trump as an average or better-than-average president. And majorities of White adults in all three categories (church-state integrationists, moderate church-state separationists, and holders of mixed views on church-state questions) reject the idea that being a Black person is a lot more difficult than being a White person in the U.S. today.
In fact, strong church-state separationists are the only group of White respondents who are mostly Democrats, who mostly think Trump was a below average president, and among whom a majority say being a Black person in the U.S. today is a lot more difficult than being a White person. In other words, to the extent that church-state views are connected with other social and political attitudes among White respondents, those with the strongest church-state separationist viewpoint are in some ways more distinctive from other White people than are those with church-state integrationist views.

A closer look at those with ‘no opinion’ on church-state matters

Roughly one-in-eight survey respondents (12% of all U.S. adults) are categorized as having “no opinion” on the church-state scale, because they say “neither/no opinion” or refuse to answer four (39%), five (30%) or all six (31%) of the questions used to create the scale. This means the size of the “no opinion” group is close to the size of the “church-state integrationist” group (12% and 14%, respectively).
So, who are the respondents in the “no opinion” category? Are they really church-state integrationists but reluctant to express that point of view in response to these questions? Are they church-state separationists who are hesitant to share that opinion? Or are they people who are genuinely uncertain about, unfamiliar with or uninterested in church-state issues?
Of course, the survey cannot provide a direct answer because, by definition, these respondents did not express a point of view – one way or the other – on the church-state questions. However, those in the “no opinion” category are distinctive in certain ways. Perhaps most obviously, they are far less likely than the full sample of respondents to be college graduates (15% vs. 33%), and far more likely to have a high school education or less (56% vs. 36%). This is expected, since past research on patterns of survey response has revealed that people with lower levels of educational attainment are more inclined than those with higher levels of education to express no opinion on many kinds of survey questions. Indeed, in addition to the questions about church-state issues, the survey included 36 other questions that were asked of the full sample of respondents; those in the “no opinion” category decline to provide a substantive response to 3.9 of the 36 questions, on average, compared with 1.6 questions left with no substantive response by respondents in other categories, on average.
Compared with the full sample of respondents, those with “no opinion” on the church-state scale also are less likely to be White, non-Hispanic adults, and more likely to be Black or Hispanic. People in the “no opinion” category also are a bit more likely to be under age 65 than are the full sample of respondents.
In terms of their political and religious profile, there is little evidence to suggest that the “no opinion” category harbors a disproportionate share of either “church-state integrationists” or “church-state separationists.” Compared with the full sample of respondents, those in the “no opinion” group are more likely than the full sample to identify as political independents or with a third party and to decline to lean toward either major party (15% vs. 5%), and also to describe themselves as ideological moderates (50% vs. 38%). The religious profile of those in the “no opinion” group closely resembles the religious profile of the full sample of respondents.
God’s favor for the U.S.

In addition to the six questions that make up the church-state issues scale, the survey included a question that asked Americans which of two statements comes closer to their own view: “God favors the United States over all other countries,” or “God does not favor any one country over all the others.”
Overall, seven-in-ten U.S. adults choose the latter option: God does not favor any one country. Just 5% of U.S. adults say they think God favors the U.S. over all other countries, while 25% say neither, express no opinion or decline to answer.2
The accompanying detailed tables provide additional information about how social and demographic groups answered the questions about church-state issues.