Pew Research Center

FOR RELEASE SEPTEMBER 21, 2021

Religious Composition of India

All religious groups in India show major declines in fertility rates, limiting change in the country’s religious composition over time

BY Stephanie Kramer

FOR MEDIA OR OTHER INQUIRIES:

Communications Department
202.419.4372
www.pewresearch.org

RECOMMENDED CITATION

Pew Research Center, September 2021, "Religious Composition of India"

About Pew Research Center

Pew Research Center is a nonpartisan, nonadvocacy fact tank that informs the public about the issues, attitudes and trends shaping the world. It does not take policy positions. The Center conducts public opinion polling, demographic research, computational social science research and other data-driven research. It studies politics and policy; news habits and media; the internet and technology; religion; race and ethnicity; international affairs; social, demographic and economic trends; science; research methodology and data science; and immigration and migration. Pew Research Center is a subsidiary of The Pew Charitable Trusts, its primary funder.

© Pew Research Center 2026

Table of contents

  • About Pew Research Center
  • Religious Composition of India
  • 1. Population growth and religious composition
  • 2. Causes of religious change
  • 3. Religious demography of Indian states and territories
  • Acknowledgments
  • Methodology

Religious Composition of India

All religious groups in India show major declines in fertility rates, limiting change in the country’s religious composition over time

How we did this

This Pew Research Center study describes the religious makeup of India’s population, how it changed between 1951 and 2011, and the main causes of the change. The analysis focuses on India’s three largest religious groups – Hindus, Muslims and Christians – and also covers Buddhists, Sikhs and Jains when suitable data is available.

Population sizes over time come from India’s decennial census. The census has collected detailed information on India’s inhabitants, including on religion, since 1881. Data on fertility and how it is related to factors like education levels and place of residence is from India’s National Family Health Survey (NFHS). The NFHS is a large, nationally representative household survey with more extensive information about childbearing than the census.

Data on migration is primarily from the United Nations Population Division. Survey responses about religious switching (or conversion) and interfaith marriage are from a Pew Research Center survey of 29,999 Indian adults conducted in late 2019 and early 2020.

References to Indian history, laws, border changes and survey delays are accurate as of Aug. 19, 2021.

For more information, see this report’s Methodology.

India’s fertility rate has been declining rapidly in recent decades. Today, the average Indian woman is expected to have 2.2 children in her lifetime, a fertility rate that is higher than rates in many economically advanced countries like the United States (1.6) but much lower than India’s in 1992 (3.4) or 1950 (5.9).1

Every religious group in the country has seen its fertility fall, including the majority Hindu population and Muslim, Christian, Sikh, Buddhist and Jain minority groups. Among Indian Muslims, for example, the total fertility rate has declined dramatically, from 4.4 children per woman in 1992 to 2.6 children in 2015, the most recent year for which religion data is available from India’s National Family Health Survey.

In India, fertility rates have fallen and religious gaps have shrunk

Muslims still have the highest fertility rate among India’s major religious groups, followed by Hindus at 2.1. Jains have the lowest fertility rate (1.2). The general pattern is largely the same as it was in 1992, when Muslims had the highest fertility rate at 4.4, followed by Hindus at 3.3. But the gaps in childbearing between India’s religious groups are generally much smaller than they used to be. For example, while Muslim women were expected to have an average of 1.1 more children than Hindu women in 1992, the gap had shrunk to 0.5 by 2015.

What do these trends mean for India’s religious composition? India’s Muslim population has grown somewhat faster than other religious groups because of fertility differences. But due in part to declining and converging fertility patterns, there have been only modest changes in the overall religious makeup of the population since 1951, when India conducted its first census as an independent nation.

Hindus still large majority in India, while the share of Muslims has gradually grown

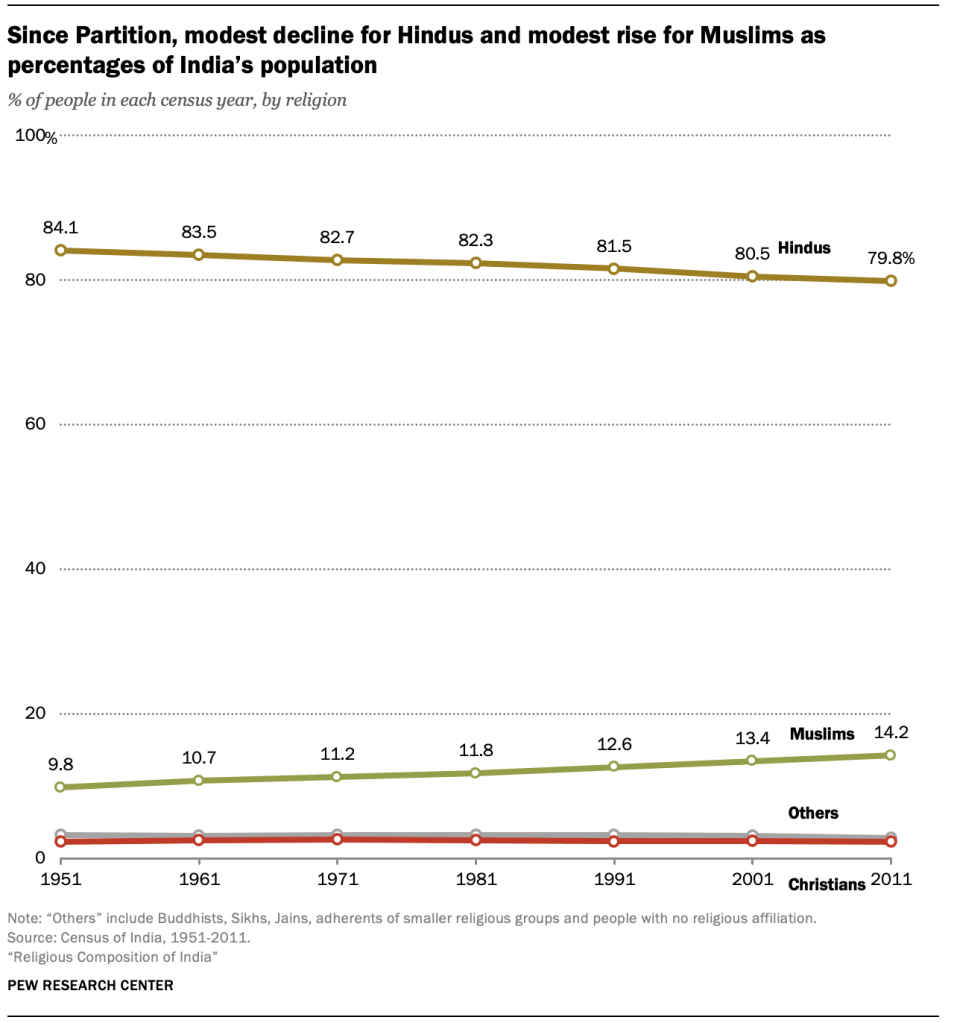
Hindus made up 79.8% of India’s 1.2 billion (120 crore) total inhabitants in the most recent census, conducted in 2011. That is 0.7 percentage points less than in the previous census in 2001, and 4.3 points below the 84.1% recorded in 1951. Meanwhile, the share of Muslims grew from 13.4% in 2001 to 14.2% in 2011 – up by a total of 4.4 percentage points since 1951, when the census found that Muslims comprised 9.8% of India’s population. Christians, Sikhs, Buddhists and Jains, who together make up nearly all of the remaining 6% of the population, were relatively stable in their shares since the 1951 census.2

Related India research

This is one in a series of Pew Research Center reports on India based on a survey of 29,999 Indian adults conducted Nov. 17, 2019, to March 23, 2020, as well as demographic data from the Indian Census and other government sources. Other reports can be found here:

  • Religion in India: Tolerance and Segregation
  • How Indians View Gender Roles in Families and Society
  • India’s Sex Ratio at Birth Begins To Normalize

Over the decades, population growth rates have slowed considerably – overall and among Muslims in particular. Before its steep fertility declines, India was on a trajectory that would have resulted in a much larger total population, as well as a greater change in the distribution of religious populations. (See discussion of growth rates in Chapter 1.)

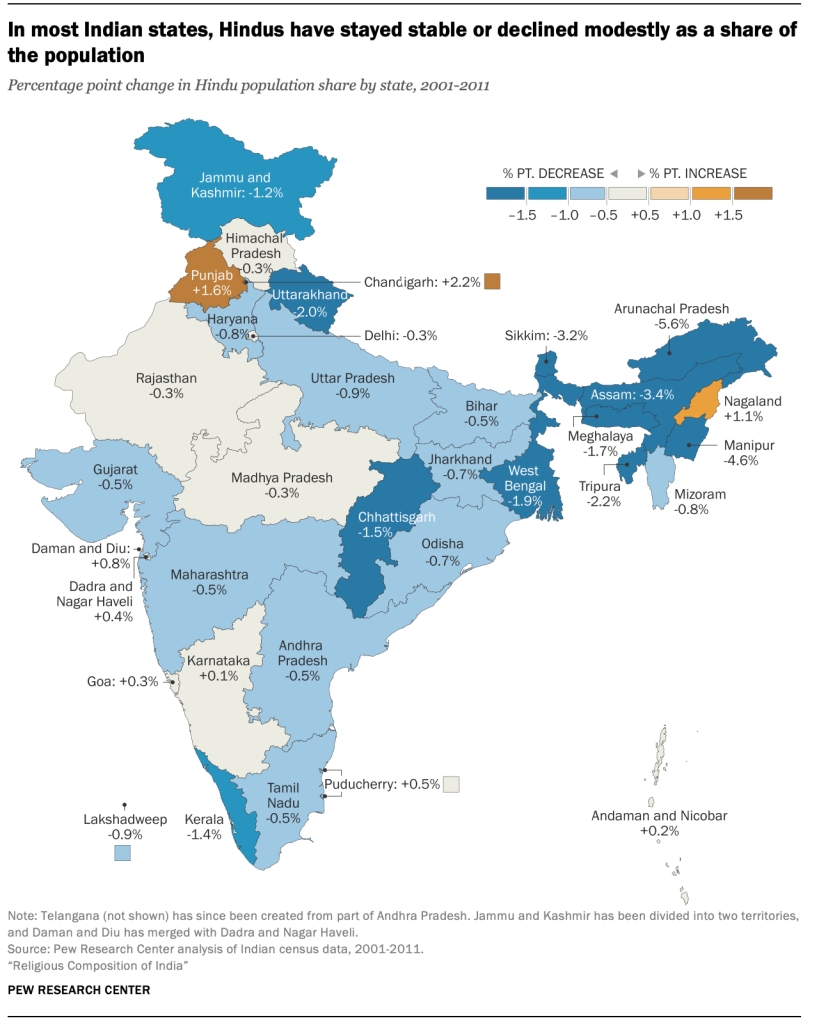
While changes at the national level have been modest, they have not been distributed evenly across India. Some states and union territories have experienced faster population growth or larger changes in religious composition than other states or the country as a whole. For example, the share of Hindus fell by nearly 6% in Arunachal Pradesh but rose by about 2% in Punjab between 2001 and 2011. (See Chapter 3 for more information on the religious demography of India’s states and territories.)

A note on large numbers

India uses a number system that differs from the international number system. This report presents numbers in the international system and, in parentheses, the Indian system. The Indian number system uses units such as lakhs and crores and places commas at different intervals than the international system. Some examples of equivalents:

International number system vs. Indian number system

One hundred thousand (100,000) = 1 lakh (1,00,000)
One million (1,000,000) = 10 lakh (10,00,000)
Ten million (10,000,000) = 1 crore (1,00,00,000)

These are among the key findings of a Pew Research Center demographic analysis of data from India’s census and other sources, designed to complement a major new public opinion survey, “Religion in India: Tolerance and Segregation,” published in June 2021. This analysis looks primarily at trends since India’s independence, which was accompanied by major changes in the country’s religious demographics. The Partition of 1947, at the end of Britain’s long colonial rule, divided the Indian subcontinent along religious lines, causing millions (tens of lakhs) of Muslims to move to the new nation of Pakistan. Meanwhile, millions (tens of lakhs) of Hindus and members of other religious groups migrated to the new India (see sidebar below).

Migration is one of three main mechanisms, along with fertility and conversion, that cause religious groups to shrink or expand. But since the 1950s, migration has had only a modest impact on India’s religious composition. More than 99% of people who live in India were also born in India. Migrants leaving India outnumber immigrants three-to-one, and religious minorities are more likely than Hindus to leave. Religious switching, or conversion – when an individual leaves one religion for another or stops affiliating with any religion – also appears to have had a relatively small impact on India’s overall composition, with 98% of Indian adults still identifying with the religion in which they were raised.

As a result, statistical analysis of census and survey data shows that fertility has been by far the biggest driver of the modest amount of religious change in the decades since Partition (see Chapter 2 for details).3

Religion is only one of many factors tied to fertility rates. While this report describes differences in the fertility patterns of major religious groups in India, it cannot measure the full impact of historical and cultural factors on these patterns, nor can it quantify the direct role that religion plays when it comes to fertility and family size.

In India and elsewhere, education is a primary factor in how many children women tend to have. Other prosperity indicators – such as life expectancy and average levels of wealth – also frequently correlate with fertility measures: Women who have better access to schooling, jobs and health care tend to have fewer children.

Population growth is driven not only by how many children women have, but also by the concentration of women of childbearing age. Younger populations have more women entering their prime childbearing years and, as a result, tend to grow faster than older populations.

In addition, where people live within India, as well as their history and cultural norms (which are harder to measure), play a role in the choices they make about family matters. In short, people’s religion alone does not determine how many children they will have. Religion is just part of a complicated picture.

Sidebar: India’s changing geography

India’s census provides data on the size of its religious groups going back to 1881. But it is a challenge to fully trace changes in the country’s religious composition because domestic and international borders have moved many times since then. Some large regions have become independent nations, while the shape and status of Indian states, princely states and union territories have often shifted.

Generally speaking, India’s external borders have been stable enough since the Partition of 1947 to allow comparisons of national-level figures since 1951. However, the internal lines between Indian states and territories have moved so often since the 1950s that reliable state-level comparisons are possible only for the 2001-2011 decade.

Partition of India

The most significant geographic change since the Indian census began was the Partition of 1947. In the final years of colonial rule, the British faced demands not only to cede independence to India but also to grant sovereignty to Muslim-majority regions in the subcontinent’s northwestern and northeastern corners. As a result, the Independence Act that formally ended British rule also created the country of Pakistan, which at the time encompassed modern-day Bangladesh. Britain did not anticipate the extent of population transfer and chaos that would follow Partition, while poor planning led to last-minute confusion that contributed to a large-scale humanitarian crisis.

Partition was tumultuous from the start. The date for Partition and Independence was moved up by 10 months without much notice, from June 1948 to August 1947. The committee tasked with defining the boundaries of India and Pakistan did not convene until July 1947 and published its decisions two days after Pakistan became independent. Before then, most people knew only that the division would be based on which religious group was in the majority in a given place.

As Muslims migrated to the newly independent Pakistan, Hindus and others migrated to newly independent India. By the end of 1947, approximately 15 million (1.5 crore) people were displaced amid widespread rioting and violence, creating one of the biggest refugee crises in history. By some estimates, more than a million (10 lakh) people died.

States and territories

India’s external and internal borders continued to change after Partition. One way or another, a majority of the 28 states and eight union territories that existed at the writing of this report have gained their current status since the landmark census of 1951.

Given India’s large size, external boundary changes that took place after Partition have not made much difference in the country’s religious demography, even counting the incorporation of small regions such as Goa, which has a significant Christian population. Some external borders changed as Portugal and France – which continued to hold territory for several years after the rest of India became independent – withdrew from the region. Portuguese-held Goa, on the western coast, was seized by India in 1961 and has been included in India’s census since 1971, initially as a union territory and later as a state. Puducherry (formerly held by the French), largely on India’s southeastern coast, became a union territory of India in 1962. In 1975, the people of Sikkim, then an independent country bordering China, voted to make Sikkim India’s 22nd state.

On the other hand, India’s internal borders have been in continual flux since independence, leading to frequent changes in religious composition within states. A dozen new states have been established in the past 50 years alone: Telangana, India’s newest state, was created in 2014. Jammu and Kashmir, formerly a unified state, was reorganized into two union territories in 2019. However, there were no impactful internal border changes between the censuses of 2001 and 2011, the period examined at the state level in this report. During that decade, India had a total of 35 states and union territories.
1. Population growth and religious composition

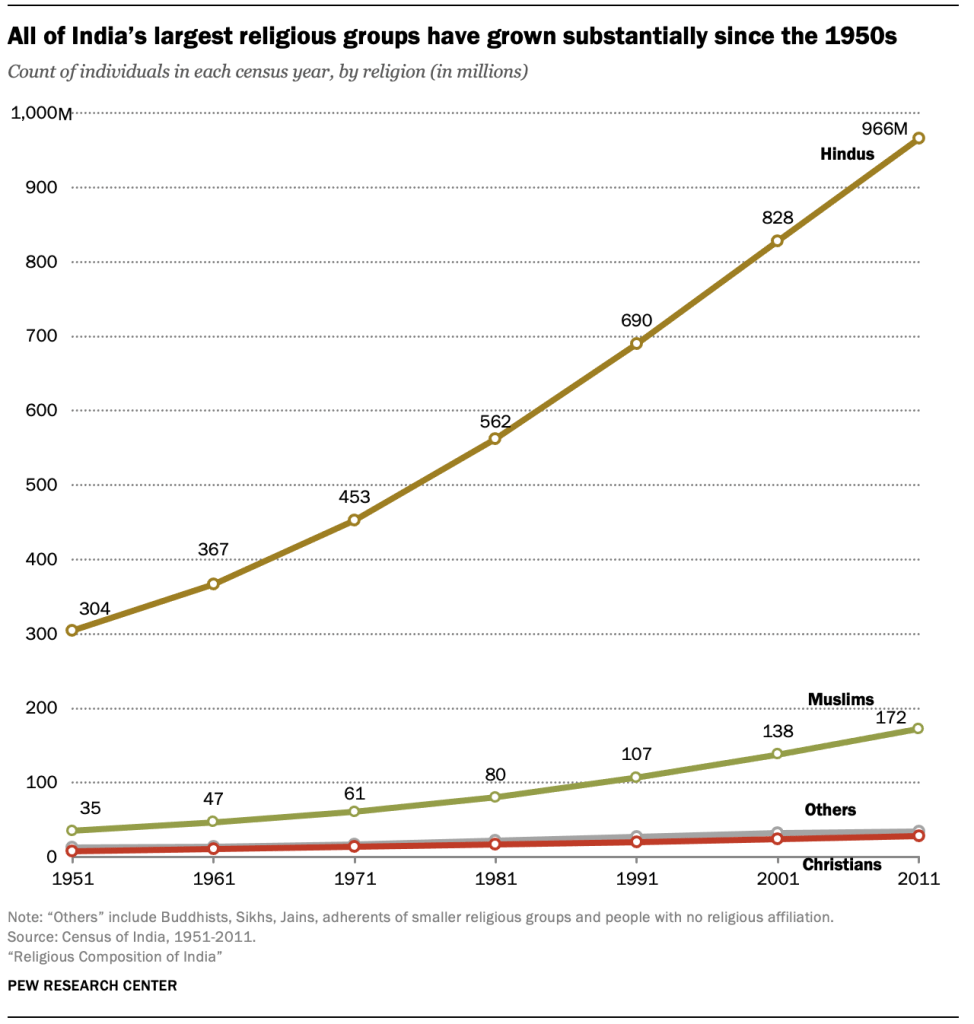
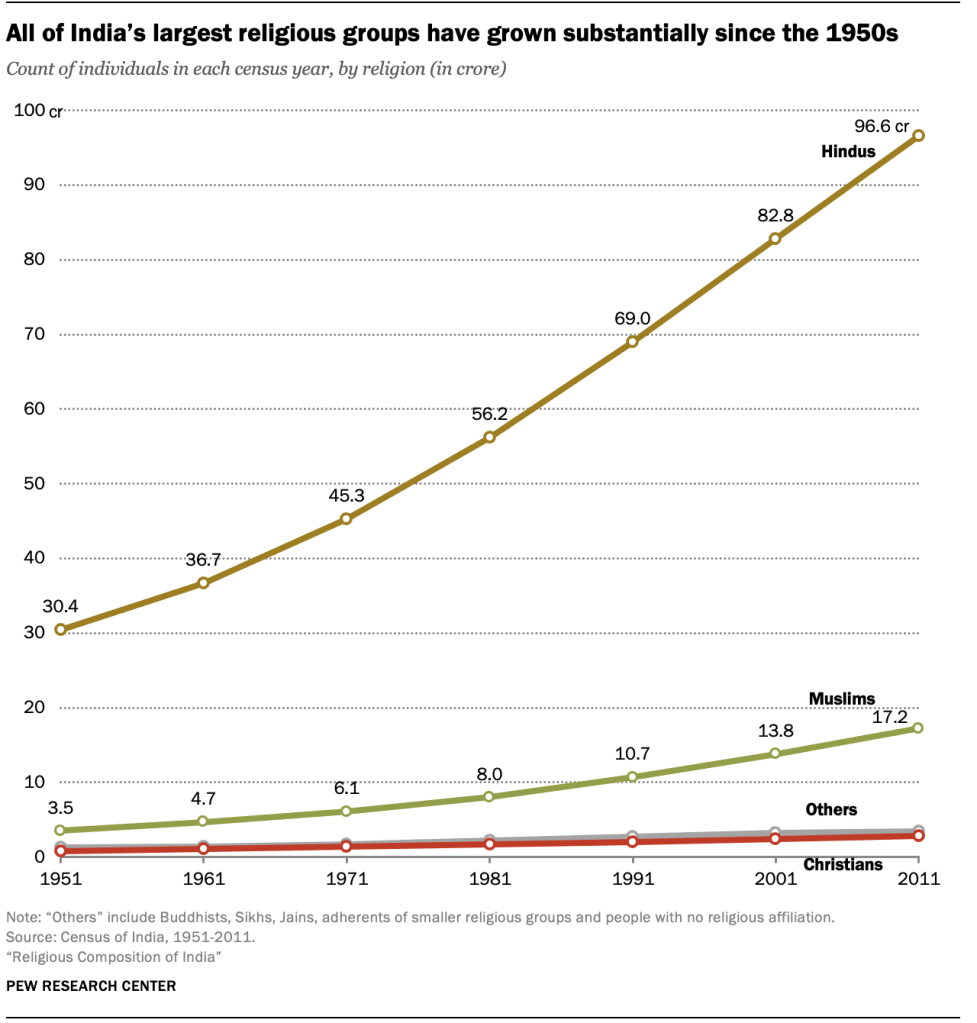
India’s population has more than tripled in the six decades following Partition, from 361 million (36.1 crore) people in the 1951 census to more than 1.2 billion (120 crore) in 2011. As of 2020, India gains roughly 1 million (10 lakh) inhabitants each month, putting it on course to surpass China as the world’s most populous country by 2030, according to the United Nations Population Division.

A note on large numbers

India uses a number system that differs from the international number system. This report presents numbers in the international system and, in parentheses, the Indian system. The Indian number system uses units such as lakhs and crores and places commas at different intervals than the international system. Some examples of equivalents:

International number system vs. Indian number system

One hundred thousand (100,000) = 1 lakh (1,00,000) One million (1,000,000) = 10 lakh (10,00,000) Ten million (10,000,000) = 1 crore (1,00,00,000)

All of India’s largest religious groups have grown substantially since the 1950s

However, there is some evidence that Christians may be undercounted. People who indicate that they are Christian on the census are not able to also identify as belonging to Scheduled Castes (historically known as Dalits, or by the pejorative term “untouchables”). Members of Scheduled Castes are eligible for government benefits, reportedly prompting some people in that category to identify as Hindu when completing official forms such as the census.4 In the 2015 National Family Health Survey – a large, high-quality household survey that does not exclude Christians from Scheduled Castes – 21% of Christians interviewed said that they belonged to Scheduled Castes.

A brief overview of India’s caste system

In India, castes are hereditary social classes. Historically, the caste someone was born into permanently determined their status in the social hierarchy, along with their available social circle and what careers they could pursue.

Three-quarters of Indians belong to a historically disadvantaged class

In an effort to reduce disadvantages caused by caste, the government has affirmative action programs known as “reservations.” India’s constitution reserves 15% of government jobs and seats in institutions of higher education for people identified as belonging to Scheduled Castes, 7.5% for those who belong to Scheduled Tribes and 27% for those of “Other Backward Classes” (OBCs).

Scheduled Castes, also known as Dalits (or by the pejorative term “untouchables”), are made up of groups who were traditionally ostracized and relegated to “polluting” occupations like fishing, scavenging and sewer cleaning. Scheduled Tribes are Indigenous peoples. People belonging to OBCs inherited other social class identities that have been socially and educationally disadvantaged.

Under the constitution, Muslims and Christians are not eligible for most of the caste-based reservations available to Hindus and others. This issue is controversial. Proponents of changing the law to allow greater access to benefits point out that excluding these groups from programs intended to lift disadvantaged people out of poverty contributes to inequalities along religious lines, essentially preserving the caste system for some people. But supporters of the current system highlight these groups’ eligibility to receive reservations based on OBC status, as well as benefits under anti-poverty programs for religious minorities.

According to the National Family Health Survey, most Indian households (75%) belong to a caste category that is eligible for government reservations, but this varies widely by religious affiliation, ranging from 15% of Jains to 98% of Buddhists. About three-quarters (76%) of Christians belong to a historically disadvantaged caste, including 21% who say they are members of a Scheduled Caste. However, on the Indian census, Christians are not able to identify as members of a Scheduled Caste, which may lead to an undercount of Christians in the census.

In the same survey, smaller shares of Muslims identified as belonging to a Scheduled Caste or Tribe, but over half said they were members of OBCs.

India’s population boom in the 20th century coincided with an economic transformation that brought major improvements in life expectancy, living standards and food production. But there is a consensus among experts that India’s economic development has been hindered in part by the strains that population growth has put on schools, health care and natural resources. Since the 1950s, Indian governments have worked with international agencies to promote a range of birth control methods, from contraceptives to forced sterilizations. Today, some states and territories discourage large families with penalties, such as barring parents with more than two children from receiving social services or holding political office. In 2017, India’s Ministry of Health and Welfare launched a comprehensive family planning program with the goal of bringing fertility down to replacement levels by 2025 by improving health care facilities, access to contraceptives and reproductive health education, particularly in areas with relatively high fertility rates.5

India’s population growth has slowed, especially since the 1990s

In part as a result of such measures, population expansion has slowed, particularly since the 1990s. After surging by nearly 25% in the 1960s and again in the 1970s, growth in the 2001-2011 census decade fell below 20%.

Growth rates have declined for all of India’s major religious groups, but the slowdown has been more pronounced among religious minorities, who outpaced Hindus in earlier decades. Between 1951 and 1961, the Muslim population expanded by 32.7%, 11 percentage points more than India’s overall rate of 21.6%. But this gap has narrowed. From 2001 to 2011, the difference in growth between Muslims (24.7%) and Indians overall (17.7%) was 7 percentage points. India’s Christian population grew at the slowest pace of the three largest groups in the most recent census decade – gaining 15.7% between 2001 and 2011, a far lower growth rate than the one recorded in the decade following Partition (29.0%).

In absolute numbers, all of the country’s largest religious groups are still gaining millions (tens of lakhs) of adherents. In the most recent decade between censuses, Hindus added 138 million (13.8 crore) people, while Muslims grew by 34 million (3.4 crore). India’s total population increased by nearly 200 million (2o crore) in that time, from about 1 billion (100 crore) in 2001 to 1.2 billion (120 crore) in 2011.

According to a 2015 Pew Research Center study, about 94% of the world’s Hindus now live in India, which along with Nepal is one of only two countries with a Hindu majority. India is also home to one of the world’s largest Muslim populations, surpassed only by Indonesia, which had 209 million (20.9 crore) Muslims in 2010. Pakistan’s Muslim population is roughly the same size as India’s. Bangladesh follows in fourth place, with 134 million (13.4 crore) Muslims. (Modern-day Bangladesh was part of Pakistan at the time of Partition but seceded in the 1970s.) Pakistan and Bangladesh are both overwhelmingly Muslim, but the overall populations of these countries are much smaller than India’s.

Since Partition, modest decline for Hindus and modest rise for Muslims as percentages of India’s population

India’s religious composition largely stable since Partition

In percentage terms, India’s six largest religious groups have remained relatively stable since Partition. The greatest shift has been a modest rise in the share of Muslims, accompanied by a corresponding decline in the share of Hindus. Between 1951 and 2011, Muslims grew by 4.4 percentage points to 14.2% of the population, while Hindus declined by 4.3 points to 79.8%.

Christians have made up between 2% and 3% of India’s population in every census since 1951. Although there are concerns that Christians may be undercounted, it is difficult to determine the extent of such an undercount and how it may be changing over time.6

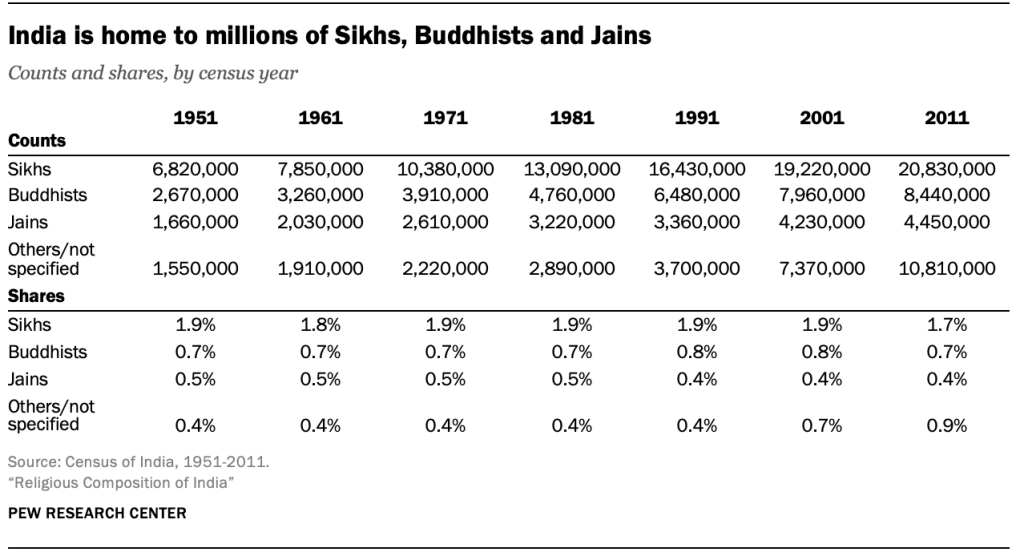
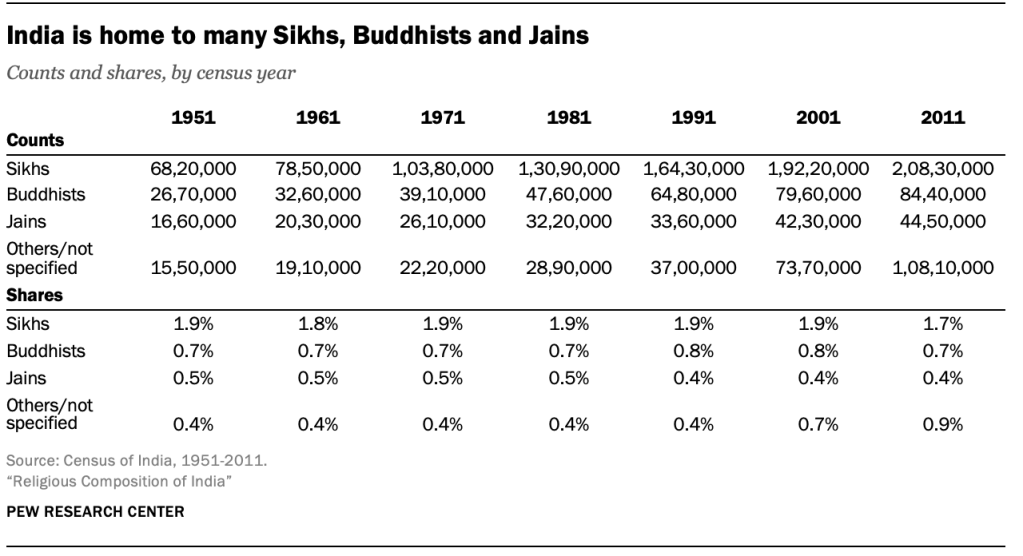
The 3% of Indians who identify with religions other than Hinduism, Islam or Christianity have grown to represent tens of millions (crores) of people in the decades since independence. Sikhs, India’s fourth-largest religious group, have increased from 7 million (70 lakh) adherents in 1951 to nearly 21 million (2.1 crore) in 2011, while remaining a consistent share of India’s population (just under 2%). Buddhists and Jains show a similar pattern – their numbers have doubled or tripled over the decades, while their shares have held steady, both under 1%.

India is home to millions of Sikhs, Buddhists and Jains

The geographic distribution of religious groups also has remained relatively stable since Partition. The largest numbers of Christians are still concentrated in the Southern states of Kerala and Tamil Nadu, and their largest population shares are in the smaller Northeastern states that border China, Bhutan, Myanmar (also called Burma) and Bangladesh. Jammu and Kashmir, adjacent to Pakistan, is the only place in which the majority of the population is Muslim, except for the sparsely populated archipelago of Lakshadweep. Buddhists and Jains are most often found in Maharashtra, and Sikhs in the Northwestern state of Punjab, where they make up a majority. Nearly every other state and territory has a large Hindu majority. (See Chapter 3 for more information on the religious demography of India’s states and territories.)

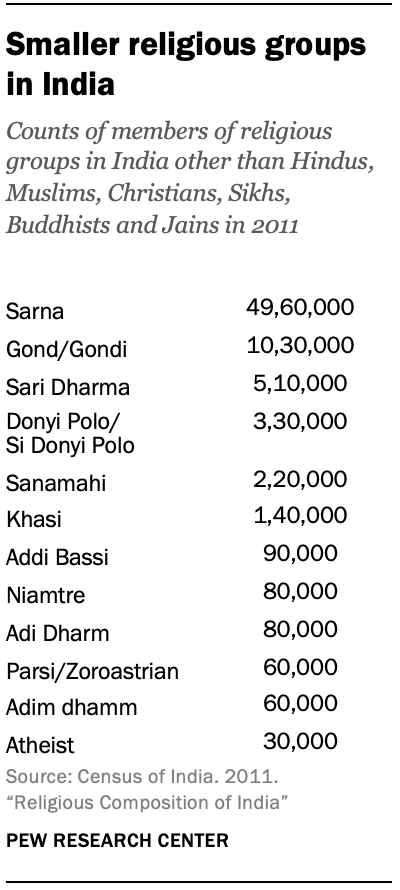
Roughly 8 million (80 lakh) people said in the 2011 census that they did not belong to any of the six largest religious groups. Nearly all of these people volunteered some other religious affiliation; only about 30,000 Indians described themselves as atheists.

Smaller religious groups in India

The religion question on the Indian census is open-ended, meaning that people are free to give any answer they like. Besides Hindus, Muslims, Christians, Buddhists, Sikhs and Jains, there are 83 smaller religious groups that each had at least 100 self-declared adherents in the 2011 census. Within this category, most people belong to tribal or indigenous religions. Sarna is by far the largest, with nearly 5 million (50 lakh) adherents, followed by Gond (about 1 million, or 10 lakh) and Sari Dharma (510,000, or 5,10,000 in India’s system).

India’s Parsis (who trace their ancestry to Zoroastrians in Persia) are unusual in that their population has declined in absolute numbers since Partition, even as the overall population has boomed. This trend can be largely attributed to the group’s high median age and low fertility rate – more Indian Parsis are dying than are being born. In 1951, they were already a small minority with about 110,000 adherents (1,10,000); they have almost halved since then.

Jews and Baha’is in India are represented with between 4,000 and 5,000 adherents each, according to the census.

Looking ahead to 2050

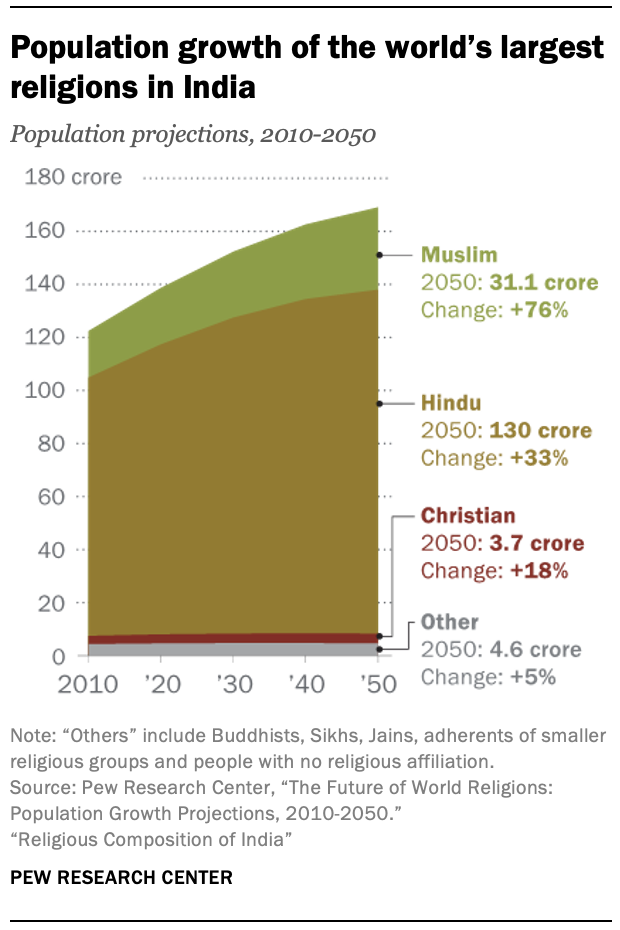
As of the publication of this demographic study, India’s 2021 census has been postponed due to the coronavirus pandemic, and results may not be publicly available for years after it is conducted. However, Pew Research Center in 2015 published demographic projections for the world’s largest religious groups that extend to 2050. According to that projection, India was home to about 1.4 billion (140 crore) people as of 2020.

Population growth of the world’s largest religions in India

Barring dramatic changes in the trajectories of India’s populations, Muslims would be expected to continue to grow slowly as a share of the Indian population in the coming decades, while Hindus will remain a large majority.

In the projected scenario, as of 2020 about 15% of Indians are Muslim (vs. 14.2% in the 2011 census), 79% are Hindu (vs. 79.8% in 2011), and 2% are Christian (in line with 2011). In 2050, Hindus are projected to represent about 77% of Indians, Muslims 18% and Christians still 2%. Buddhists, Sikhs and Jains all have fertility rates well below the national average and are therefore projected to shrink as a share of the population.

2. Causes of religious change

The religious composition of the global population is always in flux. For example, the share of Buddhists worldwide is shrinking because of their low average fertility rate, and Christians are declining in the U.S. and Western Europe as more people leave organized religion. Demographers attribute changes in the size of religious populations to three main causes:

  • Fertility rates
  • Religious switching (or conversion)
  • Migration

Causes of change: Fertility

Fertility rates have been the main driver of population change in India. In the decades since Partition, the number of children born to an average woman over her lifetime has been decreasing, and most gaps between religious groups have narrowed. However, some fertility differences between religious groups persist. Overall, the average woman in India is expected to have 2.2 children in her lifetime. Hindu women are expected to have 2.1 children, on average, while Muslims have 2.6 and Christians have 2.0.

The role of age structures and life expectancy in religious change

Related to fertility rates, the age distributions of India’s largest religious groups differ significantly. As of 2020, Pew Research Center estimates that Hindus have a median age of 29, compared with 24 for Muslims and 31 for Christians. India’s other religious groups have a combined median age of 34. Groups with younger populations have more women entering their early reproductive years and are expected to grow faster than older populations. This can create what demographers call “population momentum”: High fertility rates produce a relatively young age distribution, which in turn accelerates population growth. By the same token, declining fertility rates act as brakes on population growth.

In theory, mortality rates also could be a significant factor in the changing size of religious groups if some groups face much lower life expectancies than others. But religious differences in life expectancy in India are estimated to be modest: Christians have a life expectancy at birth of 68 years, followed by Muslims (66) and Hindus (65).

A decline in infant mortality, meanwhile, means that parents can now attain their desired family sizes with fewer births, which in turn has helped slow India’s fertility rates and further reduce the growth differences between religious groups.

Fertility and its connections to education, economics and location

Within religious groups, adherents tend to share certain demographic characteristics, such as levels of education and household wealth – and some of these factors impact fertility. Often, these shared characteristics are tied to a group’s regional concentration. Sharing a location often means sharing a distinct set of local cultural norms, and decisions about family size are influenced by what seems common and desirable among neighbors, nearby friends and family. Economic conditions that may impact access to education and health care (including family planning resources) also vary from place to place.

Globally, a woman’s level of education is the best predictor of the number of children she will have in her lifetime. Higher education usually coincides with childbearing years, and as a result, highly educated women often marry later and have their first child later than women with less education. Education also frequently gives women more economic opportunities – including jobs that might lead to further delays in childbearing – and better access to family planning resources. In India, there are sizable religious differences in the average years of education women receive, with Christians receiving the most and Muslims the fewest.

A note on large numbers

India uses a number system that differs from the international number system. This report presents numbers in the international system and, in parentheses, the Indian system. The Indian number system uses units such as lakhs and crores and places commas at different intervals than the international system. Some examples of equivalents:

International number system vs. Indian number system

One hundred thousand (100,000) = 1 lakh (1,00,000) One million (1,000,000) = 10 lakh (10,00,000) Ten million (10,000,000) = 1 crore (1,00,00,000)

Wealth is another measure that is tied to fertility around the world. Poorer women tend to have more children, not only because wealth is connected with access to education and health care, but also because children can contribute labor and earnings to a household with limited means. For similar reasons, women living in rural areas typically have more children than those in urban areas. Patterns by religion that influence fertility do not always pull in the same direction. For example, Indian Muslims on average live in poorer households – a characteristic that is tied to higher birth rates. But Muslims are also more concentrated in urban areas than are Indians overall, a characteristic that is tied to lower birth rates.

A preference for sons and aversion to daughters also may play a role in overall fertility. There is evidence that some parents in India resort to sex-selective abortions to reduce their number of daughters – causing an estimated deficit of 20.7 million (2.07 crore) girls compared with what would naturally be expected between 1970 and 2017 – and that this practice is more common among Indian Hindus than among Muslims and Christians.7

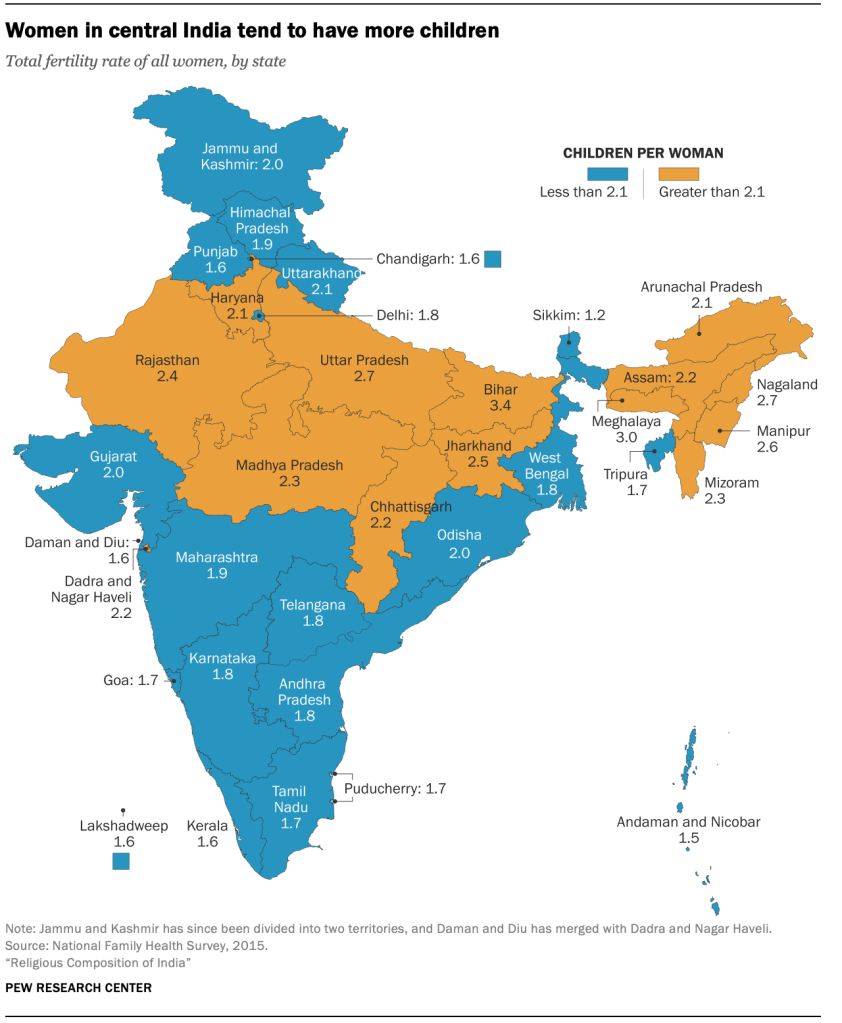
Women in central India tend to have more children

These interconnected patterns raise questions: Can fertility gaps between religious groups be fully explained by factors other than religion? Are religious patterns simply an accident of correlation, and not a meaningful differentiator? Perhaps Muslim women tend to have more children because they spend fewer years in school and are less wealthy, on average, than other women in India, or because many Muslims happen to live in areas where women of all faiths tend to have large families.

Indeed, many factors contribute to family sizes, making it impossible to pinpoint exactly how much religious affiliation alone impacts fertility. Unlike levels of education and wealth, some of these factors are cultural or historical and not easily measured in surveys.

However, a closer statistical examination of the available data can shed light on the ways that fertility, education, wealth and place of residence are related in India – and the extent to which religious gaps in fertility can be explained by these factors.

Controlling for group differences among Indian women in their 40s

To try to disentangle the interrelated influences on fertility – and determine if there would still be differences in the number of children that Hindus, Muslims and Christians tend to have if they lived in the same place and had equal levels of wealth and education – researchers used a statistical technique called a multilevel mixed-effects model.

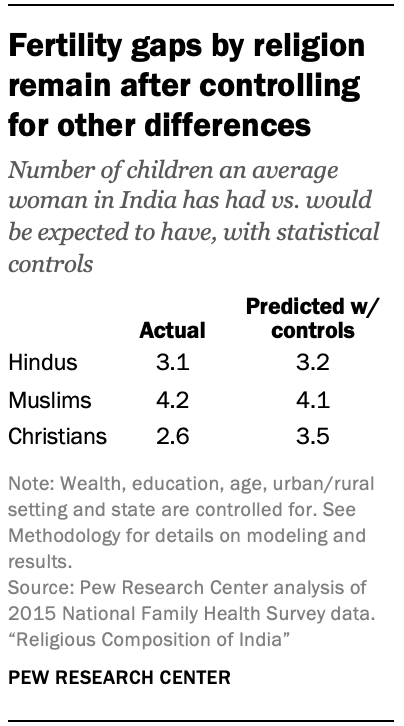
This analysis focuses on a cohort of women who were in their 40s when they took the National Family Heath Survey in 2015. Women in this age group typically have completed both schooling and childbearing. This group of women also began their childbearing years at a time when larger families were the norm, and consequently they have had more children than younger Indian women today are expected to have in their lifetimes. In fact, the number of children that women in their 40s have had is in line with the fertility rates of the 1990s: The average Indian woman in this cohort has had 3.2 children, and there are relatively large differences by religion. Christian women have the smallest families, with an average of 2.6 children. Muslims have the most children, with an average of 4.2. Hindu women have had an average of 3.1 children.

Women in this group are geographically distributed among states and territories in a way that mirrors India’s overall population. Muslim women in their 40s are more likely to live in urban areas than Hindus or Christians and, after accounting for this difference, Muslims have lower levels of household wealth (on a measure that accounts for a wide range of factors including whether homes have running water or flooring). About half of women in this cohort have received no formal schooling at all, including 50% of Hindus, 57% of Muslims and 28% of Christians. The average number of years of education for women in this group is 4.2 for Hindus, 3.2 for Muslims and 7.0 for Christians.

Fertility gaps by religion remain after controlling for other differences

The results of the analysis – controlling for years of education, household wealth, the state where women reside, whether they live in an urban or rural area and their age – show that if women in their 40s were equal in all these other ways, a Hindu woman would be predicted to have had 3.2 children (up slightly from the 3.1 they actually had), on average, compared with 4.1 for a Muslim woman (a little below the actual 4.2).8 In other words, if the women in this group all had an average amount of wealth and education, were the same age and lived in the same places, Hindu women still would be predicted to have 0.9 fewer children than their Muslim counterparts, on average.

An average Christian in her 40s, on the other hand, would be expected to have 3.5 children – nearly one full child more than Christian women in this age group actually have – if she were otherwise similar to all other Indian women. This large shift between actual children and predicted children among Christians is largely due to differences in education levels. If Christian women did not have more years of schooling, they would be predicted to be much more similar to Hindus in the number of children they have.

While these factors – years of education, household wealth, place of residence and age – all are statistically associated with the number of children women have in India, they do not fully explain the fertility gaps among religious groups.

As is generally the case elsewhere, education has a major impact on fertility, as each additional year of education correlates with a significant drop in fertility. Wealthier women in this cohort have fewer children than poorer women, and women in urban areas have fewer children than their rural counterparts.

But these results indicate that if all women in this cohort were exactly the same in their levels of education and wealth, lived in the same place, and were the same age, there would still be a difference in the number of children ever born to Hindu, Muslim and Christian women in their 40s. (See Methodology for more details on modeling and results.)

Of course, Hindu, Muslim and Christian women in India differ in many ways that are not, and often cannot be, included in this analysis of survey data. These results do not quantify how much, if any, of the gaps in fertility are due to religious affiliation alone. They show only that differences remain after accounting for several other factors known to impact fertility and to vary between religious groups.

Causes of change: Migration

Millions (tens of lakhs) of people have left India or moved there in recent years, but because their numbers are small relative to the overall population, migration does not have a substantial impact on the country’s religious composition.

Emigrants leaving India far outnumber newcomers, by a ratio of more than three-to-one. India has been one of the top countries of origin for immigrants to other countries since the United Nations started tracking such statistics three decades ago.9 As of 2019, about 17.5 million (1.75 crore) people who were born in India are now living in other countries. This represents a tiny fraction of India’s population: Only about 1% of people born in India live elsewhere. This means that Indians, who account for more than 17% of the global population, make up about 6% of all the world’s people living outside of their country of birth.

The largest number of migrants who were born in India and now live abroad are in the United Arab Emirates (3.4 million, or 34 lakh), followed by the United States (2.7 million, or 27 lakh), Saudi Arabia (2.4 million, or 24 lakh), Pakistan (1.6 million, or 16 lakh) and Oman (1.3 million, or 13 lakh). All of these countries, except for the U.S., have large Muslim majorities. Movement between India and Persian Gulf countries is often circular, with migrants periodically leaving India to be temporary workers in fast-growing Arab countries with booming economies.

Census and survey data summarized in a 2012 Pew Research Center report on the religious affiliation of migrants indicates that religious minorities are overrepresented among emigrants from India. India is a top origin country of Muslim migrants around the world, with more than 3 million (30 lakh) Indian-born Muslims residing elsewhere – many more Muslims than are estimated to have been born elsewhere and now reside in India.

The UN estimates there were roughly 5.2 million (52 lakh) foreign-born people living in India in 2019 – including refugees, asylum-seekers and other irregular migrants – or about 0.4% of India’s population that year. By comparison, there were more than 50.7 million (5.07 crore) immigrants in the United States, accounting for 15% of the U.S. population.

Most of India’s immigrants (3.1 million, or 31 lakh) were born in Bangladesh, which was part of India until Partition and then part of Pakistan until 1971. The next most common origin countries are Pakistan (1.1 million, or 11 lakh), Nepal (530,000, or 5,30,000 in India’s number system), Sri Lanka (150,000, or 1,50,000) and China (110,000, or 1,10,000). Bangladesh and Pakistan are both countries with large Muslim majorities; Nepal is primarily Hindu, and Sri Lanka has a large Buddhist majority. China’s population is mostly religiously unaffiliated, but the regions that neighbor India – Tibet and Xinjiang – are unusual in having a significant presence of Buddhists and Muslims, respectively.

There is, however, some evidence to suggest that immigrants to India do not necessarily match the religious composition of the countries they come from. For example, more than 40% of all emigrants out of Bangladesh are Hindu, even though the country is about 90% Muslim, according to Pew Research Center’s 2012 estimates, which found that about two-thirds of India’s immigrants overall are Hindu. On the whole, among people whose families migrated to India in recent generations, 87% were Hindu, 6% were Muslim, another 6% were Sikh and about 0.5% were Christian, according to the most recent India Human Development Survey.10

Unauthorized immigration is a controversial subject in India and practically impossible to measure accurately over time, especially as laws about legal or protected status have shifted through the years. While India has been willing to host refugees, they typically have not been granted legal status and are expected to return to their home countries as soon as conditions allow. According to some reports, up to tens of millions (crores) of people from Muslim-majority countries are living without legal status or documentation in India, but a lack of evidence for corresponding outmigration and other indicators have led to doubts about the plausibility of such high estimates. (This report relies on UN migration estimates that are intended to include all migrants, regardless of their legal status.)

Sidebar: Controversies over migration and citizenship in India

Tensions over citizenship and migration have intensified in India during the past decade. In 2019, Parliament passed the Citizenship Amendment Bill granting expedited citizenship to many Hindu, Christian, Jain, Sikh, Parsi and Buddhist – but not Muslim – immigrants who have fled persecution in neighboring countries.

People who come to India either as refugees or as undocumented immigrants often are from nearby countries, and in recent years speculation has circulated that up to tens of millions (crores) of Muslims have moved from Bangladesh and other neighboring countries to live illegally in India.

The sources and methodologies behind such high estimates are unclear, and reliable estimates of undocumented people are difficult to come by. But if tens of millions (crores) of Muslims from nearby countries had indeed migrated to India, demographers would expect to see evidence of such mass emigration in data from their countries of origin, and this magnitude of outmigration is not apparent. On the contrary, the United Nations Population Division estimates that as of 2019, there were fewer than 8 million (80 lakh) people who were born in Bangladesh and now reside (either legally or illegally) in all other countries combined. About 3.1 million (31 lakh) migrants born in Bangladesh are thought to reside in India – a large share of all immigrants to India, but far fewer than some figures cited widely, often without supporting evidence.

The available data indicates that Muslims are more likely than Hindus to leave India, and immigrants into India from Muslim-majority countries are disproportionately Hindu. Migration of Hindus from Bangladesh to India, driven by sectarian conflict, is largely responsible for the steady decrease in the Hindu share of Bangladesh’s population.11 (See “Causes of change: Migration” in this chapter for more on the demographics of migrants into and out of India.)

The recent mass exodus of the primarily Muslim Rohingya people from Myanmar also has been cited as a source of illegal migration to India. While it is plausible that many Rohingyas are in India, only about 1 million (10 lakh) Rohingyas lived in Myanmar prior to the mass exodus in 2017-2018. Afterward, the UN estimated that there were approximately 50,000 people living in India who originated from Myanmar, including about 18,000 Rohingya refugees registered with the United Nations High Commissioner for Refugees (UNHCR). Indian officials estimate that there are 40,000 Rohingyas dispersed throughout the country.

Causes of change: Religious switching

The share of Indians who switch religions is modest and does not appear to be a major factor in demographic change. While India’s constitution guarantees citizens the freedom to “practice, profess and propagate” their religion, nine Indian states have laws that restrict proselytizing and conversion to Islam and Christianity. Such laws were introduced during the final decades of British occupation in the 1930s and 1940s and proliferated in the 2000s.

In a 2020 Pew Research Center survey of nearly 30,000 adults across India, very few indicated they had switched religions since childhood. Among adults who say they were raised as Hindus, 99% still identify as Hindu. Fully 97% of those raised as Muslims are still Muslims in adulthood. And among Indians who were raised as Christians, 94% are still Christians. Moreover, those who do switch religions tend to cancel each other out; among all Indian adults, for example, 0.7% were raised Hindu but do not currently identify as such, while 0.8% were raised outside of the religion but are now Hindu.

Interfaith marriage also is rare, and widely frowned upon. In the same survey, 99% of married Hindus, 98% of married Muslims and 95% of married Christians say they have a spouse of the same faith. Similar shares of Hindus and Muslims, as well as 92% of Christians, say their spouse was also raised in their current religion. Furthermore, 82% of Indians say that it is at least somewhat important to prevent women in their community from marrying someone of another religion, and 81% said the same for men, including about two-thirds who say each is very important.

3. Religious demography of Indian states and territories

As is the case in most countries, population density varies widely across India. The most populous state, Uttar Pradesh, recorded close to 200 million (20 crore) inhabitants in the 2011 census, while the southern archipelago of Lakshadweep had fewer than 100,000 (1,00,000 in India’s number system). Adherents of religious groups also are not evenly distributed across the country.

A note on large numbers

India uses a number system that differs from the international number system. This report presents numbers in the international system and, in parentheses, the Indian system. The Indian number system uses units such as lakhs and crores and places commas at different intervals than the international system. Some examples of equivalents:

International number system vs. Indian number system

One hundred thousand (100,000) = 1 lakh (1,00,000) One million (1,000,000) = 10 lakh (10,00,000) Ten million (10,000,000) = 1 crore (1,00,00,000)

As a result, religious groups live in a wide variety of local contexts in ways that are not apparent in the national patterns presented above. In some cases, many million (tens of lakh) members of a certain group live as a religious minority in a very large state. And in others, a much smaller number of adherents form a large majority in one of India’s smaller states.

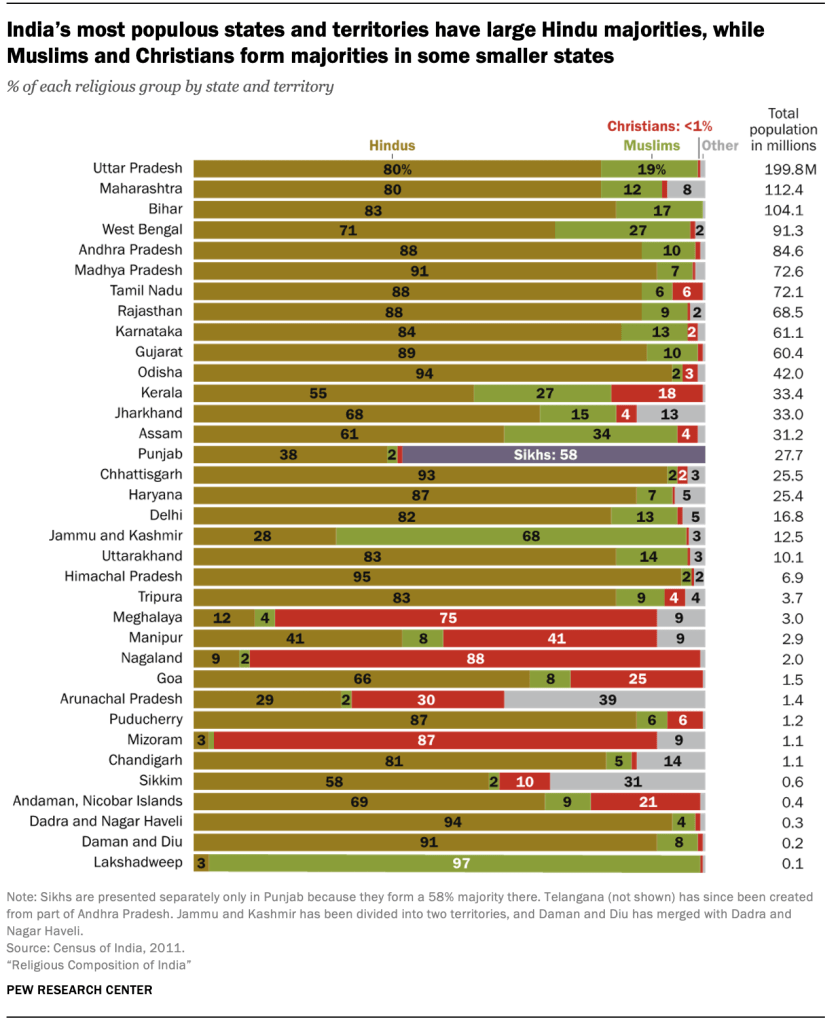
As of the 2011 census, Hindus were a majority in 28 of India’s 35 states and union territories, including all of the country’s most populous states: Uttar Pradesh (total population 200 million, or 20 crore), Maharashtra (112 million, or 11.2 crore), Bihar (104 million, or 10.4 crore) and West Bengal (91 million, or 9.1 crore).12

Muslims are the majority in the small tropical archipelago of Lakshadweep (total population 60,000) and in Jammu and Kashmir (13 million, or 130 lakh), on the border with Pakistan. Jammu and Kashmir was carved out as a state separate from both India and Pakistan during Partition, but in 2019 was stripped of its semi-autonomous status and reorganized into territories to be administered by India directly. Jammu and Kashmir was home to about 8.6 million (86 lakh) Muslims as of the 2011 census, making it the Indian state with the seventh-largest Muslim population.

Hindus are the largest group in most Indian states

Christians are a majority in Nagaland (total population 2 million, or 20 lakh), Mizoram (1 million, or 10 lakh) and Meghalaya (3 million, or 30 lakh) – three small states in a sparsely populated, fertile mountain range in India’s Northeast. Smaller numbers of Christians live in any of those states than live as religious minorities in the much larger states of Kerala (33 million, or 3.3 crore) and Tamil Nadu (72 million, or 7.2 crore).

Sikhs are the largest group in Punjab (total population 28 million, or 2.8 crore), which is the only state where a religious group other than Hindus, Muslims or Christians forms a majority. The populations of two states, Arunachal Pradesh (1.4 million, or 14 lakh) and Manipur (3 million, or 30 lakh), are religiously diverse, with substantial shares of several religious groups and none approaching a majority. In Arunachal Pradesh, for example, where 39% of the population falls into the “other” category of smaller religions, many people identify as Donyi-Polo. Meanwhile, in the state of Sikkim, which borders Tibet, 27% are Buddhists.

Though the population shares discussed in this chapter are as of the last Indian census conducted in 2011, state majorities are generally large enough that they would not be expected to move below 50% in a single decade.

When it comes to total numbers, the largest populations of both Hindus (159 million, or 15.9 crore) and Muslims (38 million, or 3.8 crore) live in Uttar Pradesh, accounting for 16% and 22% of India’s Hindus and Muslims, respectively. The greatest number of Christians live in Kerala (6 million, or 60 lakh, which is about 22% of the country’s Christians). Most Sikhs live in Punjab (16 million, or 1.6 crore – 77% of Indian Sikhs).

Buddhists are most often found in Maharashtra on India’s western coast (6.5 million, or 65 lakh), making up 77% of India’s Buddhists. Maharashtra, India’s second most populous state – which includes Mumbai, India’s largest city – is also the state with the largest number of Jains (1.4 million, or 14 lakh – 31% of Indian Jains).

India’s most populous states and territories have large Hindu majorities, while Muslims and Christians form majorities in some smaller states

At the state level, religious distributions were relatively stable in the most recent census decade

While most of this report examines changes in religious composition on a national level since the first post-independence census of 1951, this section focuses on developments within states between the censuses of 2001 and 2011.

India’s domestic borders were largely stable across its 35 states and union territories during that decade, making it possible to track state-level changes in the relative sizes of religious groups. Prior to 2001, the boundaries of states and territories shifted frequently, making it difficult to draw comparisons from one census to the next. (See previous sidebar for more on India’s shifting geography.)

Overall, there was relatively little change in the religious composition of states between 2001 and 2011, particularly within the more populous ones, even as populations soared in almost every state. Within states, religious groups’ shares rarely rose or fell by more than 3 percentage points, and in most cases, they did not change by more than a small fraction of 1%.

This was particularly true for Hindus, who generally held steady or declined modestly as a share of state populations between 2001 and 2011. For example, the share of Hindus in Uttar Pradesh declined by 0.9 percentage points during the decade, and the percentage of Hindus in Maharashtra dropped by 0.5 points. One exception to this pattern was Punjab, where the share of Hindus rose by 1.6 percentage points.

In most Indian states, Hindus have stayed stable or declined modestly as a share of the population

Muslims usually maintained their population shares within states or increased them slightly between 2001 and 2011. For instance, Muslims grew as a share of West Bengal’s population by 1.8 percentage points, and the Muslim majority in Jammu and Kashmir grew by 1.3 points. The only state in which the Muslim share dropped was Manipur, with a 0.4-point decrease.

Muslims have grown slightly as a share of the population in most Indian states

Some of the most substantial changes in religious groups’ population shares were in India’s isolated Northeast

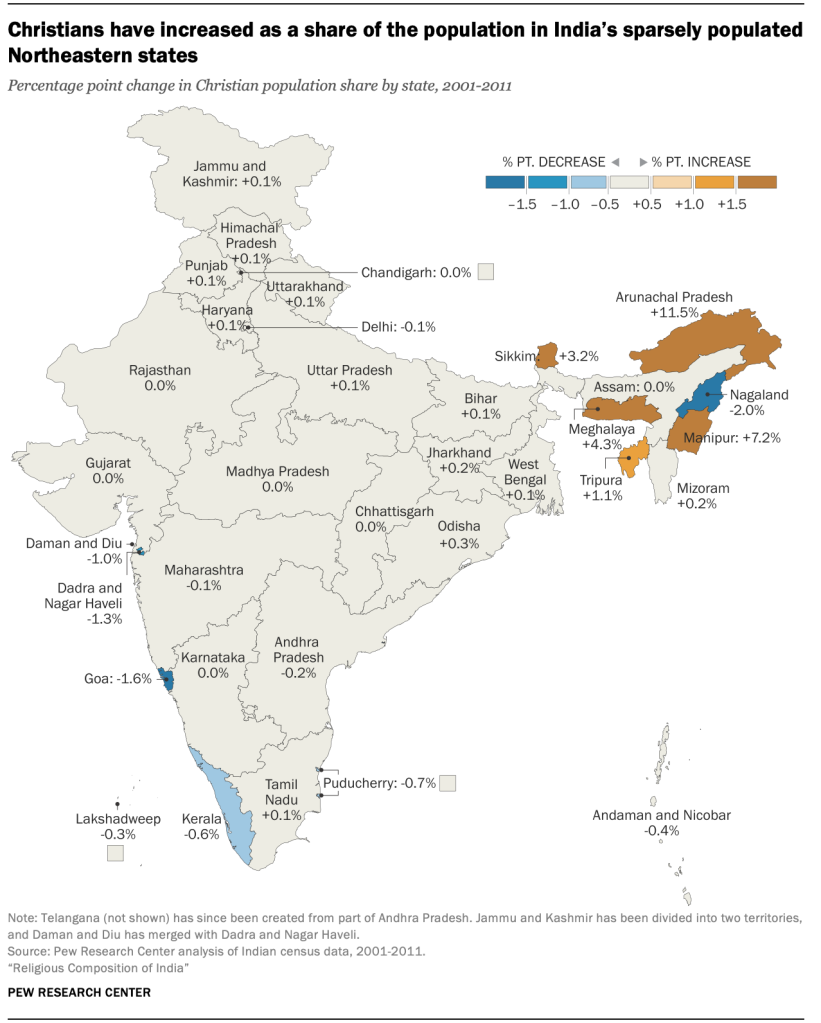
Christians experienced significant changes to their population shares only in India’s Northeast. With the exception of Assam (population 31 million, or 3.1 crore), the Northeastern states have very small populations – ranging from 610,000 (Indian system: 6,10,000) in Sikkim to 3.7 million (37 lakh) in Tripura – so even minor fluctuations in religious groups’ counts can substantially affect their relative sizes. Indeed, changes in overall religious composition were most pronounced in this mountainous region, which is wedged in a panhandle bordering China, Bangladesh, Myanmar, Bhutan and Nepal and is largely isolated from the rest of India.

Christians, who make up a larger share of the population in this region than they do nationally, grew as a percentage of several states between 2001 and 2011. The share of Christians rose in Arunachal Pradesh by 12 percentage points (to 30%), in Manipur by 7 points (to 41%), in Meghalaya by 4 points (to 75%) and in Sikkim by 3 points (to 10%). The share of Christians in Nagaland fell slightly, though they remained in the overwhelming majority.

Hindus also had their biggest percentage point changes in the sparsely populated Northeast, declining by 3 points or more in Arunachal Pradesh (down 6 percentage points to 29%), Manipur (-5 points to 41%), Assam (-3 points to 61%) and Sikkim (-3 points to 58%). Muslims, too, experienced their biggest change in the Northeast, in Assam (+3 points to 34%).

Christians have increased as a share of the population in India’s sparsely populated Northeastern states

Few large states experienced substantial changes in their religious landscapes

Besides Assam, only four other states with a population of at least 10 million (1 crore) had any religious groups that experienced changes of 2 percentage points or more in their share of the state population between 2001 and 2011.

  • In West Bengal (population 91 million, or 9.1 crore), the Hindu share decreased by 2 percentage points to 71%, and Muslims increased 2 points to 27%.
  • In Punjab (28 million, or 2.8 crore), the Sikh majority decreased by 2 points to 58%.
  • In Kerala (33 million, or 3.3 crore), the Muslim share increased by 2 points to 27%.
  • And in Uttarakhand (10 million, or 1 crore), the Hindu share decreased by 2 percentage points to 83%, while the Muslim share increased by 2 points to 14%.

All three of India’s largest religious groups grew in total number in nearly every state

In terms of absolute numbers, Hindus, Muslims and Christians grew in virtually every Indian state. The number of Hindus decreased slightly (by about 1,500) in only one state, Christian-majority Mizoram, while the number of Christians declined by more than 50,000 in both Nagaland and Andhra Pradesh. The total number of Muslims did not discernably decrease in any state during this decade.

Hindus experienced their largest population growth by number in Uttar Pradesh, India’s most populous state – increasing by 25 million (2.5 crore) to 159 million, or 15.9 crore – followed by Bihar, whose Hindu population rose by 17 million (1.7 crore) to 86 million, or 8.6 crore. Both Uttar Pradesh and Bihar have higher than average rates of poverty and, relatedly, exceptionally high fertility rates.

The Muslim population also had its largest increase in Uttar Pradesh, increasing by 8 million (80 lakh) to 38 million, or 3.8 crore, followed by West Bengal, up by 4 million (40 lakh) to 25 million, or 2.5 crore. West Bengal has poverty and fertility rates that are slightly lower than average.

The Christian population grew the most in Tamil Nadu, increasing by 600,000 (6,00,000 by India’s system) to 4 million, or 40 lakh, and Meghalaya, also by 600,000 (6,00,000), to 2.2 million, or 22 lakh. Tamil Nadu, in the far South, has a low fertility rate, while Meghalaya, in the Northeast, has high fertility rates.

Acknowledgments

This report was produced by Pew Research Center as part of the Pew-Templeton Global Religious Futures project, which analyzes religious change and its impact on societies around the world. Funding for the Global Religious Futures project comes from The Pew Charitable Trusts and the John Templeton Foundation.

This report is a collaborative effort based on the input and analysis of the following individuals. Find related reports online at pewresearch.org/pewresearch-org/religion.

Primary Researcher

Stephanie Kramer, Senior Researcher

Research Team                    

Yunping Tong, Research Associate Conrad Hackett, Associate Director of Research and Senior Demographer Anne Fengyan Shi, Senior Researcher Jacob Ausubel, Research Assistant Alan Cooperman, Director of Religion Research     

Editorial and Graphic Design

Dalia Fahmy, Senior Writer/Editor Michael Lipka, Editorial Manager David Kent, Senior Copy Editor Rebecca Leppert, Editorial Assistant Bill Webster, Senior Information Graphics Designer

Communications and Web Publishing

Stacy Rosenberg, Associate Director, Digital Travis Mitchell, Digital Producer Anna Schiller, Senior Communications Manager Kelsey Beveridge, Communications Associate

Others at Pew Research Center who provided guidance include Neha Sahgal, Associate Director of Research, and Jonathan Evans, Research Associate. In addition, former Research Associate Joey Marshall and former intern Omkar Joshi made important contributions to this report.

The Center also received valuable advice on this report from several eminent scholars, including Monica Das Gupta, Research Professor of Sociology at the University of Maryland and the Maryland Population Research Center; Sriya Iyer, University Reader in Economics and Fellow of Saint Catharine’s College at the University of Cambridge; and Devesh Kapur, Starr Foundation Professor of South Asian studies at Johns Hopkins University School of Advanced International Studies.

While the analysis for this report was guided by our consultations with these advisers, Pew Research Center is solely responsible for the interpretation and reporting of the data.

Methodology

This section describes the sources and variables used for the analyses in this report. It explains known limitations of the data. Next, it outlines the strengths and weaknesses of the map used, as well as possible alternatives and reasons why data is shown as missing in some areas. Finally, the multilevel mixed-effects modeling used in the “Causes of change: Fertility” section in Chapter 2 is described in more detail.

Sources

Quantitative analyses in this report rely on two main sources: India’s decennial census and the National Family Health Survey (NFHS). Information about population sizes from 1951 to 2011 come from the census. The census has collected detailed data on individuals and households, including religion, since 1881, when India was still under British rule.

Data on fertility and how it is related to the state a woman lives in, her age, years of education, household wealth and urban versus rural status comes from the National Family Health Survey. The NFHS is a large, nationally representative household survey with more extensive information on childbearing than the census. The first round was conducted in 1992-93. Total fertility rates from each of its four available rounds are included. The analysis of how various factors are related to the fertility of women in their 40s relies only on wave four of the survey, conducted in 2015 and 2016. As of the publication of this study, the fifth wave of the NFHS is in progress. Microdata will be made available later, permitting analysis of trends by religion. Preliminary total fertility rate (TFR) results have been released for states in which data collection is already complete: https://pib.gov.in/Pressreleaseshare.aspx?PRID=1680702.

Brief references to historical patterns of fertility for Indian women overall come from the United Nations World Population Prospects. Data on migration of all people born in India also comes from the UN and underlie a Pew Research Center analysis of their religious composition. Comparisons of the development levels of Indian states are based on Human Development Index scores – an aggregate measure that includes dimensions like life expectancy, average years of schooling and per capita income.

Survey responses pertaining to religious switching and interfaith marriage come from a Pew Research Center survey of 29,999 Indian adults conducted in late 2019 and early 2020. Projections of future population sizes were also made by the Center.

Data limitations

There are known issues with census data on religion in India. Christians in particular appear to be undercounted; some Christians who belong to Scheduled Castes may choose to identify as Hindu when completing official forms such as the census. This is due to a mandate in the Indian Constitution specifying that only Hindus, Sikhs and Buddhists can receive some types of caste-based government affirmative action benefits (known in India as “reservations”). Analyses in Pew Research Center’s Global Religious Landscape and Future of World Religions reports accounted for this by estimating that 10% of Christians in India state their affiliations as Hindu in the census and by adjusting the population figures accordingly. This report relies on unadjusted numbers due to the uncertainty surrounding how a bias in responses might have changed over six decades.

Buddhists, Jains and Sikhs are grouped with Hindus in some laws that enable access to social services or employment and educational preferences to other religious minority groups. There may be some confusion among census takers and enumerators as to which religious affiliations apply to which circumstances and government forms.

Anecdotes presented during a consultation on religion in the Indian census with leading India demographers at the 2010 Asian Population Association’s meeting in New Delhi described how, rather than asking respondents for their religious affiliation, some census enumerators made their own inferences based on individuals’ names or items and symbols in the home. Others may have asked a religious or community leader about the characteristics of nearby individuals. These practices are inconsistent with census protocols and may have biased responses toward the majority religion, Hinduism, but there is no known quantitative data on this topic.

While, constitutionally, India is a secular country with protections for religious minorities, Indians still generally experience “high” levels of government restrictions on religion, according to an annual Pew Research Center study. Nine states have made it illegal for Christians and Muslims to proselytize. Government restrictions on religion may influence census takers to state a religious affiliation other than the one they practice or believe in, though a Pew Research Center survey also found that religious switching is unusual.

Map borders and missing data

The map template used throughout this report is based on the Census of India map. It is one of many maps of India, and it has both strengths and weaknesses. The map used here depicts the boundaries of states and territories according to the Indian government, including areas within them for which data was unavailable in 2011. The reasons for missing data vary. For example, a portion of the Western state of Gujarat is usually under standing water during the monsoon season. North Sentinel Island, officially part of the Andaman and Nicobar Island administrative region, is home to the Sentinelese, an uncontacted tribe. The tribe has a long history of vigorous defense against outsiders, including attacks on approaching boats that have killed prospective visitors. The island is protected and monitored remotely by the Indian government but is effectively sovereign.

A large swath of Jammu and Kashmir, as it is depicted in the map, covers the region of Kashmir occupied by Pakistan, where demographic data on Indians is not collected. The northeastern section of the state has been occupied by the Chinese military since the 1950s but is mostly uninhabited. While the Indian government regards the full area labeled Jammu and Kashmir as unequivocally part of India and views long-standing occupations as illegal, the governments of Pakistan and China do not. International organizations like the United Nations recognize these regions as disputed. Pew Research Center takes no position on the matter of which countries’ claims to this region are legitimate. Rather, this map was chosen because it is consistent with the main data source and is commonly accepted as accurate by people in India.

Details on modeling

The section of this report on the relationship between religion, fertility and its correlates presents the predicted number of children an average Indian woman in her 40s would have, controlling for other factors, in order to estimate the degree to which fertility gaps can be explained by other differences between religious groups. These were calculated using a weighted multilevel mixed-effects generalized linear model assuming a Gaussian distribution. The sample consists of 149,294 ever-married women ages 40 to 49 (1,49,294 in the Indian number system) in wave four of the NFHS (the most recent for which microdata is available). The model accounted for religious affiliation, urban versus rural setting and the interaction between the two as factors. It also accounted for linear and nonlinear effects of the common household wealth score, years of schooling and age. Women were modeled as nested within districts (the primary sampling unit in the NFHS), with districts nested within states. The model includes a random slope to allow the effect of religion to differ from state to state.

These groups also differ in their average age at first marriage and first birth. Both Hindu and Muslim women in their 40s married for the first time at age 18, on average, and the average age for Christians was 21. On average, Hindu women had their first child at age 21, Muslims at 20 and Christians at 22. Since these factors could also be related to fertility, they were included in robustness checks of the model. The results generally hold with or without these additional variables. The predicted number of children for Christians is 3.8 if ages at first marriage and birth are accounted for, compared to 3.5 if they are not. Estimates for Hindus and Muslims change by less than 0.1 when these variables are included. Because age at first marriage and birth are closely related to education, and excluding them does not meaningfully affect results, they were dropped from the final model to avoid overfitting.