Pew Research Center

FOR RELEASE MAY 11, 2021

Jewish Americans in 2020

U.S. Jews are culturally engaged, increasingly diverse, politically polarized and worried about anti-Semitism

FOR MEDIA OR OTHER INQUIRIES:

Communications Department
202.419.4372
www.pewresearch.org

RECOMMENDED CITATION

Pew Research Center, May 2021, "Jewish Americans in 2020"

About Pew Research Center

Pew Research Center is a nonpartisan, nonadvocacy fact tank that informs the public about the issues, attitudes and trends shaping the world. It does not take policy positions. The Center conducts public opinion polling, demographic research, computational social science research and other data-driven research. It studies politics and policy; news habits and media; the internet and technology; religion; race and ethnicity; international affairs; social, demographic and economic trends; science; research methodology and data science; and immigration and migration. Pew Research Center is a subsidiary of The Pew Charitable Trusts, its primary funder.

© Pew Research Center 2026

Table of contents

  • About Pew Research Center
  • Jewish Americans in 2020
  • 1. The size of the U.S. Jewish population
  • 2. Jewish identity and belief
  • 3. Jewish practices and customs
  • 4. Marriage, families and children
  • 5. Jewish community and connectedness
  • 6. Anti-Semitism and Jewish views on discrimination
  • 7. U.S. Jews’ connections with and attitudes toward Israel
  • 8. U.S. Jews’ political views
  • 9. Race, ethnicity, heritage and immigration among U.S. Jews
  • 10. Jewish demographics
  • 11. Economics and well-being among U.S. Jews
  • 12. People of Jewish background and Jewish affinity
  • Acknowledgments
  • Appendix A: Survey methodology
  • Appendix B: Mode experiment

Jewish Americans in 2020

U.S. Jews are culturally engaged, increasingly diverse, politically polarized and worried about anti-Semitism

How we did this

For this report, we surveyed 4,718 U.S. adults who identify as Jewish, including 3,836 Jews by religion and 882 Jews of no religion. The survey was administered online and by mail by Westat, from Nov. 19, 2019, to June 3, 2020. Respondents were drawn from a national, stratified random sampling of residential mailing addresses, which included addresses from all 50 states and the District of Columbia. No lists of common Jewish names, membership rolls of Jewish organizations or other indicators of Jewishness were used to draw the initial sample.

We first sent letters to the sampled addresses asking an adult (18 or older) living in the household to take a short screening survey (“the screener”) either online or on a printed paper form, which they mailed back to us. The screener collected demographic characteristics and determined eligibility. In households with more than one adult resident, we selected the respondent randomly by some simple method, such as asking the person who most recently celebrated a birthday to fill out the screener.

A total of 68,398 people across the country completed the screener. Respondents who indicated in the screener that they are Jewish were asked to take a longer survey. Three criteria were used to determine eligibility for the extended survey: (1) if the responding adult said their current religion is Jewish; (2) if the responding adult did not identify their religion as Jewish but said that, aside from religion, they consider themselves to be Jewish in any way, such as ethnically, culturally or because of their family background; (3) if the responding adult did not identify with the first two criteria but said they were raised in the Jewish tradition or had a Jewish parent. All adults who reported any of these criteria were given the extended survey to complete.

However, this report focuses on the answers given in the extended survey by those who said their present religion is Jewish (Jews by religion), plus those who said they presently have no religion (they identify religiously as atheist, agnostic or nothing in particular) but who consider themselves Jewish aside from religion and have at least one Jewish parent or were raised Jewish (Jews of no religion). Together, these two groups comprise the net Jewish population, also referred to as U.S. Jews or Jewish Americans throughout the report.

In addition to the 4,718 respondents who were categorized as Jewish in these two ways, we also interviewed an additional 1,163 respondents who were determined to be eligible for the survey, but who ultimately were not categorized as Jewish for the purposes of this report. Some of these respondents indicated they have a Jewish parent or were raised Jewish but said they currently have a different religion (many are Christian) or do not consider themselves Jewish today in any way, either by religion or aside from religion. Others indicated that they do not have a Jewish parent, were not raised Jewish and do not identify with the Jewish religion, yet they do consider themselves Jewish in some way, such as because they are married to a Jewish person or are Christian and link Jesus with Judaism.

Both the full sample of all initial respondents (including those who were screened out as ineligible for the extended survey) and the sample of respondents to the extended survey were weighted to align with demographic benchmarks for the U.S. adult population from the Census Bureau as well as a set of modeled estimates for the religious and demographic composition of eligible adults within the larger U.S. adult population.

For more information, see the Methodology. The Methodology also contains detailed information on margins of sampling error and other potential sources of bias. Statistical significance is measured in this report at a 95% confidence level using standard tests and taking into account the effects of a complex sampling design. The questions used in this analysis can be found here.

Jewish identity in the United States, 2020

What does it mean to be Jewish in America? A new Pew Research Center survey finds that many Jewish Americans participate, at least occasionally, both in some traditional religious practices – like going to a synagogue or fasting on Yom Kippur – and in some Jewish cultural activities, like making potato latkes, watching Israeli movies or reading Jewish news online. Among young Jewish adults, however, two sharply divergent expressions of Jewishness appear to be gaining ground – one involving religion deeply enmeshed in every aspect of life, and the other involving little or no religion at all.

Overall, about a quarter of U.S. Jewish adults (27%) do not identify with the Jewish religion: They consider themselves to be Jewish ethnically, culturally or by family background and have a Jewish parent or were raised Jewish, but they answer a question about their current religion by describing themselves as atheist, agnostic or “nothing in particular” rather than as Jewish. Among Jewish adults under 30, four-in-ten describe themselves this way.

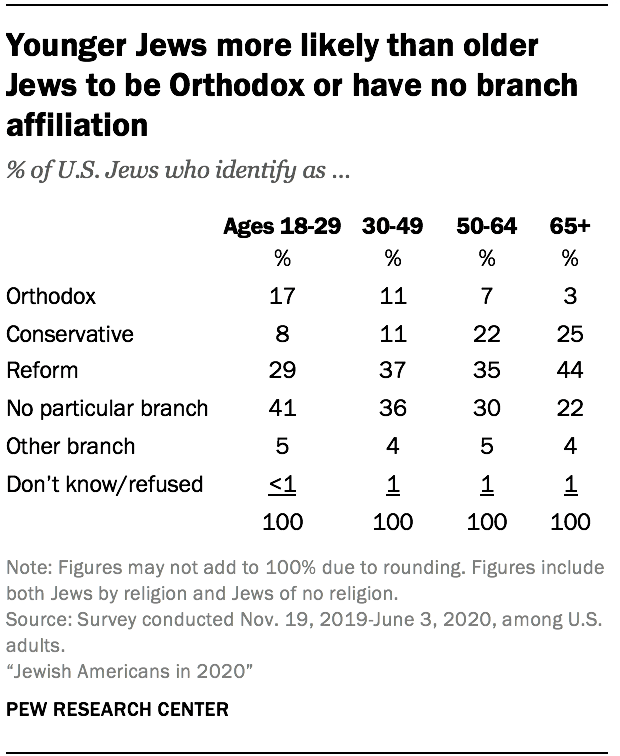
At the same time, younger Jewish adults are much more likely than older Jews to identify as Orthodox. Among Jews ages 18 to 29, 17% self-identify as Orthodox, compared with just 3% of Jews 65 and older. And fully one-in-ten U.S. Jewish adults under the age of 30 are Haredim, or ultra-Orthodox (11%), compared with 1% of Jews 65 and older.

Meanwhile, the two branches of Judaism that long predominated in the U.S. have less of a hold on young Jews than on their elders. Roughly four-in-ten Jewish adults under 30 identify with either Reform (29%) or Conservative Judaism (8%), compared with seven-in-ten Jews ages 65 and older.

Compared with older Jews, youngest Jewish adults include larger shares of both Orthodox and people with no denominational identity

In other words, the youngest U.S. Jews count among their ranks both a relatively large share of traditionally observant, Orthodox Jews and an even larger group of people who see themselves as Jewish for cultural, ethnic or family reasons but do not identify with Judaism – as a religion – at all. Many people in both groups participate, at least sometimes, in the same cultural activities, such as cooking traditional Jewish foods, visiting Jewish historical sites and listening to Jewish or Israeli music. Yet the survey finds that most people in the latter group (Jews of no religion) feel they have not much or nothing at all in common with the former group (Orthodox Jews).

There were some signs of this divergence in Pew Research Center’s previous survey of Jewish Americans, conducted in 2013. But it is especially evident in the 2020 survey, conducted during a polarizing election campaign.

Most U.S. Jews identify as Democrats, but most Orthodox are Republicans

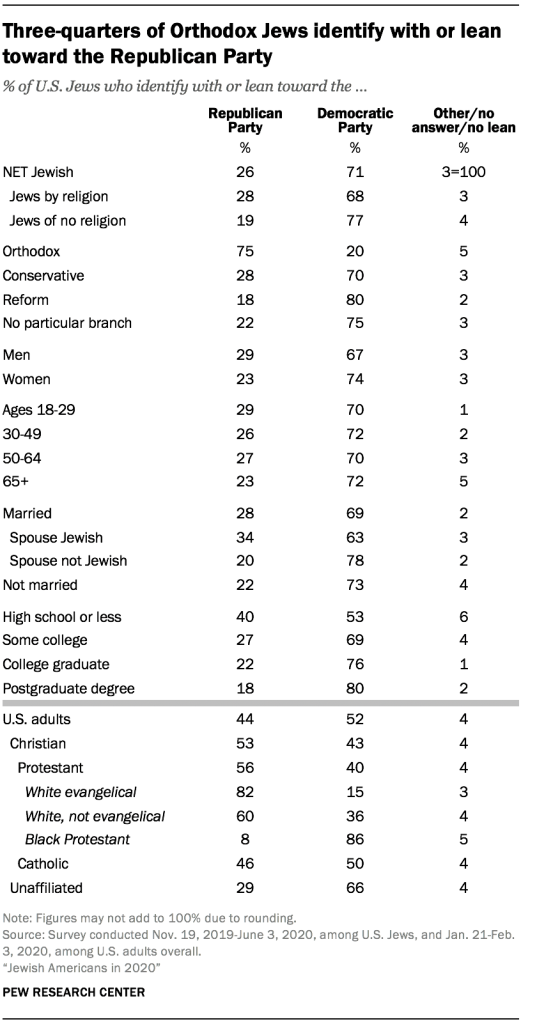
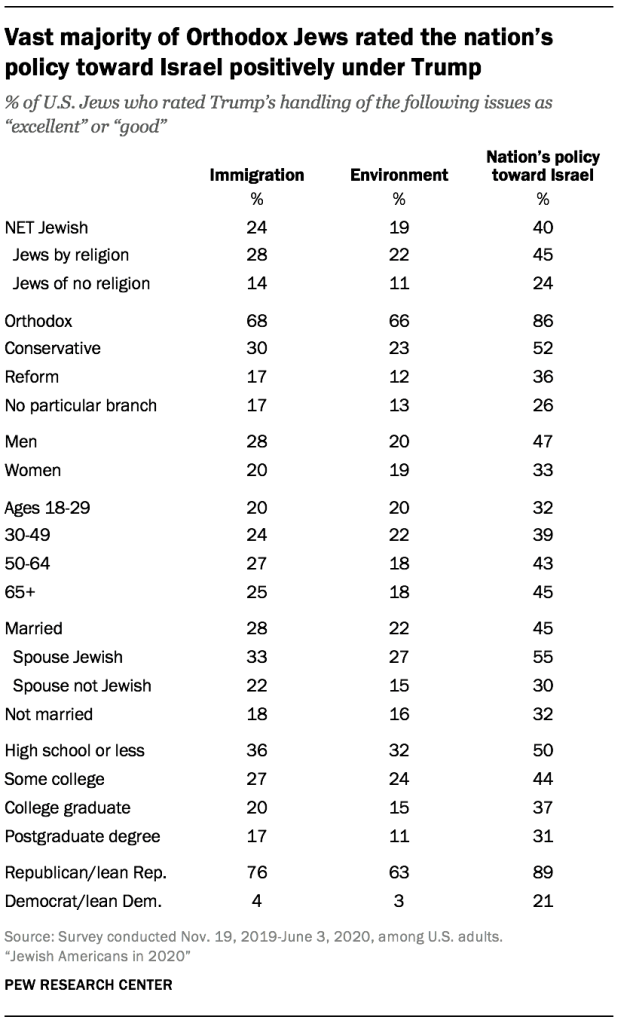
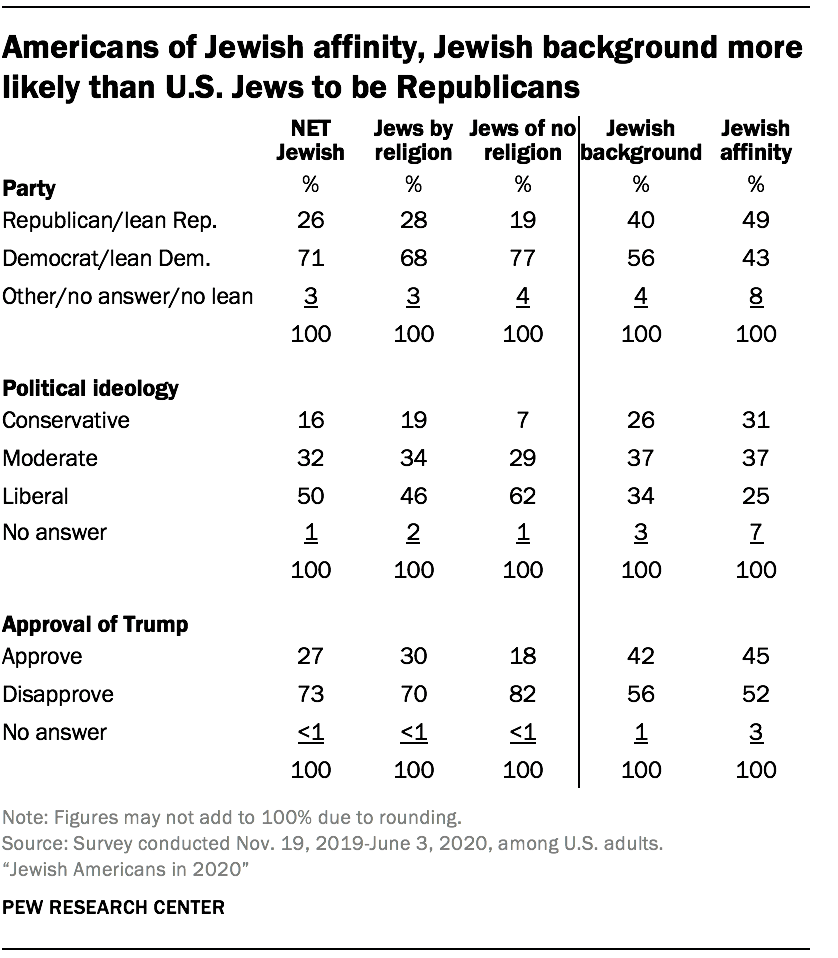
Politically, U.S. Jews on the whole tilt strongly liberal and tend to support the Democratic Party. When the new survey was fielded, from late fall 2019 through late spring 2020, 71% said they were Democrats or leaned Democratic. Among Jews of no religion, roughly three-quarters were Democrats or leaned that way. But Orthodox Jews have been trending in the opposite direction, becoming as solidly Republican as non-Orthodox Jews are solidly Democratic. In the run-up to the 2020 presidential election, 75% of Orthodox Jews said they were Republicans or leaned Republican, compared with 57% in 2013. And 86% of Orthodox Jews rated then-President Donald Trump’s handling of policy toward Israel as “excellent” or “good,” while a majority of all U.S. Jews described it as “only fair” or “poor.”

While these generational shifts toward both Orthodoxy and secular Jewishness have the potential, in time, to reshape American Jewry, the new survey paints a portrait of Jewish Americans in 2020 that is not dramatically different from 2013. Counting all Jewish adults – young and old, combined – the percentages who identify as Orthodox, Conservative and Reform are little changed. The size of the adult Jewish population is also remarkably stable in percentage terms, while rising in absolute numbers, roughly in line with the total U.S. population.

Pew Research Center estimates that as of 2020, 2.4% of U.S. adults are Jewish, including 1.7% who identify with the Jewish religion and 0.6% who are Jews of no religion. By comparison, the 2013 estimate for “net Jews” was 2.2%, including 1.8% who were Jews by religion and 0.5% who were Jews of no religion. (These figures are rounded to one decimal. Given the expected range of precision for two surveys of this size and complexity, it is safer to say that the adult Jewish population has roughly kept pace with change in the U.S. population than to focus on small differences in the 2013 and 2020 incidence rates.)

In absolute numbers, the 2020 Jewish population estimate is approximately 7.5 million, including 5.8 million adults and 1.8 million children (rounded to the closest 100,000). The 2013 estimate was 6.7 million, including 5.3 million adults and 1.3 million children. The precision of these population estimates should not be exaggerated; they are derived from a sample of the U.S. public that is very large compared with most surveys (more than 68,000 interviews) but are still subject to sampling error and other practical difficulties that produce uncertainty. Furthermore, the size of the Jewish population greatly depends on one’s definition of who counts as Jewish. For more details on the 2020 population estimates, including alternative definitions of Jewishness, see Chapter 1.

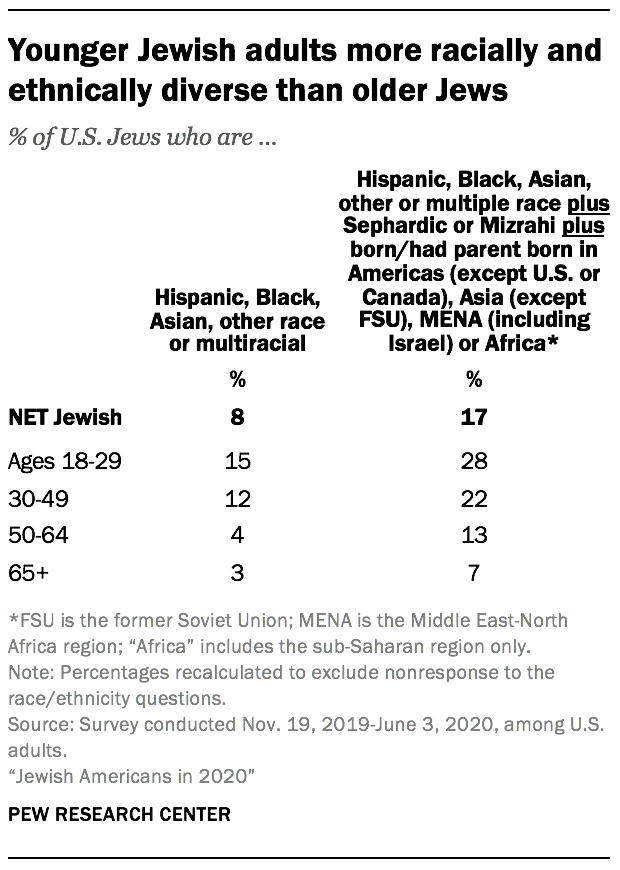
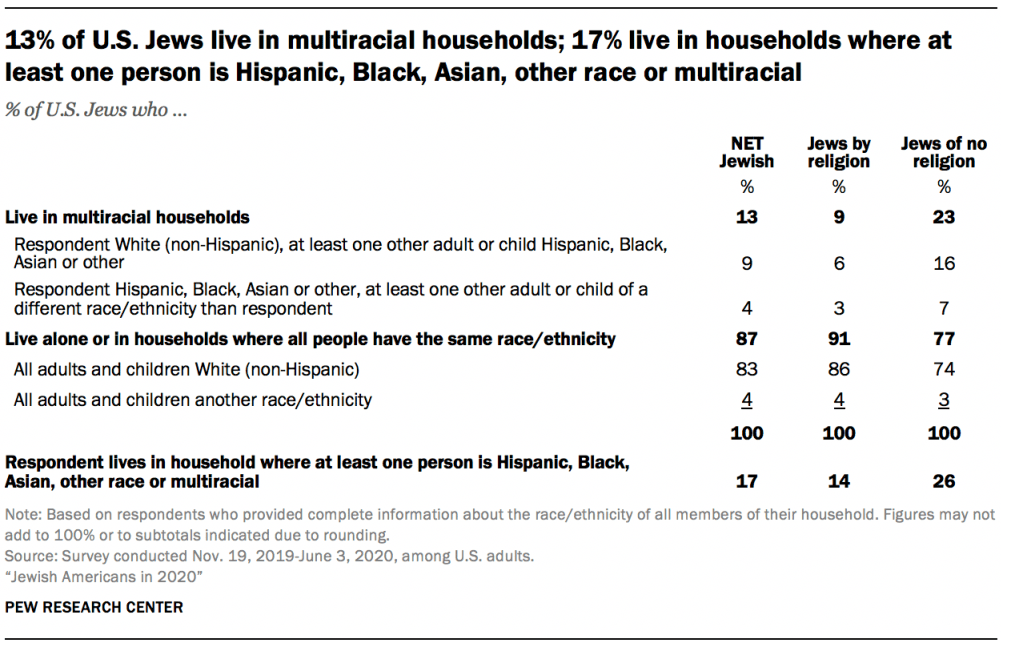
The new survey continues to find that Jewish Americans, on average, are older, have higher levels of education, earn higher incomes, and are more geographically concentrated in the Northeast than Americans overall. There is also evidence that the U.S. Jewish population is becoming more racially and ethnically diverse. Overall, 92% of Jewish adults identify as White (non-Hispanic), and 8% identify with all other categories combined. But among Jews ages 18 to 29, that figure rises to 15%. Already, 17% of U.S. Jews surveyed live in households in which at least one child or adult is Black, Hispanic, Asian, some other (non-White) race or ethnicity, or multiracial.1

Although in many ways the U.S. Jewish population is flourishing, concerns about anti-Semitism have risen among American Jews. Three-quarters say there is more anti-Semitism in the United States than there was five years ago, and just over half (53%) say that “as a Jewish person in the United States” they feel less safe than they did five years ago. Jews who wear distinctively religious attire, such as a kippa or head covering, are particularly likely to say they feel less safe. But the impact on behavior seems to be limited: Even among those who feel less safe, just one-in-ten – or 5% of all U.S. Jews – report that they have stayed away from a Jewish event or observance as a result.

These are among the key findings of Pew Research Center’s new survey of U.S. Jews, conducted from Nov. 19, 2019, to June 3, 2020, among 4,718 Jews across the country who were identified through 68,398 completed screening interviews conducted by mail and online.

Comparisons between the new survey and the 2013 survey of Jewish Americans are complicated by a host of methodological differences. At the time the 2013 study was conducted, it used the best available methods for selecting a random, representative sample of Jews across the United States: dialing randomly generated telephone numbers and having live interviewers (real people, not recorded voices) ask a series of screening questions to identify respondents who consider themselves Jewish. By 2020, however, response rates to telephone surveys had declined so precipitously that random-digit dialing by telephone was no longer the best way to conduct a large, nationwide survey of a small subgroup of the U.S. public.

Instead, we sent letters to randomly selected residential addresses across the country, asking the recipients to go online to take a short screening survey. We also provided the option to fill out the survey on a paper form and return it by mail, so as not to limit the survey only to people who have access to the internet and are comfortable using it. These methods obtained a response rate (17%) similar to the 2013 survey’s (16%) and much higher than what telephone surveys now typically obtain (approximately 5%).

But, because of the differences between the ways the two surveys were conducted, this report is cautious about making direct comparisons of results on individual questions. For more information on how the new survey was conducted, see the Methodology. For guidance on whether 2020 survey questions can be compared with similar questions in the 2013 survey, see Appendix B.

Comparing 2020 survey results with 2013

Because the 2020 Pew Research Center survey of U.S. Jews was conducted by mail and online, the results on many questions are not directly comparable with the Center’s 2013 survey, which was conducted by telephone.

Years of research on survey methods shows that people tend to answer some questions differently when they are responding to a live interviewer on a telephone than when they are providing written answers in privacy, either online or on paper. Social scientists believe the differences are caused by a variety of factors, often including an unconscious tendency to give socially desirable answers when talking to another person.

However, not all survey questions are subject to this “social desirability bias.” To examine the impact of the methodological differences between the 2013 and 2020 surveys, Pew Research Center conducted an experiment with a separate group of 2,290 Jewish respondents, randomly assigning some to be interviewed by phone and others to answer the same questions online.

This experiment was not part of the actual survey; none of the experiment’s participants are counted as respondents in the main survey. But we have used the findings to help assess whether differences between the 2013 and 2020 results on particular questions represent real changes in the views of Jewish Americans over that seven-year period or, on the contrary, may just reflect the different “modes” (live interviewer vs. self-administered) in which the two surveys were conducted.

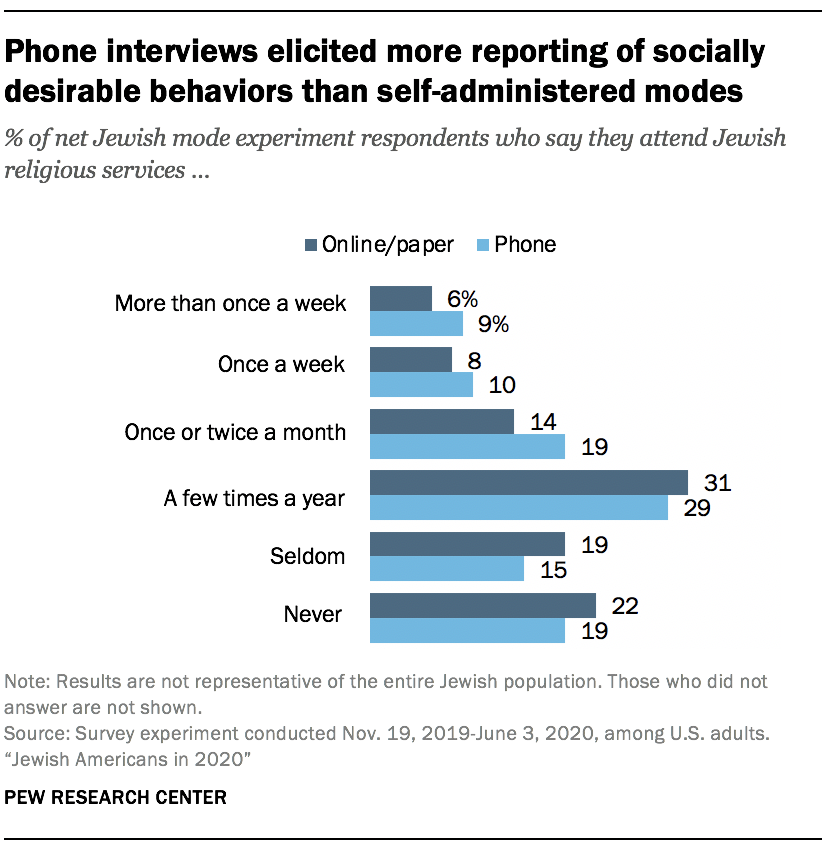
The mode experiment indicates that several questions about Jewish religious observance are subject to substantial social desirability bias in telephone polls. For example, the share of respondents who say they attend synagogue services at least monthly was 11 percentage points higher among those speaking with a live interviewer by telephone than among those responding on the web or by mail, in line with a pattern among Americans as a whole. The experiment also found differences in the way respondents answered questions about the importance of “being Jewish” and of religion in their lives. In addition, social desirability bias seems to affect the way U.S. Jews answer some questions about Israel, including how emotionally attached they feel toward the Jewish state.

Moreover, these “mode effects” are not the only potentially important difference between the two studies. They also used different strategies to sample Jews. It’s possible that the 2020 web/mail survey may not have been as effective as the 2013 phone survey at reaching segments of the Jewish population who are uncomfortable with going online or lack access to the Internet, while the new survey might have been more effective at reaching tech-savvy groups like young people. Even though all eligible respondents had an opportunity to complete the 2020 survey questionnaire on paper and return it in a postage-paid envelope, this might not have overcome the initial reluctance of some people – such as older Orthodox adults – to participate online. Whether this is actually the case or not is very difficult to determine, but it should be acknowledged as a possibility.

Bearing all these methodological differences in mind, Pew Research Center generally advises against comparing specific numbers or percentage-point estimates from the 2013 and 2020 surveys and assuming that any differences represent real change over a seven-year period.

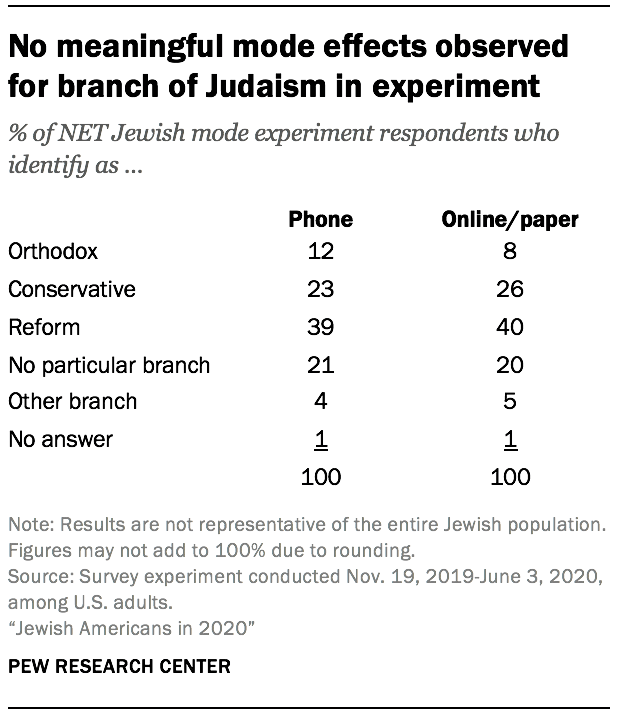
A few exceptions are noted, where relevant, in this report. For example, there appears to be little or no difference in the way Jewish Americans describe their institutional branch or stream of Judaism (e.g., Orthodox, Conservative, Reform, etc.) when speaking on the telephone versus answering online or by mail.

For more information on the mode experiment, see Appendix B.

Branches of American Judaism

Jewish denominational identity largely steady since 2013

The 2020 survey finds that slightly over half of all U.S. Jews (54%) belong to the two long-dominant branches of American Judaism: 37% identify as Reform and 17% as Conservative. Those figures are essentially unchanged from 2013, when a total of 54% identified with either the Reform movement (35%) or Conservative Judaism (18%).2

The share of all Jewish adults who describe themselves as Orthodox is also about the same in 2020 (9%) as it was in 2013 (10%). Other branches, such as the Reconstructionist movement and Humanistic Judaism, total about 4%, very similar to in 2013 (6%). And the share of Jewish adults who do not identify with any particular stream or institutional branch of Judaism is now 32%, roughly on par with the 2013 survey (30%).

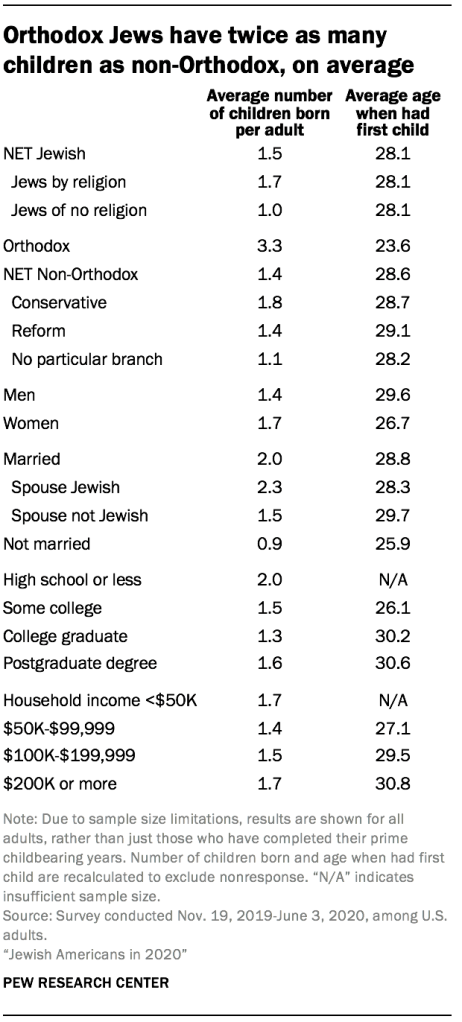
In broad strokes, the characteristics of these groups also are similar in 2020 to what they were in 2013. On average, the Orthodox are the most traditionally observant and emotionally attached to Israel; they tend to be politically conservative, with large families, very low rates of religious intermarriage and a young median age (35 years).3

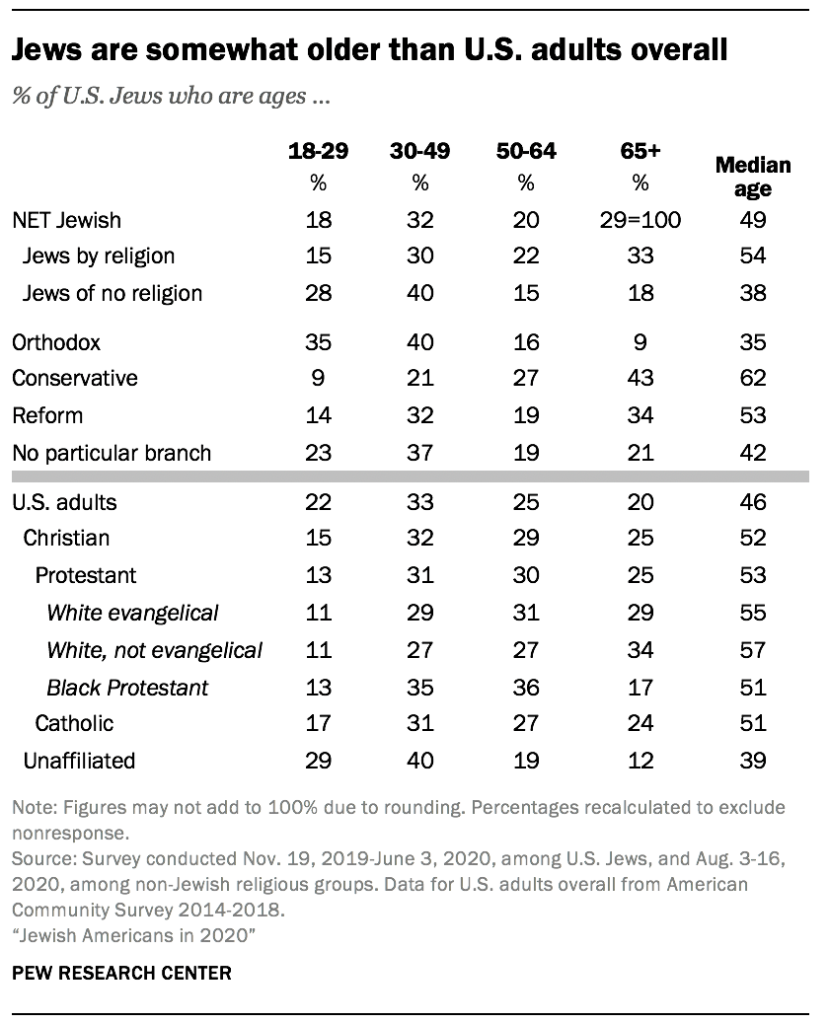
Conservative Jews are older than Jews who identify with other streams

Conservative and Reform Jews tend to be less religiously observant in traditional ways, like keeping kosher and regularly attending religious services, but many in these groups participate in Jewish cultural activities, and most are at least somewhat attached to Israel. Demographically, they have high levels of education, small families, higher rates of intermarriage than the Orthodox and an older age profile (median age of 62 for Conservative, 53 for Reform).

There is a fair amount of overlap – though it is far from complete – between the 32% of Jewish adults who do not consider themselves members of any branch or denomination of American Judaism and the 27% who are categorized as “Jews of no religion.”4 Survey respondents who say their religion is Jewish are categorized as “Jews by religion” no matter what their branch identity or levels of observance. Those who describe their religion as atheist, agnostic or nothing in particular but who have a Jewish parent or were raised Jewish and say that aside from religion they consider themselves Jewish in some way – such as ethnically, culturally or because of their family background – are also fully included in the Jewish population throughout this report. Survey researchers call them Jews of “no religion” because they do not identify with Judaism or any other religion.5

As in 2013, Jews of no religion stand out in 2020 for low levels of religious participation – particularly synagogue membership and attendance – together with comparatively weak attachments to Israel, feelings of belonging to the Jewish people and engagement in communal Jewish life. They tend to be politically liberal and highly educated, with relatively high rates of intermarriage and a low median age (38 years).

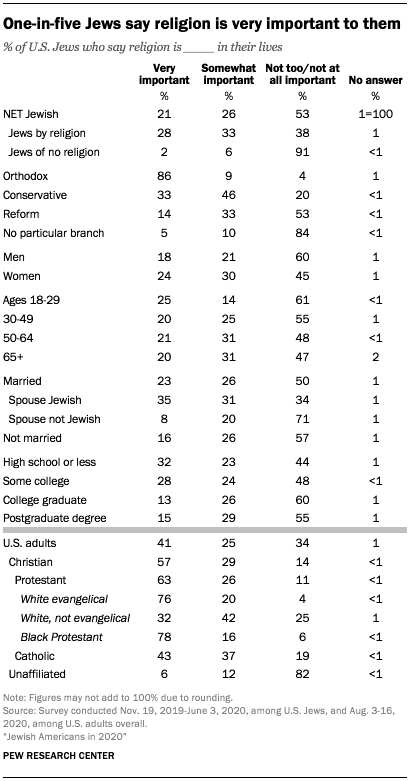
One way to illustrate the divergence between Jews at opposite ends of the religious spectrum is to widen the lens and look at religion in the United States more broadly. Orthodox Jews are among the most highly religious groups in U.S. society in terms of the share who say religion is very important in their lives (86%) – along with Black Protestants (78%) and White evangelicals (76%). Jews of no religion are among the country’s least religious subgroups – even more inclined than unaffiliated U.S. adults (sometimes called “nones”) to say that religion is “not too important” or “not at all important” to them (91% vs. 82%).6

Who counts as Jewish in the survey

This 2020 Pew Research Center survey takes the same basic approach to defining Jewishness among U.S. adults and uses the same categories that the Center’s 2013 survey did.

As the earlier report explained, “Who is a Jew?” is an ancient question with no single, timeless answer. It is clear from questions in the survey itself that some Jews view Jewishness mainly as a matter of religion, while others see it as a matter of culture, ancestry or some combination of all three traits. Consequently, we sought to cast a wide net, using a screening questionnaire (“the screener”) to determine if respondents consider themselves Jewish in any of those ways.

In 2013, one of the screening questions asked:

Aside from religion, do you consider yourself Jewish or partially Jewish? 

On the recommendation of a panel of academic advisers, researchers modified that question in 2020 to say:

Aside from religion, do you consider yourself to be Jewish in any way (for example, ethnically, culturally or because of your family’s background)?

Questions about the respondent’s spouse and other household members were modified similarly.

Respondents were deemed eligible to take the full, longer survey if they indicated any of the following: (a) their religion is Jewish; or (b) aside from religion, they consider themselves Jewish in any way; or (c) they had a Jewish parent or were raised Jewish.

For the purposes of analysis in this report, however, the definition of Jewishness is narrower. The main categories are:

Jews by religion – people who say their religion is Jewish and who do not profess any other religion

Jews of no religion – people who describe themselves (religiously) as atheist, agnostic or nothing in particular, but who have a Jewish parent or were raised Jewish, and who still consider themselves Jewish in any way (such as ethnically, culturally or because of their family background)

These two groups together comprise the total or “net” Jewish population – also referred to as U.S. Jews or Jewish Americans throughout this report.

How respondents are categorized

As in 2013, respondents who say they are Jewish and any other religion (such as Christian) are not included in the net Jewish category. Nor are respondents who indicate they have a Jewish parent or were raised Jewish but who say they do not consider themselves Jewish today in any way.

For more information on the 2020 survey sample, see the box “How we did this” and the Methodology.

Sources of unity and division

While there are some signs of religious divergence and political polarization among U.S. Jews, the survey also finds large areas of consensus. For instance, more than eight-in-ten U.S. Jews say that they feel at least some sense of belonging to the Jewish people, and three-quarters say that “being Jewish” is either very or somewhat important to them.

As in 2013, the 2020 survey asked Jewish Americans whether a list of causes and activities are “essential,” “important but not essential” or “not important” to what being Jewish means to them. Because of methodological differences in the way the survey was conducted and the addition of one item to the list, the results from 2020 on particular items may not be directly comparable to 2013, but the broad pattern of responses is similar in many ways.7

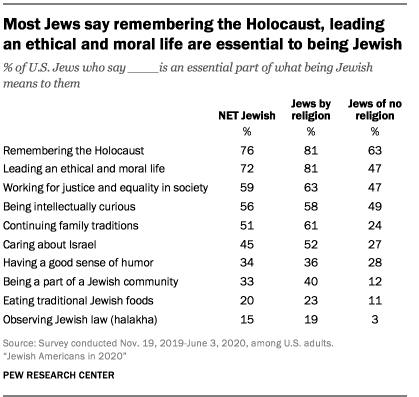
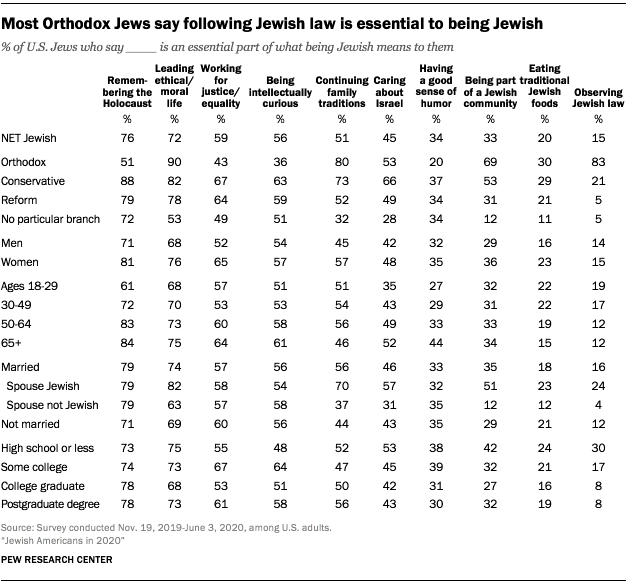
Seven-in-ten or more U.S. Jews say that remembering the Holocaust (76%) and leading a moral and ethical life (72%) are essential to their Jewish identity. About half or more also say that working for justice and equality in society (59%), being intellectually curious (56%) and continuing family traditions (51%) are essential. Far fewer consider eating traditional Jewish foods (20%) and observing Jewish law (15%) to be essential elements of what being Jewish means to them, personally. However, the observance of halakha – Jewish law – is particularly important to Orthodox Jews, 83% of whom deem it essential.

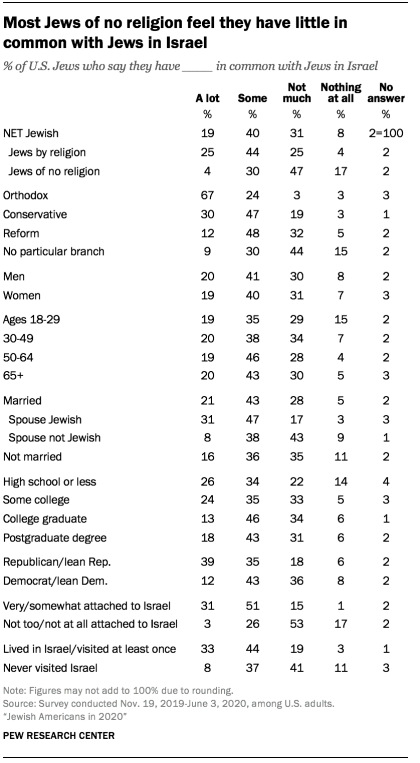
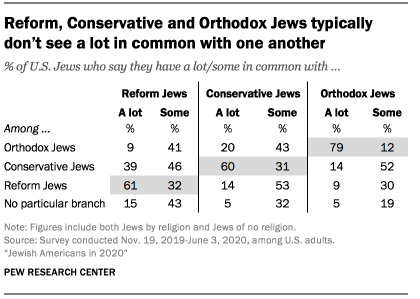
Views on halakha are just one of many stark differences in beliefs and behaviors between Orthodox Jews and Jewish Americans who identify with other branches of Judaism (or with no particular branch) that are evident in the survey, and that may affect how these groups perceive each other. For example, about half of Orthodox Jews in the U.S. say they have “not much” (23%) or “nothing at all” (26%) in common with Jews in the Reform movement; just 9% feel they have “a lot” in common with Reform Jews.

Reform Jews generally reciprocate those feelings: Six-in-ten say they have not much (39%) or nothing at all (21%) in common with the Orthodox, while 30% of Reform Jews say they have some things in common, and 9% say they have a lot in common with Orthodox Jews.

In fact, both Conservative and Reform Jews are more likely to say they have “a lot” or “some” in common with Jews in Israel (77% and 61%, respectively) than to say they have commonalities with Orthodox Jews in the United States. And Orthodox Jews are far more likely to say they have “a lot” or “some” in common with Israeli Jews (91%) than to say the same about their Conservative and Reform counterparts in the U.S.

Jewish branches see most commonality with members of their own branch

U.S. Jews less religious than U.S. adults overall, but some Jewish trends reflect broader American context

Jews less likely than Americans overall to attend religious services weekly, believe in God of the Bible

When it comes to religion, U.S. Jews are in many ways distinctive from the wider U.S. public – and not just in their engagement with specifically Jewish beliefs and practices.

In general, Jews are far less religious than American adults as a whole, at least by conventional measures of religious observance in Pew Research Center surveys. For example, one-in-five Jews (21%) say religion is very important in their lives, compared with 41% of U.S. adults overall. And 12% of Jewish Americans say they attend religious services weekly or more often, versus 27% of the general public.

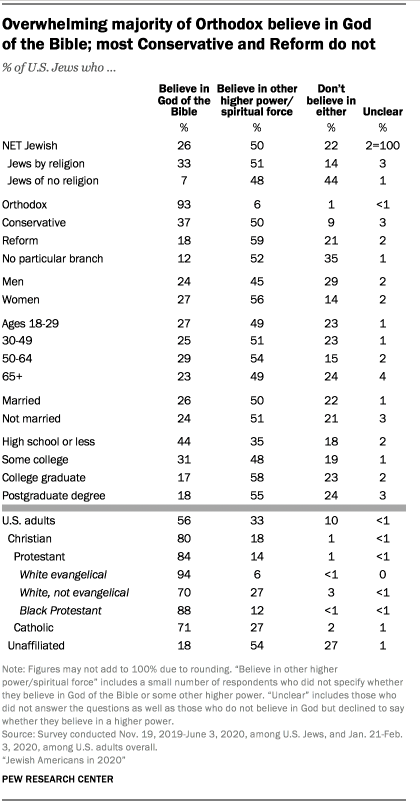
There are even bigger gaps when it comes to belief in God. A majority of all U.S. adults say they believe in God “as described in the Bible” (56%), compared with about a quarter of Jews (26%). Jewish Americans are more inclined to believe in some other kind of higher power – or no higher power at all.

At the same time, however, the trends playing out among American Jews are similar to many patterns in the broader population. The most obvious of these is growing religious disaffiliation: The percentage of U.S. Jews who do not claim any religion (27%) – i.e., who identify as atheist, agnostic or “nothing in particular,” religiously – is virtually identical to the percentage of U.S. adults overall in these categories (28%).

In addition, intermarriage is not just a Jewish phenomenon. Religious intermarriage also appears to be on the rise in the U.S. adult population more broadly. The same is true for rising levels of racial and ethnic diversity, which is happening in most U.S. religious groups as the country’s population as a whole becomes more diverse. Finally, the fact that Orthodox Jews tend to have more children aligns with a general pattern in which highly religious Americans have higher fertility rates than non-religious ones.

Why Jews go, or don’t go, to religious services

Most U.S. Jews who attend synagogue regularly say they find it spiritually meaningful to go

Left unanswered by the 2013 study was why many Jewish Americans, particularly in younger cohorts, rarely attend synagogue, and in what ways, if any, they connect with Judaism or other Jews.

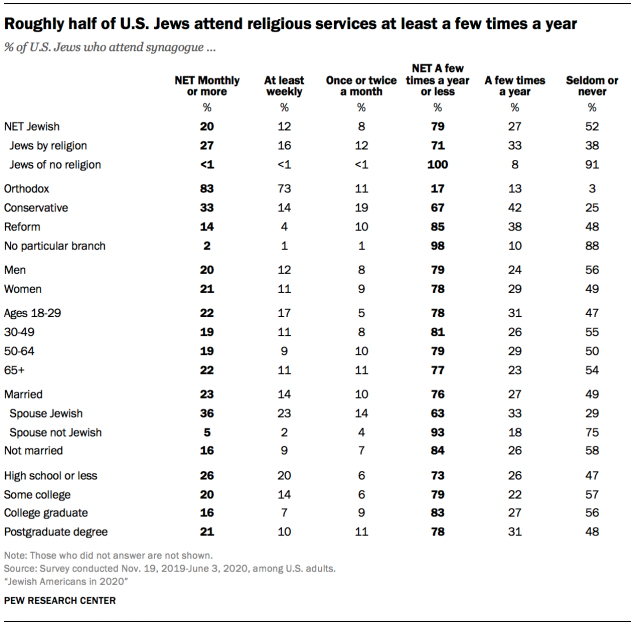
The 2020 survey includes some new questions designed to help explore those issues. To begin with, Jews who say they attend services at a synagogue, temple, minyan or havurah at least once a month – 20% of Jewish adults – were asked what draws them to religious services. Those who attend services a few times a year or less were asked what keeps them away; this group makes up nearly eight-in-ten U.S. Jews (79%).

Of nine possible reasons for attending Jewish services offered in the survey, the most commonly chosen is “Because I find it spiritually meaningful.” Nine-in-ten regular attenders say this is a reason they go to services (92%), followed closely by “Because I feel a sense of belonging” (87%) and “To feel connected to my ancestry or history” (83%). About two-thirds (65%) say they feel a religious obligation, and Orthodox Jews are especially likely to give this reason (87%). Fewer Jewish congregants say they go to religious services to please a spouse or family member (42%) or because they would feel guilty if they did not participate (22%).

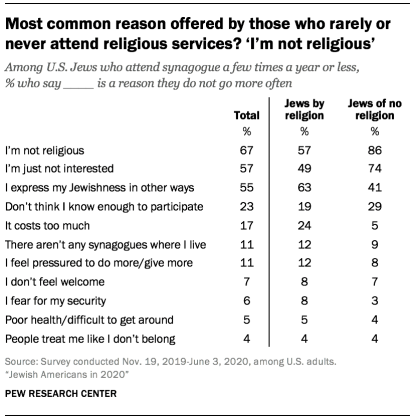
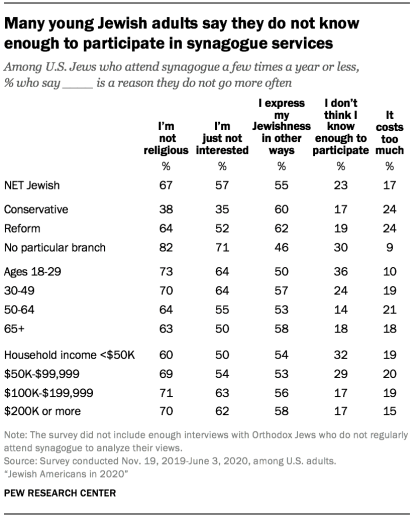
Of 11 possible reasons for not attending religious services, the top choice is “I’m not religious.”  Two-thirds of infrequent attenders say this is a reason they do not go to services more often. Other common explanations are “I’m just not interested” (57%) and “I express my Jewishness in other ways” (55%). Fewer say “I don’t know enough to participate” (23%), “I feel pressured to do more or give more” (11%), “I don’t feel welcome” (7%), “I fear for my security” (6%) or “People treat me like I don’t really belong” (4%).

The degree to which finances are a barrier seems to vary by age. Although some Jewish leaders believe that synagogue membership fees are keeping away young people, younger Jewish adults (under age 30) are somewhat less likely than those who are older to say they don’t attend religious services because “it costs too much” (10% vs. 19%). For perspective on this question from in-depth interviews with congregational rabbis, see the sidebar, “Most U.S. Jews don’t go to synagogue, so rabbis and a host of new organizations are trying to innovate” in Chapter 3.

For more analysis of these questions, see Chapter 3.

Cultural engagement

In addition to traditional forms of religious observance, such as attending a synagogue, many Jewish Americans say they engage in cultural Jewish activities such as enjoying Jewish foods, visiting Jewish historical sites and reading Jewish literature.

Most U.S. Jews at least sometimes eat Jewish foods, share Jewish culture with non-Jews

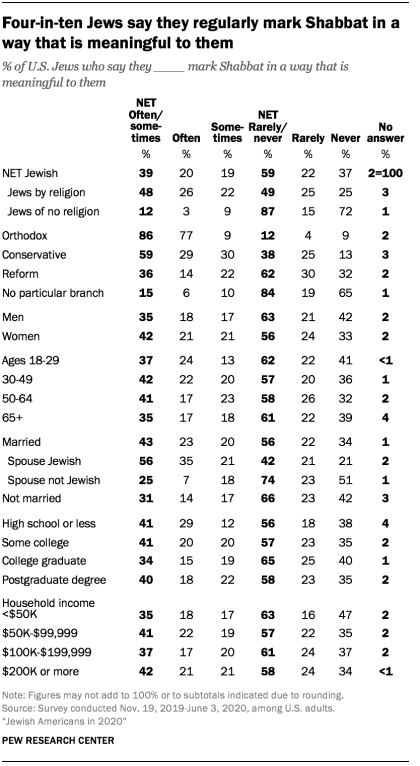
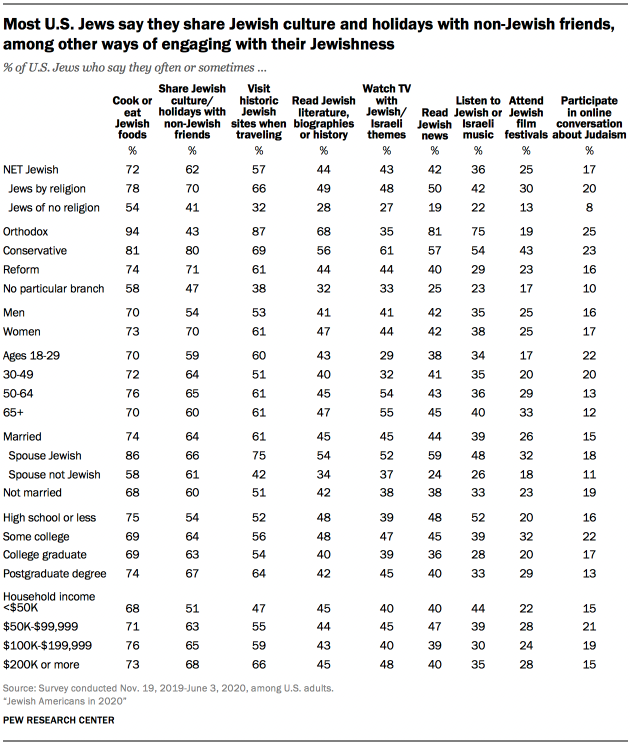
Young Jewish adults report engaging in many of these activities at rates roughly equal to older U.S. Jews. Among Jews ages 18 to 29, for example, 70% say they often or sometimes cook or eat traditional Jewish foods, identical to the percentage of Jews 65 and older who do the same. And 37% of the youngest Jewish adults say they at least sometimes mark Shabbat in a way that makes it meaningful to them (though not necessarily in a way that follows Jewish law, such as abstaining from work), as do 35% of Jews who are 65 and older.

Overall, however, it’s not the case that Jewish cultural activities or individualized, do-it-yourself religious observances are directly substituting for synagogue attendance and other traditional forms of Jewish observance. More often, they are complementing traditional religious participation. Statistical analysis indicates that people who are highly observant by traditional measures – on a scale combining synagogue attendance, keeping kosher, fasting on Yom Kippur and participating in a Passover Seder – also tend to report the highest participation rates in the 12 cultural Jewish activities mentioned in the survey, such as reading Jewish publications, listening to Jewish music and going to Jewish film festivals.8

Those who are low on the scale of traditional religious observance, meanwhile, tend to be much less active in the vibrant array of cultural activities available to U.S. Jews in the 21st century. In fact, no more than about one-in-ten low-observance Jews say they often do any of the dozen things mentioned in the survey.

For example, among highly observant Jews, 31% say they often listen to Jewish or Israeli music, compared with 7% of those with a medium level of traditional observance and just 2% of those who are low on the observance scale. There are similar patterns on other questions: 64% of highly observant Jews often cook or eat traditional Jewish foods, eight times the share of low-observance Jews who say the same (8%).

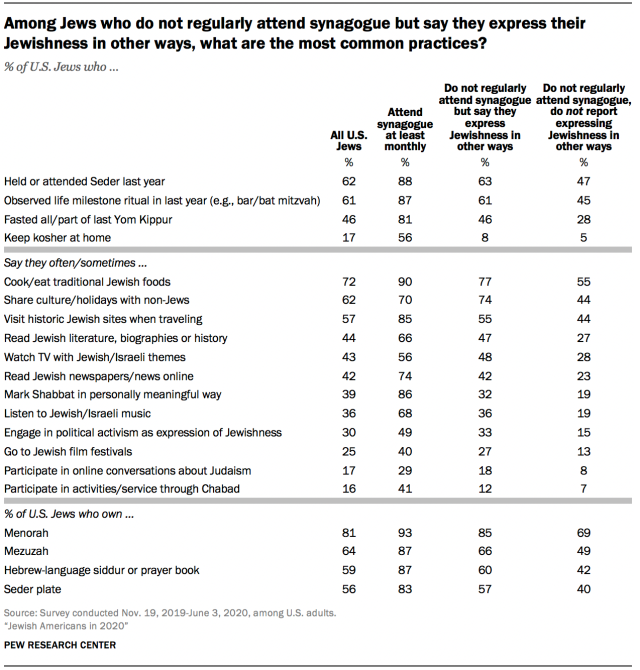
At the same time, the survey finds that many Jews who answered a different question by saying they don’t go to religious services because they “express [their] Jewishness in other ways” do engage in cultural activities, at least on occasion. About three-quarters report that they sometimes or often enjoy Jewish foods (77%) and share Jewish culture or holidays with non-Jewish friends (74%), while many also visit historic Jewish sites when traveling (55%) and read Jewish literature (47%).

See Chapter 3 for more analysis of these questions.

Jews with higher levels of traditional religious observance are more likely than those with lower levels to participate in many cultural Jewish activities

Most U.S. Jews perceive a rise in anti-Semitism

In the wake of a series of murderous attacks on Jewish Americans – at the Tree of Life synagogue in Pittsburgh in October 2018; Chabad of Poway synagogue in Poway, California, in April 2019; and a kosher grocery store in Jersey City, New Jersey, in December 2019 – the 2020 survey posed many more questions about anti-Semitism than the 2013 survey did.

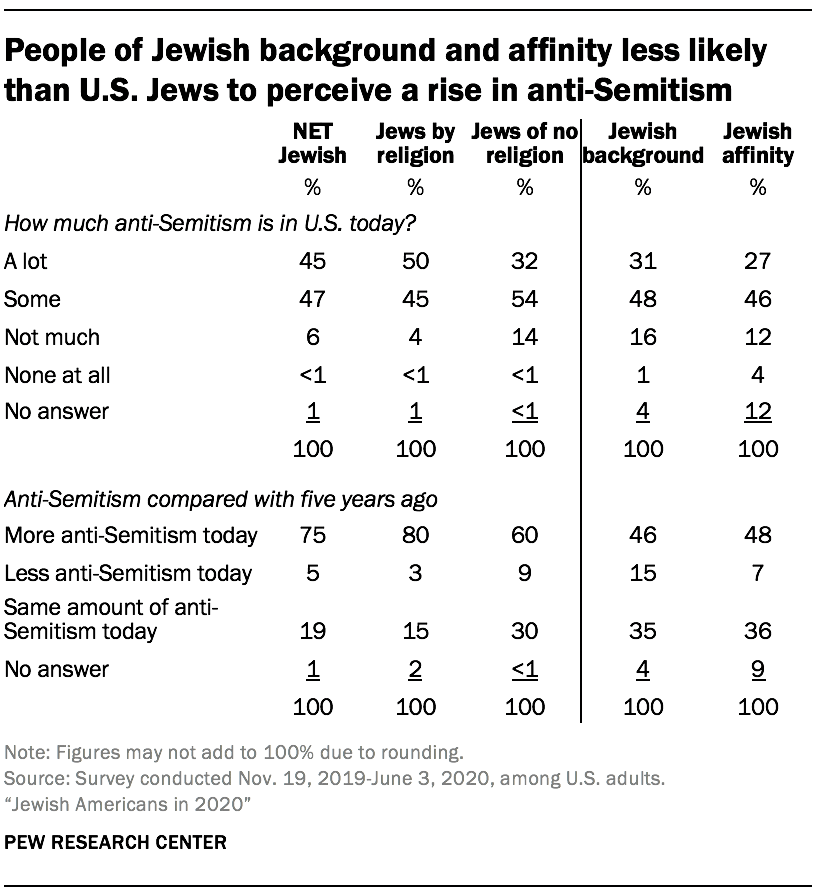
More than nine-in-ten U.S. Jews say there is at least “some” anti-Semitism in the United States, including 45% who say there is “a lot” of anti-Semitism. Just 6% say there is not much anti-Semitism, and close to zero (fewer than 1%) say there is none at all.

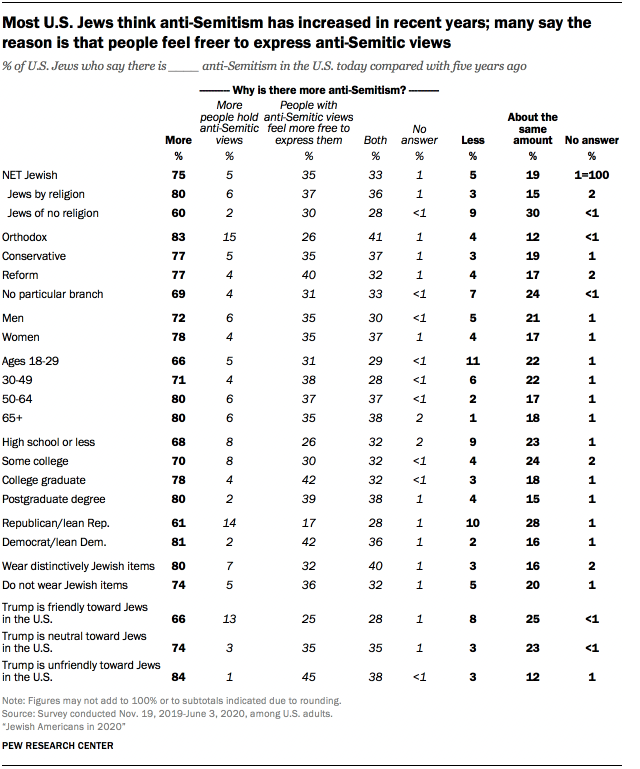
Moreover, three-quarters (75%) say there is more anti-Semitism in the United States than there was five years ago. Just 5% say there is less, and 19% perceive little or no change, saying there is about the same amount of anti-Semitism as there was five years ago.

Among those who perceive an increase in anti-Semitism over the last five years, relatively few (5% of all U.S. Jews) think it has occurred solely “because there are now more people who hold anti-Semitic views.” The vast majority say that anti-Semitism has increased in the United States either because people who hold anti-Semitic views “now feel more free to express them” (35%) or that both things have happened: The number of anti-Semites has grown andpeople now feel more free to express anti-Semitic views (33%).

Most Jews say there is more anti-Semitism than five years ago

The survey also sought to assess, in broad terms, the psychological impact of anti-Semitism on Jewish Americans and its possible chilling effect on Jewish community activities.

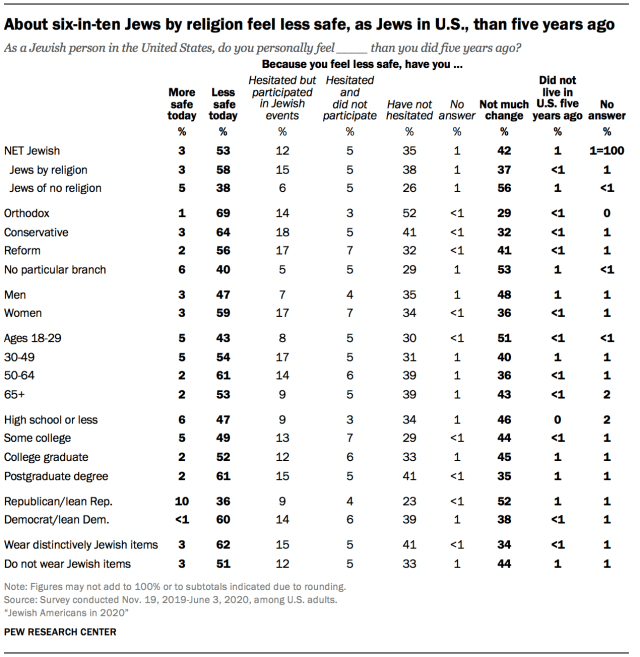
Slightly more than half of Jews surveyed (53%) say that, as a Jewish person in the United States, they personally feel less safe today than they did five years ago. Just 3% feel more safe, while 42% don’t sense much change. (An additional 1% say they did not live in the U.S. five years ago.) Jews who usually wear something in public that is recognizably Jewish (such as a kippa or head covering) are especially likely to feel less safe, as are Jewish women.

Jews who wear distinctively Jewish items are especially likely to say they feel less safe today

Those who say they feel less safe now were asked a follow-up question: Have you hesitated to participate in Jewish observances or events because you feel less safe than you did five years ago?

Two-thirds of those who feel less safe (or 35% of all Jewish adults) say they have not hesitated to participate in Jewish activities because of safety concerns. About one-quarter of those who feel less safe (12% of all U.S. Jewish adults) say they have hesitated but still participated in Jewish observances or events. And about one-in-ten Jews who say they feel less safe (5% of all U.S. Jewish adults) say they hesitated and chose not to participate in Jewish observances or events because of safety concerns.

Among U.S. Jews, 5% say they have not participated in Jewish events over safety concerns
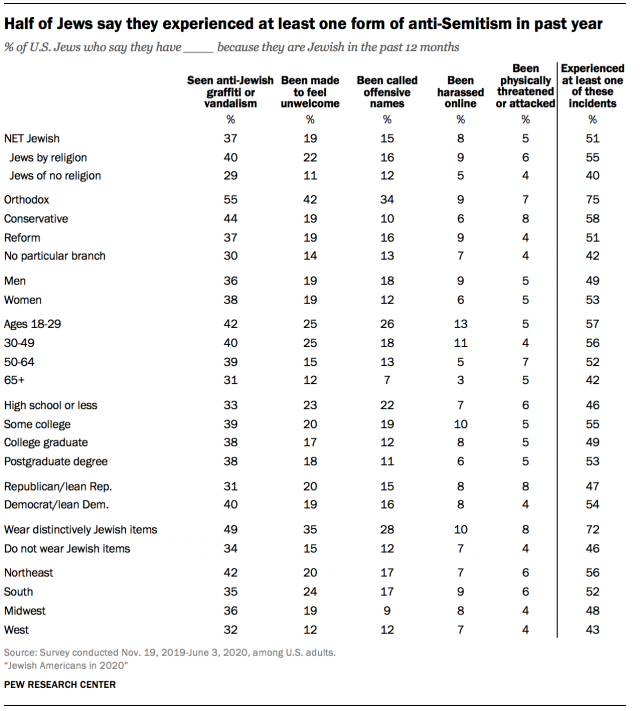
Orthodox Jews more likely to see anti-Jewish graffiti, be made to feel unwelcome or called offensive names

Jewish Americans report that they experience some forms of anti-Semitism much more often than other forms. For example, 37% say they have seen anti-Jewish graffiti or vandalism in their local community in the past 12 months, while 19% say they have been made to feel unwelcome because they are Jewish and 15% say they have been called offensive names. Fewer say that in the 12 months prior to taking the survey they have been harassed online (8%) or physically attacked (5%) because they are Jewish.

While reports of physical attacks are rare across the board, many of the other experiences of anti-Semitism are more common among younger Jews and Orthodox Jews (who often wear recognizably Jewish attire in public). For example, one-quarter of Jewish adults under the age of 30 say that in the past year they have been called offensive names because they are Jewish, compared with 10% of Jews ages 50 and older. And 55% of Orthodox Jews say they have seen anti-Jewish graffiti in their local community in the past year, compared with 37% of Reform Jews; this may be, at least in part, because Orthodox Jews are more likely to live in heavily Jewish neighborhoods.

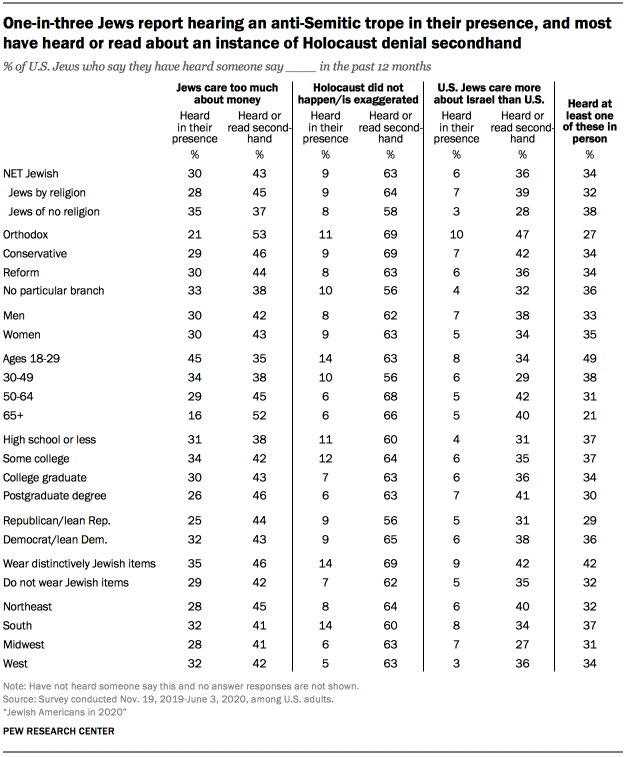
Most Jewish Americans also have been exposed in the past year to anti-Semitic tropes or stereotypes – though most report these as secondhand experiences, such as something they have seen on social media or read about in news stories. For example, about three-quarters of Jewish adults have heard someone claim that “Jews care too much about money,” including three-in-ten (30%) who say this was said in their presence in the past year and an additional 43% who say they have heard or read about this claim secondhand.

Similarly, 71% of U.S. Jews say they have heard or read about someone claiming in the past year that “the Holocaust did not happen or its severity has been exaggerated.” But most of these experiences have been secondhand (63%) rather than something said in their presence (9%). A smaller share of U.S. Jews have heard someone say that “American Jews care more about Israel than about the United States,” including 36% who have heard or read about this secondhand and 6% who have heard it directly in the last year.

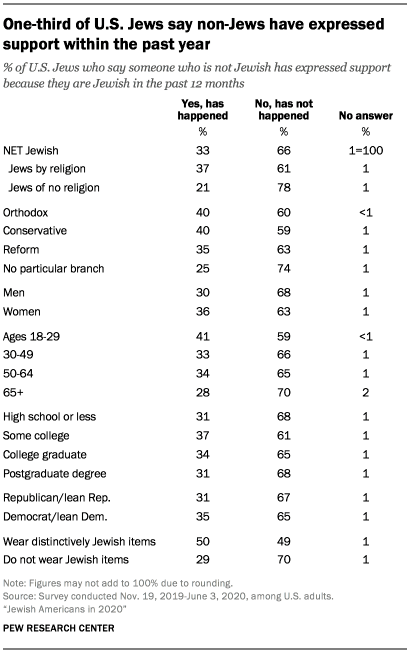
One-third of U.S. Jews report hearing a recent anti-Semitic trope in their presence

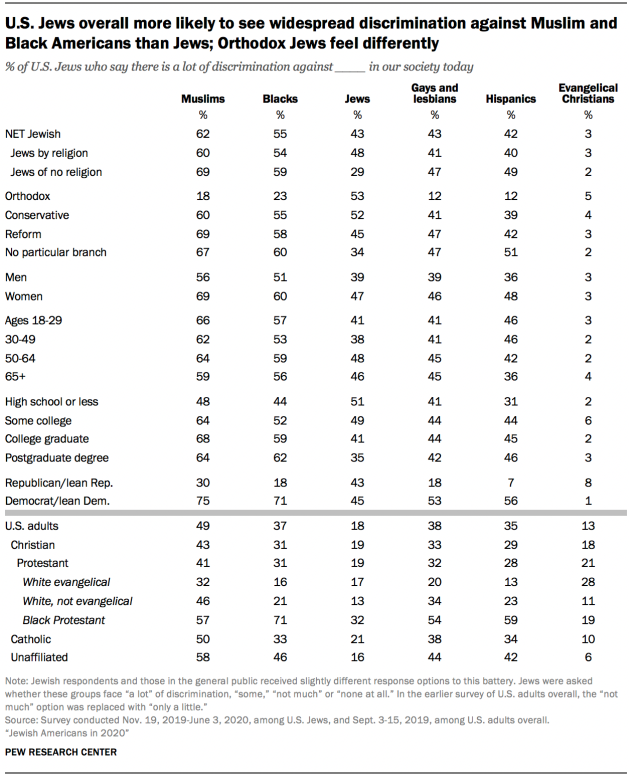
Despite these experiences with anti-Semitism, Jewish Americans tend to say that there is as much – or more – discrimination in U.S. society against several other groups (including Muslim, Black, Hispanic, and gay or lesbian Americans) as there is against Jews. This was true in the 2013 survey and remains the case in 2020.9

For more analysis of questions on discrimination and anti-Semitism, see Chapter 6.

Partisanship shapes views on Trump

Surveyed roughly five to 12 months before the 2020 presidential election, U.S. Jews expressed generally negative views of then-President Donald Trump: 73% of all Jewish adults (and 96% of Jews who are Democrats or lean Democratic) disapproved of his performance in office, while 27% gave him positive approval ratings (including 88% of Jews who are Republicans or lean Republican).

Jews were especially scornful of Trump’s handling of environmental and immigration issues: Eight-in-ten Jewish adults said he had done a “poor” or “only fair” job on the environment, and three-quarters said the same about his handling of immigration.

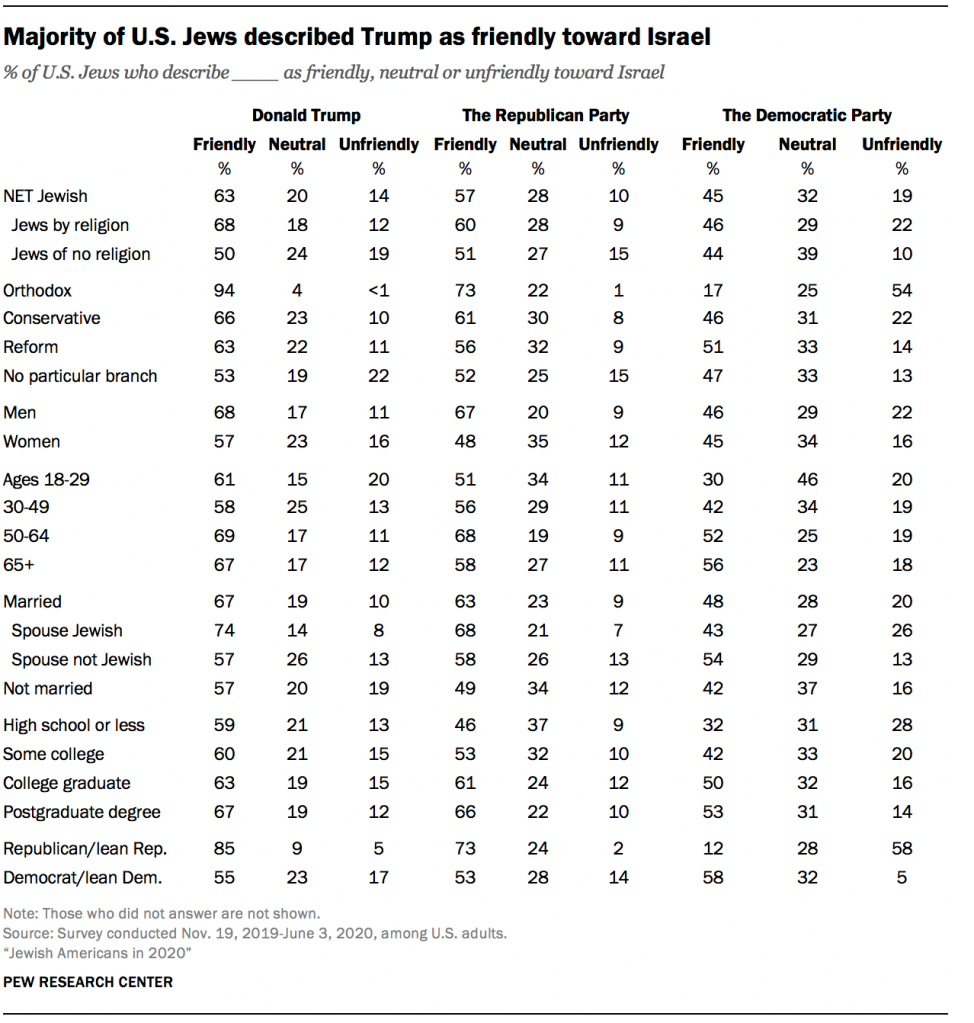
Most U.S. Jews perceived Trump as friendly toward Israel. About six-in-ten overall (63%) said this, including 55% of Jews who are Democrats or lean Democratic as well as 85% of those who are Republicans or lean Republican.

Majority of Jews describe Trump as friendly toward Israel, fewer describe him as friendly toward U.S. Jews

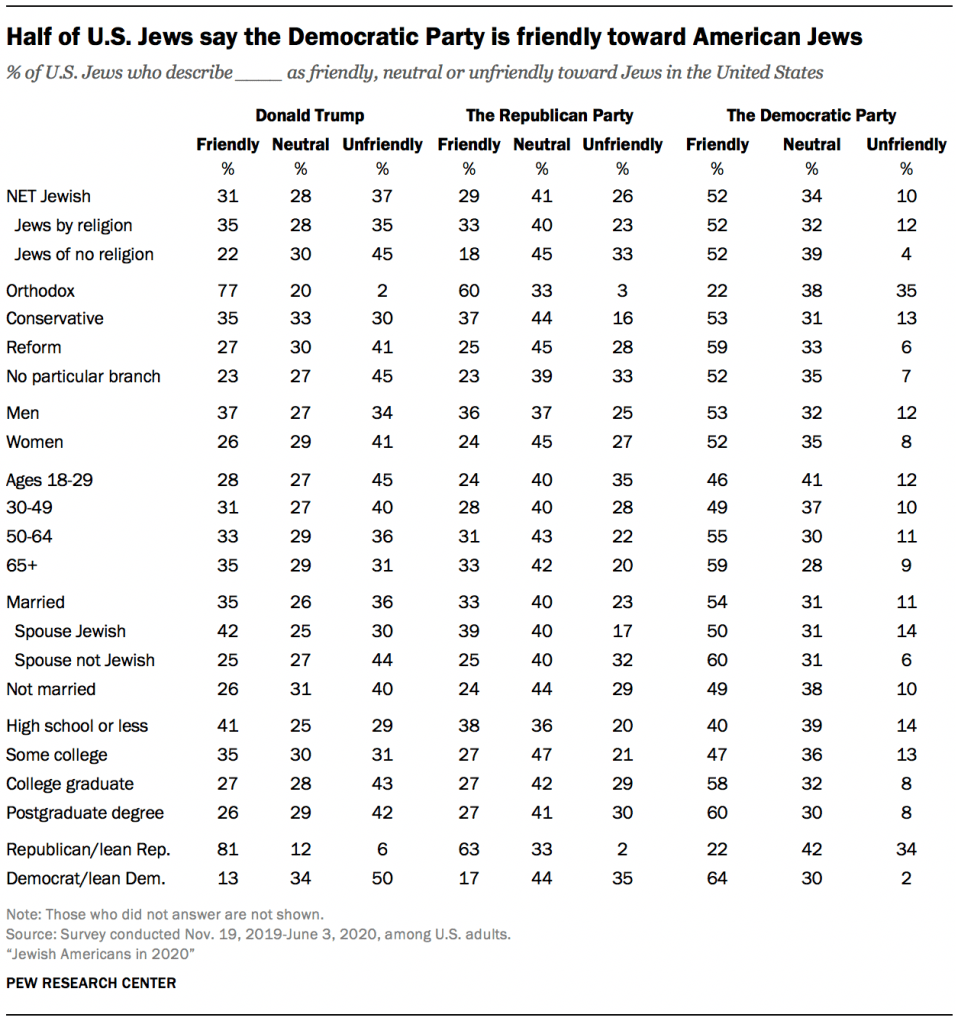
But there was less consensus among Jewish Americans over whether Trump was friendly toward Jews in the United States. About three-in-ten said he was friendly (31%), while 28% said he was neutral and 37% said he was unfriendlytoward U.S. Jews. These perceptions, however, were highly partisan: While a large majority of Jewish Republicans (81%) said Trump was friendly toward Jews in the United States, just 13% of Jewish Democrats agreed.

Even though most U.S. Jews perceived Trump as friendly toward Israel, that does not necessarily mean they looked positively on his policies toward the Jewish state. Indeed, most Jewish Americans rated Trump’s handling of U.S. policy toward Israel as “only fair” (23%) or “poor” (35%), while four-in-ten rated his handling of this policy as good (17%) or excellent (23%).10 Orthodox Jews were particularly inclined to give Trump high marks for his policies toward Israel (69% “excellent”).

Most Jews rated Trump’s handling of U.S. policy toward Israel as ‘only fair’ or ‘poor’

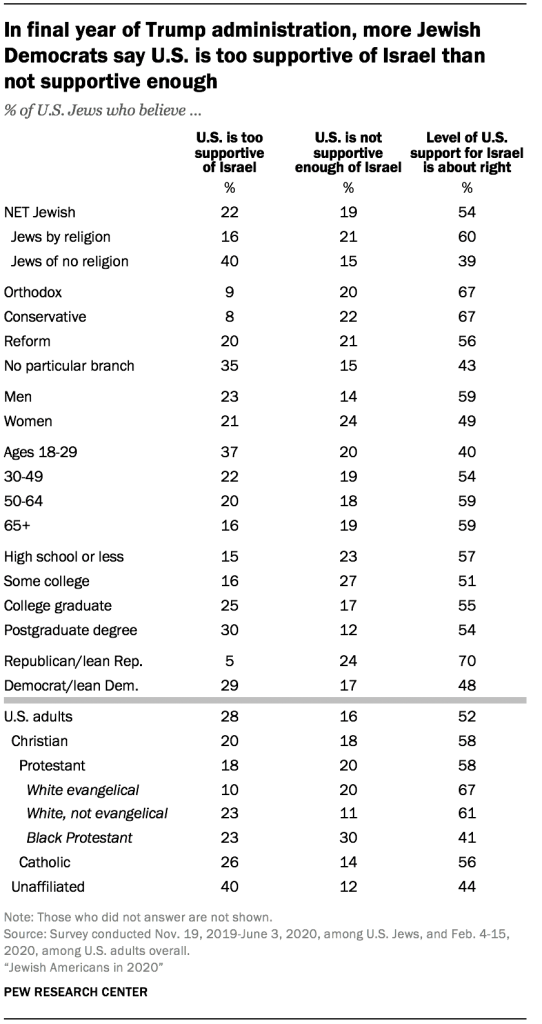
In the 2013 survey, which took place during the administration of President Barack Obama, one-in-ten Jewish Americans said U.S. policy was “too supportive” of Israel. Most said U.S. policy was either “not supportive enough” of Israel (31%) or “about right” (54%).

Seven years later, during the final 14 months of the Trump administration, just over half of Jewish adults (54%) still said the level of U.S. support for Israel was about right. But, by comparison with 2013, fewer said the U.S. was not supportive enough (19%), and more said U.S. policy was too supportive of Israel (22%).

Among Jewish adults under the age of 30, about four-in-ten (37%) took the position in 2020 that U.S. policy was too supportive of Israel, and fully half said Trump was handling policy toward Israel poorly.

Levels of connectedness with Israel

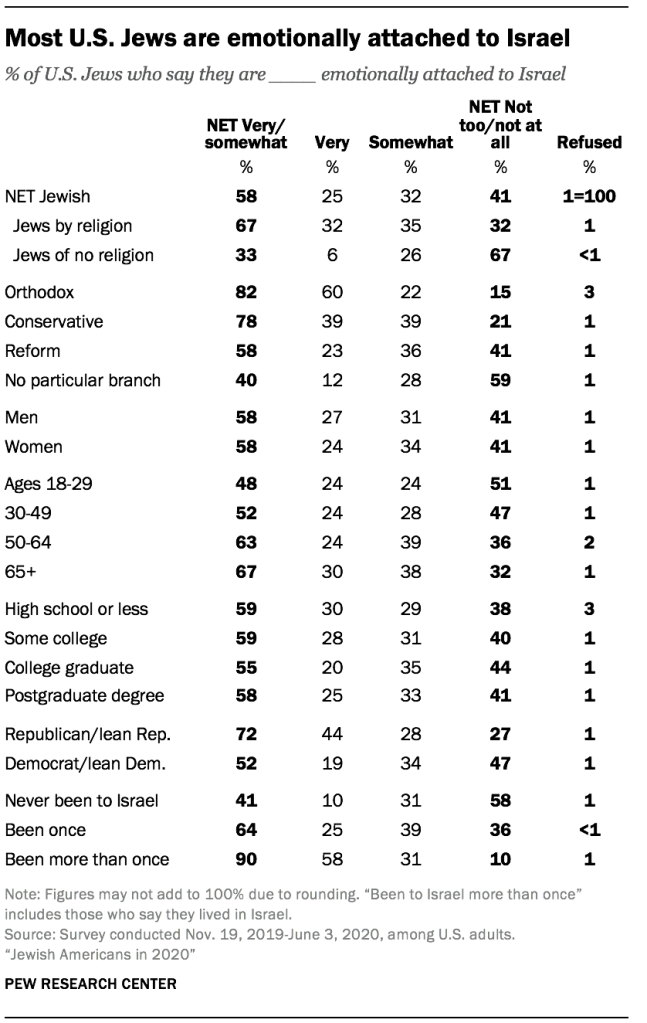
More broadly, young U.S. Jews are less emotionally attached to Israel than older ones. As of 2020, half of Jewish adults under age 30 describe themselves as very or somewhat emotionally attached to Israel (48%), compared with two-thirds of Jews ages 65 and older.

Older American Jews tend to feel more connected to Israel

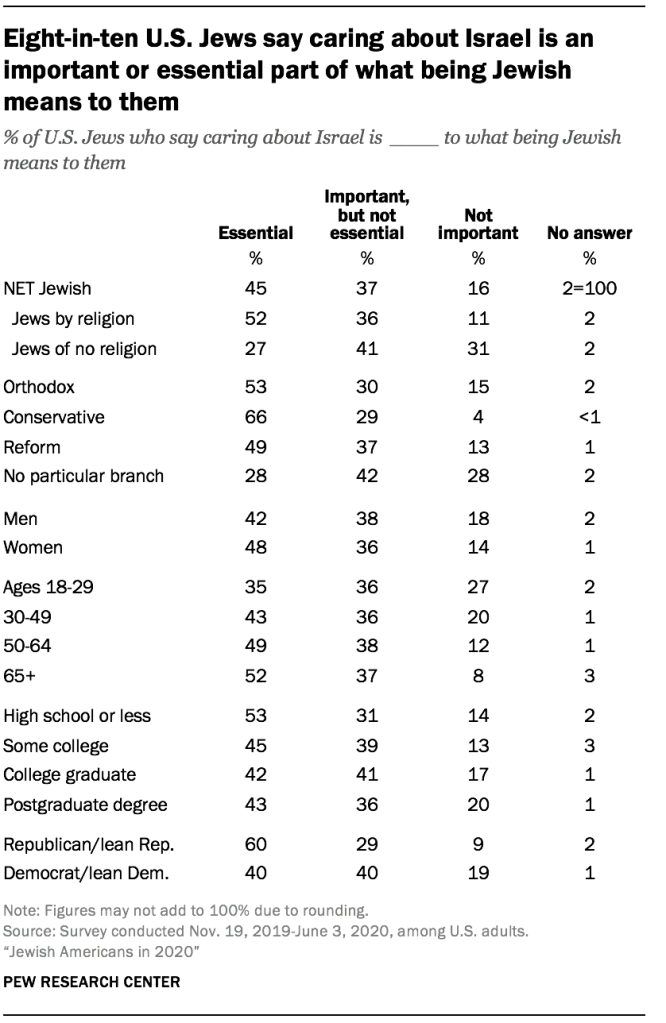
In addition, among Jews ages 50 and older, 51% say that caring about Israel is essential to what being Jewish means to them, and an additional 37% say it is important but not essential; just 10% say that caring about Israel is not important to them. By contrast, among Jewish adults under 30, one-third say that caring about Israel is essential (35%), and one-quarter (27%) say it’s not important to what being Jewish means to them.

The same pattern – lower levels of attachment to Israel among younger Jewish adults than among older ones – also was present in the 2013 survey. Because the 2013 survey was conducted by live interviewers over the telephone and the 2020 survey was self-administered by respondents online or on a paper questionnaire, the results on some questions are not directly comparable. This includes measures of attachment to Israel, and consequently it is difficult to know whether overall levels of attachment to Israel among Jewish Americans have changed over that seven-year period.

Racial and ethnic diversity among U.S. Jews

Younger Jewish adults are more racially and ethnically diverse

Being Jewish is an interconnected matter of religion, ethnicity, culture and ancestry. The survey sought to explore this dynamic by including questions about race and ethnicity (questions that are also intertwined with ancestry and culture), Jewish customs and geographic origin.11

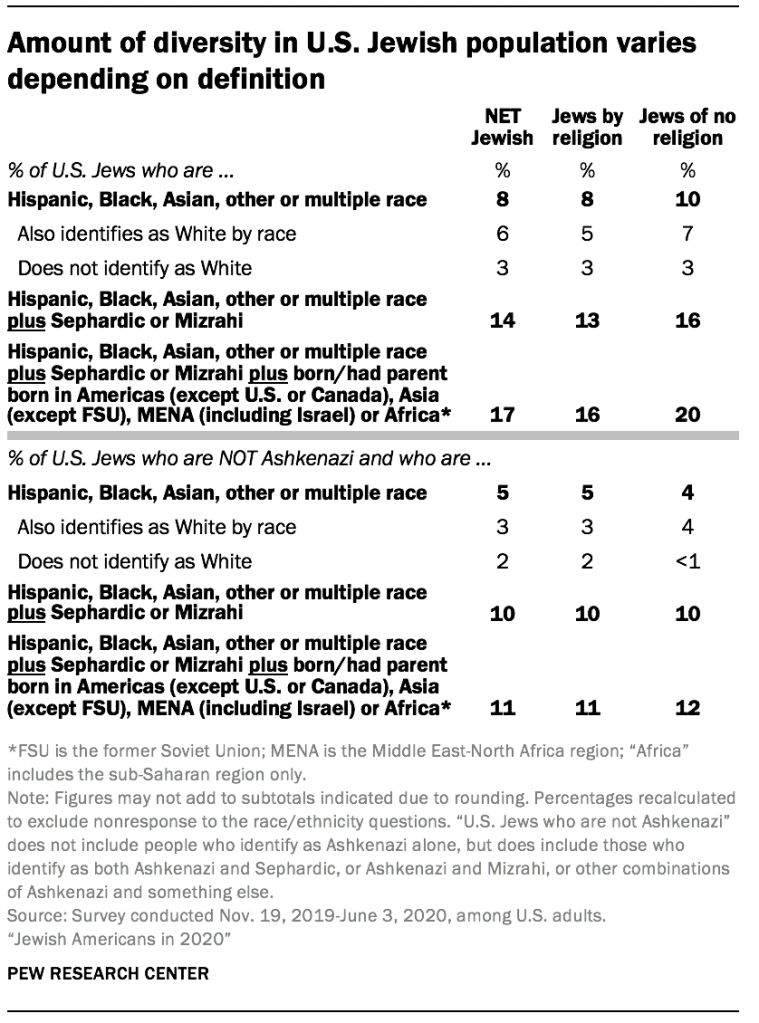
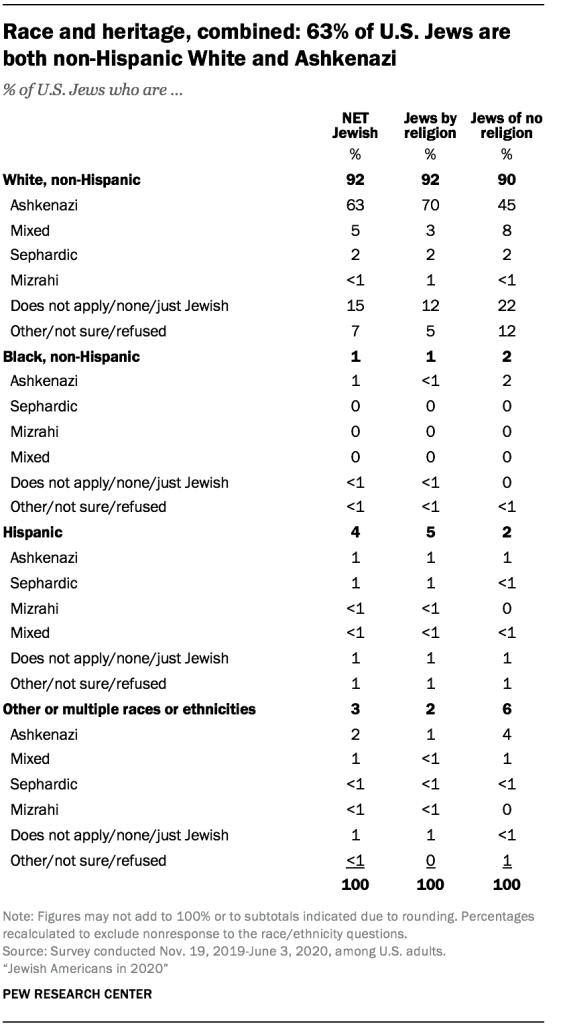
In the 2020 survey, roughly nine-in-ten U.S. Jewish adults identify as White non-Hispanic (92%), while 8% identify with all other categories combined. This compares with 94% White non-Hispanic and 6% in all other categories in the 2013 survey. In addition, there are other good reasons to think that the U.S. Jewish population, like the country’s population as a whole, is growing more racially and ethnically diverse over time, including a pattern of rising diversity by age.

Among Jewish adults under age 30, 85% identify as White (non-Hispanic), while 15% identify with all other categories, including 7% Hispanic, 2% Black (non-Hispanic) and 6% other or multiple races. That is much more racial and ethnic diversity than the survey finds among Jews ages 50 and older (97% White non-Hispanic).

Unlike in 2013, the 2020 survey also asked about the race and ethnicity of other adults and children in Jewish households. The data indicates that 17% of U.S. Jews live in households where at least one person – adult or child – is Hispanic, Black, Asian, another (non-White) race or ethnicity, or multiracial; this includes household members who may not be Jewish.

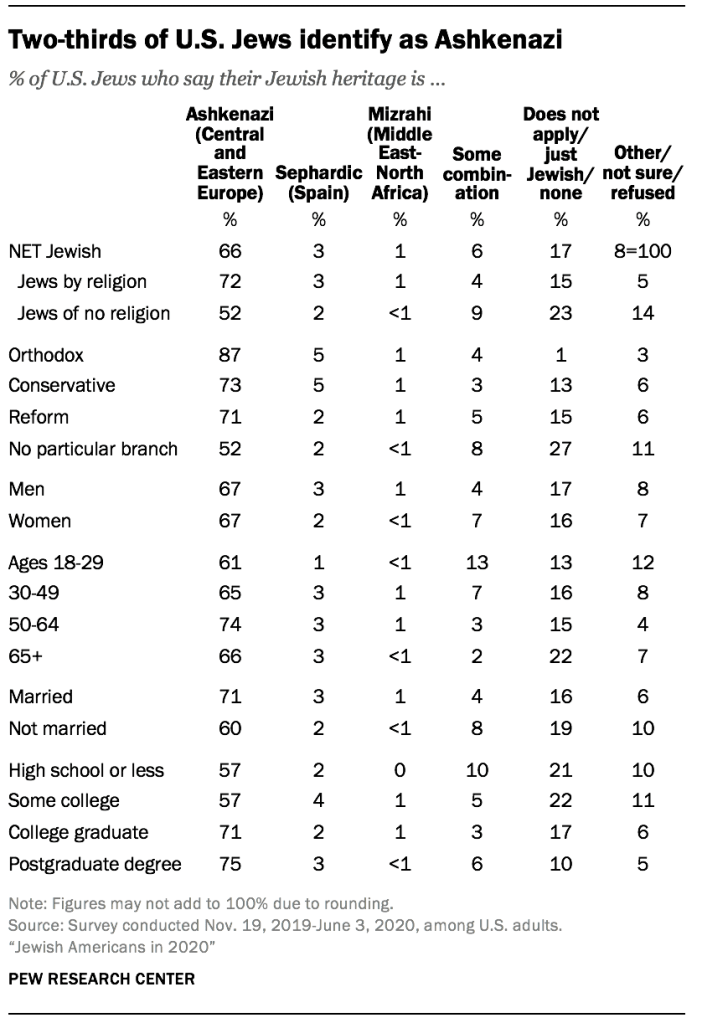
The survey also asked whether Jews think of themselves as Ashkenazi (following the Jewish customs of Central and Eastern Europe), Sephardic (following the Jewish customs of Spain), Mizrahi (following the Jewish customs of North Africa and the Middle East) or something else.12 Fully two-thirds of Jewish Americans consider themselves Ashkenazi, while relatively few consider themselves to be Sephardic (3%) or Mizrahi (1%). An additional 6% say they are some combination of these or other categories.

Most American Jews identify as Ashkenazi

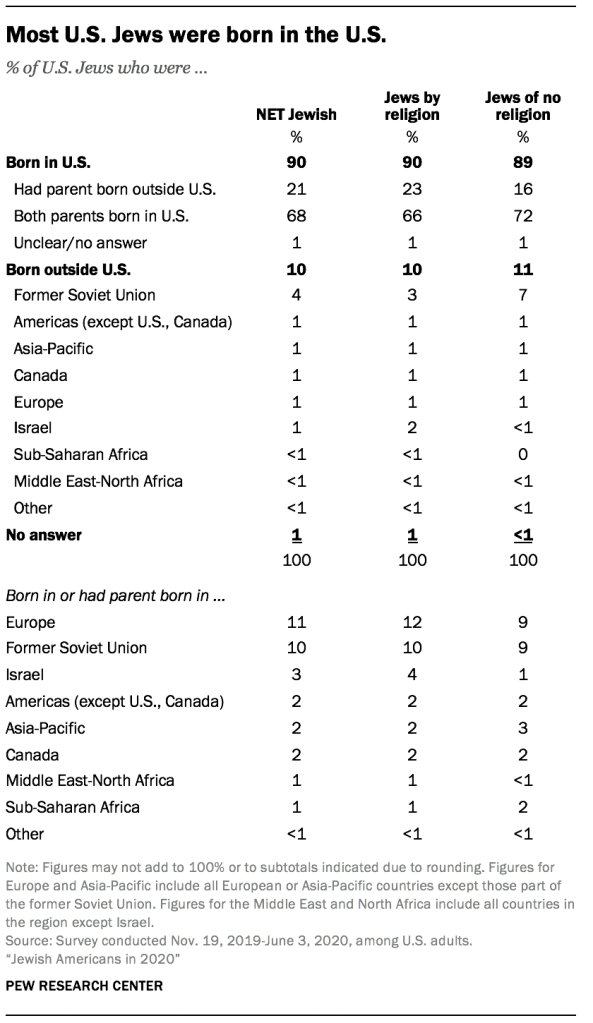
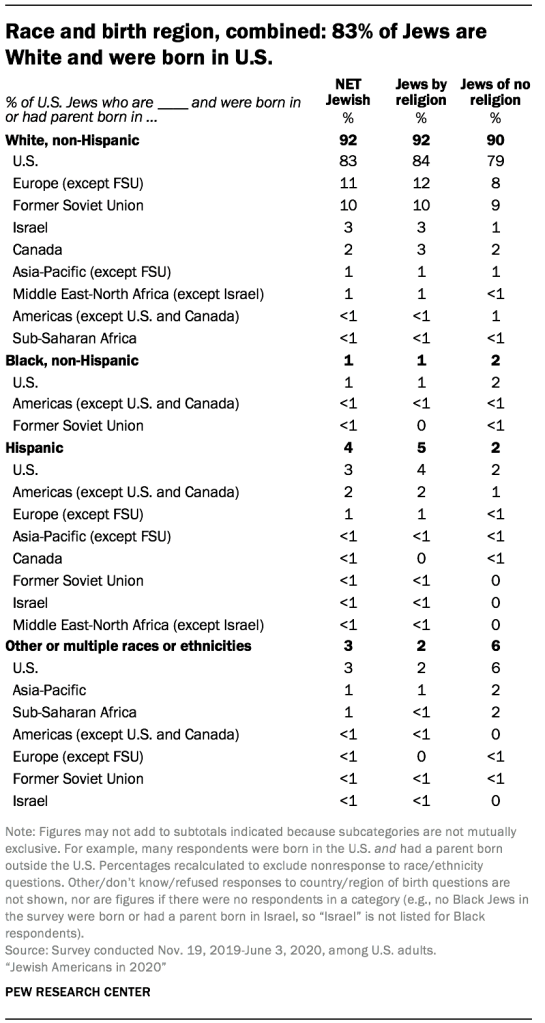
Despite the fact that most American Jews identify as following Jewish customs from Europe, nine-in-ten were born in the United States (90%), including 21% who are the adult children of at least one immigrant and 68% whose families have been in the U.S. for three generations or longer. One-third of Jewish adults (32%) are first- or second-generation immigrants, including 20% who were born in Europe or had a parent born in Europe and 4% who are first- or second-generation immigrants from the Middle East-North Africa region (including Israel).

Intermarriage and child rearing

Intermarriage more common among Jews married more recently

Rates of intermarriage between Jews and non-Jews in the United States are higher among Jews who have married in recent years than among those who married decades ago, a pattern broadly similar to what the 2013 survey found, though there is some variation between the decade-by-decade figures in the two surveys.13

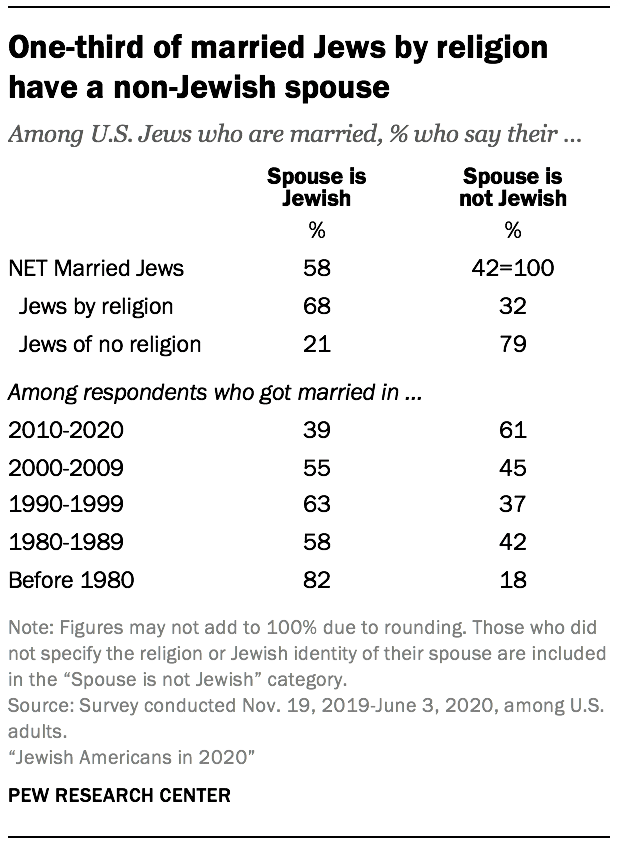
Among Jewish respondents who got married in the past decade, six-in-ten say they have a non-Jewish spouse. Among Jews who got married between 2000 and 2009, fewer (45%) are intermarried, as are about four-in-ten who got married in the 1990s (37%) or 1980s (42%). By contrast, just 18% of Jews who got married before 1980 have a non-Jewish spouse.

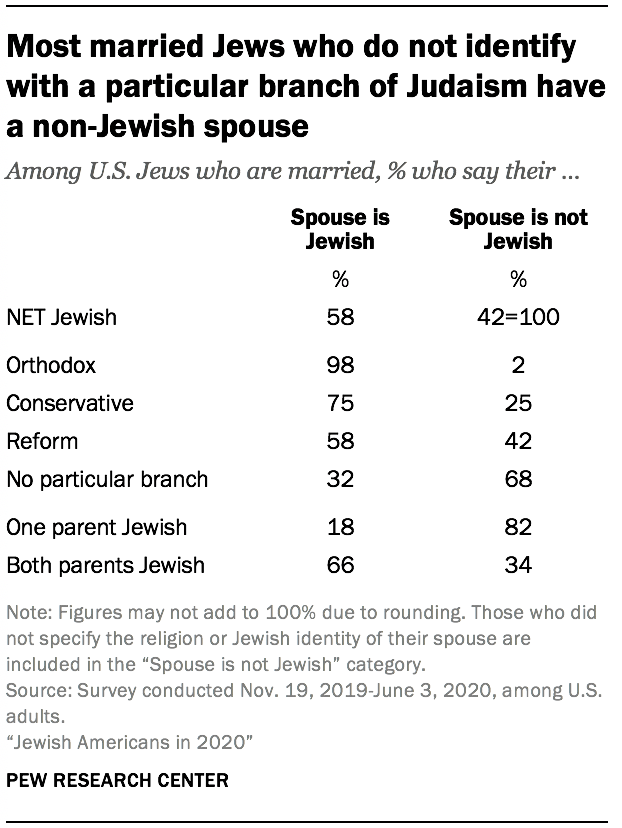
Intermarriage is almost nonexistent in the Orthodox Jewish community. In the current survey, just 2% of married Orthodox Jews say their spouse is not Jewish. By contrast, among married Jews outside the Orthodox community, about half (47%) say their spouse is not Jewish. And among non-Orthodox Jews who got married in the last decade, 72% say they are intermarried – virtually the same as the 2013 survey found in the decade prior to that study.

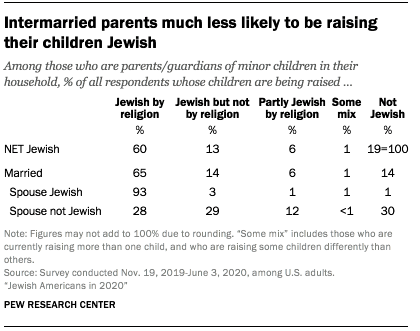
Intermarriage rates also have an intergenerational component: Adult Jews who are themselves the offspring of intermarriages are especially likely to intermarry. In the new survey, among married Jewish respondents who have one Jewish parent, 82% are intermarried, compared with 34% of those with two Jewish parents. Similarly, intermarried Jews who are currently raising minor children (under age 18) in their homes are much less likely to say they are bringing up their children as Jewish by religion (28%) than are Jewish parents who have a Jewish spouse (93%), although many of the intermarried Jews say they are raising their children as partly Jewish by religion or as Jewish aside from religion.

Intermarried Jewish parents much less likely to be raising their children Jewish

The 2020 survey included a new question aimed at helping to assess the importance to Jewish Americans of passing along their Jewish identity. Asked to imagine a time in the future when they have grandchildren of their own (if they do not currently have any), roughly six-in-ten U.S. Jews say it would be very important (34%) or somewhat important (28%) for their grandchildren to be Jewish. Smaller proportions say it would be very (22%) or somewhat (22%) important for their grandchildren to marry someone who is also Jewish.

The answers to these questions tend to vary by age, with older Jews generally assigning greater importance to Jewish continuity and in-marriage than younger Jews do. But, as previously noted in this report, there is also a kind of divergence taking place in the U.S. Jewish population, with a rising percentage of young Jewish adults who are Orthodox as well as a rising share who describe themselves – in terms of religion – as atheist, agnostic or nothing in particular.

The question about future grandchildren captures one element of this divergence. Three-in-ten Jewish adults under the age of 30 (31%) say it would be “not at all” important for their future grandchildren to be Jewish, which is significantly higher than the share who say this in any other age group. At the same time, 32% of the youngest Jewish adults say it would be “very important” for their grandchildren to be Jewish, which is on par with the share who say the same among older age groups. Among the Orthodox, 91% say it is very important for their grandchildren to be Jewish, compared with 4% among Jews of no religion.

More Jews say it is important for future grandchildren to share their political convictions and to carry on their family name than to marry someone who is Jewish

Retention

Nine-in-ten Americans raised Jewish by religion and three-quarters raised as Jews of no religion remain Jewish today

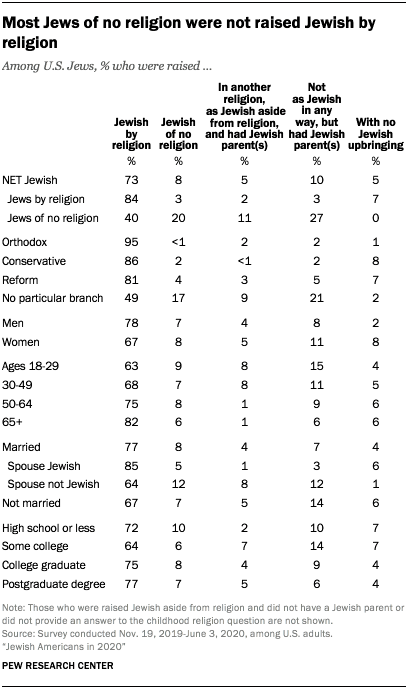
The survey estimates that roughly 8 million U.S. adults were raised Jewish or had a Jewish parent. Six-in-ten were raised Jewish by religion (58%), while 7% were raised as Jews of no religion; another 35% had at least one Jewish parent but say they were not raised exclusively Jewish (if at all), either by religion or aside from religion.14

Overall, 68% of those who say they were raised Jewish or who had at least one Jewish parent now identify as Jewish, including 49% who are now Jewish by religion and 19% who are now Jews of no religion. That means that one-third of those raised Jewish or by Jewish parent(s) are not Jewish today, either because they identify with a religion other than Judaism (including 19% who consider themselves Christian) or because they do not currently identify as Jewish either by religion or aside from religion.

Among all respondents who indicate they have some kind of Jewish background, those who were raised Jewish by religion have the highest retention rate. Nine-in-ten U.S. adults who were raised Jewish by religion are still Jewish today, including 76% who remain Jewish by religion and 13% who are now categorized as Jews of no religion. By comparison, three-quarters of those raised as Jews of no religion are still Jewish today; roughly half are still Jews of no religion and about one-in-five are now Jewish by religion. Among those who had at least one Jewish parent but who say they were not raised exclusively Jewish (either by religion or aside from religion), far fewer are Jewish today (29%).

Among Americans with one Jewish parent, young adults more likely than older generations to identify as Jewish today

Among people who were raised with a Jewish background, the share who identify as Jewish today is similar across age groups. However, older adults who were raised Jewish or had at least one Jewish parent are more likely to identify as Jewish by religion, while larger shares of young adults say they are Jewish aside from religion. For instance, among those ages 50 and older with a Jewish background, 57% identify as Jewish by religion, compared with 37% among adults under 30.

The data also shows that people with two Jewish parents are more likely than those with just one Jewish parent to retain their Jewish identity into adulthood. However, among people who have just one Jewish parent, younger cohorts are more likely than those ages 50 and older to be Jewish as adults, suggesting that the share of intermarried Jewish parents who pass on their Jewish identity to their children may have increased over time. Or, put somewhat differently, the share of the offspring of intermarriages who choose to be Jewish in adulthood seems to be rising.15

The vast majority of adults who were raised with a Jewish background and who now are married to a Jewish spouse identify as Jewish today (95%). By contrast, far fewer of those who have a non-Jewish spouse are Jewish today (56%). However, this does not necessarily mean that marrying a non-Jewish spouse pulls people away from their Jewish identity. The causal arrow could just as easily point in the other direction: People whose Jewish identity is relatively weak may consider it less important to marry a Jewish spouse.

Two-thirds of Americans raised as Orthodox Jews still identify as Orthodox as adults

The survey also makes it possible to examine the retention rate of various institutional branches or streams of Judaism in America. Orthodox and Reform Judaism exhibit the highest retention rates of the major streams; 67% of Americans raised as Orthodox Jews by religion continue to identify with Orthodoxy as adults. Similarly, most people raised as Reform Jews by religion also identify as Reform today (66%). The retention rate for those raised within Conservative Judaism is lower; four-in-ten people (41%) raised as Conservative Jews by religion continue to identify with Conservative Judaism as adults, although fully nine-in-ten (93%) are still Jewish.

In some ways, these patterns resemble the findings from the 2013 study. In both surveys, adults who no longer identify with their childhood stream tend to have moved in the direction of less traditional forms of Judaism rather than in the direction of more traditional streams. For example, roughly half of people raised within Conservative Judaism now identify with Reform Judaism (30%), don’t affiliate with any particular branch of Judaism (15%) or are no longer Jewish (7%), while just 2% of people raised as Conservative Jews now identify with Orthodox Judaism. Similarly, about one-quarter of people raised within Reform Judaism now either have no institutional affiliation (14%) or are no longer Jewish (12%), while just one-in-twenty now identify with Conservative Judaism (4%) or with Orthodox Judaism (1%).

However, the share of adults raised within Orthodox Judaism who continue to identify as Orthodox is higher in the new study (67%) than it was in the 2013 survey (48%). This may be due (at least in part) to the fact that, in the new study, the sample of adults who say they were raised as Orthodox Jews includes a larger percentage of people under the age of 30. The 2013 study indicated that the Orthodox retention rate had been much higher among people raised in Orthodox Judaism in recent decades than among those who came of age as Orthodox Jews in the 1950s, ’60s and ’70s. The new survey included too few interviews with those raised as Orthodox Jews to be able to subdivide them by year or decade of birth.

Like other Americans, Jews have been hit hard by coronavirus

By early 2021, little difference in share of U.S. Jews, other adults who know someone who died or was hospitalized due to COVID-19

Because the survey was designed in 2019 and most of the interviewing was completed before the coronavirus pandemic hit the United States, the results by themselves do not paint a clear picture of the pandemic’s impact on Jewish Americans. However, subsequent polls conducted by Pew Research Center in August 2020 and February 2021 asked more than 10,000 Americans – including 348 and 265 Jews by religion, respectively – about their experiences in the pandemic.16

In August 2020, Jews by religion were substantially more likely than U.S. adults overall to say they knew someone who had been hospitalized or died as a result of COVID-19 (57% vs. 39%), likely because many Jews are concentrated in the New York City area, which had the highest number of COVID-19 cases in the country during the first few months of the pandemic. But both numbers had increased and the gap virtually disappeared by February 2021, when 73% of Jews and 67% of all U.S. adults said they personally knew someone who had been hospitalized or died from the coronavirus (the gap between these two figures is not statistically significant due to sample size limitations).

In February, Jews remained twice as likely as U.S. adults overall to say they had tested positive for COVID-19 or for antibodies to the disease (23% vs. 11%). But when looking at the combined share of people who say they have tested positive for the illness and those who say they are “pretty sure” they had it, even if they did not test positive, the difference between Jews (29%) and all U.S. adults (25%) is not statistically significant.

Other findings from Pew Research Center’s 2020 survey include:

  • Nearly four-in-ten U.S. Jews feel they have a lot (4%) or some (34%) in common with Muslims. Fewer say they have a lot (2%) or some (18%) in common with evangelical Christians. Jews who do not identify with any denominational branch are more likely to say they have at least some in common with mainline Protestants and Muslims than to say the same about Orthodox Jews.
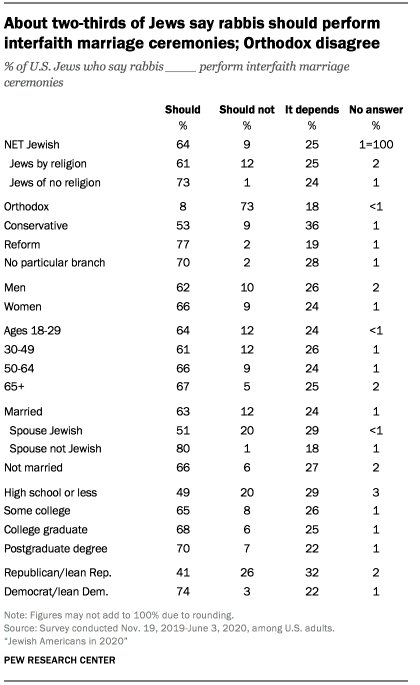
  • Nearly two-thirds of U.S. Jews (64%) say rabbis should perform marriage ceremonies for interfaith couples (that is, between someone who is Jewish and someone who is not), and an additional 25% say “it depends.” Just 9% flatly object to rabbis performing interfaith weddings. Among Orthodox Jews, however, 73% say rabbis should not officiate at such weddings.
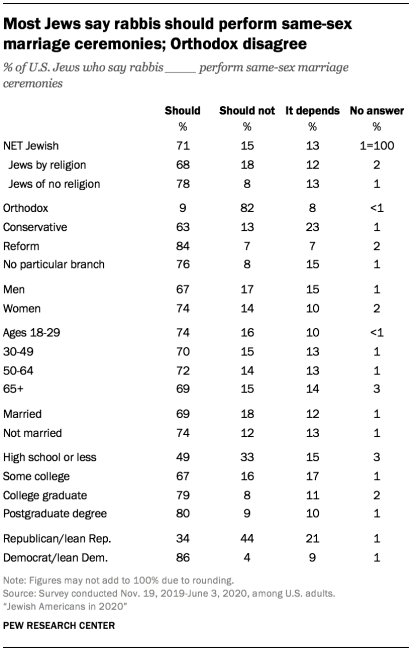
  • Seven-in-ten U.S. Jews (71%) say rabbis should officiate at same-sex weddings, while 13% say it depends. Just 15% oppose rabbis performing marriage ceremonies for same-sex couples. But among Orthodox Jews, 82% object.
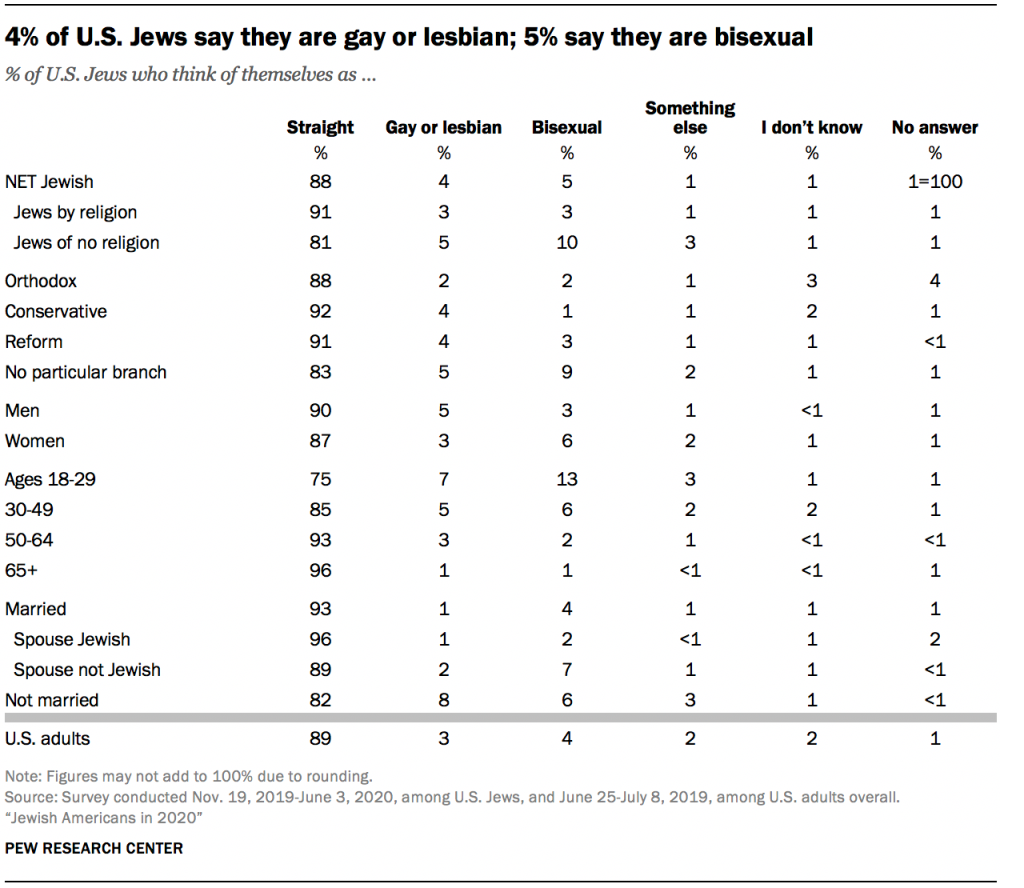
  • About one-in-ten U.S. Jewish adults identify as gay or lesbian (4%) or bisexual (5%); 88% say they are straight, 1% say they are something else, 1% say they don’t know and 1% declined to answer the question.
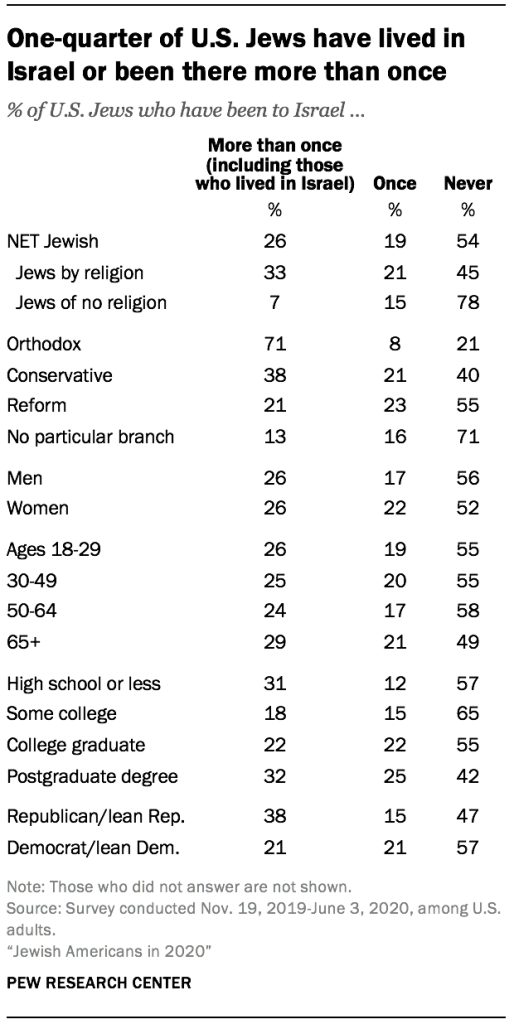
  • Just under half of U.S. Jewish adults (45%) have been to Israel. Among Jews in the survey ages 25 to 34, one-quarter say that they have been on a trip to Israel sponsored by Birthright, an organization that provides free travel to Israel for young U.S. Jews.
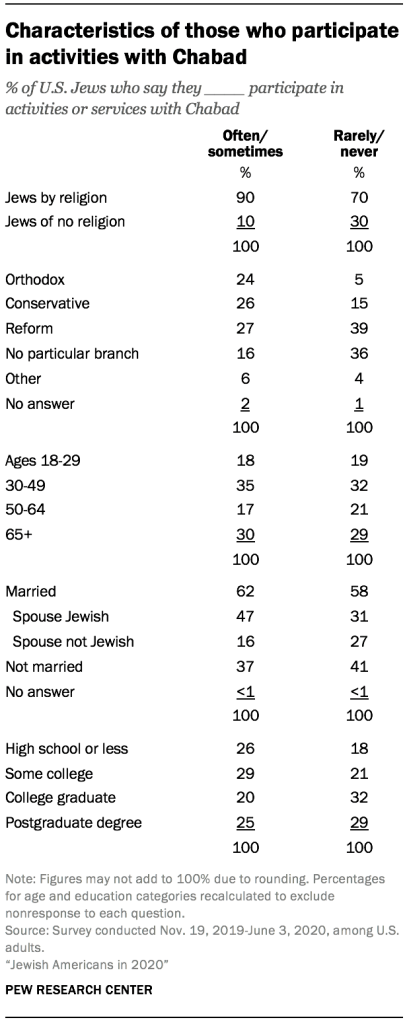
  • Nearly one-in-five Jews say they often (5%) or sometimes (12%) participate in activities or services with Chabad. This is especially common among Orthodox Jews; 46% say they participate in Chabad activities at least sometimes, compared with 25% of Conservative Jews, 12% of Reform Jews and 8% of Jews who do not identify with any particular branch of Judaism.
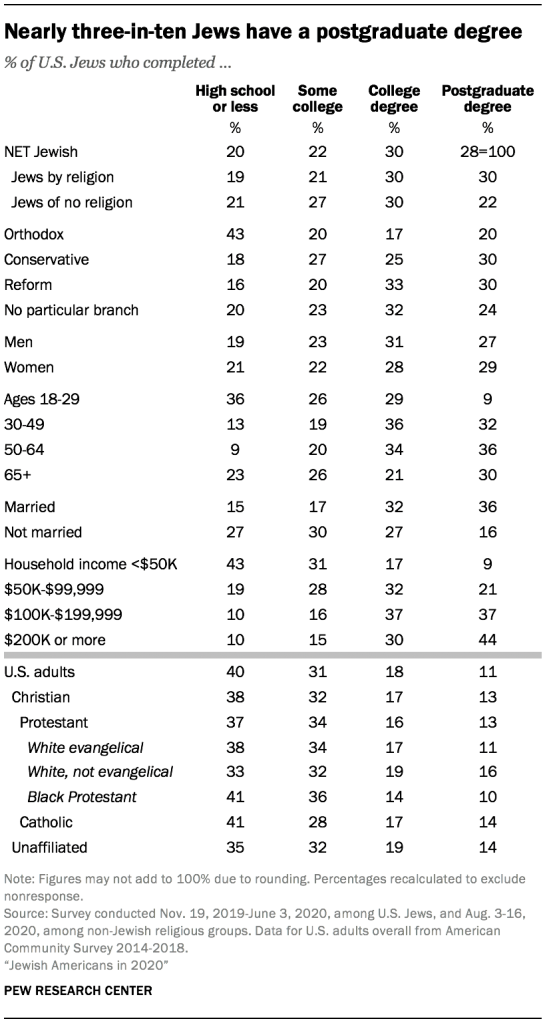
  • Jews continue to have high levels of educational attainment. Nearly six-in-ten are college graduates, including 28% who have earned a postgraduate degree. By way of comparison, about three-in-ten U.S. adults overall are college graduates, including 11% who have earned a postgraduate degree.
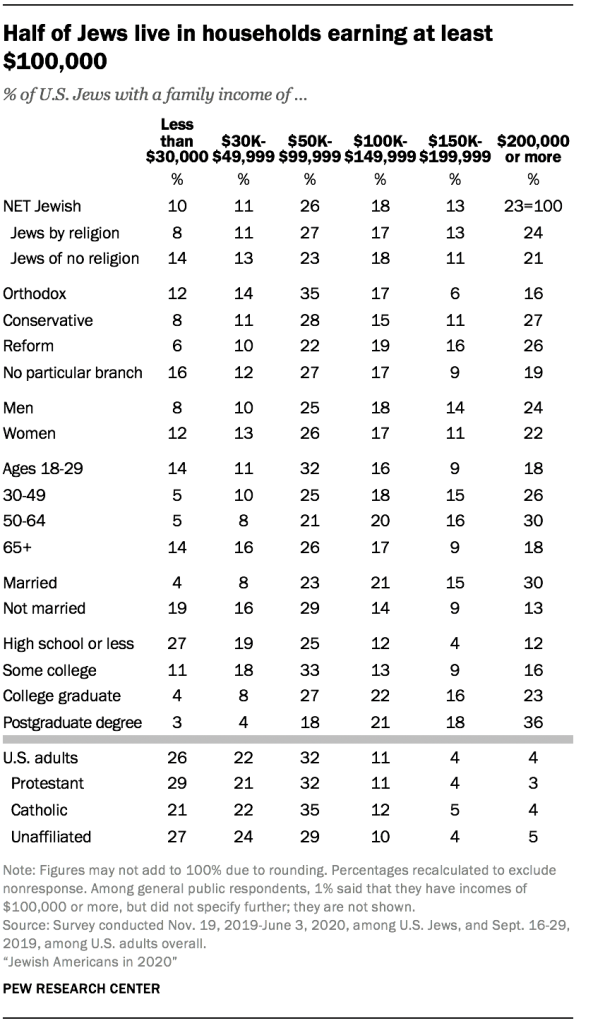
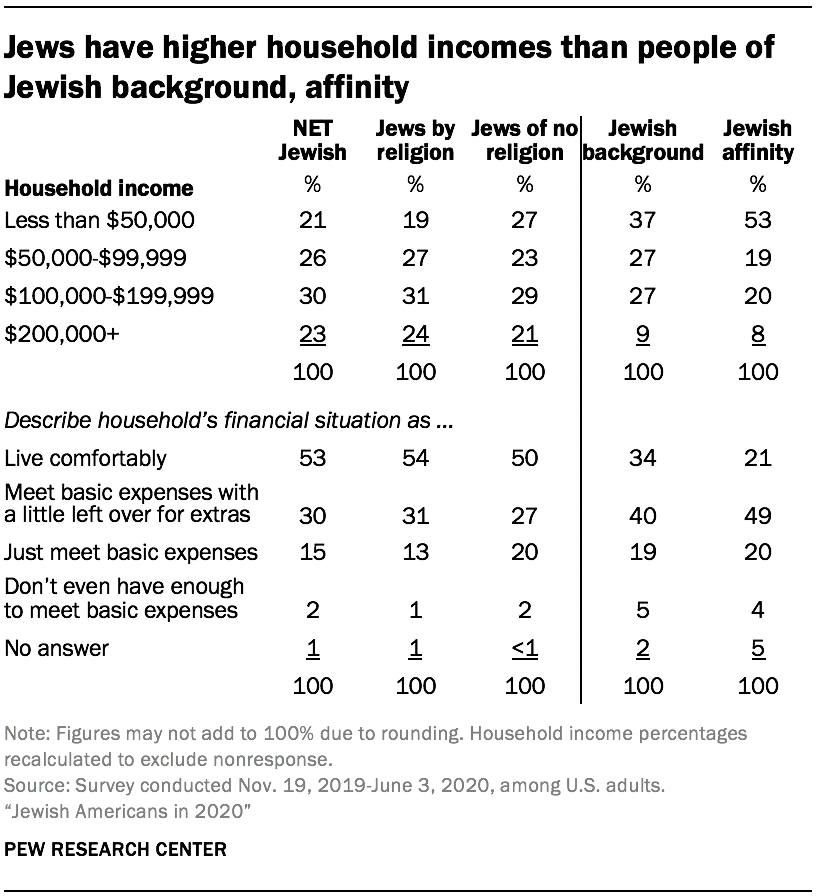
  • One-in-four American Jews say they have family incomes of $200,000 or more (23%). By comparison, just 4% of U.S. adults report household incomes at that level. At the other end of the spectrum, one-in-ten U.S. Jews report annual household incomes of less than $30,000, versus 26% of Americans overall.
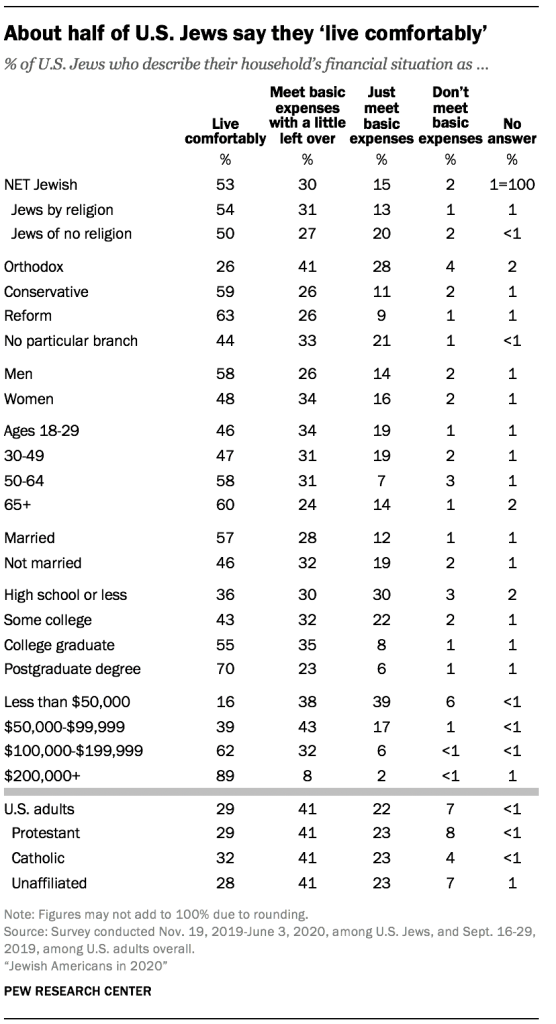
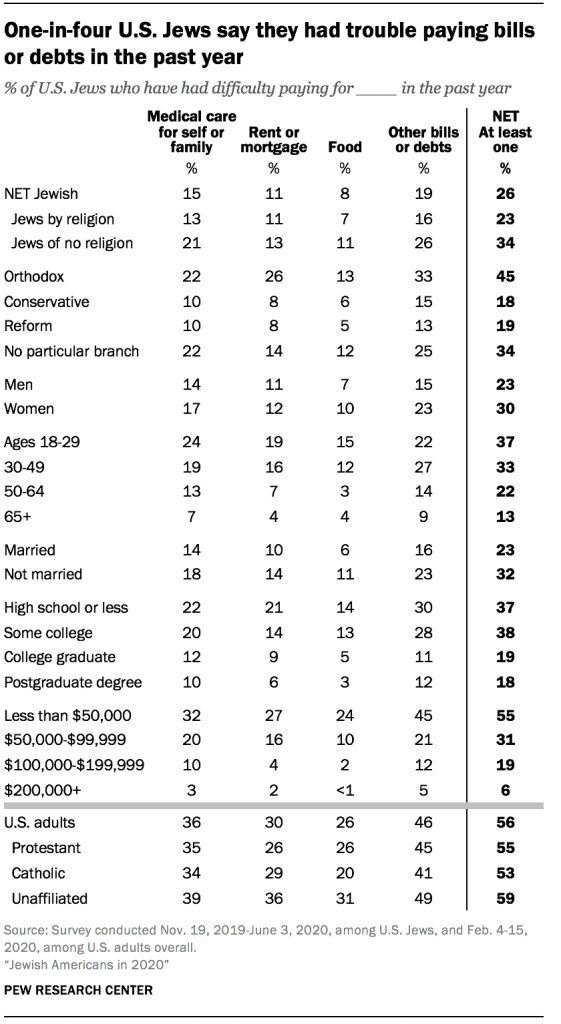
  • At the time of the survey (which was mostly fielded before the coronavirus outbreak in the United States), half of U.S. Jews described their financial situation as living “comfortably” (53%), compared with 29% of all U.S. adults. At the same time, 15% of Jewish adults said they had difficulty paying for medical care for themselves or their family in the past year, 11% said they had difficulty paying their rent or mortgage, 8% said they had a difficult time paying for food, and 19% had trouble paying other types of bills or debts.

Roadmap to the report

The remainder of this report explores these and other findings in more detail. Chapter 1 provides estimates of the size of the U.S. Jewish population using various definitions of Jewishness. Chapter 2 examines Jewish identity and beliefs, including affiliation with various branches of Judaism, what U.S. Jews consider essential to being Jewish, and where they find meaning and fulfillment. Chapter 3 explores Jewish practices and customs, including some traditional religious practices (such as synagogue attendance) and some more “cultural” Jewish activities. Chapter 4 looks at marriage and families, including rates of intermarriage, how Jewish survey respondents say they are raising their children, and whether respondents attended Jewish day schools or camps. Chapter 5 delves into measures of community and connectedness, such as how much responsibility U.S. Jews feel toward fellow Jews around the world and how much they say they have in common with other Jews. Chapter 6 describes experiences and perceptions of anti-Semitism, as well as perceived levels of discrimination against other groups in U.S. society. Chapter 7 analyzes U.S. Jewish attitudes toward Israel, prospects for a peace settlement with Palestinians, and the BDS movement. Chapter 8 focuses on U.S. Jews’ political affiliations and views, including on former President Donald Trump, who was still in office when the survey was conducted. Chapter 9 explores measures of race, ethnicity, Jewish heritage and country of origin among U.S. Jews. Chapter 10 describes how Jewish adults answered other demographic questions, including about their age, education, region of residence, fertility and sexual orientation. Chapter 11 looks at measures of economic well-being and vulnerability, including employment status and occupation. And Chapter 12 summarizes the survey’s findings on people of Jewish background and Jewish affinity – two groups that have a connection to Judaism but that are not classified as Jewish for the purposes of this report.
1. The size of the U.S. Jewish population

This report classifies approximately 5.8 million adults (2.4% of all U.S. adults) as Jewish. This includes 4.2 million (1.7%) who identify as Jewish by religion and 1.5 million Jews of no religion (0.6%).17 People are categorized as “Jews of no religion” if they answer a question about their present religion by saying they are atheist, agnostic or have no religion in particular; and they say they had a Jewish parent or were raised Jewish; andthey consider themselves Jewish in some way aside from religion, such as ethnically, culturally or because of their family background.

An additional 2.8 million adults (1.1% of U.S. adults) have a Jewish background. These adults all had at least one Jewish parent or a Jewish upbringing, but most people in this category, 1.9 million, identify with another religion, such as Christianity. About 700,000 have no religion and do not consider themselves Jewish in any way. An additional 200,000 identify as Jewish by religion but also identify with another religion, which excludes them from the Jewish population for the purposes of this report.
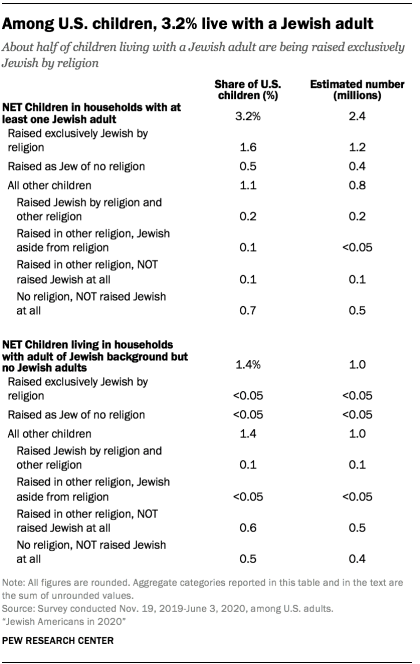
Among U.S. children, 3.2% live with a Jewish adult

A further 1.4 million adults (0.6%) have a Jewish affinity. Though they lack a Jewish parent or upbringing and do not identify as Jewish by religion, these adults consider themselves Jewish in some other way. About two-thirds identify with a religion other than Judaism, usually Christianity. There are an estimated 2.4 million children living in the United States in households with at least one Jewish adult (3.2% of all U.S. children). This includes 1.8 million who are being raised Jewish in some way, such as 1.2 million who are being raised exclusively Jewish by religion, and an additional 400,000 who are being raised as Jewish but not by religion. It also includes roughly 200,000 who are being raised both as Jewish by religion and in another religion. About 600,000 U.S. children live with a Jewish adult but are not being raised Jewish in any way.18

Meanwhile, approximately 1 million children live in households without any Jewish adults but with at least one adult of Jewish background, although 900,000 of these children are not being raised Jewish in any way.

Combining 5.8 million adult Jews (the estimated size of the net Jewish population in this survey) with 1.8 million children (living in households with a Jewish adult and who are being raised Jewish in some way, including those who are being raised both Jewish and in another religion) yields a total estimate (rounded to the nearest 100,000) of 7.5 million Jews of all ages in the United States, or 2.4% of the total U.S. population.19

In this report, as in the 2013 study, children are treated differently from adults: Children who are being raised as Jewish and in some other religion are included in the Jewish population estimate, while adults who identify as Jewish and some other religion are not. This accounts for the uncertainty inherent in projecting how children will identify when they grow up; some children who are raised as Jewish and another religion go on to identify, in adulthood, solely as Jewish.

Of course, the population estimates could be larger or smaller depending on one’s definition of who counts as Jewish. For example, if adults with a Jewish background who identify religiously both as Jewish and as followers of another religion (such as Christianity) were included in the Jewish population, it would rise to approximately 7.7 million. And if children who are being raised both as Jewish and in another religion were excluded from the Jewish population estimate, it would fall to about 7.3 million.

Using data from the 2020 Pew Research Center survey, Hebrew University demographer Sergio DellaPergola estimates the “core” Jewish population in the United States to be slightly more than 6 million, including 4.8 million adults and 1.2 million children. DellaPergola includes Jews of no religion in these figures only if they have two Jewish parents. In his view, this “core” population is more consistent with the population estimates in previous national studies going back to 1970. It is about 300,000 larger than his calculation of the “core” population in the 2013 survey, which totaled 5.7 million.20

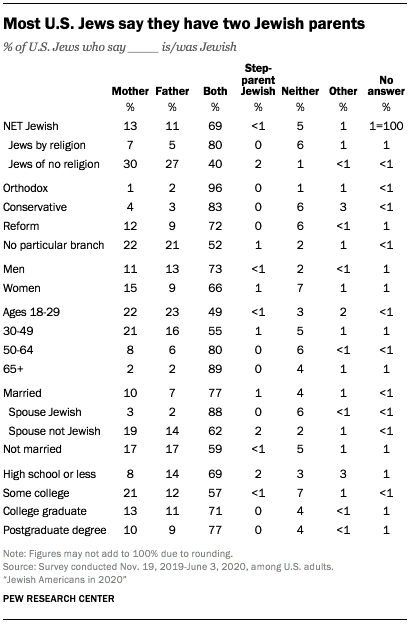
One other common definition should be mentioned: In traditional Jewish law (halakha), Jewish identity is transmitted by matrilineal descent. The survey finds that 87% of adult Jews by religion and 70% of Jews of no religion – a total of about 4.8 million U.S. adults – say they had a Jewish mother. Additionally, about 1.3 million people who are not classified as Jews in this report (47% of non-Jews of Jewish background) say they had a Jewish mother.

Is the Jewish share of the U.S. population stable, growing or shrinking?

The “net” Jewish adult population seems to be keeping pace with the steadily growing U.S. population, rising from an estimated 5.3 million at the time of the 2013 Pew Research Center survey of Jewish Americans (2.2% of U.S. adults) to 5.8 million in 2020 (2.4%). The share of U.S. adults identifying as Jews by religion has been fairly stable (1.8% in 2013 and 1.7% in 2020), and so has the population of adults who are classified as Jews of no religion (0.5% of adults in 2013 and 0.6% in 2020).

There also has been stability in the broader population that includes adults of Jewish background and of Jewish affinity. An estimated 1.0% of American adults were of Jewish background in 2013, approximately the same as the 1.1% figure in 2020. And 0.5% of adults fell into the Jewish affinity category in 2013, similar to the 0.6% result in 2020.

However, the 2020 survey points to a larger population of children living in Jewish households than its predecessor (2.4 million in 2020 vs. 1.8 million in 2013). In 2013, the estimated share of U.S. adults who were Jewish (2.2%) was similar to the share of children in the United States who were living with at least one Jewish adult (2.4%). In 2020, however, the estimated share of all U.S. children who live with at least one Jewish adult (3.2%) exceeds the estimated percentage of Jews in the U.S. adult population (2.4%).

The difference in the estimated size of the child population probably reflects in part some real change, fueled by factors including the high concentration of Orthodox Jews among young adults of childbearing age and their high fertility rates, leading to more Jewish children. But some of this difference may be attributable to measurement artifacts associated with the 2013 and 2020 surveys and their different modes of data collection. Surveys were completed on the phone in 2013 and either by mail or online in 2020.

Pew Research Center values transparency and humility. This is the first nationally representative study of U.S. Jews using address-based sampling (ABS) techniques. Additional studies using this method and future work by other scholars will increase our understanding of these results.

How do these estimates compare with other estimates?

Each year, the American Jewish Year Book publishes new estimates of the size of the U.S. Jewish population of all ages. One estimate comes annually in a chapter on the demographics of American Jews by the yearbook’s editors, Ira M. Sheskin of the University of Miami and Arnold Dashefsky of the University of Connecticut. By aggregating data from local Jewish community studies, key informants at Jewish Federations in larger communities, and rabbis and other Jewish community leaders in smaller communities, along with census data on heavily Jewish counties, Sheskin and Dashefsky estimate there were 7.15 million U.S. Jews in 2020. Sheskin and Dashefsky rely on the varying definitions of Jewish identity used by their diverse sources.

A second set of U.S. Jewish population estimates is produced and updated regularly by the American Jewish Population Project (AJPP), led by Leonard Saxe and Elizabeth Tighe at Brandeis University’s Steinhardt Social Research Institute. The Brandeis team does multilevel Bayesian analysis of a large number of general population surveys measuring the Jewish-by-religion population, which they combine with analyses of local Jewish community surveys and the 2013 Pew Research Center survey to estimate the number of adults who are Jewish aside from religion and the number of children in the Jewish population. See their technical report for additional details. The AJPP estimates there were 7.6 million Jews of all ages in 2020, including 6.0 million Jewish adults and 1.6 million children.

A third estimate appears each year in a chapter of the American Jewish Year Book that focuses on Jewish populations around the world and is written by DellaPergola, who is professor emeritus at the Hebrew University of Jerusalem’s Avraham Harman Institute of Contemporary Jewry. DellaPergola considers a wide range of sources and demographic factors to produce his estimates for each country. To make U.S. estimates, he has relied primarily in recent years on analysis of the 2013 Pew Research Center survey. In addition to estimating the size of a “core” Jewish population, he also looks at a broader, “Jewish connected” population that includes adults who identify as partially Jewish, children raised in both Judaism and another religion, and people who say they are not Jewish but who have at least one Jewish parent. As of 2019, DellaPergola estimated the “Jewish connected” population in the United States at about 8 million.

The 2020 Pew Research Center estimate of 7.5 million Jews of all ages roughly matches the current AJPP total. The Center’s estimate is close to Sheskin and Dashefsky’s aggregate estimate, and it falls between DellaPergola’s estimates of the “core Jewish” and “Jewish connected” populations. To those unaccustomed to thinking about Jewish population measurement and trends, the differences between all these estimates may appear modest. To survey researchers aware of the limits of surveys to provide precise data on rare populations, focusing on such small variations may seem unwarranted. And yet, the measure one chooses matters for whether the U.S. is considered to have the largest Jewish population in the world or the second largest, after Israel’s Jewish population of approximately 6.8 million on the eve of 2020.

In addition, Jews may be particularly attuned to the importance of population trends because of the murder of approximately 6 million Jews, or roughly two-thirds of Europe’s entire Jewish population, in the Holocaust. Depending on one’s estimate of the number of Jews living in the U.S. today, the total Jewish population around the world may – or may not – have returned to its pre-Holocaust level (approximately 17 million in 1939). Finally, many Jewish organizations depend on population estimates at both the national and local level in planning programs and assessing their effectiveness at serving U.S. Jewish communities.

2. Jewish identity and belief

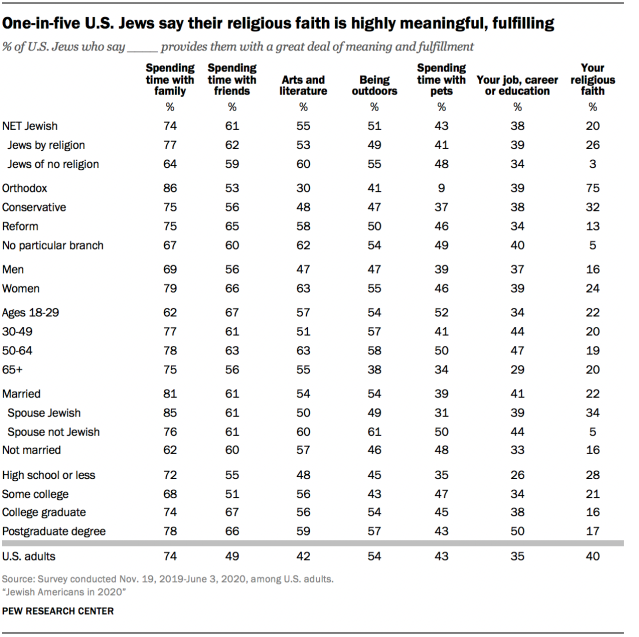
Religion is not central to the lives of most U.S. Jews. Even Jews by religion are much less likely than Christian adults to consider religion to be very important in their lives (28% vs. 57%). And among Jews as a whole, far more report that they find meaning in spending time with their families or friends, engaging with arts and literature, being outdoors, and pursuing their education or careers than find meaning in their religious faith. Twice as many Jewish Americans say they derive a great deal of meaning and fulfillment from spending time with pets as say the same about their religion.

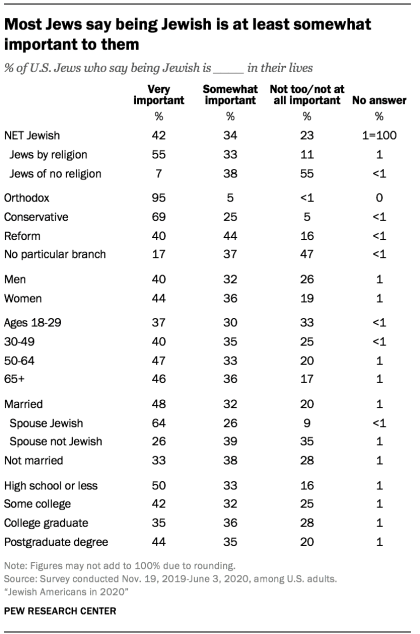
And yet, even for many Jews who are not particularly religious, Jewish identity matters: Fully three-quarters of Jewish Americans say that “being Jewish” is either very important (42%) or somewhat important (34%) to them.

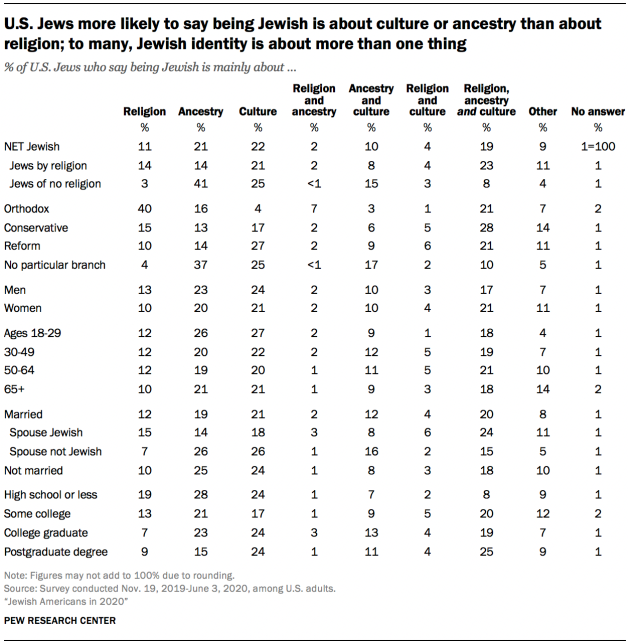
U.S. Jews do not have a single, uniform answer to what being Jewish means. When asked whether being Jewish is mainly a matter of religion, ancestry, culture or some combination of those things, Jews respond in a wide variety of ways, with just one-in-ten saying it is only a matter of religion.

Many American Jews prioritize cultural components of Judaism over religious ones. Most Jewish adults say that remembering the Holocaust, leading a moral and ethical life, working for justice and equality in society, and being intellectually curious are “essential” to what it means to them to be Jewish. Far fewer say that observing Jewish law is an essential part of their Jewish identity. Indeed, more consider “having a good sense of humor” to be essential to being Jewish than consider following halakha (traditional Jewish law) essential (34% vs. 15%).

Orthodox Jews are a striking exception to many of these overall findings. They are among the most highly religious groups in U.S. society – along with White evangelicals and Black Protestants – in terms of the share who say religion is very important in their lives. A plurality of Orthodox Jews say that being Jewish is mainly about religion alone (40%), and they are the only subgroup in the survey who overwhelmingly feel that observing halakha is essential to their Jewishness (83%). Fully three-quarters of the Orthodox say they find a great deal of meaning and fulfillment in their religion, exceeded only by the share who feel that way about spending time with their families (86%). And 93% of Orthodox Jews say they believe in God as described in the Bible, compared with a quarter of Jews overall.

Identification with branches of American Judaism

A attachment in the editor

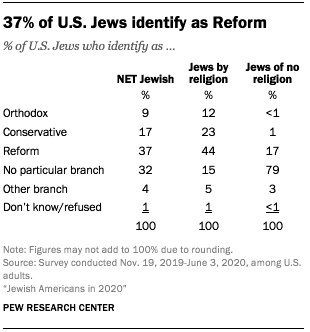
More than half of U.S. Jews identify with the Reform (37%) or Conservative (17%) movements, while about one-in-ten (9%) identify with Orthodox Judaism. One-third of Jews (32%) do not identify with any particular Jewish denomination, and 4% identify with smaller branches – such as Reconstructionist or Humanist Judaism – or say they are connected with multiple streams of U.S. Judaism. Among Jews by religion, branch affiliation generally mirrors the broader pattern among Jews overall. Most Jews by religion identify with either Reform (44%) or Conservative (23%) Judaism, and fewer say they do not belong to a particular denomination (15%). Most Jews of no religion, on the other hand, do not identify with any institutional branch or stream of Judaism (79%), while the remainder largely describe themselves as Reform Jews (17%).

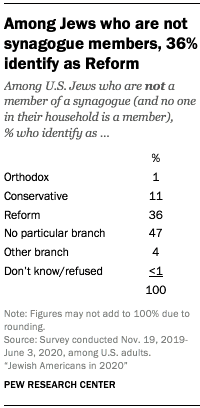
Among Jews who are not synagogue members, 36% identify as Reform

It is often assumed that for U.S. Jews, branch affiliation goes hand in hand with synagogue membership – e.g., they belong to a Conservative synagogue, and so they identify as Conservative, or they belong to a Reform temple, and so they identify as Reform. But this is not always the case, because the percentage of Jewish adults who identify with some branch of U.S. Judaism (67%) is considerably higher than the percentage who are synagogue members or have someone in their household who is a synagogue member (35%).

Among Jews who are neither synagogue members themselves nor live in a household where anyone else belongs to a synagogue, 47% do not identify with any institutional branch or stream of Judaism. But roughly half identify as Reform (36%), Conservative (11%), Orthodox (1%) or another Jewish denomination (4%), even though they indicate that, at present, they have no formal connection to a synagogue. This pattern is similar when looking only at respondents who are themselves not members of a synagogue, regardless of the status of others in their household. There could be multiple reasons for this, including Jewish denominational attachments retained since childhood, participation in Chabad or other synagogues that do not have a formal membership structure, and financial barriers to synagogue membership, among other possibilities. (The survey asked separate questions about branch affiliation, synagogue membership and synagogue attendance, without probing the exact connections; it did not ask people who identify as Reform Jews, for example, whether the synagogue they attend, or belong to, is a Reform synagogue.)

Younger Jews more likely than older Jews to be Orthodox or have no branch affiliation

Jewish adults ages 18 to 29 are particularly likely to identify as Orthodox (17%), compared with those who are 30 and older, of whom 7% are Orthodox. The youngest Jewish adults also are more inclined than their elders to have no branch affiliation (41%), while smaller shares are Reform (29%) or Conservative (8%).

At the other end of the age spectrum, 44% of Jews ages 65 and older identify with the Reform movement, and a quarter say they are Conservative.

Jews less inclined than U.S. adults as a whole to consider religion very important

One-in-five Jews say religion is very important to them

Nearly half of U.S. Jews say religion is either “very” (21%) or “somewhat” (26%) important in their lives, while 53% say religion is “not too” or “not at all” important to them personally.

Jews by religion are far more likely than Jews of no religion to say religion is at least somewhat important in their lives (61% vs. 8%). And Orthodox Jews are especially likely to say that religion is important: Nearly nine-in-ten (86%) say religion is very important to them, compared with a third of Conservative Jews (33%) and 14% of Reform Jews who consider religion very important in their lives.

Religion is more important to Jewish women, on average, than to Jewish men. Jewish adults ages 30 and older are more likely than those under 30 to say religion is at least somewhat important to them (49% vs. 39%). And two-thirds of married Jews who have a Jewish spouse say religion is very (35%) or somewhat (31%) important to them, while far fewer intermarried Jews say this (8% very important, 20% somewhat important).

Jews who did not obtain college degrees are more inclined to say that religion is very important in their lives. For example, about a third of U.S. Jews whose formal education stopped with high school (32%) say religion is very important, compared with 13% of those with bachelor’s degrees and 15% of those with postgraduate degrees.

Compared either with U.S. Christians or with the adult public overall, U.S. Jews are far less likely to say that religion is important in their lives. However, Orthodox Jews rank among the most religiously devout subgroups in the country by this measure; 86% say religion is very important in their lives, as do 78% of Black Protestants and 76% of White evangelical Protestants, two of the most highly religious Christian subgroups. Meanwhile, Jews of no religion are even more likely than religiously unaffiliated Americans to say religion is “not too” important or “not at all” important to them (91% vs. 82%).

Most Jews say being Jewish is at least somewhat important to them

The fact that many Jews say religion is relatively unimportant in their lives does not necessarily mean their Jewish identity is not meaningful to them. In fact, three-quarters of U.S. Jews say that “being Jewish” is either very important (42%) or somewhat important (34%) in their lives, while only 23% say it is not too or not at all important to them.

Jews by religion are far more likely than Jews of no religion to say that being Jewish is very important to them (55% vs. 7%); 55% of Jews of no religion say being Jewish is of little importance to them.

Nearly all Orthodox Jews in the survey (95%) describe being Jewish as very important in their lives. A majority of Conservative Jews also say being Jewish is very important (69%). Fewer Reform Jews (40%) and Jews of no denomination (17%) say the same.

Married Jews are more likely than those who are not married to say that being Jewish is central to their lives (48% vs. 33%). Being Jewish tends to be particularly important for Jews who have a Jewish spouse (64% say it is very important).

To U.S. Jews, being Jewish is not just about religion

There is no one way that American Jews think about being Jewish, as the survey makes clear. When asked whether being Jewish is mainly a matter of religion, ancestry or culture, some Jewish respondents pick each of those things, and many choose some combination of them. In fact, among the most common answers – expressed by about one-in-five U.S. Jews (19%) – is that being Jewish is about religion, ancestry and culture.

Similar shares say being Jewish is mainly a matter of just culture (22%) or just ancestry (21%). About half as many (11%) say being Jewish is mainly about religion alone. The remainder give other responses, such as that being Jewish is about both ancestry and culture (10%).

All told, about half mention ancestry among their responses (52%). A similar share point to culture either alone or in combination with other answers (55%). But fewer mention religion (36%), suggesting that most U.S. Jews do not see being Jewish as primarily about religion.

Even among Jews by religion, just 44% mention religion as a primary facet of Jewish identity, although Orthodox Jews stand out in this regard: 40% say being Jewish is about only religion, and an additional three-in-ten Orthodox adults say it is about some combination of religion, ancestry, and culture, or all three of these.

The vast majority of Jews of no religion say that for them, being Jewish is mainly a matter of ancestry (41%), culture (25%) or both (15%).

U.S. Jews more likely to say being Jewish is about culture or ancestry than about religion; to many, Jewish identity is about more than one thing
Most Jews say remembering the Holocaust, leading an ethical and moral life are essential to being Jewish

The survey asked Jews whether each of 10 attributes and activities is essential, important but not essential, or not important to what being Jewish means to them. The answers show that to U.S. Jews, being Jewish is about many things. Fully three-quarters (76%) say remembering the Holocaust is an essential part of what being Jewish means to them, and nearly as many (72%) say leading an ethical and moral life is essential. Majorities of U.S. Jews say working for justice and equality in society (59%) and being intellectually curious (56%) are essential to being Jewish.

Half of U.S. Jews say continuing family traditions is an essential part of their Jewish identity (51%), and 45% say caring about Israel is essential. One-third or fewer mention having a sense of humor (34%), being part of a Jewish community (33%), eating traditional Jewish foods (20%) or observing Jewish law (15%) as essential aspects of their Jewish identity.

The survey also asked respondents to describe in their own words anything else that is essential to what being Jewish means to them; see topline for results.

Nine of these items (along with the final, open-ended question) were included in the 2013 survey, while the item about continuing family traditions is new. In terms of relative importance, respondents ranked the items similarly in each of the two surveys. For instance, remembering the Holocaust, leading an ethical and moral life, and working for justice and equality were the top three responses in both 2013 and 2020.21

While Jews by religion are more likely than Jews of no religion to consider each of the 10 attributes or activities in the 2020 survey essential to being Jewish, both groups generally rank the items in a similar order. Majorities of both Jews by religion and Jews of no religion cite remembering the Holocaust as essential, and both groups rank observing Jewish law and eating traditional foods toward the bottom of the list.

Despite these similarities, there are large gaps between the two groups on a few aspects of Jewish identity. For example, Jews by religion are far more likely than Jews of no religion to say that continuing family traditions is essential to what it means to them to be Jewish (61% vs. 24%). And Jews by religion are nearly twice as likely as Jews of no religion to say that caring about Israel is essential (52% vs. 27%).

Those with a Jewish spouse differ significantly from those without one on the importance of continuing family traditions. Among Jews with a Jewish spouse, seven-in-ten say continuing family traditions is essential to what it means to them to be Jewish, while far fewer Jews married to spouses who are not Jewish (37%) say the same.

Older Jews are more likely than younger generations to see certain things as essential to being Jewish. Compared with Jewish adults under the age of 30, larger shares of those 65 and older rank remembering the Holocaust, caring about Israel, being intellectually curious and having a good sense of humor as essential parts of their Jewish identity. However, younger Jews more likely than the eldest cohort to say that observing Jewish law is essential to being Jewish (19% vs. 12%).

What’s essential to being Jewish also tends to vary according to the respondent’s branch or stream of Judaism. Orthodox Jews are more likely than the non-Orthodox to say that following Jewish law and being part of a Jewish community are essential to what it means to them to be Jewish. Non-Orthodox Jews are more likely than the Orthodox to say that remembering the Holocaust, being intellectually curious and having a good sense of humor are essential.

Most Orthodox Jews say following Jewish law is essential to being Jewish

Three-quarters of Jews believe in higher power of some kind, but just one-quarter believe in God as described in the Bible

Overwhelming majority of Orthodox believe in God of the Bible; most Conservative and Reform do not

Three-quarters of U.S. Jews say they believe in God or some spiritual force in the universe, including 26% who say they believe in “God as described in the Bible” and about twice as many (50%) who believe in some other spiritual force. Belief in God is much more widespread among Jews by religion than among Jews of no religion. But even among Jews by religion, 14% say they do not believe in any higher power or spiritual force. Meanwhile, 44% of Jews of no religion say they do not believe in any higher power.

Nine-in-ten Orthodox Jews (93%) say they believe in the God of the Bible, compared with 37% of Conservative Jews, 18% of Reform Jews and 12% of Jews with no denomination.

U.S. Christians are far more likely than U.S. Jews to say they believe in God as described in the Bible, and far less likely to say they believe in some other higher power – or no higher power at all.

American Jews derive a great deal of meaning from spending time with family and friends

The survey also included a set of questions asking respondents to rate how much meaning and fulfillment they draw from each of seven possible sources: spending time with family; spending time with friends; their religious faith; being outdoors and experiencing nature; spending time with pets or animals; their job, career or education; and arts and literature, such as music, painting and reading.

Three-quarters of U.S. Jews say they derive a great deal of meaning from spending time with their family (74%), and six-in-ten find a great deal of fulfillment in spending time with friends (61%). Arts and literature (55%), spending time outdoors (51%), spending time with pets (43%) and jobs (38%) also are common sources of meaning and fulfillment. Among Jews, religious faith is by far the least common source of meaning of all the options presented by the survey; just one-in-five U.S. Jews say they get a great deal of meaning and fulfillment from their religion.

Jews by religion are somewhat more likely than Jews of no religion to say they draw a great deal of meaning from their families and from their faith, although even among Jews by religion, only a quarter say their religious faith carries a great deal of meaning.

There are also differences in where Jews find meaning based on their denominational affiliation. Nearly nine-in-ten Orthodox Jews say they find spending time with family very meaningful (86%), compared with three-quarters of Conservative and Reform Jews. And three-quarters of the Orthodox find a great deal of meaning in their religious faith, versus 32% of Conservative and just 13% of Reform Jews. Conversely, non-Orthodox Jews are far more likely than the Orthodox to find meaning in arts and literature as well as pets or animals.

Jewish Americans are less likely than U.S. adults as a whole to find a great deal of meaning in their religious faith (20% vs. 40%).

One-in-five U.S. Jews say their religious faith is highly meaningful, fulfilling


3. Jewish practices and customs

Jewish Americans are not a highly religious group, at least by traditional measures of religious observance. But many engage with Judaism in some way, whether through holidays, food choices, cultural connections or life milestones.

For instance, roughly seven-in-ten Jews say they often or sometimes cook or eat traditional Jewish foods, making this the most common form of engagement with Jewish life among a wide range of practices and activities measured in the survey. And six-in-ten say they at least sometimes share Jewish culture and holidays with non-Jewish friends, that they held or attended a Seder last Passover, or that they observed a Jewish ritual to mark a lifecycle milestone (like a bar or bat mitzvah) in the past year.

Just one-in-five U.S. Jews say they attend religious services at a synagogue, temple, minyan or havurah at least once or twice a month, compared with twice as many (39%) who say they often or sometimes mark Shabbat in a way that is “personally meaningful” to them.

When Jews who do not attend religious services regularly are asked why they don’t attend more often, the most commonly offered response is “I’m not religious.” A slightly smaller majority cite lack of interest as a reason for not attending more often, and more than half of non-attenders say they express their Jewishness in other ways. Among Jews who do attend religious services regularly, about nine-in-ten say they do so because they find it spiritually meaningful.

This chapter explores these and other questions about participation in Jewish life in more detail.

Holidays and milestones

Six-in-ten Jews say they attended a Seder or Jewish milestone event in the past year

Six-in-ten U.S. Jews say they held or participated in a Seder in the year prior to the survey, and a similar share say they attended a ritual to mark a lifecycle passage or milestone, such as a bar mitzvah or bat mitzvah. Somewhat fewer (46%) say they fasted all or part of Yom Kippur.

Respondents who are Jewish by religion are far more inclined than Jews of no religion to participate in these kinds of activities. And Jews with spouses who are also Jewish are more likely than intermarried respondents to have taken part in a Seder, fasted on Yom Kippur and gone to a ritual like a bar or bat mitzvah in the past year.

Jews under the age of 50 are less likely than older Jews to have participated in rituals to mark life cycle milestones. But the youngest Jewish adults (under age 30) are more likely than the oldest Jewish adults to have fasted on Yom Kippur. (Those who cannot fast for health reasons are not obligated to do so.)

Four-in-ten Jews say they regularly mark Shabbat in a way that is meaningful to them

Orthodox Jews are more likely than those in other streams (or in no particular branch) of U.S. Judaism to have participated in a Seder, fasted on Yom Kippur, and engaged in a Jewish ritual to mark a life milestone.

Four-in-ten U.S. Jews say they often (20%) or sometimes (19%) mark Shabbat in a way that is meaningful to them. For some this might include traditional practices like resting, attending religious services or lighting candles. For others, it might involve gathering with friends or doing community service.

As with so many other forms of participation in Jewish life, marking Shabbat in a personally meaningful way is much more common among Jews by religion than among Jews of no religion. It also is more common among in-married Jews (marriages between people of the same religion) than among those who are married to non-Jewish spouses. And it is most common among Orthodox Jews and least common among those with no denominational ties.

Most U.S. Jews connect with Judaism through food, Jewish historical sites; many others connect through Jewish media

The survey included a variety of questions that asked respondents how they engage with Jewish culture. About seven-in-ten U.S. Jews say they “often” or “sometimes” cook or eat Jewish foods, making this the most common form of participation in Jewish culture asked about in the study. Six-in-ten say they at least sometimes share Jewish culture and holidays with non-Jewish friends. And most U.S. Jews (57%) also say they visit historical Jewish sites when they travel.

Smaller shares report often or sometimes reading Jewish literature, history or biographies (44%), watching television with Jewish or Israeli themes (43%), reading Jewish news in print or online (42%), or listening to Jewish or Israeli music (36%). One-quarter of U.S. Jews say they go to Jewish film festivals or seek out Jewish films at least sometimes, and 17% say they participate in online conversations about Judaism or being Jewish.

Watching television with Jewish themes and seeking out Jewish films and film festivals is more common among older Jews (ages 50 and older) than among younger Jewish adults. On the other questions, however, the differences between older and younger Jews tend to be modest.

Most U.S. Jews say they share Jewish culture and holidays with non-Jewish friends, among other ways of engaging with their Jewishness

Orthodox Jews are more likely than those who belong to other branches or streams of American Judaism to say they regularly cook or eat Jewish foods, visit Jewish historical sites, read Jewish news and literature, and listen to Jewish music. Jewish television and films, by contrast, factor much less prominently in Orthodox Jewish life; Orthodox Jews are less likely than both Conservative and Reform Jews to say they often or sometimes watch television with Jewish themes.

The survey also asked respondents to describe in their own words anything else they do that makes them feel connected with Jews and Judaism; see topline for results.

Jewish political expression

Three-in-ten Jews say they often or sometimes engage in political activism as an expression of their Jewishness. This is especially common among those who identify with Conservative Judaism (45%).

Three-in-ten U.S. Jews engage in political activism as expression of Jewishness

Engaging in political activism as an expression of Jewishness is about equally as common among Jews who identify with or lean toward the Republican Party (28% of whom say they at least sometimes engage in political activism as an expression of Jewishness) as it is among Jewish Democrats and those who lean Democratic (31%).

Keeping kosher

Fewer than one-in-five U.S. Jews (17%) say they keep kosher in their home, including 14% who say they separate meat and dairy and 3% who say they are vegetarian or vegan.

Keeping kosher is nearly ubiquitous in Orthodox homes: Fully 95% of Orthodox Jews in the survey say they keep kosher. About one-quarter of Conservative Jews (24%) say they keep kosher in their home. And among Reform Jews and those with no denominational association, roughly one-in-twenty say they keep kosher in their home (5% among Reform Jews, 6% among those unaffiliated with any particular branch of Judaism).

Ownership of Jewish items

Eight-in-ten U.S. Jews say they own a menorah, a candelabra used to mark the eight days of Hanukkah. Nearly two-thirds own a mezuzah, which is a parchment containing scripture passages typically affixed to the doorposts in Jewish homes. Six-in-ten U.S. Jews say they own a Hebrew-language siddur (Jewish prayer book), and 56% say they have a Seder plate designed to hold the six symbolic foods associated with the Passover meal.

Keeping kosher nearly universal among Orthodox, far less common among others
Most Jews say they own a menorah, mezuzah

Jewish people who are married to Jewish spouses are more likely than intermarried Jews to own these examples of Judaica. The same is true of those who identify with an institutional stream of Judaism (especially Orthodox Jews), compared with those who identify with no particular branch.

Participation in Chabad

Overall, 16% of U.S. Jewish adults say they often or sometimes participate in activities or services with Chabad, an Orthodox Jewish movement and organization that offers programs and services to Jews throughout the U.S. and the world. This includes 5% who say they “often” do this and 12% who “sometimes” participate in Chabad activities. One-in-five Jewish adults (21%) say they rarely participate in activities or services with Chabad, and 62% say they never do.

Characteristics of those who participate in activities with Chabad

What are the characteristics of those who regularly engage with Chabad? The vast majority identify as Jewish by religion (90%) as opposed to Jews of no religion (10%). The age structure of those who participate with Chabad is very similar to the age structure of those who do not. Chabad participants are more likely than other Jews to have a Jewish spouse, and they have lower levels of education, on average, than Jews who do not participate in Chabad activities.

One-quarter of Chabad participants are Orthodox Jews (24%), and another quarter identify with Conservative Judaism (26%) – both much higher than the shares of Orthodox (5%) and Conservative (15%) Jews among those who rarely or never take part in Chabad events. But about half of Chabad participants are from other streams or don’t affiliate with any particular branch of Judaism, perhaps reflecting Chabad’s outreach toward less observant Jews.

Synagogue attendance and membership

One-in-five U.S. Jews say they attend services at a synagogue, temple, minyan or havurah at least once or twice a month, including 12% who go weekly or more often. One-quarter (27%) say they attend a few times a year, such as for High Holidays. And half of U.S. Jews (including roughly nine-in-ten Jews of no religion) say they seldom or never attend Jewish religious services.

Monthly attendance at Jewish religious services is equally common among Jewish men (20%) and women (21%), and roughly equivalent among younger Jews and older Jews. Those who are married to a Jewish spouse attend Jewish religious services at much higher rates (36% at least monthly) compared with those who are married to a non-Jewish spouse (5%) or who are not married (16%).

Eight-in-ten Orthodox Jews say they attend Jewish religious services at least once or twice a month, including 73% who do so at least once a week. Worship attendance is less common among Conservative and Reform Jews, though most Conservative Jews and about half of Reform Jews attend at least a few times a year. Among Jews who have no particular denominational affiliation, about nine-in-ten (88%) seldom or never attend Jewish religious services.

Roughly half of U.S. Jews attend religious services at least a few times a year

Jewish Americans are less likely than U.S. adults overall to attend religious services regularly. One-in-five Jews say they attend a synagogue at least once per month, compared with about one-third of U.S. adults who say they attend religious services as often. However, Jews are more likely to say they go to religious services a few times a year (such as for High Holidays) than Americans overall (27% vs. 15%). Half of Jewish adults say they seldom or never go to synagogue, similar to the share of adults in the overall public who say they seldom (24%) or never (26%) go to church or other religious services.

Most Jews are not synagogue members

About one-third of U.S. Jews (35%) say they live in a household where someone is a formal member of a synagogue. This includes 46% of Jews by religion, compared with 5% of Jews of no religion.

Roughly nine-in-ten Orthodox Jewish respondents (93%) live in households where someone is a member of a synagogue, as do 56% of those associated with the Conservative movement. Fewer Reform Jews (37%) say they or someone else in their household belongs to a synagogue, and just 7% of Jews with no denominational affiliation say this.

Synagogue membership peaks at 43% among Jews in households with annual incomes of $200,000 or more. By contrast, one-quarter of Jews whose family income is less than $50,000 say that someone in the household is a synagogue member. Among U.S. Jews who attend synagogue a few times a year or less, 17% say cost is a reason they do not attend more often.

Because Pew Research Center’s 2013 survey was conducted by phone and the 2020 survey was conducted by mail and online, the results on synagogue attendance and membership are not directly comparable. A 2020 experiment (see Appendix B) indicates that Jewish Americans, like U.S. adults in general, tend to report higher levels of attendance at religious services when speaking with a live interviewer on the phone than they do when writing their answers in private. (Social scientists attribute this primarily to “social desirability” bias, the often unconscious desire to give answers that other people will like or expect.) In the case of synagogue attendance and membership, this means that any apparent change from 2013 to 2020 may be attributable to methodological differences between the two surveys rather than to real changes in behavior.

Among those who rarely or never attend synagogue, what keeps them away?

Most common reason offered by those who rarely or never attend religious services? ‘I’m not religious’

The survey asked Jews who attend religious services a few times a year or less (including those who never attend) whether each of a number of possible factors is a reason why they do not go more often. Respondents could select multiple reasons, indicating all that apply to them. The most common answer was “I’m not religious,” which two-thirds (including 86% of Jews of no religion) cite as a reason they do not regularly attend Jewish religious services. More than half say they are “just not interested” or that they express their Jewishness in other ways.

Roughly one-quarter of U.S. Jews (23%) say they do not attend services regularly because they do not know enough to participate, and 17% cite cost as a factor that keeps them away. And one-in-ten say they do not attend synagogue regularly either because they don’t feel welcome (7%) or because people treat them like they don’t belong (4%). Roughly one-in-ten or fewer say there are no nearby congregations for them to attend, that when they go they feel pressured to do more or donate more than they are comfortable with, that they fear for their security at synagogue, or that their poor health or limited mobility makes it difficult for them to attend.

Many young Jewish adults say they do not know enough to participate in synagogue services

Younger Jews are more likely than their elders to say that a lack of knowledge about how to participate keeps them away from Jewish religious services. Jews under age 50 also are significantly more apt than those who are older to say they are “just not interested” in attending religious services. At the same time, Jews under age 30 are less likely than older Jews to cite cost as a factor keeping them away from religious services.

Compared with Conservative and Reform Jews who do not attend religious services regularly, those who don’t affiliate with any particular branch or stream of U.S. Judaism are more inclined to cite lack of religiousness and lack of interest as factors. By contrast, Conservative and Reform Jews who attend infrequently are more likely than those with no denominational affiliation to say they express their Jewishness in other ways and to cite cost as an explanation for why they do not attend religious services.

Roughly one-in-five Jews with family incomes of less than $50,000 cite cost as a reason they do not attend religious services more often, which is not significantly different than the 15% of Jews with household incomes above $200,000 who say this.

Some Jewish community leaders have wondered whether intermarried Jews, Jews of diverse racial and ethnic backgrounds, and Jews who have family members from diverse racial and ethnic backgrounds might avoid synagogues because they do not feel welcome. The survey finds that 8% of intermarried Jews who rarely or never attend religious services say it is because they don’t feel welcome, virtually identical to the 7% of in-married Jews who say this. But Jews who live in households with at least one non-White person (including possibly the respondent) are somewhat more likely than Jews in households where everyone is White to cite an unwelcoming atmosphere as a reason for not attending religious services (11% vs. 6%). The survey did not include enough interviews with Jewish adults who identify as Hispanic, Black, Asian, some other race or multiracial to reliably report their views, either as separate racial/ethnic groups or even in aggregate (as all non-White respondents combined).

A closer look at those who do not attend synagogue regularly but say they express their Jewishness in other ways

More than half of U.S. Jews who attend religious services a few times a year or less often say that one of the reasons they do not go more is that they “express their Jewishness in other ways,” making this one of the most commonly cited reasons for not attending religious services. This raises the question: How – if at all – does this group express Jewishness in other ways?

The survey finds that, among Jews who attend a few times a year or less, those who give this response are more engaged in Jewish life on a variety of measures than those who do not say it’s because they express their Jewishness in other ways. For example, 74% of non-attenders who say they express their Jewishness in other ways report often or sometimes sharing Jewish culture and holidays with non-Jewish friends, and 63% held or attended a Seder last year. By contrast, among non-attenders who do not give this explanation for why they do not go to religious services, the comparable figures are 44% and 47%, respectively.

The survey also shows, however, that non-attenders who say they do not go to religious services because they express their Jewishness in other ways are consistently less engaged in Jewish life than are Jews who do attend religious services at least once or twice a month.

Among Jews who do not regularly attend synagogue but say they express their Jewishness in other ways, what are the most common practices?

Among regular synagogue attenders, what motivates them to attend?

The survey also asked the 20% of U.S. Jews who do attend religious services at least once or twice a month about their reasons for doing so. Within this group, fully 92% say they do so because they find it spiritually meaningful, while 87% point to the sense of belonging they derive and 83% cite a connection to their ancestry and history. Smaller majorities say continuing their family’s traditions (74%), learning something new (69%), feeling a sense of religious obligation (65%) or socializing (62%) are factors in why they attend regularly.

Fewer than half say they attend primarily because of their family, spouse or partner (42%) or because they would feel guilty if they didn’t (22%).

Reasons for attending synagogue

Jewish men are more likely than women to say they attend religious services regularly out of a sense of obligation, while Jewish women are a bit more likely than men to say they go to see friends and socialize. Orthodox Jews are more apt than other Jews to cite continuing family traditions and a sense of obligation as reasons for their frequent religious attendance. By contrast, non-Orthodox Jews more commonly cite the knowledge they gain and the opportunity to socialize as reasons they regularly attend religious services.

Sidebar: Most U.S. Jews don’t go to synagogue, so rabbis and a host of new organizations are trying to innovate

Even before COVID-19 led synagogues to shut their sanctuaries, non-Orthodox Jews in America hadn’t been flocking to weekly Shabbat services. Most go to services just a few times a year at most, and fewer than half are members of a synagogue, according to Pew Research Center’s 2020 survey of American Jews, conducted mostly prior to the coronavirus outbreak. To provide another window into some of the changes occurring in American Jewish life, Pew Research Center conducted a series of in-depth interviews with rabbis and other Jewish leaders. These conversations were separate from the survey of U.S. Jews. Although the interviewees were not selected in a scientific manner, and hence are not representative of Jewish leaders overall, we sought a diversity of viewpoints and have tried to convey them impartially, without taking sides or promoting any positions, policies or outcomes.

To provide another window into some of the changes occurring in American Jewish life, Pew Research Center conducted a series of in-depth interviews with rabbis and other Jewish leaders. These conversations were separate from the survey of U.S. Jews. Although the interviewees were not selected in a scientific manner, and hence are not representative of Jewish leaders overall, we sought a diversity of viewpoints and have tried to convey them impartially, without taking sides or promoting any positions, policies or outcomes.

In a series of in-depth interviews separate from the survey itself, nearly three dozen rabbis and Jewish community leaders described their efforts to increase engagement in Jewish life. Many have concluded that, in the 21st century, they cannot assume Jewish families will join a synagogue – or be active in one – out of obligation. Instead, they think synagogues and other Jewish organizations need to come up with new and unconventional ways to engage with Jews who don’t go to religious services, can’t read Hebrew and have varying levels of Jewish education.

“People today are looking to Jewish institutions to satisfy them where they are,” said Rabbi Howard Stecker of Temple Israel in Great Neck, a Conservative synagogue in Long Island, New York. “People are looking to find something that’s meaningful in their lives. If a synagogue can provide it – is nimble enough – then people will respond to the extent that their needs are being satisfied. But the idea that you support a synagogue just because that’s the right thing to do … seems to be fading over time in the 20-plus years that I’ve been a rabbi.”

The 2013 Pew Research Center survey pointed to the growth of “Jews of no religion,” particularly among young Jewish adults – an echo, in Jewish life, of the rise of the “nones” in American religious life more broadly. The 2020 study finds that among Jews who go to synagogue no more than a few times a year, roughly half (55%) say they have “other ways” of expressing their Jewishness. Many cite multiple, overlapping reasons for not going to a synagogue: Two-thirds say they aren’t religious, 57% say they are “just not interested” in religious services, and nearly a quarter (23%) say they “don’t know enough” to participate.

Many of the rabbis interviewed are attempting various experiments – some rather modest, others more ambitious – designed to make Jews more comfortable in religious settings. For example, Rabbi Ron Fish of Temple Israel in Sharon, Massachusetts, said that for Jews disinclined to attend traditional services, his synagogue has a monthly Shabbat service that includes drumming and meditation. And, on the second day of Rosh Hashanah each year, it has offered an outdoor service – “Rosh Hashanah in the Woods,” billed as “a Rosh Hashanah experience where we can be ourselves, pray differently, relate to God, and reach within to access a spiritual dimension not always attainable in a sanctuary.”

Another approach is to lead religious discussions at a local bar, often under a cheeky moniker such as “Torah on Tap.” “I meet them in their environment,” said Rabbi Mark Mallach, rabbi emeritus of Temple Beth Ahm Yisrael in Springfield, New Jersey. “I pay for the first round. I try to come up with discussion topics relevant to them.”

Besides synagogues, many other organizations are trying to draw in young Jewish adults, families with children, intermarried couples, and other hard-to-reach segments of the population. The list of new organizations is long, as major donors to Jewish causes increasingly are funding nonprofits that foster engagement with Jewish life in specific ways. In “Giving Jewish: How Big Funders Have Transformed American Jewish Philanthropy,” Jack Wertheimer, professor of American Jewish History at the Jewish Theological Seminary, describes a decades-long shift in patterns of charitable giving. Whereas in the mid-to-late 20th century big donors tended to give to umbrella organizations such as Jewish Federations and UJA (United Jewish Appeal) campaigns and to causes such as supporting Israeli institutions, Wertheimer writes, the more recent trend, starting in the 1990s, has been to fund specific initiatives to increase Jewish engagement (i.e., “activities that bring the least involved Jews to episodic gatherings of a Jewish flavor”) and to build Jewish identity. He estimates that the top 250 Jewish foundations together give grants totaling $900 million to $1 billion per year for Jewish purposes.

Some of these “spiritual startups” have benefitted from seed capital and training provided by incubator organizations like UpStart, which distributes roughly $1.5 million a year in grants, according to Aaron Katler, UpStart’s chief executive officer.

Among the nonprofits that have grown rapidly in recent years: Moishe House, founded in Oakland, California, in 2006, helps Jews in their 20s form strong communities. Limmud, founded in the UK in the 1980s, expanded internationally in 1999 and now organizes festivals, workshops and other events fostering Jewish learning around the world. PJ Library began free distribution of Jewish children’s books in 2005 and now distributes works by authors and illustrators in multiple languages in more than 30 countries. The Jewish Emergent Network was founded in 2014 by rabbis of seven unaffiliated communities (including IKAR in Los Angeles and Sixth & I in Washington) to share ideas and build on their respective successes in “attracting unaffiliated and disengaged Jews to a rich and meaningful Jewish practice.” And Hazon, a newly reinvigorated nonprofit that traces its roots back to the Jewish Working Girls Vacation Society in 1893, fosters environmental sustainability.

Another recent example is OneTable, which brings together Jews in their 20s and 30s for Shabbat dinners at people’s homes. Anyone in that age range (except for college students) can apply on OneTable’s website to host Shabbat dinners or can select among a list of Shabbat dinners being hosted in their area. OneTable, with financial support from Jewish foundations, subsidizes each dinner with $10 per attendee, up to $100.

In 2019, OneTable funded around 9,000 Shabbat meals in more than 400 cities across the United States, with a total of 109,000 people participating (including repeaters), said Aliza Kline, its chief executive officer. In her view, the numbers prove that young American Jews are open to religious experiences outside of synagogue settings. “This generation is less engaged institutionally than other generations, but that doesn’t mean they’re not spiritually connected. … This is a DIY ritual by design, and that really fits with how people are connecting with their culture, their traditions,” Kline said.

Yet alongside these – and many other – growing organizations, there are plenty of Jewish spiritual startups that have failed to catch on, as well as older organizations that have been losing ground, like the once-flourishing NJOP (National Jewish Outreach Program), which for more than 30 years has funded programs to teach Jews to read Hebrew and to celebrate Shabbat at a synagogue. More than 250,000 Jews have studied Hebrew through the program, and more than 1 million have attended its “Shabbat Across America and Canada” program, said Rabbi Ephraim Buchwald, NJOP’s director.

But attendance has declined dramatically at both of these synagogue-based programs over the last 15 years, Buchwald said. Even before the pandemic, enrollment in the Hebrew programs had dropped to around 4,000 a year from 10,000, and Shabbat Across America and Canada drew around 20,000 annually, down from 80,000. “People just stopped responding, so the numbers of people that we’ve been teaching has dropped precipitously … I think because the young people are not interested in these types of programs,” Buchwald said. “They’re not interested in coming to a synagogue.”

Some rabbis said the American Jewish community seems less cohesive now than just a few decades ago, when the memory of the Holocaust was more fresh, Israel was widely viewed as an underdog in its conflict with surrounding Arab states, and support for Soviet Jews galvanized Jewish communities. Paradoxically, Jewish religious institutions may also be a victim of the success Jews have had in integrating into American society: There has been a blurring of the lines between Jewish and non-Jewish identity, and Jews are less likely to depend on synagogues for their social circles than was the case decades ago, according to the rabbis.

“In the past, membership was more of a given,” said Rabbi Angela Buchdahl of Central Synagogue in New York City. “People felt they had to join a synagogue in order to belong and affiliate. Now I would say, there’s a lot more ‘do-it-yourself Judaism’ and internet Judaism and virtual Judaism.”

The price of membership, often a few thousand dollars a year, also can keep people from joining a synagogue, the rabbis said. In recent years, a small number of synagogues have done away with traditional dues structures, hoping to remove a barrier to membership. As of 2017, more than 60 synagogues across the country had eliminated mandatory dues, according to a national study conducted by the UJA Federation of New York. The study noted that these synagogues generally say their decisions led to membership increases, but that financial contributions per household also tend to be lower than before.

Rabbi Jay Siegel of Congregation Beth Shalom in Santa Clarita, California, said the voluntary dues structure instituted there in 2014 helped attract and retain members. “It created a very low barrier for membership, which was great because you had people who could participate that, under the classic dues structure, it might have been prohibitive. … And it removed some of the uncomfortable conversations. People hated being asked for money.”

One Jewish place of worship that never had a traditional, dues-based membership structure is Sixth & I, a synagogue and cultural center in Washington, D.C. Its senior rabbi, Shira Stutman, said Sixth & I caters mainly to people in their 20s and 30s, a group that she feels has been underserved by traditional synagogues, which tend to be family-centered. For its budget, the synagogue relies on a group of major donors, institutional funders and more than 3,000 individuals who give money at least annually. In addition, it asks visitors to pay to attend its arts and cultural events, social activities, religious classes, and meals after Shabbat services. In a typical year prior to the coronavirus pandemic, the synagogue drew about 80,000 paying visitors; in 2020, it shifted to mostly online events, which brought in similar numbers of participants but lower revenues, she said.

“People will pay for things that they think are meaningful to them if you give them something quality,” Stutman said. “Many of these kids are spending $18 on one cocktail in a bar. If they can spend $18 on a cocktail, they can spend $18 for a class.”

A much different approach to engagement is taken by Chabad-Lubavitch, a Brooklyn-based organization with Hasidic origins in Russia and Poland that sends emissaries (“shlichim”) to the far corners of the globe and attracts many non-Orthodox Jews even though its leaders are Haredi (ultra-Orthodox). Chabad synagogues don’t have membership dues. Instead, they seek donations from Jews who go to their adult-education classes, attend their services and holiday celebrations, and have Shabbat dinners at their rabbis’ homes, which sometimes may double as synagogues, said Rabbi Motti Seligson, a spokesman for Chabad-Lubavitch.

Overall, 16% of American Jews say they participate in Chabad activities or services either “often” (5%) or “sometimes” (12%), according to the 2020 survey. About half of those participants identify as Reform or Conservative Jews. Seligson said Chabad’s approach allows Jews to form meaningful personal connections with rabbis more easily than is generally the case at larger synagogues.

“You may first meet the rabbi for coffee and start a weekly class, and maybe you’ll be over with your family for a Shabbat diner at the rabbi’s home a number of times,” he said. “That may all be before you begin attending synagogue. … You may not even feel comfortable going to ‘the synagogue part’ of this community, but you’ll still be part of the community and still be embraced.”

4. Marriage, families and children

About two-thirds of U.S. Jewish adults are either married (59%) or living with a partner (7%). Among those who are married, many have spouses who are not Jewish. Fully 42% of all currently married Jewish respondents indicate they have a non-Jewish spouse. Among those who have gotten married since 2010, 61% are intermarried.

At the same time, intermarriage is very rare among Orthodox Jews: 98% of Orthodox Jews who are married say their spouse is Jewish. If one excludes the Orthodox and looks only at non-Orthodox Jews who have gotten married since 2010, 72% are intermarried.

The survey finds that among married Jews who are currently parents of minor children in their household, those who have a Jewish spouse are far more likely than those who are intermarried to say they are raising their children as Jewish by religion. And among married Jews overall (not just parents), those who are intermarried are less likely than those with a Jewish spouse to say it is very important to them that their potential grandchildren be Jewish.

However, as previously noted in the Overview of this report, statistical analysis also shows that Jews ages 18 to 49 who have one Jewish parent are more likely than those ages 50 and older to describe themselves as Jewish. In other words, it appears that the offspring of intermarriages have become increasingly likely to identify as Jewish in adulthood.

In addition to finding that intermarriage is more common among U.S. Jews who have married in recent years than among those who married decades ago, the survey also suggests that interracial/ethnic marriage has been rising over time among Jewish Americans. And 2% of Jews who are married now indicate that their spouse is of the same sex.

Most U.S. Jews – with the exception of the Orthodox – say that rabbis should perform interfaith weddings. The same is true for same-sex weddings.

This chapter also looks at how current Jews who have minor children living in their households say they are raising those children, as well as how Jewish adults they say they were raised when they were children, including what kinds of formal Jewish education they received. For instance, about half of Jewish adults who were raised Jewish or had a Jewish parent say they had a bar or bat mitzvah (a Jewish coming of age ceremony) when they were young, and about four-in-ten attended a summer camp with Jewish content.

Intermarriage is common among American Jews

Rates of religious intermarriage can be calculated in a variety of ways, which can result in confusion when making comparisons among studies. For example, some focus on the percentage of couples who are intermarried, rather than the percentage of Jewish individuals who are married to a person of a different faith; a couples intermarriage rate is always higher, because two Jews who are married to each other count as one couple, while two Jews who are intermarried count as two couples. Additionally, researchers can base their calculations on whether a couple had the same religion at the time of their marriage, or whether they have the same religion at present. In theory, one could even try to calculate rates based on all previous marriages, including those that ended in divorces or deaths – though in practice, asking respondents to describe their previous marriages may be perceived as intrusive, and this study did not attempt to do so. Finally, the same considerations that go into defining which respondents are Jewish (see Overview) come into play when deciding which spouses are Jewish.

For all these reasons, it is important to specify that this analysis focuses on current, intact marriages among individual Jewish respondents at the time of this survey. It relies on the respondents’ descriptions of the religion of their spouses at the time of the survey (the spouses were not interviewed separately). And it defines spouses as Jewish in the same way that respondents are categorized, including both Jews by religion and those who identify as Jewish in other ways.

As of 2020, the survey indicates that about six-in-ten U.S. Jewish adults are married (59%), and an additional 7% are living with a partner. As was the case in 2013, Jews by religion are more likely than Jews of no religion to say they currently are married (62% vs. 50%). And Jewish adults are more likely than U.S. adults overall to be married (59% vs. 53%).

The 2020 survey also finds that 58% of all married Jews say they have a Jewish spouse, while 42% say they are married to a non-Jew. That overall intermarriage rate has not changed much in the last seven years. In the 2013 study, 56% of all married Jewish respondents said their spouse was Jewish, while 44% said they were married to someone who was not Jewish.

Jews of no religion are much more likely than Jews by religion to have a spouse who is not Jewish. Among all Jews by religion who are married, 68% have a Jewish spouse. By comparison, 21% of Jews of no religion who are married say their spouse is Jewish, while 79% report that they are married to someone who is not Jewish.

Intermarriage rates are lower among respondents who married decades ago. For example, among U.S. Jews who got married before 1980 and are still married, 18% are married to non-Jews. Among those who married between 1980 and 1999, about four-in-ten are intermarried. And among respondents whose current, intact marriage began in 2010 or later, 61% have a non-Jewish spouse. This pattern mirrors the findings from the 2013 survey.

While these patterns strongly suggest that intermarriage has been rising, especially over the long term, it is important to bear in mind several points when assessing rates of Jewish intermarriage. First, religious intermarriage also appears to be on the rise in the U.S. adult population more broadly. Second, some research indicates that “in-marriages” (marriages between people of the same religion) tend to be more durable than intermarriages. If this is the case, then the percentage of intermarriages in the 1970s and 1980s may have been higher than it appears from looking only at intact marriages today.

Third, the relatively small size of the U.S. Jewish population should be taken into account. If marital choices were purely random, the odds of one Jewish American marrying another Jewish American would be much smaller than the odds of one Protestant marrying another Protestant or one Catholic marrying another Catholic, since these Christian groups make up much larger shares of the overall population.22 For this reason, rates of intermarriage among Jews are perhaps most directly comparable to rates of intermarriage among other relatively small U.S. religious groups, such as Mormons and Muslims. Previous Pew Research Center surveys have found that compared with Jews, larger shares of Mormons (85%) and Muslims (87%) in the United States are married to someone with the same religion.

It also appears that various kinds of intermarriage have been rising not just among Jews, but in the U.S. public as a whole. This is particularly apparent in federal data on racial and ethnic intermarriage (the U.S. government does not collect data on religious intermarriage). In 1980, roughly 7% of new marriages were between spouses of a different race or ethnicity from one another. By 2019, that share had more than doubled to 19%.

Today, 11% of all married Jewish respondents say they have a different race or ethnicity than their spouse. But among those who got married between 2010 and 2020, fully one-in-five (21%) say their spouse has a different race or ethnicity, compared with one-in-ten or fewer among Jews who were married before 2010.23

For more information on racial and ethnic diversity among U.S. Jews, see Chapter 9.

Same-sex marriage is less common. As of 2019, four years after the U.S. Supreme Court ruled that states could not prohibit same-sex marriages, fewer than 1% of marriages among U.S. adults overall are same-sex marriages.24 Among U.S. Jews who are married, 2% say they are married to a spouse who is the same sex, while 3% of Jews who are married or living with a partner have a partner who is the same sex.

Rates of Jewish intermarriage (the percentage of married Jewish respondents in the survey who say their spouse is not Jewish either by religion or aside from religion) vary considerably across the major U.S. branches or streams of Judaism. Nearly all Orthodox respondents who are married have a Jewish spouse (98%), as do three-quarters of married Conservative Jews (75%). About six-in-ten Reform Jews who are married have a Jewish spouse (58%), while among married Jews who have no branch affiliation, just 32% have a Jewish spouse.

The survey also suggests that intermarriage is much more common among Jewish respondents who are themselves the children of intermarriage. Among married Jews who report having only one Jewish parent, 82% say their spouse is not Jewish, and just 18% say their spouse is Jewish. By contrast, among married Jews who report that both of their parents were Jewish, 34% are intermarried and 66% have a Jewish spouse.

Most Jews say rabbis should officiate at religious intermarriages and same-sex marriages

The survey asked whether rabbis should perform interfaith marriage ceremonies, offering respondents three options: yes, they should; no, they should not; or, it depends. The “it depends” option did not specify any particular factor(s) but was included because some rabbis who officiate at interfaith weddings do so under certain conditions, such as that the couple promise to raise any future children they may have as Jewish, or that the ceremony does not take place in a church or another religion’s house of worship.

Overall, roughly two-thirds of U.S. Jews (64%) say rabbis should perform interfaith marriage ceremonies, while 9% say rabbis should not perform such ceremonies. Fully one-quarter say it depends on the situation.

While majorities of Reform Jews (77%) and Jews outside of any branch (70%) say rabbis should perform interfaith marriage ceremonies, somewhat fewer Conservative Jews (53%) take that position. And about three-quarters of Orthodox Jews (73%) say rabbis should not officiate at interfaith weddings, with an additional 18% of Orthodox respondents saying it depends on the situation. Just 8% of Orthodox Jews say flatly that rabbis should perform interfaith marriage ceremonies.

In answer to a similarly worded question about same-sex weddings, 71% of U.S. Jews say that rabbis should perform same-sex marriage ceremonies, while 15% say rabbis should not perform such ceremonies, and 13% say it depends.

Majorities of most Jewish subgroups – including Reform Jews (84%), Conservative Jews (63%) and Jews ages 65 and older (69%) – are in favor of rabbis officiating at same-sex weddings. But about eight-in-ten Orthodox Jews (82%) say rabbis should not perform same-sex marriage ceremonies. And, relatedly, Republicans are somewhat divided on this issue. One-third of Jewish Republicans – who are much more heavily Orthodox than Democrats – say rabbis should officiate at same-sex marriages, while 44% say they should not and one-in-five (21%) say it depends.

Most married Jewish parents say they are raising their children as Jewish by religion

About eight-in-ten Jews who are currently parents or guardians of at least one child residing in their household say they are raising their children as Jewish in some way. Six-in-ten are raising their children as Jewish by religion (60%), while 6% say they are raising their children as partly Jewish and partly in another religion, and 13% are raising at least one child Jewish but not by religion. One-in-five (19%) say they are not raising their children as Jewish at all.

Eight-in-ten Jews by religion who are parents of minor children in their household say they are raising their children Jewish by religion, 7% are raising their children partly Jewish by religion and partly another religion, and 5% are raising them Jewish but not by religion. The survey did not obtain enough interviews with Jews of no religion who are also parents or guardians of minor children to report on them as a separate group.

Two-thirds of married Jews who are parents or guardians of minor children in their household say they are raising those children as Jewish by religion (65%). This is particularly common among Jewish parents with a Jewish spouse: 93% say they are raising their children Jewish by religion. By comparison, 28% of Jews married to non-Jews are raising their children Jewish by religion. A similar share of intermarried Jews are raising at least one child Jewish but not by religion (29%), while 12% are raising children in multiple religions and 30% are not raising their children as Jewish at all.

The survey included a series of questions asking respondents to imagine their grandchildren (whether they have any at present, or not) and asking how important it would be to them for their grandchildren to be Jewish, to share their core political convictions, to carry on their family name and to marry someone who is Jewish.

Roughly one-third of U.S. Jews say it is very important that their grandchildren be Jewish (34%), while somewhat fewer say it would be very important for their grandchildren to marry someone who is Jewish (22%). About a quarter say it is very important that their grandchildren share their political convictions (26%) or carry on the family name (26%).

Jews by religion are far more likely than Jews of no religion to say it is very important to them for their grandchildren to be Jewish (45% vs. 4%).

Orthodox Jews are much more likely than Conservative, Reform and denominationally unaffiliated Jews to say it would be very important to them that their grandchildren be Jewish and marry someone Jewish.

Most who currently identify as Jewish were raised Jewish by religion

Eight-in-ten Jewish adults say they were raised Jewish, including three-quarters who say they were raised Jewish by religion (73%) and 8% who were raised as Jewish of no religion. (The “raised Jewish of no religion” category consists of respondents who say they were raised as atheist, agnostic or “nothing in particular” in terms of religion but were raised as Jewish in some other way, such as ethnically, culturally or by family background, and had a Jewish parent.)

Among adults who currently identify as Jewish, 5% say they were raised in another religion but were also raised Jewish aside from religion and had at least one Jewish parent; 10% say they were not raised Jewish in any way but had at least one Jewish parent; and 5% were not raised Jewish and did not have a Jewish parent.

More than eight-in-ten Jews by religion were raised Jewish by religion, twice the share of Jews of no religion who say the same (84% vs. 40%). Among Jews of no religion, an additional 27% say they were not raised Jewish in any way but had a Jewish parent, while one-in-five say they were raised as Jewish of no religion.

Orthodox Jews are the most likely to say they were raised Jewish by religion (95%), followed by Conservative (86%) and Reform (81%) Jews. Half of Jews who do not identify with any particular stream or institutional branch of Judaism say they were raised Jewish by religion (49%).25 In this group, three-in-ten had a Jewish parent but were raised in another religion (9%) or were not raised Jewish at all (21%), while 17% say they were raised Jewish but with no religion.

Just over half of adults who currently identify as Jewish were raised in the Reform (28%) or Conservative (26%) movements, and 10% were raised Orthodox. Roughly one-in-six Jews (16%) were raised Jewish but not within a particular Jewish denomination.

Among Jews by religion, about six-in-ten say they were raised Conservative (32%) or Reform (31%), while 14% were raised Orthodox. One in-five Jews by religion say they were not raised within any particular Jewish denomination (10%) or not raised Jewish at all (10%). By comparison, about a third of Jews of no religion say they were not raised within a Jewish denomination (34%), and an additional 27% say they were not raised Jewish at all. One-in-five Jews of no religion were raised Reform (22%), while 9% were raised Conservative and 1% say they were raised Orthodox.

Most Jewish adults who currently identify with a particular branch of Judaism were raised in that same branch. The vast majority of Jewish adults who currently identify as Orthodox were raised Orthodox (85%), seven-in-ten Conservative Jews were raised Conservative (69%) and 56% of Reform Jewish adults were raised in Reform Judaism. This indicates that the Reform movement draws many of its members from other backgrounds. For example, roughly a quarter of today’s Reform Jewish adults (23%) were raised in the Conservative movement.

These analyses can also be done in the opposite direction to show retention rates – e.g., among those who were raised Jewish (or Orthodox in particular), what percentage are still Jewish (or Orthodox) today? See the Overview for results.

An overwhelming majority of Jews say they have (or had) at least one Jewish parent, including 92% of Jews by religion. (By definition, all Jews of no religion either have a Jewish parent or were raised Jewish – for example, by a stepparent or a grandparent.)

Nearly all Orthodox Jews (96%) say that both of their parents are Jewish, and about eight-in-ten Conservative Jews (83%) say the same. While still a majority, somewhat fewer Reform Jews (72%) say they have two Jewish parents.

Roughly half of Jews who do not identify with any particular branch of U.S. Judaism say both of their parents are Jewish (52%), while about one-in-five each say only their mother (22%) or only their father (21%) is Jewish.

Jews ages 65 and older are much more likely than those under 30 to say both of their parents are or were Jewish (89% vs. 49%). Indeed, 46% of the youngest Jewish adults have one Jewish parent, as do 37% of Jews in their 30s and 40s.

Half of those raised Jewish, or who had a Jewish parent, have had a bar/bat mitzvah

One-in-four Jewish respondents who were raised Jewish or had a Jewish parent say they attended a full-time Jewish school, such as a yeshiva or Jewish day school, when they were growing up. Six-in-ten say they participated in some other kind of formal Jewish education program, such as Hebrew school or Sunday school, including nearly a quarter who did so for seven years or more. And four-in-ten say they attended a summer camp with Jewish content.

Meanwhile, half of U.S. Jews who were raised Jewish or had at least one Jewish parent (51%) – including a majority of Jews by religion (63%) – say they had a bar or bat mitzvah when they were young, similar to the share who said the same in the 2013 survey.26 Nearly a quarter (23%) of Jews of no religion also have had a bar or bat mitzvah.

Orthodox Jews who were raised Jewish by religion or had a Jewish parent are far more likely than non-Orthodox Jews to say they attended a full-time Jewish school or attended a summer camp with Jewish content for at least one year. But Conservative and Reform Jews who were raised Jewish or had a Jewish parent are much more likely than Orthodox Jews to say they attended some other kind of formal Jewish education program.

Having had a bar or bat mitzvah is far more common among Orthodox and Conservative Jews who were raised Jewish or had a Jewish parent than it is for Reform Jews or Jews who do not identify with a particular branch of Judaism. And overall, Jewish men are twice as likely as Jewish women to say they had a bar or bat mitzvah when they were growing up (68% vs. 34%).

Among Jews who were raised Jewish by religion or had a Jewish parent, younger adults are more likely than those in older cohorts to say they attended a full-time Jewish school or a Jewish camp growing up. But young Jewish adults are less likely than their elders to say they participated in some other kind of formal Jewish education program, such as a Sunday Hebrew school.

5. Jewish community and connectedness

CORRECTION (May 20, 2021): Due to a typographical error, a previous version of the table “About half of U.S. Jews feel ‘a great deal’ of belonging to the Jewish people” misstated the percentage of Conservative Jews who feel some sense of belonging to the Jewish people. The actual share is 26%.

About three-quarters of Jewish Americans say at least “some” of their close friends are Jewish, including three-in-ten who say all or most of their close friends share their Jewish identity. Orthodox Jews are much more likely than Conservative or Reform Jews to report that all or most of their close friends are Jewish, and Jews who live in the Northeast are somewhat more likely than Jews in other regions to have a friendship circle that consists mostly or entirely of fellow Jews.

In addition, 85% of U.S. Jews say they feel at least “some” sense of belonging to the Jewish people, including roughly half who feel “a great deal” of belonging (48%). And eight-in-ten say they feel at least some responsibility to help fellow Jews in need around the world, including 28% who feel “a great deal” of responsibility. In general, Jews by religion are much more likely than Jews of no religion to share these feelings of connection. Looking at the opposite ends of the spectrum, nearly all Orthodox Jews (95%) express a great deal of belonging to the Jewish people, while just 13% of Jews of no religion feel the same way. (These two groups – Orthodox Jews and Jews of no religion – are categorized through different survey questions, but there is virtually no overlap: fewer than 1% of Jews of no religion identify as Orthodox, while 99% of Orthodox Jews identify as Jewish by religion.)

As noted in Chapter 2, one-third of Jewish adults say that being part of a Jewish community is essential to what being Jewish means to them, and an additional 39% say it is important, though not essential. In the survey (largely completed before the coronavirus pandemic affected daily life across the United States) about half of Jewish Americans say they made a donation to a Jewish cause in the past year. On these measures, too, Jews by religion – and especially Orthodox Jews – are notably more engaged in Jewish communities and causes than are Jews of no religion. For example, 61% of Jews by religion (including 88% of Orthodox Jews) said they made a donation to a Jewish charity in the year prior to taking the survey, compared with about one-in-ten Jews of no religion (11%).

The 2020 survey also asked Jewish respondents how much they feel they have in common with Jews in Israel, with various categories of American Jews, and with some other religious groups in the United States. A quarter of Jews by religion – including two-thirds of Orthodox Jews – say they have a lot in common with Israeli Jews, a position held by just 4% of Jews of no religion.

Most Jewish adults have at least some close friends who are Jewish

About three-in-ten U.S. Jews say that all (5%) or most (23%) of their close friends are Jewish, and 44% say that some of their close friends are Jewish. One-quarter say that hardly any or none of their close friends are Jewish. These results are roughly on par with the 2013 survey.

Nearly four-in-ten Jews by religion say that all or most of their close friends are Jewish (37%), compared with just 8% among Jews of no religion who say this.

An overwhelming majority of Orthodox Jews say all or most of their close friends are Jewish (88%), twice the share of Conservative Jews who say the same (44%). Fewer Reform Jews (23%) and Jews with no denominational affiliation (12%) have predominantly Jewish friend circles.

Older Jews report having more robust Jewish friendship networks than younger Jews, as do married Jews compared with unmarried Jews. Jews living in the Northeast – where Jews are disproportionately concentrated, as described in Chapter 10 – tend to have more Jewish friends than Jews living in the Midwest, South or West.

Most Jewish Americans feel a sense of belonging to the Jewish people and responsibility for fellow Jews in need

The vast majority of U.S. Jews say they feel either “a great deal” (48%) or “some” (37%) sense of belonging to the Jewish people. Jews by religion are far more likely than Jews of no religion to say they feel a great deal of belonging to the Jewish people (61% vs. 13%).

Nearly all Orthodox Jews included in the survey (95%) say they feel a great deal of belonging to the Jewish people, and roughly seven-in-ten Conservative Jews share this feeling (72%). Again, fewer Reform Jews (49%) and Jews with no denomination (21%) say the same.

Jews who say at least some of their close friends are Jewish are more than twice as likely as Jews who have hardly any or no close Jewish friends to say they feel a great deal of belonging to the Jewish people (59% vs. 20%).

In addition, a large majority of U.S. Jews say they feel at least some responsibility to help Jews in need around the world, including 28% who say they feel “a great deal” of responsibility to do this. Roughly one-in-five Jewish adults say they do not feel much responsibility (16%) or that they feel no responsibility at all (3%) to help Jews around the world.

About one-third of Jews by religion (35%) say they feel a great deal of responsibility to help Jews in need around the world, compared with one-in-ten Jews of no religion (11%) – although most Jews of no religion say they feel at least some responsibility for the welfare of fellow Jews worldwide.

Among Jews who identify as Orthodox, 80% say they feel a great deal of responsibility to help Jews in need, while 42% of Conservative Jews and 23% of Reform Jews share this view. Just 14% of Jews who do not have a denomination say they feel a great deal of responsibility to help Jews in need around the world, while an additional 51% feel some responsibility.

Feeling responsibility to take care of Jews around the world is linked with attachment to Israel: Four-in-ten Jews who feel at least somewhat attached to Israel say they feel a great deal of responsibility to take care of Jews in need around the world (42%), compared with just 10% of those with little or no attachment to Israel. (For more on attitudes toward Israel, see Chapter 7.)

This sense of responsibility is also tied to feelings of belonging: One-third of Jews who say they feel at least some sense of belonging to the Jewish people also say they feel a great deal of responsibility to take care of Jews in need around the world, compared with 6% of Jewish adults who feel less connected to the Jewish people.

When asked whether they made a financial donation to any Jewish charity or cause (such as a synagogue, Jewish school or group supporting Israel) in the 12 months prior to taking the survey, about half of Jews say they did (48%). Jews by religion are far more likely than Jews of no religion to say they made a donation to a Jewish charity in the past year (61% vs. 11%).

Older Jews, married Jews (particularly those with a Jewish spouse) and those reporting higher household incomes all are especially likely to donate to Jewish causes, as are Orthodox and Conservative Jews.

One-in-five U.S. Jews say they have a lot in common with Jews in Israel; Republicans more likely than Democrats to feel this way

Overall, six-in-ten U.S. Jewish adults say they feel they have either a lot in common (19%) or some things in common (40%) with Jews in Israel.

This includes fully two-thirds of Orthodox Jews who say they have a lot in common with Jews in Israel. By comparison, 30% of Conservative Jews, 12% of Reform Jews and 9% of Jews who do not identify with any branch of American Judaism say they have a lot in common with Israeli Jews.

Feelings of commonality with Jews in Israel are also tied to feelings of attachment to Israel. Among those who say they are very or somewhat attached to the Jewish state, 31% say they have a lot in common with Jews in Israel, compared with just 3% of respondents who say they are not too or not at all attached to Israel.

Similarly, U.S. Jews who have visited Israel at least once (or lived there) are much more likely than those who have never been to Israel to say they have a lot in common with Jews in Israel (33% vs. 8%).

There is a sharp partisan divide on this topic: Four-in-ten Jews who identify with or lean toward the Republican Party say they have a lot in common with Jews in Israel, compared with 12% of Jewish Democrats or Democratic leaners. (This is partly a reflection of the fact that three-quarters of Orthodox Jews surveyed say they are Republicans or lean Republican, but some partisan differences on this question remain even after controlling for differences in Jewish denominational affiliation and other demographic factors.)

Orthodox and Reform Jews see little in common with one another; Jews who don’t affiliate with any branch of Judaism see more in common with Muslims than with Orthodox Jews

Respondents also were asked how much they have in common with Reform, Conservative and Orthodox Jews, as well as with some other religious groups in the United States – specifically, mainline Protestants, evangelical Christians and Muslims.

On one hand, members of different branches of American Judaism generally do not feel they have “a lot” in common with one another. For instance, just 9% of Orthodox Jews say they have a lot in common with Reform Jews, and an identical share of Reform Jews (9%) say they have a lot in common with the Orthodox. Conservative and Orthodox Jews are only slightly more inclined to feel common ground between their groups. And while about four-in-ten Conservative Jews say they have a lot in common with Reform Jews, just 14% of Reform Jews feel the same way toward those in the Conservative movement.

At the same time, many Jews feel they have at least some things in common with Jews from other denominational streams. For instance, while 14% of Conservative Jews say they have a lot in common with the Orthodox, an additional 52% say they feel some common ground. And fully two-thirds of Reform Jews say they have at least “some” commonalities with Conservative Jews. Most Reform Jews and Jews with no denominational identity, however, say they have “not much” or “nothing at all” in common with Orthodox Jews (60% and 74%, respectively).

The survey also asked how much respondents feel they have in common with people in their own branch or stream of U.S. Judaism. Not surprisingly, Jewish Americans are more likely to say they have a lot in common with their own group than with other groups. But these feelings are not universal: Six-in-ten Reform Jews, for example, say they have a lot in common with Reform Jews as a whole, and a similar share of Conservative Jews say they have a lot in common with Conservative Jewry more broadly. Among Orthodox Jews, the figure is closer to eight-in-ten (79%).

On the whole, Jewish adults who say at least some of their close friends are Jewish are more likely than Jews who have hardly any or no close Jewish friends to say they have a lot in common with Reform, Conservative and Orthodox Jews.

Relatively few U.S. Jews say they have a lot in common with U.S. Muslims (4%), mainline Protestants (3%) or evangelical Christians (2%), with little variation across Jewish subgroups on these questions.

But far more Jewish adults say they have “some” things in common with mainline Protestants (35%) and Muslims (34%) than say the same about evangelical Christians (18%).

Reform Jews are more likely to say they have at least some in common with mainline Protestants (44%) than they are to say the same about Orthodox Jews (39%). And Jews who do not identify with any denominational branch are more likely to say this about both Muslims (33%) and mainline Protestants (30%) than about the Orthodox (24%).

6. Anti-Semitism and Jewish views on discrimination

Jewish Americans generally perceive a rise in anti-Semitism. More than nine-in-ten U.S. Jews surveyed say there is at least some anti-Semitism in America, and three-quarters say there is more anti-Semitism in the U.S. today than there was five years ago. The past half-decade has included several high-profile incidents of anti-Semitism, including White nationalists chanting “Jews will not replace us” in Charlottesville, Virginia, in 2017, and deadly shootings at synagogues in Pittsburgh (in 2018) and Poway, California (in 2019).

Among Jews who see anti-Semitism as having increased, the more common explanation is that people who hold anti-Semitic views now feel more free to express them, rather than that the number of Americans who hold anti-Semitic views is rising – although many Jews think that both of those things are happening.

About six-in-ten Jews report having had a direct, personal experience with anti-Semitism in the past 12 months, such as seeing anti-Semitic graffiti or vandalism, experiencing online harassment, or hearing someone repeat an anti-Semitic trope. Just over half also say they feel less safe as Jews in America than they did five years ago, while very few feel safer. Even so, the vast majority of those who feel less safe say it has not stopped them from participating in Jewish observances and events.

Despite many of these negative experiences, a third of U.S. Jews also have received recent expressions of support from someone who is not Jewish. And most Jews do not feel they are the only group that faces challenges in American society: Jews on the whole are more likely to say Muslim Americans (62%) and Black Americans (55%) face a lot of discrimination than they are to say the same about Jews (43%).

The remainder of this chapter explores these and related findings in greater detail.

Views about anti-Semitism

An overwhelming majority of Jewish Americans say there is at least some anti-Semitism in the U.S. today (93%), including 45% who say there is “a lot” of anti-Semitism and 47% who say there is “some.”

Jews by religion are far more likely than Jews of no religion to say there is a lot of anti-Semitism today (50% vs. 32%). Roughly half of Orthodox (50%), Conservative (53%) and Reform (49%) Jews share this view, compared with 36% of Jews who do not identify with any particular Jewish stream.

Additionally, those who wear distinctively Jewish items, women, older Jews, Jewish Democrats and Jews with less education are particularly likely to say there is a lot of anti-Semitism in America.

The majority of Jews surveyed say that anti-Semitism has risen in the United States. Indeed, three-quarters of U.S. Jews say there is more anti-Semitism in the country today than there was five years ago, while one-in-five say there is about the same amount (19%) and even fewer (5%) say there is less anti-Semitism than in the recent past.

Eight-in-ten Jews by religion say there is more anti-Semitism than there was five years ago, compared with 60% of Jews of no religion. Jews ages 65 and older are more likely than those under 30 to say anti-Semitism has increased in recent years (80% vs. 66%). And Jewish Democrats are more likely than Jewish Republicans to share this view (81% vs. 61%). (The survey coincided with former President Donald Trump’s final year in office.)

Those who say there is more anti-Semitism than there was five years ago were asked a follow-up question: Is the primary reason that more people now hold anti-Semitic views, or that people with anti-Semitic views now feel freer to express them? The vast majority say either that the rise in anti-Semitism is because Americans with anti-Semitic views feel more free to express those views (35% of all U.S. Jews) or that both are key reasons (33%). Very few Jewish Americans (5%) say the rise in anti-Semitism is taking place mainly because there are more people with anti-Semitic views.

Views on this question vary by political party – and, relatedly, they also vary based on opinions about Trump’s stance toward Jews. For example, Jews who identify with or lean toward the Democratic Party are more likely than Jewish Republicans (and Republican leaners) to say anti-Semitism has increased and the main reason is that people with anti-Semitic views feel freer to express them (42% vs. 17%). There is a similar split between Jews who say Trump was “unfriendly” toward Jews in the U.S. and those who say Trump was “friendly” toward Jewish Americans; those who saw Trump as unfriendly are much more likely to think anti-Semitism has risen because anti-Semitic people now feel more free to express their views (45% vs. 25%).

Meanwhile, Jewish Republicans are more likely than Jewish Democrats to say that anti-Semitism has declined in the past five years (10% of Republicans vs. 2% of Democrats); that levels of anti-Semitism in the U.S. have remained steady in recent years (28% vs. 16%); or that the main reason for the rise in anti-Semitism is that there are more people who hold anti-Semitic views (14% vs. 2%).

The survey also asked respondents whether they personally feel less safe (or more safe) as a Jewish person in America today, compared with five years ago. Just over half of U.S. Jews (53%) say they feel less safe today than five years ago, while about four-in-ten (42%) say they feel that not much has changed, and very few (3%) say they now feel safer.

Jews by religion, who perceive higher levels of anti-Semitism more broadly, also are more likely than Jews of no religion to say they feel less safe as Jews in America than they did five years ago (58% vs. 38%). Majorities of Orthodox (69%), Conservative (64%) and Reform Jews (56%) say they feel less safe than they did five years ago. By contrast, about half of Jews who do not identify with a particular stream of Judaism report no change in how safe they feel (53%).

Thus, the overall pattern is that more observant Jews are more likely both to perceive that anti-Semitism has increased and to feel that their safety has diminished. In addition, Jewish women, those ages 30 and older, Jews with a postgraduate degree, those who wear distinctively Jewish items and Jewish Democrats are especially likely to say they feel less safe than they did five years ago.

Those who say they feel less safe were asked a follow-up question: “Have you hesitated to participate in Jewish observances or events because you feel less safe than you did five years ago?” The aim of this question was to try to gauge not just changing perceptions about anti-Semitism, but also their impact on recent participation in Jewish events. Researchers deliberately linked the two questions to try to avoid the possibility that a desire to express strong concern about anti-Semitism might lead respondents to overstate its impact on their behavior.

Most Jews who say they feel less safe have not hesitated to participate in Jewish observances or events (35% of all U.S. Jews), while some (12% of all U.S. Jews) have hesitated but still participated. One-in-twenty Jewish Americans (5%) say they decided not to participate in some Jewish observance(s) or event(s) because they feel less safe.

Experiences with anti-Semitism

In addition to questions about their views on anti-Semitism in the U.S., the survey asked respondents about their experiences in the past year with five specific forms of anti-Semitism. Nearly four-in-ten Jews say they have seen anti-Jewish graffiti or vandalism in their communities (37%). Roughly one-in-five report having been made to feel unwelcome because they are Jewish, while 15% say they have been called offensive names, 8% say they have been harassed online and 5% say they have been physically threatened or attacked. All told, 51% of U.S. Jews report at least one of these five types of encounters over the past year.

Jews by religion are more likely than Jews of no religion to say they have faced these situations, and three-quarters of Orthodox Jews report having experienced at least one of these incidents. This may be explained, at least in part, by the fact that Orthodox Jews are more likely than other Jews to report wearing distinctively Jewish attire, such as a kippa; Jews who wear distinctively Jewish attire report higher rates of experiences with anti-Semitism.

Respondents also were asked whether, in the past 12 months, they have heard someone – either directly or secondhand – repeat one of three anti-Semitic tropes: that Jews care too much about money, that the Holocaust did not happen or its severity has been exaggerated, or that American Jews care more about Israel than the United States.

Far more Jews have heard someone say, directly in their presence, that Jews care too much about money (30%) than that the Holocaust did not happen (9%) or that American Jews care more about Israel than about the U.S. (6%). But more than six-in-ten Jews have heard or read secondhand – such as in news reports or on social media – about Holocaust denial (63%), compared with fewer who have heard or read about someone saying that Jews care too much about money (43%) or care more about Israel than the U.S. (36%).

Combining the previous two series of questions, the survey indicates that one-quarter of Jews (24%) experienced one or more of the five types of anti-Semitic incidents and heard firsthand at least one of the three anti-Semitic comments. A slightly higher share (27%) experienced at least one anti-Semitic event but did not hear firsthand any of the tropes. One-in-ten (10%) did not experience an incident but say they did personally hear an anti-Semitic trope, while 39% did not experience or hear firsthand any of the things asked about.

Overall, more than one-third of Jewish adults under 30 have both experienced and heard instances of anti-Semitism in the year prior to taking the survey (36%), compared with just 15% of Jews 65 and older. Fully half of Jews 65 and older (52%) say they have not experienced or heard any of these forms of anti-Semitism in the past year, compared with 29% of Jews under 30.

Expressions of support from non-Jewish Americans

In addition to asking about experiences of discrimination, the survey also included a question about positive experiences as a result of being Jewish: It asked respondents whether in the past year someone who is not Jewish has expressed support for them because they are Jewish. One-third of U.S. Jews say someone who is not Jewish has expressed support, while two-thirds say this has not happened.

While those who wear distinctively Jewish items are more likely than other Jews to experience anti-Semitism, they also are more likely to report receiving expressions of support.

Where else do Jews see discrimination in America?

Despite concerns about anti-Semitism, more Jews say Muslim (62%) and Black (55%) Americans face a lot of discrimination in society today than say the same about Jews (43%).27 About four-in-ten Jews also say gays and lesbians (43%) and Hispanics (42%) face a lot of discrimination in the United States. Jews are more likely than the general public to say that each of these groups faces a lot of discrimination, although Jews are less likely than U.S. adults overall to say that evangelical Christians are widely discriminated against (3% vs. 13%).

While many Jews say that some other groups face a lot of discrimination, this opinion is not universally held across all Jewish subgroups. About half of Orthodox Jews (53%) say Jews face a lot of discrimination, while far fewer say the same about Muslims (18%), Blacks (23%), Hispanics (12%), gays and lesbians (12%) or evangelical Christians (5%). Similarly, roughly four-in-ten Republican and Republican-leaning Jews say Jews face a lot of discrimination (43%), while fewer say that the other groups face a lot of discrimination.

Sidebar: Anti-Semitism in America, once perceived as declining, has become an unavoidable topic again in synagogues

Public opinion toward Jews is generally favorable in the United States: Pew Research Center polls have repeatedly found that Jews are viewed by the public at large as warmly as, or more warmly than, any other major religious group.28 At the same time, the new survey finds that most U.S. Jews (75%) perceive a rise in anti-Semitism over the past five years.

To provide another window into some of the changes occurring in American Jewish life, Pew Research Center conducted a series of in-depth interviews with rabbis and other Jewish leaders. These conversations were separate from the survey of U.S. Jews. Although the interviewees were not selected in a scientific manner, and hence are not representative of Jewish leaders overall, we sought a diversity of viewpoints and have tried to convey them impartially, without taking sides or promoting any positions, policies or outcomes.

Perhaps not surprisingly, then, several rabbis interviewed by the Center separately from the survey said they have discussed anti-Semitism from the pulpit more often in recent years than they did previously. Many of the approximately two dozen rabbis who were interviewed said they believe anti-Semitism has increased from both the right and left wings of American society and cited high-profile incidents since 2017, including shootings at synagogues in Pittsburgh and Poway, California, and a rally in Charlottesville, Virginia, where some protesters chanted “Jews will not replace us.”

A sentiment that recurred in the interviews was that for most of the rabbis’ adult lives, anti-Semitism had seemed to be on the decline in the United States.

“Rabbis of my generation, we prided ourselves on not talking about it,” said Rabbi Howard Stecker, 55, of Temple Israel of Great Neck, New York. “We talked about the beauty of being Jewish – of ‘more joy and less oy.’ And here we are in 2020, and we have to talk about it, because anti-Semitism is on the rise.”

Rabbi Sharon Brous of the IKAR congregation in Los Angeles said that for her first dozen years as a rabbi, she barely discussed anti-Semitism in the United States. But that changed during the 2016 presidential campaign, “when we started to see real domestic anti-Semitism on the rise,” she said.

Her main concern was anti-Semitism among White nationalists. “It became a big part of our conversation,” Brous said. “It’s something that we take very seriously and try to engage, not from a place of fear, but from a place of deep understanding, so we can try to figure out what needs to be done both from policy standpoints and with connections with other communities feeling vulnerable.”

Rabbi Shira Stutman of Sixth & I, a synagogue and cultural center in Washington, D.C., said she tends to talk about anti-Semitism emanating from the liberal side of the spectrum. Most people at her synagogue are socially and politically liberal, she said, “so they need to know how to counter it on the left.” She said she has led discussions about public criticism of Israel to help congregants distinguish when it is fair criticism, on the one hand, and when it is anti-Semitic, on the other.

Some of those interviewed said they have visited the scenes of recent attacks and then given sermons at their own synagogues on what it was like to be there. “You’re showing up to be present for the people who are struggling and suffering and who have just gone through that trauma, and then that’s what you speak about from the pulpit – the experience of being there,” said Rabba Sara Hurwitz of the Hebrew Institute of Riverdale in New York, who visited Monsey, New York, after stabbings at a Hanukkah celebration there in 2019. “It’s a topic that people are looking for us to talk about.”

Michael Satz of Temple B’nai Or in Morristown, New Jersey, a Reform congregation, said he is careful not to be alarmist when he discusses anti-Semitism. “My father-in-law is a Holocaust survivor,” he said. “I try to remind the congregants that … anti-Semitism is very different today, in that we’re not powerless. The government is not coming against us. The whole population is not against us. In survey after survey, Jews are the most admired religious group these days. … We still have to be vigilant because extremist ideas are in the ether, but while there is anti-Semitism on the right, and they’re dangerous because they have guns, and there is anti-Semitism in the guise of anti-Zionism on the left, we’ve made it in America, and we have to keep that in mind.”

Stutman said she spends time teaching her congregants about the history of anti-Semitism, because she has found that many adults are ill-informed. “The Hebrew schools of the ’80s and ’90s did a great job of teaching about the Holocaust, but not about anti-Semitic tropes,” she said. “A shocking number of our people did not understand what ‘Rothschild’ means in the anti-Jewish view. A shocking number of our people don’t understand the dual-loyalty accusation. They don’t understand how anti-Semitism works.”29

Some of the rabbis said their synagogues have responded to the rise in anti-Semitism with bolstered security measures that may have made them less welcoming to newcomers.

“We used to be a shul that was very open in terms of security,” Hurwitz said. “We still try to be open and welcoming, but it has certainly changed. … The building used to always be open, and now you can’t access the building without codes and passing a security guard. That’s a change that we had to make, it’s a sign of the times. I would say that’s a hard change for us, it went against our ethic of being welcome and open for anyone who wanted to come in.”

But, asked if attendance is down at Jewish community events due to fears over anti-Semitism, the rabbis said they have not seen any decline in overall participation.

“I’m sure there are individuals for whom that’s true,” Brous said, “but, overwhelmingly, we have found that the rise in anti-Semitism has made people feel a profound urgency to connect with Jewish communal life and with Jewish ritual. … It seems like the resurfacing of anti-Semitism has made people feel even more than before that it matters that they are connected to Jewish life in America at this time.”

According to the 2020 survey, 18% of U.S. Jews say they have hesitated to participate in Jewish observances or events because they feel less safe as a Jewish person in the United States than they did five years ago, though 12% say they participated anyway, while 5% say they did not participate in a Jewish observance or event due to concerns about safety.

7. U.S. Jews’ connections with and attitudes toward Israel

Eight-in-ten U.S. Jews say caring about Israel is an essential or important part of what being Jewish means to them. Nearly six-in-ten say they personally feel an emotional attachment to Israel, and a similar share say they follow news about the Jewish state at least somewhat closely.

At the same time, the survey – conducted during the final 14 months of the Trump administration – shows a wide range of views among U.S. Jews about the Israeli government, including some pockets of strong criticism. Fewer than half of U.S. Jews give Israeli Prime Minister Benjamin Netanyahu “excellent” or “good” ratings for his leadership. And just one-in-three say they think the Israeli government is making a sincere effort toward achieving peace with the Palestinians. (Fewer still, just 12%, say they think Palestinian leaders are sincere in these efforts.)

The study also finds that a slim majority of U.S. Jews have heard about the boycott, divestment and sanctions (BDS) movement. The vast majority who have heard of the movement say they oppose it.

The remainder of this chapter explores these and related findings in more detail. For an analysis of how much U.S. Jews say they have in common with Jews in Israel, see Chapter 5.

Travel to Israel

One-quarter of U.S. Jews have lived in Israel or been there more than once

Just under half of U.S. Jewish adults (45%) have been to Israel, including 19% who have visited once and 26% who have visited multiple times or have lived in Israel.

Far more Jews by religion than Jews of no religion have visited or lived in Israel (54% vs. 22%). Roughly eight-in-ten Orthodox Jews surveyed have been to Israel, as have 59% of Conservative Jews, 44% of Reform Jews and 29% of Jews who do not affiliate with any particular branch or stream of American Judaism.

These results are similar to the 2013 study, which found that 43% of U.S. Jews had been to Israel, including 23% who had been more than once.

Attachment to Israel

Nearly six-in-ten U.S. Jews say they are either very emotionally attached (25%) or somewhat emotionally attached (32%) to the modern state of Israel. The share of adults who are at least somewhat attached to Israel is twice as high among Jews by religion (67%) as among Jews of no religion (33%).

Most U.S. Jews are emotionally attached to Israel

As was the case in the 2013 study, the new survey finds that Jews ages 50 and older are much more emotionally attached to Israel than are younger Jews.

Strong attachment to Israel is highest among Orthodox Jews. Indeed, Orthodox Jews are the only subgroup among whom a majority (60%) say they are very attached to the Jewish state. Six-in-ten Jews with no particular denominational affiliation (59%) say they are either “not too” or “not at all” emotionally attached to Israel.

Republicans and those who lean toward the Republican Party generally express greater levels of attachment to Israel than do Jewish Democrats and those who lean Democratic.

The survey finds a clear connection between having been to Israel and feelings of attachment to the nation. Fully nine-in-ten U.S. Jews who have lived in Israel or been there more than once say they feel at least somewhat attached to it. Two-thirds of those who have been there once say they feel an emotional attachment. And among American Jews who have never been to Israel, fewer than half say they feel attached to it. Of course, the survey cannot speak to the direction of this relationship: It could be that traveling to Israel leads to greater emotional attachment, but it could also be that Jews who feel a strong attachment to Israel are more likely to make the trip.

Broadly speaking, many of the patterns in the 2020 survey data on questions about Israel are similar to findings from the 2013 survey. However, the new survey was conducted online and by mail, while the 2013 survey was conducted by telephone, and a separate, methodological experiment indicates that Jewish respondents tend to report lower levels of attachment to Israel when they are responding in private (either online or by mail) than when they are speaking to a live interviewer (by phone). Consequently, the results of the two surveys on this question are not directly comparable, and this report is unable to say whether U.S. Jews’ levels of emotional attachment to Israel have changed appreciably since 2013. (For more information on the methodological experiment, see Appendix B.)

Overall, 45% of U.S. Jews say that caring about Israel is “essential” to what being Jewish means to them, and an additional 37% say that caring about Israel is an important (though not essential) part of their Jewish identity.

Eight-in-ten U.S. Jews say caring about Israel is an important or essential part of what being Jewish means to them

Caring about Israel is more central to the Jewish identity of Jews by religion than to Jews of no religion, among whom three-in-ten say that caring about Israel is not important to what being Jewish means to them. The survey also finds that caring about Israel is more central to the Jewish identity of older Jews (ages 50 and older) than to Jewish adults under the age of 30.

Two-thirds of Conservative Jews say that caring about Israel is essential to what being Jewish means to them, as do about half of Orthodox and Reform Jews (53% and 49% respectively). Among Jews with no attachment to any particular stream of Judaism, roughly one-quarter say caring about Israel is “essential” to their Jewish identity, 42% say this is “important, but not essential,” and 28% say it is not important.

This question was also asked in Pew Research Center’s 2013 study. However, the methodological experiment conducted to gauge the effect of transitioning from a telephone survey (such as the 2013 study) to a survey conducted online and by mail (like the new study) finds large mode effects on this item. Compared with those answering questions on the phone, respondents participating online and by mail are more likely to say that caring about Israel is “essential” to what being Jewish means to them, and less likely to say that this is “important, but not essential” to their Jewish identity. Thus, the results on this question in the new study are not directly comparable to those obtained in 2013. (For additional discussion of what else is “essential,” “important but not essential” and “not important” to respondents’ Jewish identity, see Chapter 2.)

Following news about Israel

Among U.S. Jews, 57% say they follow news about Israel at least somewhat closely

A slim majority of U.S. Jews say they follow news about Israel at least somewhat closely, including 14% who follow it “very closely” and 43% who follow it “somewhat closely.” On average, Jews by religion pay closer attention to news about Israel than do Jews of no religion, and older Jews are more tuned in to news about the Jewish state than are younger Jewish adults.

The survey also shows that Orthodox and Conservative Jews follow news about Israel more closely than do Reform Jews. And fewer than half of Jews with no denominational affiliation say they follow news about Israel.

Three-quarters of Jews who are emotionally attached to Israel say they follow news about the Jewish state at least somewhat closely. Jews who say they are “not too” or “not at all” attached to the Jewish state are much less likely to follow news about it.

This question was not asked in 2013.

Roughly half of U.S. Jews say U.S. level of support for Israel is about right

In final year of Trump administration, more Jewish Democrats say U.S. is too supportive of Israel than not supportive enough

As of 2020, about one-in-five U.S. Jews (22%) say the U.S. is too supportive of Israel, up from 11% who said this in 2013. Over the same period, the share who say the U.S. is not sufficiently supportive of Israel declined by 12 percentage points (to 19%), while the share who say the level of U.S. support for Israel is “about right” has held steady (54% in each survey).

The survey, conducted during the last year of the Trump administration, finds that Jewish Democrats and those who lean toward the Democratic Party are much more likely than Jewish Republicans to say the U.S. is too supportive of Israel, while Jewish Republicans are more inclined than Democrats say U.S. support for Israel is about right.

As was the case in 2013, Jews of no religion are significantly more likely than Jews by religion to say the U.S. is too supportive of Israel. Also, in both surveys, Jewish adults under age 30 are far more inclined than Jews ages 50 and older to say the U.S. is too supportive of Israel.

A methodological experiment conducted in conjunction with the 2020 survey indicates that on this question, the results from 2020 can be compared with the results from 2013, because there appears to be little difference in the way respondents answer this question when speaking with a live interviewer (by phone) versus writing their answer in private (online or on a paper questionnaire). However, it is important to bear in mind when the two studies were fielded. Telephone interviews for the 2013 survey took place from Feb. 20 through June 13, 2013, during Barack Obama’s second term as president. The 2020 survey was conducted online and by mail from Nov. 19, 2019, through June 3, 2020, during Donald Trump’s presidency. See Appendix B for more details.

Netanyahu rated negatively by more than half of U.S. Jews

Four-in-ten U.S. Jews give Netanyahu excellent or good ratings for his leadership

Four-in-ten U.S. Jews say Benjamin Netanyahu, the prime minister of Israel for more than a decade, has done an “excellent” (13%) or “good” job (27%) leading the country, while a slim majority say his leadership has been “only fair” (26%) or “poor” (28%).

Jews by religion rate Netanyahu more positively than do Jews of no religion, though even among Jews by religion, fewer than half (45%) say his leadership has been excellent or good.

About three-quarters of Orthodox Jews (77%) give Netanyahu’s leadership positive marks. Conservative Jews are more evenly divided in their views of Netanyahu’s leadership, though they also view him more positively than negatively. Most Reform Jews and those who do not affiliate with any branch or stream of U.S. Judaism, meanwhile, give Netanyahu only fair or poor ratings for his leadership. The survey also finds that higher levels of education are linked with more negative evaluations of Netanyahu.

U.S. Jews are deeply polarized along partisan lines on this question, which was not asked in 2013. Eight-in-ten Republicans and Republican leaners say Netanyahu’s leadership has been excellent or good. By contrast, seven-in-ten Jewish Democrats and Democratic leaners say Netanyahu’s leadership has been fair or poor.

Views of the Israeli-Palestinian conflict

Most U.S. Jews are optimistic a way can be found for Israel and independent Palestinian state to coexist

Most U.S. Jews (63%) say they think a way can be found for Israel and an independent Palestinian state to coexist peacefully.

Jews of no religion are somewhat more optimistic about the possibility of peaceful coexistence than are Jews by religion. Additionally, majorities of Conservative Jews, Reform Jews and those who don’t identify with any particular branch of American Judaism all think a way can be found for Israel and a Palestinian state to coexist in peace. Two-thirds of Orthodox Jews, by contrast, do not think this is possible.

Roughly seven-in-ten Jewish Democrats say they think Israel and an independent Palestinian state could coexist peacefully, while a slim majority of Jewish Republicans do not think this can happen.

As a whole, U.S. Jews are somewhat more likely than U.S. adults overall to believe a peaceful two-state solution to the conflict is possible (63% vs. 55%).

At the same time, just one-third of U.S. Jews say they think the Israeli government is making a sincere effort toward a peace settlement with the Palestinians. There is even more skepticism among U.S. Jews about the Palestinian effort on this front: Just 12% of U.S. Jews say they think the Palestinian leadership is making a sincere effort toward peace.

One-third of U.S. Jews think Israeli government is making sincere effort toward peace with Palestinians

Jews by religion are about four times as likely to say the Israeli government is making a sincere effort toward peace as they are to say this about the Palestinian leadership (35% vs. 9%). Jews of no religion, by contrast, are almost as inclined to say the Palestinian leadership is sincerely seeking a peace settlement (19%) as they are to say the same about the Israeli government (25%).

U.S. Jews in most age groups are substantially more likely to say the Israeli government is sincere in its peace efforts than to say this about the Palestinians. But the youngest cohort of U.S. Jews is an exception to this pattern. Among Jewish adults under age 30, 24% say they think the Israeli government is making sincere efforts toward peace, while 18% say the same about Palestinian leadership.

Two-thirds of Jews who are Republicans or lean toward the Republican Party say they think the Israeli government is sincerely pursuing a peace settlement with the Palestinians, compared with one-in-five Jews who are Democrats or lean Democratic.

Comparing the results on the question about the Israeli government’s sincerity in the peace process with the same question in the 2013 survey is complicated by methodological differences between the two studies. An experiment (discussed in Appendix B) suggests that respondents are more likely to answer this question at all when answering online or by mail (as in 2020) rather than by telephone (as in 2013). As with many sensitive questions, more respondents say they don’t know or declined to answer when speaking to a live person on the phone than when writing an answer in private. In the experiment, the share of people answering the question was 5 percentage points higher online or by mail than by phone, and the higher response rate led to slightly increased support both for the notion that Israel’s government is sincere (+3 points) and for the notion that Israel’s government is not sincere (+2 points). This indicates that the 2020 and 2013 results are not directly comparable in a straightforward way. Since the share of Jewish respondents who called the Israeli government sincere was 38% in 2013 (vs. 33% in 2020), one might cautiously conclude either that there has been no significant change in overall opinion on this question or that the share who view Israel’s government as sincere may have ticked slightly downward from 2013 to 2020.

One-in-ten U.S. Jews support the BDS movement, while 43% oppose it and 43% haven’t heard much about it

A slim majority of U.S. Jews, including six-in-ten Jews by religion and 42% of Jews of no religion, say they have heard either “some” or “a lot” about the boycott, divestment and sanctions (BDS) movement.30

Nearly eight-in-ten Orthodox Jews and seven-in-ten Conservative Jews say they have heard at least something about the movement, as have 54% of Reform Jews. Among Jews who do not affiliate with any branch of American Judaism, fewer than half have heard of the movement.

Jews with the highest levels of education are more likely than others to have heard something about BDS.

One-quarter of U.S. Jews have heard ‘a lot’ about BDS movement, and an additional three-in-ten have heard ‘some’

Respondents who said they had heard either “some” or “a lot” about BDS were asked a follow-up question to gauge their level of support or opposition. (Those who said they had heard “not much” or “nothing at all” about BDS were not asked any further questions about it.)

Overall, the survey finds far more opposition to than support for the BDS movement among U.S. Jews: 43% say they have heard at least something about BDS and they oppose it, while 10% say they have heard at least something about it and they support it. An additional 44% say they have not heard much or anything about it (or declined to say whether they have heard about it).

No subgroups of U.S. Jews express more support for BDS than opposition to it. But the ratio of opposition to support for the BDS movement is much more lopsided among Jewish Republicans (58% opposed vs. 3% supportive) than among Jewish Democrats (39% oppose vs. 13% support). It is also greater among Jews ages 65 and older (52% opposed vs. 7% supportive) than among Jews ages 18 to 29 (34% opposed vs. 13% supportive).

Orthodox Jews are particularly opposed to BDS. Fully 70% say they have heard about the movement and oppose it (including 65% who “strongly” oppose it), while 6% say they have heard about it and support it; the remainder have not heard about it or declined to answer.

Among Jews of no religion, 18% say they support BDS, 22% oppose it, and most say they have not heard about it.

Views of the BDS movement also are linked with assessments of Israel’s sincerity in the peace process and Netanyahu’s leadership. U.S. Jews who think the Israeli government is not sincerely pursuing a peace deal with the Palestinians, as well as U.S. Jews who think that Netanyahu’s leadership has been only fair or poor, are more likely to express support for the BDS movement than are those who take the opposite positions.

This question was not asked in 2013.

Far more opposition to than support for boycott, divestment and sanctions (BDS) movement among U.S. Jews

One-in-three Jews believe God gave the land that is now Israel to the Jewish people

Orthodox Jews overwhelmingly say they believe God gave Israel to the Jewish people

Roughly one-third of U.S. Jews say they believe God gave the land that is now Israel to the Jewish people, while 42% do not believe Israel was literally given by God to the Jews, and one-quarter of U.S. Jews say they do not believe in God or a higher power. Belief that God gave Israel to the Jewish people is much more common among Jews by religion than among Jews of no religion, but it is a minority opinion among both groups.

Nearly nine-in-ten Orthodox Jews (87%), however, believe God gave the land of Israel to the Jewish people.

Conservative Jews are divided on the question, while far fewer Reform Jews and those who do not belong to any particular branch of U.S. Judaism say they believe the land of Israel was given by God to the Jewish people.

Results on this question are not comparable to the 2013 survey in part because of a change in the wording of the question about belief in God, which results in a lower share of people who say they don’t believe there is a God or any higher power in the universe.

Sidebar: Discussing Israel from the pulpit can be a challenge for America’s rabbis

Speaking about Israel from synagogue pulpits is harder now than it used to be, because American congregations are less unified on the subject, according to in-depth interviews with two dozen rabbis conducted separately from Pew Research Center’s 2020 survey of Jewish Americans.31

To provide another window into some of the changes occurring in American Jewish life, Pew Research Center conducted a series of in-depth interviews with rabbis and other Jewish leaders. These conversations were separate from the survey of U.S. Jews. Although the interviewees were not selected in a scientific manner, and hence are not representative of Jewish leaders overall, we sought a diversity of viewpoints and have tried to convey them impartially, without taking sides or promoting any positions, policies or outcomes.

Many of the rabbis said their synagogues include more critics of the Israeli government than they did in the past. Asked how they approach the topic in sermons, several rabbis said they choose their words carefully and try not to unintentionally or unnecessarily alienate people in their congregations, which they know contain both staunch supporters and persistent critics of the Israeli government.

Rabbi Aaron Alexander of Adas Israel Congregation in Washington, D.C., said he doesn’t want his words on the topic to further divide congregants. His Conservative synagogue includes “people on the far left and the far right,” he said, adding that both are “very strong” groups.

“It doesn’t take much to fragment the community, or to find a wedge that can tear people apart,” he said. “We are very careful with how we introduce wedge topics, and Israel, for better or worse, has become that in the Jewish community. It’s something that, whatever people believe, they believe with a deep passion.”

In the town of Sharon, Massachusetts, Rabbi Ron Fish officiates at Temple Israel, a Conservative synagogue where “we add the prayer for the state of Israel to our tefilah every day,” he said, using a Hebrew word for the ritual recitation of prayers. “We have a lot of folks who have homes in Israel or children or grandchildren in Israel. It’s a big part of their identity.”

At the same time, he said, the synagogue community includes young adults – including grown children of longtime members – who are ardent critics of the current Israeli government. “Some of them see themselves as not having a place inside the [synagogue] community because they feel their views and their framing of the challenges are never given voice.”

He said it bothers him that these younger people don’t feel included. “I’m concerned about that,” he said. “I try to give it voice, but I’ve been pushed back on by some members of the community from time to time. … The people on, let’s call it the right, are very clear that from their point of view, supporting Israel means opposing the Iran deal, always mistrusting the Palestinian Authority, and identifying anti-Semitism in much of the Muslim world as a vital and current threat of the highest order to the Jewish community.”

The 2020 survey shows that Orthodox Jews are more likely than other U.S. Jews to feel very attached to Israel, to rate Israeli Prime Minister Benjamin Netanyahu’s leadership positively and to say they think the Israeli government’s peace efforts are sincere.

“Netanyahu enjoys extreme, very significant support, if not unilateral support, within the Orthodox community,” said Rabbi Yisrael Gelb, who served as executive director of Agudath Israel of California, an Orthodox organization, from 2018 through 2020. “We have tremendous support for Israel in terms of the government. We have lots of family who live there. Anything that happens in Israel, whether it be social or political, has a very significant effect on our population. Many of our community members have second homes in Israel that they go to a lot.”

Still, several of the Orthodox rabbis interviewed by Pew Research Center said their congregants include critics of the Israeli government as well.

“We’re very strong supporters of Israel, but obviously, being in Washington, we have people on the right and the left,” said Rabbi Shmuel Herzfeld of Ohev Sholom–The National Synagogue, a Modern Orthodox congregation in Washington, D.C. “So we try to do it in a way that brings as many people as possible together.” For example, he said, the congregation donates to a food bank in Israel, which congregants across the political spectrum agree is a good cause.

Several rabbis said they see part of their role as introducing congregants to multiple points of view.

Rabbi Enid Lader of Beth Israel – The West Temple in Cleveland, Ohio, a Reform congregation, called herself a supporter of Israel who nevertheless has “big questions about what’s going on there and human rights.” She said that in the past, “if we’ve had people from a liberal perspective speak, there’ve been people from a more conservative perspective who see that as an affront to ‘what’s really happening,’ unquote. I see my role as helping people be able to appreciate different perspectives. They might not agree with them, but to at least allow them to hear a point of view.”

Even the critics of Israel in their congregations generally support Israel’s right to exist as a Jewish state, the rabbis said.

“Historically we’ve been a Zionist congregation, and we continue to be so,” said Rabbi Brigitte Rosenberg of United Hebrew Congregation in Chesterfield, Missouri, a suburb of St. Louis. “It doesn’t mean we don’t call Israel out. It doesn’t mean we don’t have difficult conversations about Israel. But we’ve always, as a congregation, supported Israel’s right to exist – and specifically Israel’s right to exist as a Jewish state.”

8. U.S. Jews’ political views

Pew Research Center surveys, including the 2020 study, show that Jews are among the most consistently liberal and Democratic groups in the U.S. population. Seven-in-ten Jewish adults identify with or lean toward the Democratic Party, and half describe their political views as liberal.

This general inclination toward the Democratic Party and liberal values goes hand-in-hand with disapproval of former Republican President Donald Trump. In this survey, conducted roughly five to 12 months before the 2020 presidential election, nearly three-quarters of Jewish adults disapproved of the job Trump was doing as president, while just 27% rated him positively – far below the 65% who approved of President Barack Obama’s job performance in 2013.

Orthodox Jews, however, stand out as a small subgroup (roughly one-in-ten Jewish adults) whose political profile is virtually the reverse of Jews as a whole: 60% of Orthodox Jews describe their political views as conservative, 75% identify as Republicans or lean toward the GOP, and 81% approved of Trump’s job performance at the time of the survey.

A majority of all Jews surveyed, including more than half of Democrats, said they considered Trump friendly toward the state of Israel. Yet only about one-third (31%) said he was friendly toward Jews in the United States, and 37% described him as unfriendly toward U.S. Jews; the remainder saw him as neutral. Orthodox Jews, again, were a major exception: 77% said Trump was friendly to Jews in the United States, and nearly all the rest said he was neutral. Just 2% of Orthodox respondents described him as unfriendly to Jewish Americans.

Overall, U.S. Jews remain largely Democratic and liberal

Three-quarters of Orthodox Jews identify with or lean toward the Republican Party

U.S. Jews are still a largely Democratic and politically liberal group today, as they have been for decades. Overall, about seven-in-ten identify with or lean toward the Democratic Party, including 68% of Jews by religion and 77% of Jews of no religion. Just 26% of U.S. Jews overall identify with the Republican Party or lean toward the GOP.

Jews by religion are considerably more likely than U.S. Christians to identify with or lean toward the Democratic Party; they look much more similar to religiously unaffiliated Americans in this regard, with Democrats making up about two-thirds of each group. Among Christian subgroups, only Black Protestants show higher levels of Democratic support (86%).

Pew Research Center political surveys conducted over the past two decades show Jews have consistently identified with the Democratic Party over the GOP by a wide margin.

Half of all U.S. Jews describe themselves as liberal

Furthermore, the new survey finds that 50% of Jews describe their political views as liberal, triple the share who say they are politically conservative (16%). Jews of no religion – a group that is considerably younger, on average, than Jews by religion – are especially likely to call themselves liberal (62%).

While Jews overall are a strongly Democratic and liberal cohort, there is one segment of the Jewish population that is notably more inclined toward conservatism and the GOP. Three-quarters of Orthodox Jews identify with or lean toward the Republican Party, more than three times the share who identify with or lean toward the Democrats (20%). And 60% of Orthodox Jews describe their political views as conservative. Indeed, Orthodox Jews are about as likely as White evangelical Protestants to favor the GOP and describe their political views as conservative.

Views of Trump

Nearly three-quarters of Jews disapproved of Trump’s job performance

The status of Jews as a predominantly Democratic and liberal group (as well as one that is highly educated and disproportionately concentrated in the Northeast) leaves few surprises in their overall views of Donald Trump. At the time of the survey, about three-quarters of U.S. Jews (73%) said they disapproved of the job Trump was doing as president. By comparison, in a Pew Research Center survey of the general public conducted in January 2020, 58% of U.S. adults said they disapproved of Trump’s job performance.32

Trump’s approval ratings were low across almost all Jewish subgroups. Substantial majorities of both Jewish women (75%) and men (70%) as well as Jews in all age groups disapproved of Trump’s performance. Jews with relatively low levels of education (high school or less) were more likely than college graduates to give Trump a favorable rating, but even in this group, a slight majority (57%) disapproved of Trump’s handling of the presidency.

The main exception (other than Jewish Republicans) was Orthodox Jews, 81% of whom approved of the job Trump was doing as president.

In late 2019 and early 2020, three-quarters of U.S. Jews believed country was off on the wrong track

At the time the survey was fielded – while Trump was still president but mostly before the coronavirus pandemic began to have a large impact on American life – a large majority of Jews were dissatisfied with the country’s general direction. When asked whether things in this country were “generally headed in the right direction” or “off on the wrong track,” about three-quarters of Jews overall said the country was on the wrong track (76%).

Jewish Republicans, however, were largely satisfied with the direction of the country. Two-thirds of Jewish adults who identify with or lean toward the GOP said the country was headed in the right direction, a feeling shared by 54% of Orthodox Jews – and just 7% of Jewish Democrats.

Vast majority of Orthodox Jews rated the nation’s policy toward Israel positively under Trump

The general disapproval of Trump among U.S. Jews extended to his handling of specific issues. For example, only about a quarter of Jewish adults rated Trump’s handling of immigration as excellent (14%) or good (10%), while three-quarters called it only fair (7%) or poor (67%). Even fewer Jews gave Trump excellent or good marks for his handling of the environment (19%).

When it came to U.S. policy toward Israel, a somewhat higher share thought Trump was doing an excellent or good job (40%), though most Jews surveyed gave him only fair or poor marks on policy toward Israel, too (58%).

Jews by religion were much more likely than Jews of no religion to give positive ratings to Trump’s Israel policy (45% vs. 24%). And Orthodox Jews stood out for their overwhelming approval of Trump’s approach to the Jewish state: Nearly nine-in-ten Orthodox Jews said Trump’s handling of U.S. policy toward Israel was either good (16%) or excellent (69%). About two-thirds of the Orthodox also expressed positive views on Trump’s handling of immigration and the environment.

Most Jews thought Trump was friendly toward Israel, less so toward U.S. Jews

Regardless of what they thought of his policies, a majority of U.S. Jews (63%) said that Trump was friendly toward Israel, slightly higher than the share who rated the Republican Party in general as friendly toward the Jewish state (57%). Among Orthodox Jews, 94% described Trump as friendly to Israel – 21 percentage points higher than the share of Orthodox Jews who said the same about the GOP at the time of the survey.

Even among Jewish Democrats, more than half described Trump (55%) and the GOP (53%) as friendly toward Israel, although these figures were much lower than the comparable shares among Jewish Republicans (85% and 73%, respectively).

By comparison, 45% of U.S. Jews said the Democratic Party was friendly toward Israel, including just 17% of Orthodox Jews who expressed this view. While just 19% of U.S. Jews described the Democratic Party as unfriendly toward the Jewish state, fully half of Orthodox Jews took that position (54%). About a third of U.S. Jews (32%) said the Democratic Party was neutral toward Israel.

Older Jews and those with college degrees were more likely than those who are younger and less highly educated, respectively, to describe the Democratic Party as friendly toward Israel.

Majority of U.S. Jews described Trump as friendly toward Israel

Although a majority of Jews said that both Trump and the GOP were friendly toward Israel, most did not think this posture extended to Jews in the United States. About three-in-ten Jews surveyed in 2020 (31%) said Trump was friendly toward Jews in the U.S., and a similar share (29%) said the same about the Republican Party. Nearly four-in-ten Jewish Americans (37%) said Trump was unfriendly toward U.S. Jews, while the prevailing view toward the GOP was that it was neutral toward U.S. Jews (41%). On the whole, Jews were more likely to describe the Democratic Party as friendly toward Jews in the United States (52%) than to view the GOP that way (29%).

Once again, however, Orthodox Jews expressed views that differed substantially from the Jewish population as a whole. Nearly eight-in-ten Orthodox Jews (77%) rated Donald Trump as friendly toward Jews in the U.S., while six-in-ten said the same about the Republican Party. Conversely, only 22% of Orthodox Jews rated the Democratic Party as friendly toward U.S. Jews.

Half of U.S. Jews say the Democratic Party is friendly toward American Jews

9. Race, ethnicity, heritage and immigration among U.S. Jews

The majority of U.S. Jews identify as White. But in recent years, journalists, scholars and Jewish community leaders have wondered about the percentage of U.S. Jews who are “Jews of color,” “people of color” or “BIPOC” (an acronym for Black, Indigenous and people of color), and who should be included in these groups.33 The new Pew Research Center survey did not contain questions using those terms, and therefore cannot determine how many U.S. Jews consider themselves to be people of color. However, the survey included several other questions that can be used to explore the overlapping connections between race, ethnicity, heritage and geographic origin among Jewish Americans.

The current survey, like most Center surveys in the United States, measures race and ethnicity using categories that mirror the way the U.S. Census Bureau asks about these identities, which is necessary for statistical reasons in order to ensure that surveys are representative of U.S. adults overall.34 When given these choices, 92% of U.S. Jews describe themselves as White and non-Hispanic, while 8% say they belong to another racial or ethnic group. This includes 1% who identify as Black and non-Hispanic; 4% who identify as Hispanic; and 3% who identify with another race or ethnicity – such as Asian, American Indian or Hawaiian/Pacific Islander – or with more than one race.

Two-thirds of U.S. Jews identify as Ashkenazi

The survey also asked respondents about their Jewish heritage: whether they are Askhenazi (which the survey defined as following the Jewish customs of Central and Eastern Europe), Sephardic (following the Jewish customs of Spain) or Mizrahi (following the Jewish customs of the Middle East and North Africa).35

Two-thirds of U.S. Jews say they are Ashkenazi; 3% describe themselves as Sephardic and 1% as Mizrahi, although an additional 6% identify with some mixture of these or other categories. (However, some of the 6% identify with unclear categories or do not specify their mixture. A total of 7% of the Jewish adults in the survey clearly identify as Sephardic or Mizrahi, either alone or in combination with other categories.) In addition, 17% say these labels either do not apply to them or that they are just Jewish, while 8% say they follow some other set of Jewish customs, indicate that they are unsure (5%) or otherwise did not answer the question (2%).

Most U.S. Jews were born in the U.S.

Jews by religion are much more likely than Jews of no religion to trace their Jewish customs to Central and Eastern Europe (72% vs. 52%). And most Orthodox (87%), Conservative (73%) and Reform (71%) Jews identify as Ashkenazi, as do half of Jews who don’t affiliate with any organized branch or stream of Judaism (52%).

Separately, the survey also asked about the country of birth of all respondents and their parents.36 Nine-in-ten Jewish adults report that they were born in the United States (90%), including 21% who are adult children of at least one immigrant and 68% whose families have been in the U.S. for three generations or longer. One-in-ten Jewish adults (10%) are immigrants, including 1% who were born in Israel.

Looked at another way, roughly three-in-ten Jewish adults are first- or second-generation immigrants, meaning they were born in another country or they were born in the U.S. but at least one of their parents was born elsewhere (31%). One-in-ten each trace their recent origins to Europe (11%) or the former Soviet Union (10%), and 3% either were born in Israel themselves or have Israeli-born parents.

Amount of diversity in U.S. Jewish population varies depending on definition

These overlapping categories of race and ethnicity, Jewish heritage and geographic origin can be combined to explore different definitions of diversity among U.S. Jews. Pew Research Center does not take a position on who should or should not be counted as Jews of color. But the accompanying table can provide a sense of how widely the number of people in that category – or in other categories, reflecting various kinds of diversity in the Jewish context – would vary depending on one’s definition on who counts as diverse.

For example, if one were to take the 8% of U.S. Jews who identify as Hispanic, Black, Asian, some other race or multiracial, and then subtract those who identify with the Ashkenazi majority, then the resulting group (approximating a non-White and non-European-background population) would total 5% of adult Jews.37 And if one were to look only at Jews who do not identify as White in any way – subtracting those who say they are White and Hispanic, for example – then this group is 3% of U.S. Jewish adults.

On the other hand, if one were to take the 8% who identify as Hispanic, Black, Asian, some other race or multiracial and then add White, non-Hispanic U.S. Jewish adults who identify as Sephardic or Mizrahi (or a combination of Ashkenazi, Sephardic and Mizrahi), the percentage rises to 14%. Or one could take an even broader definition of diversity in the U.S. Jewish population, trying to take into consideration the survey respondent’s race or ethnicity andJewish heritage and country of origin. For example, if one were to count all Jewish adults who identify as Hispanic, Black, Asian, some other race or multiracial; plus those who consider themselves Sephardic or Mizrahi; plus those who were born outside the United States, Canada, Europe or the former Soviet Union, or have a parent born anywhere besides the U.S., Canada, Europe or the former Soviet Union, a combined total of 17% of U.S. Jews would fall into those categories.

Additional kinds of diversity, such as by sexual orientation, are discussed in Chapter 10.

Younger Jewish adults more racially and ethnically diverse than older Jews

In time, the racial and ethnic profile of U.S. Jews may shift, since Jewish adults under the age of 50 are more likely than older Jews to identify as Hispanic, Black, Asian, another race or multiple races (13% vs. 3%).

Using the broadest definition of diversity offered as an example in this chapter, nearly three-in-ten Jewish adults under 30 (28%) identify as Hispanic, Black, Asian, other race or multiracial; identify as Sephardic and/or Mizrahi; or are immigrants or children of immigrants to the U.S. from outside Canada, Europe or the former Soviet Union – compared with a total of 7% of Jews ages 65 and older who meet any of those overlapping dimensions of diversity.

Racial and ethnic diversity in Jewish households

Unlike in 2013, the 2020 Pew Research Center survey asked respondents separately about the race and ethnicity of all adults and children living in their household.

Fully 13% of Jewish respondents report that they live in multiracial households, i.e., in multi-person households where at least one adult or child has a different race or ethnicity than the respondent.38 But most Jewish respondents (87%) either live alone or live in multi-person households where everyone shares the same racial and ethnic identity. This includes 83% who say everyone in their household – which may consist of a single adult – is White and non-Hispanic, along with 4% who say everyone in their household shares a racial or ethnic identity that is not non-Hispanic White.

Combining the 13% of respondents who live in multiracial households with the 4% who live in single-race, non-White households, the survey finds that 17% of U.S. Jewish adults live in a household where at least one person (adult or child) is Hispanic, Black, Asian, another race or multiracial.39

13% of U.S. Jews live in multiracial households; 17% live in households where at least one person is Hispanic, Black, Asian, other race or multiracial

Compared with Jews by religion, Jews of no religion live in more racially diverse households. Roughly one-quarter of Jews of no religion (23%) say they live in a multi-person household in which at least one other adult or child has a different racial or ethnic identity, compared with 9% of Jews by religion who report that they live in multiracial households.

For an analysis of interracial/interethnic marriage among U.S. Jews, see Chapter 4.

Race and heritage, combined: 63% of U.S. Jews are both non-Hispanic White and Ashkenazi

The survey makes it possible to see the degree of partial overlap between the racial and ethnic categories conventionally used in the United States and the heritage categories often used by Jews (Ashkenazi, Sephardic and Mizrahi). Those heritage categories are a matter of different customs and liturgies, not just ancestry or country of birth. Nearly two-thirds of U.S. Jewish adults say they are both non-Hispanic White and Ashkenazi (63%). Much smaller numbers identify as non-Hispanic White and Sephardic (2%) or non-Hispanic White and Mizrahi (less than 1%).

About 4% of U.S. Jews are Hispanic, including 1% who also say they are Ashkenazi and 1% who identify as Sephardic. About 1% of Jewish adults are non-Hispanic Black and Ashkenazi, though some Black respondents give other answers, such as that the heritage labels don’t apply to them or that they are “just Jewish.” And 3% of Jewish adults identify with other races or ethnicities (such as Asian) or are multiracial, including 2% who also say they are Ashkenazi.

Race and birth region, combined: 83% of Jews are White and were born in U.S.

In terms of the overlap between race/ethnicity and region of birth, about one-in-ten of all U.S. Jewish adults are both non-Hispanic White and were born in the former Soviet Union or had a parent born there. A similar share (11%) are non-Hispanic White and were born, or had a parent born, elsewhere in Europe (outside of Russia, Ukraine, Belarus or other former Soviet republics), while 3% are non-Hispanic White and were born or had a parent born in Israel. Fewer than 1% identify as non-Hispanic White and say they were born, or had a parent who was born, in the Americas outside of the United States or Canada.

About 1% of Jewish adults are non-Hispanic Black and were born in the U.S.

Approximately 3% of Jewish adults are Hispanic and were born in the U.S. An additional 2% are Hispanic and were born or had a parent who was born in the Americas but in a country other than the U.S. or Canada.

Finally, when it comes to the overlap between Jewish heritage categories and countries of origin, the survey shows that six-in-ten U.S. Jews (60%) both identify as Ashkenazi and say they were born in the United States. An additional 9% identify as Ashkenazi and say they were born in Europe (excluding the former Soviet Union) or had a parent born there, and 7% were born, or had a parent born, in the former Soviet Union.

Overall, 3% of U.S. Jews say they are Sephardic, including 2% who were born in the U.S., 1% who were born or had a parent who was born in Europe, and fewer than 1% who were born or had a parent who was born in the Middle East-North Africa region.

Jewish heritage categories and birth region, combined: 60% of U.S. Jews are both Ashkenazi and born in the U.S.

Sidebar: Jews of many racial and ethnic backgrounds

To provide another window into some of the changes occurring in American Jewish life, Pew Research Center conducted a series of in-depth interviews with rabbis and other Jewish leaders. These conversations were separate from the survey of U.S. Jews. Although the interviewees were not selected in a scientific manner, and hence are not representative of Jewish leaders overall, we sought a diversity of viewpoints and have tried to convey them impartially, without taking sides or promoting any positions, policies or outcomes.

In the 2020 Pew Research Center survey, 8% of U.S. Jewish adults identify as Hispanic, Black (non-Hispanic), some other single ethnicity or race other than White, or as multiracial. The majority (92%) identify as White (non-Hispanic). Age patterns in the survey data indicate that the percentage of Jews who do not identify as White may be growing, and about one-in-six U.S. Jews (17%) already live in households with at least one adult or child who is Black, Hispanic, some other non-White race or ethnicity or multiracial.

Yet, even with this rising diversity, Jews who identify as White and non-Hispanic continue to make up the majority of American Jews, and people of other backgrounds sometimes feel like outsiders at synagogues, community centers, summer camps and other Jewish organizations, according to Jewish community leaders, activists and rabbis who spoke with Pew Research Center in interviews conducted apart from the survey.

Rabbi Sandra Lawson, who in 2021 became the first director of racial diversity, equity and inclusion for Reconstructing Judaism – the central organization of the Reconstructionist Movement – said she has often been asked if she is Jewish while in synagogue even when she is wearing a tallit (prayer shawl). Lawson, who identifies as Black, said she once noticed a man looking at her during the Amidah prayer. “For religious folks, the Amidah is the prayer you don’t interrupt people praying. But he kept staring at me,” she said. “I turned and said, ‘What is the problem with you? Is my presence here bothering you?’”

Jared Jackson, executive director of a group called Jews in ALL Hues, said he hears stories every year about Black Jews being questioned by synagogue security personnel about their presence at High Holy Day services. “That’s been happening for a very long time,” he said. In his own life as a Black Jew, he added, there were times in his childhood when he was called racial slurs, both in English and in Yiddish, by other Jews. And while he thinks the situation has gotten better, racist behavior in the Jewish community “is not totally gone,” Jackson said. “It’s more covert than overt right now. People still go through it, honestly. That’s why my organization exists.”

Indeed, Jews in ALL Hues is one of several national organizations that have arisen to address issues of racial equity and diversity among U.S. Jews. Others include the Jews of Color Initiative and the Jewish Multiracial Network.40

The dominance of Ashkenazi heritage (associated with Central and Eastern Europe) in American Judaism can make Jews who don’t share that background feel out of place in synagogues and other Jewish settings, said Ilana Kaufman, executive director of the Jews of Color Initiative.

Several congregational rabbis who were interviewed for this report said they have become more attuned in recent years to the feelings and needs of people of color in their congregations. While most said their congregants are still predominantly White and Ashkenazi, they also said there is noticeably more diversity now than in previous decades, due to adoptions by Jewish families, marriages by Jews to non-Jews, adult conversions to Judaism, immigration from places outside of Europe and increased openness toward Jews of color at synagogues.

“People are finally waking up to the fact that our Jewish community is quite multicultural,” said Rabbi Angela Buchdahl of Central Synagogue in New York, a Reform congregation.

Buchdahl, who was the first Asian American to be ordained as a rabbi, said it is vital that people of color feel at home in synagogues across the country. “I think our community can still behave in a tribal sort of way, where there are a lot of assumptions – ‘You don’t look Jewish!’ – which I think many Jews don’t realize is off-putting to people of color. It makes them feel like a stranger in their own home, like they don’t really belong.”

Rabbi Sharon Brous of IKAR in Los Angeles said her congregation recently bolstered the diversity of its board of directors. Four of the five new board members are Jews of diverse racial or ethnic backgrounds, she said.

The board’s new makeup “is more reflective of what the reality is in the country,” she said. “We know that, historically, Jewish communal spaces have not felt welcoming for Jews of color too often. … We’ve worked hard to be a loving and just community, and we realized a few years ago that that’s just not enough. We have to actively work to create a space that will feel welcoming.”

Some other rabbis said their congregations aspire to be welcoming to all Jews, including intermarried couples and LGBT people as well as Jews of color, but they have not yet experienced much change in the racial or ethnic composition of their members.

“We have seen, over the years, changes in some ways,” said Rabbi Brigitte Rosenberg of United Hebrew Congregation in Chesterfield, Missouri, a suburb of St. Louis. “But the vast majority of our congregants are of Ashkenazi descent. … I really do believe it’s a function of our location.”

Buchdahl estimated that non-White Jews make up between 10% and 15% of the congregants at her New York synagogue. “Many are people of color who convert to Judaism,” she said. “I would say that being a rabbi of color – and I identify that way – I think has attracted people … who might not have otherwise come. I think increased sensitivity to issues around that has helped make them feel at home here.”

One challenge in assessing the diversity of Jewish congregations, some activists and scholars said, is whether the term “Jews of color” should be applied to people who may not think of themselves that way.

“The term ‘Jews of color’ has been used far and wide these days, and includes a lot of people for whom being a person of color was not part of their identity inside of the United States for the vast majority of their lives,” said Jackson, of Jews in ALL Hues, citing Jews from the Middle East as an example.

Mijal Bitton, a scholar in residence at the Shalom Hartman Institute of North America who is writing a book on Syrian Jews in the United States, sees “a growing gap between how mainstream Ashkenazi Jewish communal organizations think of Jews of color and how many ethnically and racially diverse Jews self-identify.”

Part of the issue, she said, is that the traditional Jewish heritage categories – Ashkenazi, Sephardic and Mizrahi – do not cleanly map onto U.S. categories of race and ethnicity: Being Ashkenazi doesn’t necessarily mean being White, and being Sephardic or Mizrahi doesn’t necessarily mean being a person of color.

“The idea that the Syrian Jews I’ve studied are ‘Jews of color’ would feel overwhelmingly foreign and even ludicrous to them,” Bitton said. “Some might identify as White, some as Middle Eastern, some as non-White – but not as Jews of color.”

Who is – or is not – a Jew of color is “not the right question” for Sephardic Jews in America, said Brigitte Dayan, an Orthodox Jew of French Moroccan ancestry in New York City. “The relevant question is: Do we see ourselves as occasional victims of discrimination in the organized Jewish world? I think the answer, for many of us, is ‘yes.’”

Others questioned how well the term “person of color” applies to Hispanic Jews of Ashkenazi heritage, such as people whose parents or grandparents were refugees from Europe to Latin America during or after World War II.

“Would you call a Latin American Jew who moved to the United States from Argentina or Mexico, and whose parents came from Poland or Germany, a Jew of color?” asked Judit Bokser Liwerant, a professor at the National Autonomous University of Mexico who researches Latin American Jews.

She said she doubted that such a person would self-identify as a person of color.

“The concept of Jews of color, though intended to foster inclusion, runs the risk of lumping together people who have singular trajectories into an undifferentiated ‘other,’” Liwerant said. She added that she thinks many Latin American Jews also would reject the “Hispanic” label, which “is formulated for the overall society” but is “historically and sociologically irrelevant when applied to the Jewish case.”

The 2020 survey did not ask respondents whether they consider themselves “Jews of color” or “people of color,” and Pew Research Center consequently does not have an estimate of the share of U.S. Jews who describe themselves in those ways. The 8% estimate in this survey is based on race and ethnicity categories designed to resemble the U.S. census, which the Center uses to weight its surveys to be representative of the U.S. adult population.

The survey also asked respondents, in a separate question, whether they consider themselves Ashkenazi, Sephardi, Mizrahi, some combination, or none of those categories. And it asked respondents about the countries where they were born and where their parents were born, allowing researchers to combine categories of race and ethnicity, Jewish heritage and country of origin in myriad possible ways.

However they identify racially, Jews of Middle Eastern descent bring cultural histories to American synagogues that are often unfamiliar to Ashkenazi Jews, according to two Ashkenazi rabbis. Rabbi David Wolpe of Sinai Temple in Los Angeles said that Iranian Americans now make up more than half of his Conservative congregation and have been a large presence there since the late 1970s, when many emigrated from Iran. At first, he said, differences between Iranian American Jews and Ashkenazi Jews – over food, language, and even attitudes toward sending children to sleepovers and summer camps – hindered efforts to bring the congregation together.

“It was tense among the two groups, but also there were constant appeals for unity and togetherness,” Wolpe said. “It’s much better now, but it took a long time and a lot of work.”

Rabbi Howard Stecker of Temple Israel in Great Neck, New York, also leads a Conservative synagogue with many Iranian Americans. For the Ashkenazi Jews in his congregation, mixing with Jews who are not descended from Europeans has been a learning experience, he said: “It has forced us to be more mindful of certain assumptions that we have about what it means to be Jewish.”

10. Jewish demographics

The demographic profile of Jewish Americans is distinctive in several ways. Compared with the overall public, the Jewish population is older, has relatively high levels of educational attainment and is geographically concentrated in the Northeast.

Jewish adults ages 40 to 59 also have slightly fewer children, on average, compared with the general public. However, Orthodox Jews have much higher fertility rates and live in larger households than non-Orthodox Jews.41

The remainder of this chapter provides further detail on the demographic characteristics (including fertility rates and household sizes) of Jewish Americans. It also looks at the self-described sexual orientation of U.S. Jews.

Fertility

Orthodox Jews have twice as many children as non-Orthodox, on average

In the 2020 survey, Jewish adults ages 40 to 59 report having had an average of 1.9 children, the same as in the 2013 survey and slightly below the comparable figure for the general U.S. public, which is 2.3 children per adult in the same age cohort.42 While some adults in this age range may continue to bear children, this statistic is a rough measure of the completed fertility of this cohort.

However, to increase the reliability of comparisons across subgroups of Jews, this study also uses information from all adults in the survey. This includes young adults in their prime childbearing years (who may give birth to additional children in the future) as well as older adults (who may already have had all the children they intend to bear).

Based on reports from adults of all ages, the survey finds that, on average, Jews by religion have more children than Jews of no religion (1.7 vs. 1.0), and Jews with spouses who are also Jewish have more offspring than religiously intermarried Jews (2.3 vs. 1.5).

The survey also indicates that fertility among Orthodox Jews is at least twice as high as among non-Orthodox Jews. Orthodox Jewish adults report having an average of 3.3 children, while non-Orthodox Jews have an average of 1.4 children. Orthodox Jews also are five years younger, on average, when they give birth to their first child (23.6 vs. 28.6 among non-Orthodox Jews).

Fertility differences between Jews and the general public are driven in part by the greater share of Jewish women who have never had children. Among women ages 40 to 59, Jews are twice as likely to have no children (20% vs. 10%).

Jewish women ages 40 to 59 are twice as likely as U.S. women overall to have no children

Household size and composition

The average U.S. Jew lives in a household of 2.7 people, including 2.1 adults and 0.6 children. Overall, the average size of Jewish households has not changed much since the 2013 survey.

Jewish households in U.S. average 2.7 adults and children
One-third of U.S. Jews living in households with other adult(s) also live with at least one child

Orthodox Jews tend to live in much larger households than Jews who identify with other branches or streams of American Judaism. The average Orthodox household in the survey contains 2.0 children, compared with 0.3 children per household among Conservative Jews and 0.5 children per household among Reform Jews.

As of 2020, about one-third of Jewish adults who live with at least one other adult (who could be, but is not necessarily, a spouse or partner) have children living in the household. It is much less common for Jews who are the sole adult in their household to have children living with them.

Age

Jews are somewhat older than U.S. adults overall

The survey finds that, on average, Jewish adults are older than the U.S. public as a whole. But a closer look reveals that this is true only for Jews by religion. Jews of no religion, on average, are younger than U.S. adults overall.

Among adults, the median age in the Jewish population is 49 – slightly older than the median age of adults in the general public (46). Jews by religion (adult median age of 54) are similar in age to U.S. Protestants (53), and Jews of no religion (median age of 38) are similar in age to religiously unaffiliated people in the broader U.S. population (39).

Looked at another way, roughly half of Jewish adults are ages 50 and older (49%), compared with 45% of adults in the general public. Among Jews by religion, 56% are 50 and older, compared with just 32% of Jews of no religion.

Orthodox Jews (median age of 35 among adults) are substantially younger than Conservative Jews (62) and Reform Jews (53).

Nearly three-in-ten Jews have a postgraduate degree

Education

U.S. Jewish adults are, on the whole, a comparatively well-educated group. Nearly six-in-ten are college graduates, including 28% who have obtained a postgraduate degree. By comparison, among U.S. adults overall, about three-in-ten are college graduates, including 11% who have a postgraduate degree. Both Jews by religion and Jews of no religion have much higher levels of educational attainment, on average, than does the public overall.

About two-thirds of Reform Jews (64%) say they are college graduates, as do 57% of Jews with no denominational affiliation and 55% of Conservative Jews. Fewer Orthodox Jews (37%) report having college degrees.

Sexual orientation among U.S. Jews

The survey finds that 4% of U.S. Jews identify as gay or lesbian, and an additional 5% say they are bisexual. About nine-in-ten U.S. Jews (88%) say they are straight. Compared with Jews by religion, somewhat fewer Jews of no religion say they think of themselves as straight (81% vs. 91%). Instead, Jews of no religion are more likely than Jews by religion to say they are bisexual (10% vs. 3%).

Older Jews are more likely than younger Jews to say they are straight. Fully 96% of Jewish adults ages 65 and older say they are straight, as do 93% of those between the ages of 50 and 64. Fewer Jewish adults in their 30s and 40s (85%) and under 30 (75%) identify as straight.

The percentage of Jewish adults who identify as straight (88%) is similar to the share of the overall U.S. public that identifies that way (89%). And the share of Jewish adults under 30 who describe themselves as straight is on par with the share of U.S. adults under the age of 30 who say the same (78%).

This question asked about U.S. Jews’ sexual orientation; it did not measure transgender identity.

4% of U.S. Jews say they are gay or lesbian; 5% say they are bisexual

Geographic distribution

Plurality of Jews reside in the Northeast

About four-in-ten Jewish adults (38%) live in the Northeast – roughly double the share of U.S. adults overall who live in that census region (18%). A quarter of Jewish Americans reside in the West (25%), and a similar share live in the South (27%). Just one-in-ten Jewish adults live in the Midwest.43

Compared with Jews by religion, Jews of no religion are somewhat more evenly distributed across the Northeast, South and West.

11. Economics and well-being among U.S. Jews

Most Jewish adults report that they are satisfied with multiple aspects of their lives, including at least eight-in-ten who describe their family life, physical health and community as “good” or “excellent.”

As a whole, U.S. Jews are a relatively high-income group, with roughly half saying their annual household income is at least $100,000 – much higher than the percentage of all U.S. households at that level. In addition, about half of the Jewish adults surveyed describe themselves as living “comfortably,” while three-in-ten say they are able to meet basic expenses with a little money left over; another 15% say they just meet basic expenses.

However, some Jews, particularly those with lower household incomes, report that they have difficulty paying for necessities. For example, 26% of all U.S. Jews – including 55% of those who earn less than $50,000 per year – say that, in the year prior to taking the survey, they had difficulty paying for medical care, their rent or mortgage, food, or other bills or debts.

In January, nearly four-in-ten Jews said they or someone in their home had lost a job or had pay cut during pandemic

These results largely reflect the economic circumstances of American Jews before the start of the coronavirus pandemic, since the large majority of responses were recorded before the U.S. outbreak escalated in mid-March 2020. A more recent survey of the overall public, conducted in January 2021, found that 38% of Jews by religion said they or someone else in their household had lost a job or suffered a pay cut since the pandemic began.44 This is on par with the share of all U.S. adults who said the same (44%). The January survey also found that Jews by religion were slightly less likely than U.S. adults as a whole to say their household financial situation had worsened over the course of the previous year (13% vs. 21%).

The remainder of this chapter describes Jewish Americans’ economic situation based on the main survey, conducted from November 2019 through June 2020.

U.S. Jews generally satisfied with their lives and communities

Most Jews satisfied with their life in general today and their community as a place to live

The main survey of U.S. Jews, conducted mostly prior to the coronavirus pandemic, finds that nine-in-ten U.S. Jews say their community is an excellent (41%) or good (49%) place to live, while just one-in-ten rate the community where they reside as only fair or poor. Most U.S. Jews also answer a question about “the way things are going in your life today” with ratings of either excellent (26%) or good (59%).

Substantial majorities of U.S. Jews give these largely positive assessments regardless of gender, age, marital status, education or income, although there are differences across some subgroups. For instance, Jews who report a household income of at least $200,000 are more likely than those who make less than $50,000 per year to describe their lives in positive terms (95% vs. 71%) and to rate their communities as good or excellent places to live (93% vs. 86%). And Jews who are married are more likely to express the highest level of satisfaction with their lives and communities.

Compared with U.S. adults overall, Jewish adults are somewhat more satisfied with their communities (90% vs. 81%) and the way things are going in their lives (85% vs. 79%).

Upwards of eight-in-ten Jewish adults also say their family life (90%) and physical health (85%) are at least good, if not excellent. And three-quarters say the same about their social life.

While most Jewish Americans report a high level of satisfaction with these aspects of their lives, household income is linked with some differences. For example, among Jews who live in a household with an income of $200,000 or more, 95% describe their family life in positive terms, compared with 83% of those with incomes less than $50,000. Those in the highest income bracket also are more likely to be satisfied with their social life and physical health than are respondents with the lowest incomes.

Being a parent is tied to life satisfaction in some ways. Fully 96% of U.S. Jews who are parents of minor children living in their household say they are satisfied with their family life, compared with 88% of all other Jewish adults. Likewise, Jewish parents are more satisfied with their physical health (91%) than are Jews who are not parents (82%). However, this pattern does not extend to social life. Jews who are parents and those who are not express similar levels of satisfaction with their social life.

American Jews largely satisfied with family life, physical health, social life

On average, Jews report higher household incomes than other Americans

Half of Jews live in households earning at least $100,000

As a whole, Jews are a relatively high-income group. About one-in-four Jews (23%) say they have family incomes of $200,000 or more. By comparison, just 4% of U.S. adults report that level of household income.45

At the other end of the spectrum, one-in-ten U.S. Jews report annual household incomes of less than $30,000, far fewer than the 26% of all U.S. adults who are below that threshold.

Conservative and Reform Jews are substantially more likely than those who are Orthodox to have higher incomes ($100,000 and above).

Jewish adults younger than 30 or older than 64 are more likely than those in between to say they have family incomes less than $30,000. Jews without a college education also are more likely to have low household incomes. About one-quarter of Jews with a high school education or less (27%) say they have household incomes below $30,000, while just 4% of college graduates say the same.

Results on this question are not directly comparable to the 2013 Jewish study. An experiment conducted in conjunction with the 2020 survey indicates that more respondents answer this question about their household income (i.e., fewer people declined to provide financial information) when answering online or by mail (as in 2020) than when speaking to a live interviewer by telephone (as in 2013). More respondents also say they have household incomes over $75,000 when answering by web or mail. See Appendix B for more information.

About half of U.S. Jews say they ‘live comfortably’

When asked to describe their household’s financial situation (largely before the pandemic began), roughly half of U.S. Jews say they live comfortably (53%). By comparison, 29% of U.S. adults overall say they live comfortably.

Three-in-ten Jews say they meet basic expenses with a little left over (30%), and 15% say their household just meets basic expenses. Relatively few (2%) say they don’t have enough money to meet basic expenses. Jews are less likely than Americans overall to fall into each of these three categories.

Among Jews with household incomes of at least $200,000, about nine-in-ten (89%) say they live comfortably, much higher than in other income categories. Meanwhile, about four-in-ten U.S. Jews with an income of less than $50,000 (39%) say their household just meets basic expenses, and 6% in this group say they cannot meet basic expenses.

Economic well-being is often linked with education, and that is the case here as well. Compared with more highly educated Jews, those without any college education are the least likely to say they live comfortably (36%) and the most likely to say their household is able just to meet basic expenses (30%).

Fewer than half of Jewish adults over 30 say they ‘lived comfortably’ when they were growing up

There also are differences across Jewish branches on this question, with Orthodox Jews (26%) much less likely than Conservative (59%) or Reform (63%) Jews to say they live comfortably.

The survey also asked Jewish Americans about the financial status of their family when they were growing up. Jewish adults under 30 are much more likely than their elders to say their family lived comfortably during their childhood, which suggests there has been a rise in the U.S. Jews’ standard of living across recent generations.

One-in-four U.S. Jews say they had trouble paying bills or debts in the past year

Among U.S. Jews, 15% say they had difficulty paying for medical care for themselves or their family in the year prior to taking the survey, and 11% say they had difficulty paying their rent or mortgage. Somewhat fewer (8%) say they had a difficult time paying for food, but about one-in-five (19%) had trouble paying other types of bills or debts.

By comparison, among U.S. adults overall, one-quarter or more report having had difficulty paying for medical care, housing or food, and nearly half (46%) say they had difficulty paying other bills or debts in the year prior to taking the survey, which preceded the coronavirus outbreak in the United States.

In total, 26% of U.S. Jews say they had difficulty paying for at least one of the four types of necessities mentioned in the survey, about half the percentage of U.S. adults overall who say the same (56%). Jews of no religion are more likely than Jews by religion to report this kind of financial stress (34% vs. 23%).

For Jews, difficulty paying for some necessities is concentrated among those with lower household incomes, the Orthodox, Jewish adults under 50, those who are not married and those without a college degree. For example, 55% of Jews with household incomes of less than $50,000 say they had difficulty covering their living expenses in the past year. And roughly one-third of Jewish adults under the age of 50 (34%) say they had difficulty paying for medical care, housing, food or other expenses in the past year.

Most U.S. Jews are employed at least part time

At time of survey, 4% of Jewish adults, including 12% under 30, unemployed and looking for work

Roughly six-in-ten Jewish adults surveyed (in most cases, prior to the coronavirus pandemic) say they are employed full time (48%) or part time (14%), similar to the share of all U.S. adults working at least part time as of September 2019. Slightly more than one-third of U.S. Jews (37%) are not employed, including 4% who say in the survey that they are looking for work.

Jews ages 30 to 64 and those with a college or postgraduate degree are much more likely to be employed. Among Jewish adults under 30, 12% say they are unemployed and looking for work.

Half of Jewish workers are in for-profit sector

Among U.S. Jews who are employed at least part time, about half (48%) say they work at a for-profit company, while one-in-five (21%) are self-employed, 16% work for a nonprofit organization and 13% work for the government.46

Jewish workers under the age of 50 and those who do not have a college degree are among the most likely to work at a for-profit company, while college graduates are more likely than those without a college degree to work in the nonprofit sector.

When asked what business or industry they work in, 15% of Jewish respondents say they work in education, 12% say they work in health care, and 11% say they work in the arts, entertainment, recreation, travel, accommodations or food services. An additional 9% of employed Jews work in financial services, 8% in wholesale or retail trade, and 7% in construction, manufacturing, transportation, warehousing, utilities, protective services or waste management.47

One-in-ten or more Jewish workers employed in education, health care or entertainment

12. People of Jewish background and Jewish affinity

In addition to examining U.S. Jews, the survey provides data on Americans who have a connection to Judaism but who are not classified as Jewish in this report. These respondents fall into two categories: people of Jewish background and people of Jewish affinity.

All people of Jewish background either were raised Jewish or had at least one Jewish parent. But they are not included in the Jewish population for the purposes of this report because they do not currently think of themselves as Jewish, or if they do identify as Jewish they also identify with a religion other than Judaism, including a few who identify religiously both as Jewish and with another religion. Nearly half of people in this category (46%) do not describe themselves as Jewish in any way (either by religion or aside from religion) or did not answer the question, while the remainder (54%) do identify as Jewish in some way but also identify with a religion other than Judaism. Overall, about half of Americans in the Jewish background category (52%) say they are Christians.

How were you raised?

All respondents who are categorized as people of Jewish affinity describe themselves as Jewish in some way, either by religion or aside from religion. But they are not included in the Jewish population for the purposes of this report because no one in this group is exclusively Jewish by religion (some describe their religion as both Judaism and something else, including Messianic Jews), and none of them were raised Jewish or have a Jewish parent.48

Most people in the Jewish affinity category (76%) were raised Christian, including 2% who say they were raised in Messianic Judaism; the share who say they are Messianic Jews today is somewhat larger (8%).

More than nine-in-ten people of Jewish background say had at least one Jewish parent, but only about one-in-five (18%) say they were raised exclusively Jewish by religion. More than half (57%) say they were raised exclusively in a religion other than Judaism, most commonly Christianity (53%).

This chapter examines the religious beliefs and practices, Jewish connections, political attitudes and demographic characteristics of Americans of Jewish background and Jewish affinity, including some measures on which they are similar to Jews of no religion, such as low levels of engagement with Jewish practices and relatively weak feelings of belonging to the Jewish people, and some measures on which they are closer to Jews by religion, such as support for Israel.

Religious beliefs and practices

People of Jewish affinity and background rarely attend synagogue, but many go to non-Jewish services and say religion is important to them

Relatively few people of Jewish background and affinity regularly go to a synagogue, temple, havurah or independent minyan. In fact, three-quarters of people in the Jewish affinity category and more than eight-in-ten people of Jewish background (85%) say they seldom or never attend Jewish religious services. An even higher share of Jews of no religion (92%) say the same. By comparison, most Jews by religion say they attend synagogue at least a few times a year.

In keeping with their low levels of synagogue attendance, people of Jewish background and affinity are less likely than both Jews of no religion and Jews by religion to celebrate Jewish holidays. For example, 17% of Americans with Jewish affinity and 22% of those with a Jewish background attended a Seder in the year prior to the survey – fewer than the 30% of Jews of no religion who held or attended a ritual meal at Passover, and far fewer than the three-quarters (74%) of Jews by religion who did the same.

At the same time, people of Jewish background and affinity are much more likely to attend non–Jewish religious services than they are to attend a synagogue, with roughly four-in-ten in each group saying that they attend church or other non-Jewish services at least yearly.

People of Jewish background and affinity also are more likely than Jews to say religion is very important to them. Half of people of Jewish affinity (49%) say that religion is very important in their lives, while about one-third of people of Jewish background (35%) say the same. By comparison, about three-in-ten Jews by religion (28%) and only 2% of Jews of no religion say religion is very important in their lives.

Similarly, people of Jewish background and affinity are more inclined to believe in the God of the Bible than are survey respondents in either Jewish category. Nearly half of people of Jewish background (46%) and roughly two-thirds of people of Jewish affinity (64%) say they believe in God as described in the Bible. This compares with a third of Jews by religion and just 7% of Jews of no religion who express the same belief.

Four-in-ten people of Jewish background share Jewish culture or holidays with non-Jewish friends

The survey also asked about engagement in 12 types of cultural Jewish activities or do-it-yourself religious practices, such as marking the Jewish Sabbath “in a way that makes it meaningful to you” (even if it is not in a traditional fashion). With just a few exceptions, a third or fewer of both people of Jewish background and people of Jewish affinity say they often or sometimes engage in these practices.

On many of these measures, people of Jewish background and affinity look much more like Jews of no religion than like Jews by religion. For example, 26% of people of Jewish affinity, 30% of people of Jewish background and 32% of Jews of no religion say they at least sometimes visit synagogues or historic Jewish sites when traveling, compared with two-thirds of Jews by religion.

Relatively few people of Jewish background, Jewish affinity own objects associated with Jewish traditions

Similarly, 18% of survey respondents who have a Jewish affinity, 24% who have a Jewish background and 28% who are Jews of no religion say they observed a Jewish ritual to mark a life milestone in the past year. By contrast, nearly three-quarters of Jews by religion say they have done this (73%).

When asked whether they own various traditional Jewish objects, about a third of people in both the Jewish background category (35%) and the affinity category (34%) say they have a menorah, compared with 57% of Jews of no religion and 90% of Jews by religion. Smaller numbers of people of Jewish background and affinity have a Hebrew-language prayer book, a Seder plate or a mezuzah.

Jewish continuity

Few people of Jewish background, affinity say it would be very important that their grandchildren are Jewish

People of Jewish background and Jewish affinity mirror Jews of no religion and diverge from Jews by religion when it comes to their hopes for the Jewishness of their current or future grandchildren. Just 8% of people of Jewish background say it would be very important to them that their grandchildren are Jewish; 6% of people of Jewish affinity say the same, which is similar to the share of Jews of no religion (4%) who give this response. By contrast, 45% of Jews by religion say it would be very important to them that their grandchildren are Jewish. (This question was asked hypothetically of all respondents, regardless of whether they have any children or grandchildren, or intend to.)

In addition, roughly three-in-ten Jews by religion (29%) say it would be very important to them that their grandchildren marry someone who is Jewish, while very few Jews of no religion (2%), people of Jewish background (4%) and people of Jewish affinity (3%) share this perspective.

Jewish peoplehood

Most people of Jewish background and Jewish affinity do not feel a strong sense of belonging to the Jewish people; the same is true of Jews of no religion

Just 14% of respondents of Jewish background and 16% of respondents of Jewish affinity say they feel “a great deal” of belonging to the Jewish people. This is on par with the percentage of Jews of no religion who share this feeling (13%) – although Jews of no religion are more likely to feel at least “some” sense of belonging, and less likely to feel “none at all.” By contrast, a majority of Jews by religion (61%) say they feel a great deal of belonging to the Jewish people.

Moreover, only 9% of people of Jewish background or affinity say they have a lot in common with Jews in Israel. The share of Jews of no religion who say this is even lower, at 4%, while fully a quarter of Jews by religion feel they have a lot in common with Jews in Israel.

When asked how much they feel they have in common with six religious groups (Orthodox Jews, Conservative Jews, Reform Jews, evangelical Christians, mainline Protestants and Muslims), 17% of people of Jewish background and about a quarter (24%) of people of Jewish affinity say they have a lot in common with evangelical Christians. Roughly one-in-ten or fewer in each group say they have a lot in common with mainline Protestants, Reform Jews, Orthodox Jews, Conservative Jews and Muslims.

Connections to Israel

People of Jewish affinity, background report greater attachment to Israel than Jews of no religion

Americans of Jewish background and Jewish affinity are less likely than Jews by religion to say they are “very” emotionally attached to Israel, but they are more likely than Jews of no religion to say this. Overall, 38% of people of Jewish background and 44% of people of Jewish affinity say they are at least “somewhat” attached to Israel.

This is the case even though large majorities of Americans of Jewish background and Jewish affinity have never been to Israel (84% and 79%, respectively). By contrast, more than half of Jews by religion have been to the Jewish state.

Of all these groups, Jews of no religion were the most likely to say that the United States is “too supportive” of Israel, with 40% taking this position at the time of the survey, during the final 14 months of the Trump administration. By comparison, about a quarter of people of Jewish background (24%), one-in-five people of Jewish affinity (21%) and just 16% of Jews by religion said the U.S. was too supportive of Israel at the time of the survey. In the latter three categories, the most common answer was that the level of U.S. support for Israel was “about right,” while about one-in-five said the U.S. was “not supportive enough.”

Anti-Semitism

People of Jewish background and affinity less likely than U.S. Jews to perceive a rise in anti-Semitism

Jews by religion (50%) are more likely than Jews of no religion (32%), people of Jewish background (31%) and people of Jewish affinity (27%) to perceive a lot of anti-Semitism in America.

Compared with Jews by religion (80%) and Jews of no religion (60%), fewer Americans of Jewish background (46%) and those of Jewish affinity (48%) feel there is more anti-Semitism now than there was five years ago.

Party and ideology

Americans of Jewish affinity, Jewish background more likely than U.S. Jews to be Republicans

Americans in the Jewish background and Jewish affinity categories are much more likely than U.S. Jews to identify with the Republican Party and to describe themselves as politically conservative.

Four-in-ten respondents in the Jewish background category and roughly half in the Jewish affinity category (49%) say they identify with or lean toward the Republican Party, compared with just a quarter of Jewish Americans overall (26%). And a quarter or more of respondents of Jewish background (26%) and Jewish affinity (31%) describe their political ideology as conservative, while just 16% of U.S. Jews describe themselves this way. Conversely, half of all Jewish Americans describe their ideology as liberal, compared with just 34% of people of Jewish background and 25% of those of Jewish affinity.

In line with their higher rates of conservatism and identification with the Republican Party, people in the Jewish affinity and Jewish background categories were more inclined than U.S. Jews overall to approve of the job Donald Trump was doing as president at the time the survey was conducted, roughly five to 12 months before the 2020 presidential election (45% of the affinity group and 42% of the background group gave a positive rating vs. 30% of Jews by religion and just 18% of Jews of no religion).

Demographics

People of Jewish background, Jewish affinity are less highly educated than U.S. Jews

In their age profile, people of Jewish background tend to fall in between Jews of no religion (who are younger overall) and Jews by religion (who are older). For example, 56% of adults of Jewish background are under the age of 50, compared with 44% of Jews by religion and 68% of Jews of no religion in the same age group.

People of Jewish affinity are slightly older than those of Jewish background, on average, with 52% in the 50-plus category, including 21% who are at least 65.

Overall, people of Jewish background and Jewish affinity have less formal education than both Jews by religion and Jews of no religion. About four-in-ten respondents of Jewish background (41%) and one-third of people of Jewish affinity (34%) are college graduates. By contrast, larger shares of Jews by religion (60%) and Jews of no religion (53%) have college degrees.

Economic well-being

Jews have higher household incomes than people of Jewish background, affinity

In line with their lower levels of education, people of Jewish background and people of Jewish affinity tend to have lower household incomes than Jewish Americans as a whole. While half or more of Jews by religion (54%) and Jews of no religion (50%) reported household incomes of $100,000 or more at the time of the survey, 36% of people of Jewish background and 28% of people of Jewish affinity said they belonged to households in that income category.

And when they were asked to describe their overall financial situation, just 34% of respondents in the Jewish background group and 21% of those in the Jewish affinity group said they live “comfortably,” compared with 50% Jews of no religion and 54% of Jews by religion who said the same.

Jews had less difficulty paying for necessities than people of Jewish background, affinity

In addition, compared with U.S. Jews as a whole, larger shares of people of Jewish background and affinity reported having difficulty paying for necessities in the year before the survey was conducted (largely before the coronavirus pandemic).

For example, roughly one-in-five respondents of both Jewish background and Jewish affinity said they had difficulty paying for housing for themselves or their family in the previous 12 months, compared with 11% of U.S. Jews. (For more on the economic well-being of Jewish Americans, see Chapter 11.)

Acknowledgments

This report is a collaborative effort based on the input and analysis of the following individuals. Find related reports online at pewresearch.org/pewresearch-org/religion.

Primary Researchers

Becka A. Alper, Senior Researcher Alan Cooperman, Director of Religion Research

Research Team        

Gregory A. Smith, Associate Director of Research Besheer Mohamed, Senior Researcher Elizabeth Podrebarac Sciupac, Senior Researcher Claire Gecewicz, Research Associate Kiana Cox, Research Associate Justin Nortey, Research Assistant Conrad Hackett, Associate Director of Research and Senior Demographer Anne Fengyan Shi, Senior Researcher Ariana Monique Salazar, Research Analyst Jacob Ausubel, Research Assistant   

Methods Team         

Courtney Kennedy, Director of Survey Research Andrew Mercer, Senior Research Methodologist Nick Bertoni, Senior Panel Manager Nick Hatley, Research Analyst Arnold Lau, Research Analyst

Editorial and Graphic Design

Michael Lipka, Editorial Manager Jeff Diamant, Senior Writer/Editor Dalia Fahmy, Senior Writer/Editor David Kent, Senior Copy Editor Bill Webster, Senior Information Graphics Designer

Communications and Web Publishing

Stacy Rosenberg, Associate Director, Digital Travis Mitchell, Digital Producer Shajia Abidi, Associate Web Developer Anna Schiller, Senior Communications Manager Kelsey Beveridge, Communications Associate

Others at Pew Research Center who contributed to this report include Claudia Deane, Vice President of Research; Mark Hugo Lopez, Director of Global Migration and Demography Research; Neil G. Ruiz, Associate Director of Global Migration and Demography Research; Jocelyn Kiley, Associate Director of Research; Kim Parker, Director of Social Trends Research; Juliana Menasce Horowitz, Associate Director of Research; and Gracie Martinez, Administrative Coordinator. In addition, former Pew Research Center Senior Copy Editor Aleksandra Sandstrom contributed to the survey instrument, mailing and other study materials and Senior Administrative Coordinator Clara Huergo contributed to logistics and planning.

Pew Research Center is grateful to a panel of expert advisers who gave advice on all stages of this report: Sergio DellaPergola, Professor Emeritus and former Chair, The A. Harman Institute of Contemporary Jewry, The Hebrew University of Jerusalem; Ari Y Kelman, Jim Joseph Professor of Education and Jewish Studies, Stanford University Graduate School of Education; Ariela Keysar, Demographer, Senior Fellow in the Public Policy and Law Program at Trinity College, Hartford, Connecticut; Laurence Kotler-Berkowitz, Senior Director of Research and Analysis, Jewish Federations of North America; Arielle Levites, Managing Director of the Collaborative for Applied Studies in Jewish Education (CASJE) at George Washington University; Bruce A. Phillips, Professor of Sociology and Jewish Communal Service, Hebrew Union College – Jewish Institute of Religion, Los Angeles; Jennifer Rosenberg, Director of Foundations & Grants at Metropolitan Coordinating Council on Jewish Poverty; Leonard Saxe, Klutznick Professor of Contemporary Jewish Studies and Social Policy at Brandeis University and Director of the university’s Cohen Center for Modern Jewish Studies and the Steinhardt Social Research Institute; Michelle Shain, Assistant Director of the Orthodox Union’s Center for Communal Research; and Emily Sigalow, Executive Director, Impact and Performance Assessment Department, UJA Federation of New York.

In addition, the Center would like to thank the following for their expertise and perspectives on particular issues: Shelli Aderman, Director of Rabbinic Programs at Clal; Rabbi Aaron Alexander of Adas Israel Congregation in Washington, D.C.; Dov Ben-Shimon, Executive Vice President/CEO of the Jewish Federation of Greater Metrowest NJ; Mijal Bitton, Scholar in Residence at the Shalom Hartman Institute of North America; Judit Bokser Liwerant, Professor of Political Science at Universidad Nacional Autónoma de México and President of the Association for Social Scientific Study of Jewry (ASSJ); Rabbi Daniel Bouskila of Westwood Village Synagogue in Los Angeles, California; Rabbi Sharon Brous of IKAR in Los Angeles, California; Rabbi Angela Buchdahl of Central Synagogue in New York, New York; Rabbi Ephraim Buchwald, Director of NJOP (National Jewish Outreach Program); Stacie Cherner, Director of Learning and Evaluation, Jim Joseph Foundation; Brigitte Dayan, lay leader in Manhattan’s Sephardic community; Rabbi Ron Fish of Temple Israel in Sharon, Massachusetts; Rabbi Tuvia Fried, Executive Director of Agudath Israel of West Lawrence in Far Rockaway, New York; Adina Frydman, Chief Executive Officer of Young Judaea Global; Rabbi Yisrael Gelb, former Executive Director of Agudath Israel of California; Bruce D. Haynes, Professor of Sociology at the University of California, Davis; Rabbi Shmuel Herzfeld of Ohev Sholom – the National Synagogue in Washington, D.C.; Rabba Sara Hurwitz, President of Maharat and Rabba at the Hebrew Institute of Riverdale in Riverdale, New York; Jared Jackson, Executive Director of Jews in ALL Hues; Rella Kaplowitz, Senior Program Officer for Evaluation and Learning, Charles and Lynn Schusterman Family Philanthropies; Aaron Katler, Chief Executive Officer of UpStart; Ilana Kaufman, Executive Director, Jews of Color Initiative; Rabbi Leora Kaye, Director of Partnerships and Collaboration, Union for Reform Judaism; Aliza Kline, Chief Executive Officer of OneTable; Rabbi Enid Lader of Beth Israel – The West Temple in Cleveland, Ohio; Rabbi Sandra Lawson, Director of Racial Diversity, Equity and Inclusion, Reconstructing Judaism; Rabbi Mark Mallach of Temple Beth Ahm Yisrael in Springfield, New Jersey; Rabbi Moshe Matz, Executive Director of Agudath Israel of Florida; Rabbi Brigitte Rosenberg of United Hebrew Congregation in Chesterfield, Missouri; Aliya Saperstein, Associate Professor of Sociology and Benjamin Scott Crocker Professor in Human Biology, Stanford University; Rabbi Michael Satz of Temple B’nai Or in Morristown, New Jersey; Rabbi Motti Seligson, Director of Media Relations, Chabad-Lubavitch; Rabbi Jay Siegel of Congregation Beth Shalom in Santa Clarita, California; Rabbi Howard Stecker of Temple Israel of Great Neck in Great Neck, New York; Rabbi Shira Stutman of Sixth & I in Washington, D.C.; Elizabeth Tighe, Research Scientist, Cohen Center for Modern Jewish Studies and the Steinhardt Social Research Institute, Brandeis University; Jack Wertheimer, Joseph and Martha Mendelson Professor of American Jewish History at the Jewish Theological Seminary; and Rabbi David Wolpe of Sinai Temple in Los Angeles, California.

Appendix A: Survey methodology

The data in this report is drawn from a national cross-sectional, address-based sampling (ABS) survey conducted for Pew Research Center by Westat. This survey was fielded Nov. 19, 2019, through June 3, 2020.  Self-administered screening interviews were conducted with a total of 68,398 U.S. adults either online or by mail, resulting in 4,718 interviews with Jewish adults who are the primary subject of this report. This included 3,836 who are Jewish by religion and 882 who consider themselves Jewish but not by religion. Another 1,163 interviews were conducted with adults who are not Jewish (according to the criteria used in this report) but have a Jewish background or other Jewish affinity. After accounting for the complex sample design and loss of precision due to weighting, the margin of sampling error for the 4,718 net Jewish respondents is plus or minus 3.0 percentage points at the 95% level of confidence.
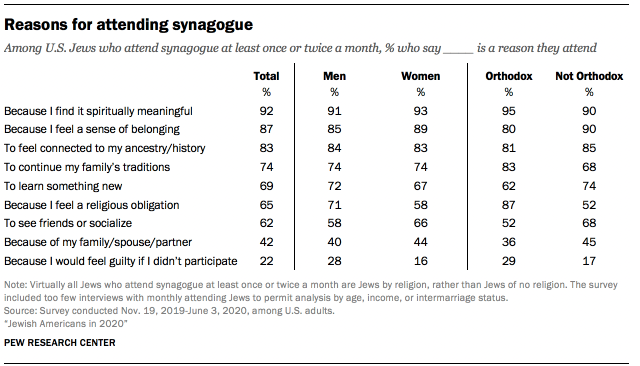
The survey was administered in two stages. In the first stage, a short screening survey was administered to a national sample of U.S. adults to collect basic demographics and determine a respondent’s eligibility for the extended survey of Jewish Americans. Screener respondents were considered eligible for the extended survey if they met any of the following three conditions:

  • They identified as Jewish when asked about their religious identity.
  • They did not identify as Jewish by religion but said that they consider themselves to be Jewish in any other way, such as ethnically, culturally or because of their family’s background.
  • They did not identify as Jewish at all but indicated that they were raised in the Jewish tradition or had a Jewish parent.

The screener was also used to identify eligible respondents for a separate study focused on the religious experiences of Black Americans.49 This was done primarily for efficiency, since both populations make up a relatively small share of the total U.S. adult population and obtaining a sufficient sample size for either group requires screening a much larger number of adults. For the small number of respondents who were eligible for both surveys, a random 80% were assigned to the extended Jewish American survey and the remaining 20% were assigned to the survey of Black Americans. The weights for these respondents were adjusted upward proportionately to account for this subsampling and ensure that the population of Black Jews was not underrepresented in the samples of either study.50

Throughout this appendix, the terms “extended survey” and “extended questionnaire” refer to the extended survey of Jewish Americans that is the focus of this report, and “eligible adults” and “eligible respondents” refer to those individuals who met its eligibility criteria, unless otherwise noted.

Sample design

The survey had a complex sample design constructed to maximize efficiency in reaching Jewish adults while also supporting reliable, national estimates for this population. The study used a stratified, systematic sample of U.S. residential mailing addresses. The ABS frame originates from the U.S. Postal Service’s Computerized Delivery Sequence File (CDSF) updated every month. That frame is maintained by Marketing Systems Group (MSG). MSG geocodes their entire ABS frame, so block, block group and census tract characteristics from the decennial census and the American Community Survey (ACS) can be appended to addresses and used for sampling and data collection purposes. The stratification of the sampling frame and the assignment of differential sampling rates to the strata were a critical design component because of the rareness of the eligible populations. Because the Jewish population was much rarer than the Black population, the stratification mainly identified areas with high concentrations of Jewish adults.

The first source for identifying areas with a higher density of Jewish adults was a file made available to Pew Research Center by the American Jewish Population Project (AJPP) at Brandeis University. The U.S. government does not collect data that classifies people by religion, so the AJPP data is the best source available. The AJPP provided pre-release data for this purpose (Pre-Release Estimates, July 2019). The available tables were at the county or county-group level and had estimates of both the total number of adults and the proportion of adults who identified themselves as Jewish by religion for each county group. Based on the distribution of the proportion of Jewish adults by religion in the county groups, Westat partitioned the county groups into two classes based on estimated Jewish density (high and low).

The next step was to stratify the areas within the county groups in the high-density class. Pew Research Center provided data from surveys conducted in 2013 or later that contained the respondents’ religious affiliation, ZIP code and sampling weights. Westat used that data to estimate the proportion of Jewish adults at the ZIP code level. Unfortunately, the Census Bureau does not report population counts at the ZIP code level. Instead, the Census Bureau reports counts at the ZIP Code Tabulation Areas (ZCTAs) level. Westat implemented a crosswalk between ZCTA and ZIP codes and then produced estimates of the proportion of Jewish adults at the ZCTA level within county groups for those county groups in the high-density class.

Since the sample sizes in the ZCTAs from the Pew Research Center surveys were often very small, zero or missing, the estimates of the percentage of Jewish adults in the ZCTA were not precise. As a result, each county group in the high-density class was partitioned into just two pieces within the county group. The first part included all ZCTAs with the highest estimated percentage of Jews by religion in the county group, and the other had the remainder of ZCTAs. Westat assigned all high-density ZCTAs to stratum 1. The lower-density ZCTAs were placed in stratum 2. The county groups or individual counties in the low-density class were placed in stratum 3.

Sample allocation and Jewish American incidence by stratum in the Pew Research Center ABS survey

The last step in the stratification divided each stratum into three substrata. For the higher-density strata (1 and 2), the substratum boundaries were determined using the square root of the ZCTA-level estimate of the number of Jewish adults. In the lowest-density stratum (3), the substratum boundaries were based on the estimated number of Jewish adults in the county group.

Westat divided the sample of drawn addresses into two replicate subsamples. At the beginning of data collection, Westat only mailed to the first replicate of addresses. About two months later, Westat began mailing the second replicate of addresses. This approach allowed researchers to evaluate the performance of the data collection protocol and apply adjustments before the second replicate was fielded. From the first replicate, it was clear that the response rate to the screening interview was lower than projected. To address the shortfall, Westat supplemented the sample with additional addresses and made small changes to the study materials.

One of the changes implemented between replicates was to the procedure used to randomly select one adult from each sample household. In the first replicate, each sampled address was randomly assigned to one of four groups, referred to as YM, OM, YF or OF. In group YM, the youngest male adult is sampled (if there are no males, the youngest female is sampled). Group OM samples the oldest male (or oldest female if no males present). YF and OF are the analogous groups for sampling women by age. After the first replicate fell short of yield projections, a simpler selection procedure was used; the adult in the household with the next birthday was instructed to complete the survey. The next-birthday method was also used for the last two screener recruitment mailings for the first replicate.

Data collection

To maximize response, the study used a sequential mixed-mode protocol in which sampled households were first directed to respond online and later mailed a paper version of the questionnaire if they did not respond online.

The first mailing was a letter introducing the study and providing the information necessary (URL and unique PIN) for online response. A pre-incentive of $2 was included. This and remaining screener recruitment letters focused on the screener survey, without mentioning the possibility of eligibility for longer surveys and associated promised incentive, since most people would only be asked to complete the short screening survey.

Next, Westat sent a postcard reminder, followed by a reminder letter to nonrespondents. Westat later sent nonrespondents a paper version screening survey, which was a four-page booklet (one folded 11×17 paper) and a postage-paid return envelope in addition to the cover letter. If no response was obtained from those four mailings, no further contact was made.

Eligible adults who completed the screening interview on the web were immediately asked to continue with the extended questionnaire. If an eligible adult completed the screener online but did not complete the extended interview, Westat sent them a reminder letter. This was performed on a rolling basis when it had been at least one week since the web breakoff. Names were not collected until the end of the web survey, so these letters were addressed to “Recent Participant,” but the content of the letter referenced the reported age and sex of the participant when available, so that the same participant would continue the survey.

If an eligible respondent completed a paper screener, Westat mailed them the appropriate extended survey and a postage-paid return envelope. This was sent weekly as completed paper screeners arrived. The paper screeners asked for a “first name or initials in case we have any questions about your survey,” and Westat addressed the extended mailings using this information. The content of the letter also referenced the reported age and sex of the participant when available. Westat followed these paper mailings with a reminder postcard. Later, Westat sent a final paper version via FedEx to eligible adults who had not completed the extended interview online or by paper.

Incentives

In addition to the $2 prepaid incentive that was included in the initial mailing sent to all sampled addresses, screener respondents who were eligible for the extended questionnaire were offered an additional promised incentive to be paid upon completion. Its value differed depending on how and when the respondent completed the screener. For the first sample replicate, respondents who completed the screener online were offered either $10 or $20 at random as part of an experiment to determine whether the response rate was sensitive to the promised value. The experiment found that the higher incentive did not result in significantly greater participation. Consequently, all eligible respondents who completed the screener online after the start of the second sample replicate were offered $10. Respondents who were sent a paper version of the extended questionnaire, either because they completed the screener by paper or because they never finished the extended questionnaire online, were offered $50.

Languages

The self-administered mail and web screening surveys were developed in English and translated into Spanish and Russian. For web, the landing page was in English, with language selection buttons available on that page to anyone, and throughout the survey, to change to Spanish or Russian. The paper screener was also formatted in English, Spanish and Russian. Recipients thought to be more likely to make use of Spanish or Russian options, based on supplemental information on the sampling frame or their address location, were sent the Spanish or Russian paper screener in addition to the English one.

The Jewish extended survey was available in English and Russian. For web, respondents continued in their selected language from the screener. Those receiving a paper extended instrument were sent the language corresponding to the language in which the screener was completed. In the rare occurrence that someone selected for the Jewish extended survey completed the screener in Spanish, the extended instrument was provided in English.

Weighting and variance estimation

Household-level weighting

The first step in weighting was the creation of a base weight equal to the inverse of each household’s probability of selection as determined by the stratum from which it was sampled. The base weight for mailing address k is called BWk, defined as the inverse of its probability of selection.

Each sampled mailing address was assigned to one of four categories according to its final screener disposition. The categories were 1) eligible household with one or more adults with a completed screener interview, 2) eligible household with one or more adults without a completed screener interview, 3) ineligible (i.e., not a household, which were primarily postmaster returns), and 4) household with unknown eligibility (addresses that were not identified as undeliverable by the post office but from which no survey response was received).

The first step in adjusting the base weight accounted for eligible sampled addresses among those with unknown eligibility (category 4). Previous ABS studies have found that about 13% of all addresses in the ABS frame were either vacant or are not home to anyone in the civilian, non-institutionalized population. For this survey, we assumed that 87% of all sampled addresses were eligible households. Thus, we adjusted the base weight in category 4, so the weights represented the portion of cases assumed to be eligible. The value of the adjustment factor was computed so that the sum of the base weights in categories 1 and 2 (eligible respondents and nonrespondents) and the adjusted cases in category 4 represented 87% of the frame total. The category 3 ineligible addresses are then given a weight of zero. We referred to this adjusted base weight as BW1k = BWk x p where p is the assumed eligibility factor applied to addresses in category 4. The weights in categories 1 and 2 were not adjusted; however, the sum of weights in categories 1, 2, and adjusted weights in 4 summed to the total for all eligible nonrespondents.

The next step allocated the weights from assumed eligible cases in category 4 to the weights in categories 1 (screener interview eligible respondents) and 2 (screener interview eligible nonrespondents). The adjustment was done separately by weighting classes derived from auxiliary data available at the address level. A separate weighting class was created to target the adjustment for the addresses in three counties identified as having a large Orthodox Jewish density (Kings and Rockland counties in New York and Ocean County in New Jersey). The remaining classes were defined by the cross-classification of sampling strata, the Black sampling sub-strata, and the census region definition. These variables defined an initial set of 64 classes. Those classes with fewer than 150 sampled addresses were collapsed. There were 60 classes after collapsing. The nonresponse adjustment factor FW1c for this adjustment was the ratio of thee sum of the BW1 weights divided by thee sum of the BW1 of the respondents in the same class c as FBW1c = ΣchBW1hk/∑resp∈hBW1hk. The adjusted weight is BW2hk = FBW1c x BW1hk.

The next step was adjusting for nonresponse for households without a completed screener interview. This adjustment allocated the weights of nonrespondents (category 2) to those of respondents (category 1). The adjustment was done separately by the same weighting classes used for the previous adjustment. The nonresponse adjustment factor FBW2c for this adjustment was the ratio of the sum of the BW2 weights divided by the sum of the BW2 of the respondents in the same class c as FBW2c = ΣchBW2hk/∑resp∈hBW2hk. The adjusted weight is BW3hk = FBW2c x BW2hk.

Weighting screened adults

To create an adult-level weight for all of the adults who completed the screener interview, the household weights were adjusted to account for randomly sampling one adult in each household. The initial adult level weight is AW1k = BW3k x ak is the number of adults in the household capped at 3 to avoid highly influential weights.51 Thee adult weights (AW1k) were then raked to match a set of estimated population benchmarks. The adult raked weight was ARKWck = AW1k x RKc, where RKc was the common adjustment for thee set of respondent characteristics c.

The raking dimensions for the adult weights were:

  • Eligibility type by sex
  • Eligibility type by age
  • Eligibility type by education
  • Orthodox stratum by sex52
  • Age by education
  • Single/multiple-adult household by presence of children in household
  • Race and Hispanic ethnicity
  • Census region
  • Sampling stratum

Because eligibility type is not a variable for which external benchmarks exist, the weighting parameters instead use model-based estimates for the number of adults in each of the groups that determined eligibility for the extended survey: 1) adults who consider themselves Jewish by religion, 2) adults who are not Jewish by religion but consider themselves Jewish for other reasons, 3) adults who do not consider themselves Jewish but were raised Jewish or had a Jewish parent, and 4) ineligible adults.

Modeling made it possible to estimate the size and demographic composition of the eligible adult population while adjusting for both the complex sample design and a larger number of variables and their interactions than would otherwise be possible. This was done to correct for subtle nonresponse patterns that, while negligible in their impact on national estimates for the full U.S. adult population, had an outsize effect on the size and composition of the responding Jewish sample. The process used to produce the modeled estimates is detailed in the next section.

Initial weighting of extended survey respondents

The eligible adults who completed the extended interview were assigned an initial Jewish interview weight equal to ARKWk. Because of the high skewness of the distribution of the weights for the cases sampled for the Jewish survey, the weights were trimmed at the 95th percentile and then adjusted to account for the subsampling of the respondents who were eligible for both the Jewish American and Black American surveys.

This weight was then raked to align with a set of parameters that were also based on modeled estimates for the demographic composition for the Jewish categories discussed in this report: 1) Jews by religion, 2) Jews of no religion, and 3) adults with a Jewish background or affinity. The model also distinguished between Orthodox and non-Orthodox Jews by religion. The specific raking dimensions for the extended weight were:

  • Jewish category by Orthodox/non-Orthodox
  • Jewish category by age
  • Jewish category by education
  • Orthodox stratum by sex
  • Census region
  • Sampling stratum
  • Single/multiple-adult household by presence of children in household

To reduce the variability of the weights while preserving the relative size of the Jewish population segments, the raked weights were then trimmed separately within each of the detailed Jewish categories at the 99.3rd percentile. This initial raked weight for the Jewish extended respondents is called EXTWTk.

Household roster weights

Part of the extended interview involved rostering all of the adults and children in each respondent’s household. To facilitate the analysis of the roster data, a household dataset was created that contained one row for every adult and child in each responding household. All persons in a household were given a household weight (EXTWTHHk) equal to the extended respondent’s initial weight (EXTWTk) divided by the number of eligible adults in the household. This accounts for the fact that household members would have been rostered if any eligible adult had been sampled other than the respondent.

Roster adjustment to extended respondent weights

A final adjustment was made to the weights for the extended interview respondents to correct an imbalance in the distribution of men and women in Orthodox households. Although Orthodox respondents were disproportionately male using the extended respondent weight (EXTWTk), the share of eligible men and women in Orthodox households was evenly balanced using the household weight (EXTWTHHk). Such an outcome would be highly unlikely if the responding adult were selected at random, and suggests a tendency in Orthodox households to choose a male respondent instead of the adult with the next birthday.

To correct this imbalance, the extended respondent weight was raked one more time so that the distributions of sex for Orthodox and non-Orthodox respondents matched the distribution all eligible rostered adults using the EXTWTHHk. The rostered distribution for Jewish category was also included as a raking dimension for this step to ensure consistency between the household and respondent weights. This final weight, EXTWTFINk, is used for the bulk of the analysis in this report.
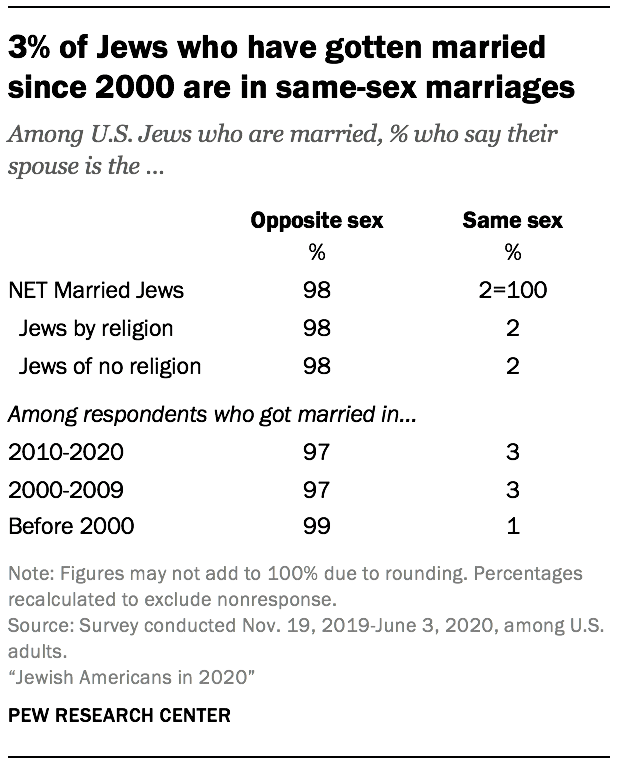
Variance estimation

Because the modeled estimates used in the weighting are themselves subject to sampling error, variance estimation and tests of statistical significance were performed using the grouped jackknife estimator (JK2). One hundred sets of replicates were created by deleting a group of cases within each stratum from each replicate and doubling the weights for a corresponding set of cases in the same stratum. The entire weighting and modeling process was performed on the full sample and then separately repeated for each replicate. The result is a total of 101 separate weights for each respondent that have incorporated the variability from both the complex sample design, modeling and estimation of weighting parameters.53

Model-based population estimates

As previously mentioned, the weights for the survey of Jewish Americans rely on model-based estimates for the size and demographic composition of the eligible adult population. Whereas design-based estimation depends on knowing each individual’s probability of inclusion in the sample, model-based estimation involves fitting a regression model to the survey data predicting an outcome variable of interest as a function of a set of covariates whose distributions are known for both the individuals in the sample and for the larger target population. That model is then used to obtain predicted values of the outcome for all of the non-sampled individuals in the population.54

Modeling screener eligibility

The first stage in modeling the size and composition of the eligible adult population was to fit a model predicting whether an adult respondent to the screener was eligible for the extended survey because they either 1) identified their religion as Jewish, 2) did not identify as Jewish by religion but indicated that they consider themselves to be Jewish for reasons aside from religion, or 3) did not consider themselves Jewish but had a Jewish parent or Jewish background; or 4) whether they were not eligible. This step was intended to correct for screener nonresponse that may have been associated with eligibility for the extended interview.

To ensure that the modeling accounted for the informative sample design, sampling stratum and the number of adults in the household were included in the model as predictors. Additional demographic predictors included age, sex, race and Hispanic ethnicity, and an indicator for the presence of children in the household. Geographic predictors included a flag identifying respondents residing in one of the three high-density Orthodox counties, a measure of urbanicity based on the National Center for Health Statistics’ urban-rural county classifications, census region, and a geographic grouping variable. The geographic group was defined as county for those counties that had at least 300 respondents to the screener. Counties with fewer than 300 respondents were grouped according to state. Any remaining groups that still did not have 300 respondents were combined according to census division. This resulted in a total of 79 groups, of which only the Pacific remainder (n=236) and East-South-Central remainder (n=163) had fewer than 300 respondents.

The model was fit using multinomial logistic ridge regression as implemented in the glmnet package for the R statistical computing platform.55 Ridge regression is a form of penalized regression that allows for the inclusion of a large number of predictor variables and interactions by shrinking the coefficients for irrelevant variables to be very close to zero. It performs particularly well when many of the predictors are correlated with each other, as was the case here.

The model included main effects for all of the predictor variables listed above. Interaction terms were selected using repeated 10-fold cross-validation. In 10-fold cross-validation, the full sample is randomly divided into 10 equally sized groups. Sequentially, each group is removed from the full sample and a set of candidate models is fit to the remaining 90% of the data. The models’ out-of-sample predictive accuracy is then measured on the 10% that was withheld. The model specification with the best average performance across all 10 groups is then chosen as the final model.

To select the final model specification, every possible two-way interaction between predictors was first ranked according to the cross-validated performance of a model containing only main effects and the single interaction. Then, interaction terms were cumulatively added to a base model one at a time. Interaction terms were retained in the cumulative model if their inclusion led to cross-validated performance that was as good as or better than the cumulative model, otherwise they were dropped. Interaction terms that included geographic group were added to the cumulative model last due to the very large number of additional coefficients that they entail. The specification that had the best performance in cross-validation was then fit to the full dataset with all 68,398 screener respondents to create the final model.

Modeling Jewish category

The second stage of modeling was intended to correct for nonresponse to the extended interview among eligible adult respondents. In particular, the goal was to correct nonresponse that was differentially associated with important segments of the Jewish population. For this stage, a model predicting whether someone was 1) Jewish by religion and Orthodox, 2) Jewish by religion but not Orthodox, 3) Jewish but not by religion, or 4) of Jewish background or Jewish affinity was fit to the data for the 5,881 eligible adults who completed the extended Jewish survey.

For predictors, this model added eligibility type to the list of variables used in the first stage. The model included main effects for all of the predictor variables with interactions selected using the same procedure as the first-stage model.

Creating a population frame

Using the models to generate population estimates requires knowing the complete distribution of all of the predictor variables that were used in the model fitting. The primary source for the distribution of the predictor variables was the 2018 ACS 5-year Public Use Microdata Sample (PUMS). The smallest geographic units on the PUMS are Public Use Microdata Areas (PUMAs), which do not directly correspond to the geographic units used in the modeling. Specifically, counties are needed to create variables for high-density Orthodox counties, urbanicity and geographic group. Additionally, the strata used in the sample design require the cross-classification of both county and ZIP code.

To solve this problem, the PUMS was merged with a crosswalk identifying the proportion of each PUMA’s population that lives in any of the counties with which it intersects. The weights for each person in the dataset were then distributed across counties proportionate to their share of the PUMA’s population. Then, a similar crosswalk was used to further allocate each person’s weights proportionately across the ZIP Code Tabulation Areas (ZCTAs) that intersect with their county. Both crosswalks were obtained from the Missouri Census Data Center’s Geocorr 2014.

Appending county and ZCTA to the PUMS made it possible to create all of the geographic variables that were used in the modeling. A variable identifying the groups of ZCTAs that crossed stratum boundaries was also created. Each record in this augmented PUMS dataset was grouped into cells defined by the cross-classification of housing type, ZCTA groups and all of the predictor variables used in the modeling and their weights were summed to create a dataset with one row for every unique combination of predictor variables and a weight identifying the total number of people in that cell.

Because allocating weights proportionately across counties and ZCTAs is only a rough approximation, these weights were then raked so that the distributions for age, sex, race and Hispanic ethnicity within counties aligned with 2018 estimates from the Census Bureau’s Population Estimates Program (PEP). The raking also aligned the distribution of age by education separately within counties and ZCTA groups, respectively, to match estimates from the 2018 5-Year ACS tables. Finally, the dataset was filtered to only the records for the non-institutionalized adult and the calibrated weights were scaled so that their sum matched the 2018 ACS 5-year PUMS.

Next, the first-stage model was applied to this population frame to predict the proportion of adults in each cell who belong to each eligibility category. These proportions were multiplied by the total number of adults to create new cells for each of the eligibility categories. The second-stage model was then used to further subdivide the cells for eligible adults according to Jewish category.

The end result is a dataset with one row for every unique combination of the predictor variables, eligibility type and detailed Jewish category with a weight reflecting the estimated number of adults in each. This final dataset was then used to compute the estimated population benchmarks that were used in the weighting discussed above.

Response rates

Westat assigned all sampled cases a result code for their participation in the screener, and then they assigned a result for the extended questionnaire for those who were eligible for the survey of Jewish Americans. Two of the dispositions warrant some discussion. One is the category “4.313 No such address.” This category is for addresses that were returned by the U.S. Postal Service as not being deliverable. This status indicates the address, which was on the USPS Delivery Sequence File at the time of sampling, currently is not occupied or no longer exists. The second category is “4.90 Other.” This category contains 1,231 addresses that were never mailed because they had a drop count of greater than four. Drop points are addresses with multiple households that share the same address. The information available in the ABS frame on drop points is limited to the number of drop points at the address, without information on the type of households at the drop point, or how they should be labeled for mailing purposes. In this survey, all drop points were eligible for sampling, but only those with drop point counts of four or fewer were mailed. Westat treated drop point counts of five or more as out of scope, and no mailing was done for those addresses.

AAPOR disposition codes

Westat used the disposition results to compute response rates consistent with AAPOR definitions. The response rates are weighted to account for the differential sampling in this survey. The weight is the inverse of the probability of selecting the address.56 The AAPOR RR3 response rate to the screening interview was 20.1%.57 The RR3 response rate to the extended Jewish American interview, 82.4%, is the number of eligible adults completing the questionnaire over the total sampled for that extended questionnaire. The overall response rate is the product of the screener response rate and the conditional response rate for the extended questionnaire. The overall response rate for the Jewish American sample in the Pew Research Center ABS survey was 16.6% (20.1% x 82.4%).

Acknowledgments

Many individuals contributed to this study’s data collection and methodology. In particular, Pew Research Center is grateful to Hanna Popick, Eric Jodts, Mike Brick and Ismael Flores Cervantes from Westat and to Elizabeth Tighe from the American Jewish Population Project for their many contributions to this project.
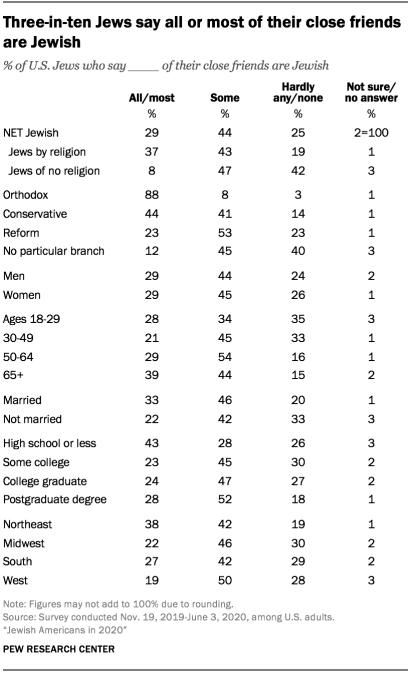
Appendix B: Mode experiment

The present study is the second time Pew Research Center has conducted a national survey of the U.S. Jewish population. A key research question is whether the new survey found any significant changes within the Jewish population during the past seven years. But the change in research design implemented in 2020 complicates comparisons to the 2013 results. The 2013 study was a live telephone survey using a landline and cellphone random-digit-dial sample. The 2020 study offered online or paper response and used an address-based sample. In theory, differences between 2013 and 2020 estimates could reflect real change in the Jewish population, or they could be an artifact of the change in methods – either the sampling method, the mode of interview or both.
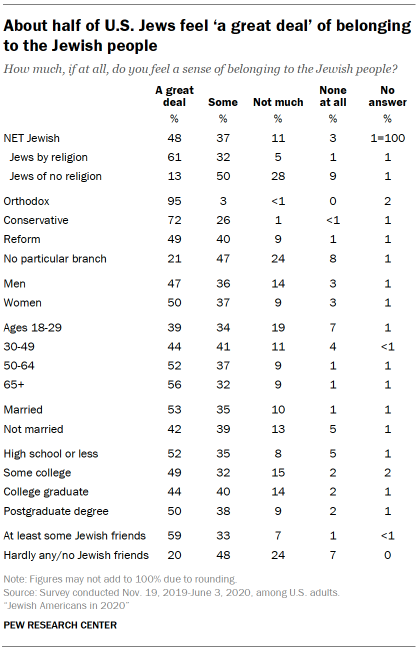
To gather hard data on this question, the Center commissioned an experiment that ran parallel to the main study. The experiment was conducted by the same firm conducting the main survey, Westat, and randomly assigned Jewish adults to be interviewed using the 2013 method (live telephone) or the 2020 method (online or paper response). If the two experimental groups yielded similar estimates, it would suggest that the change in mode of response does not affect the comparability of the 2013 and 2020 results. Conversely, if the experiment returned divergent results from the two groups, it would suggest that readers exercise caution in comparing the 2013 and 2020 results.

By randomly assigning mode of response, the experiment addresses whether the change in survey design from 2013 to 2020 affected how people answered the questions. The experiment was not designed, however, to determine whether the design change affected who participated in the study. The latter question is germane because the predominantly landline design used in 2013 theoretically could be more effective in reaching certain parts of the population (e.g., older adults), while the predominantly online design used in 2020 could be more effective at reaching other subgroups (e.g., younger adults).

In other words, the design change from 2013 to 2020 raises two questions about comparability:

  • Did the change affect how Jewish adults answered questions?
  • Did the change affect the composition of the Jewish sample?

The mode experiment was designed directly to address only the first question. Answering the second question would require fielding the 2020 study with both the new address-based sample design (ABS) and the 2013 random-digit-dial (RDD) design. Surveying large samples of U.S. Jews using both designs in 2020 would have been prohibitively expensive.

In both experimental modes, the extended survey was administered to respondents who met one of three criteria:

  • They identified as Jewish when asked about their religious identity.
  • They did not identify as Jewish by religion but said that they consider themselves to be Jewish in any other way, such as ethnically, culturally or because of their family’s background.
  • They did not identify as Jewish at all but indicated that they were raised in the Jewish tradition or had a Jewish parent.

The following analysis is based only on the subset of qualified respondents who are Jewish, including Jews by religion (i.e., people who describe themselves as Jewish when asked about their religious identity) and Jews of no religion (i.e., people who describe themselves religiously as atheist, agnostic, or “nothing in particular” and who say “yes” when asked if they think of themselves as Jewish aside from religion and who were raised Jewish or by a Jewish parent). Those respondents who qualified for the experimental survey but who are not Jewish (e.g., because they are now adherents of a religion other than Judaism, or because they no longer think of themselves as Jewish in any way) are excluded from this analysis.
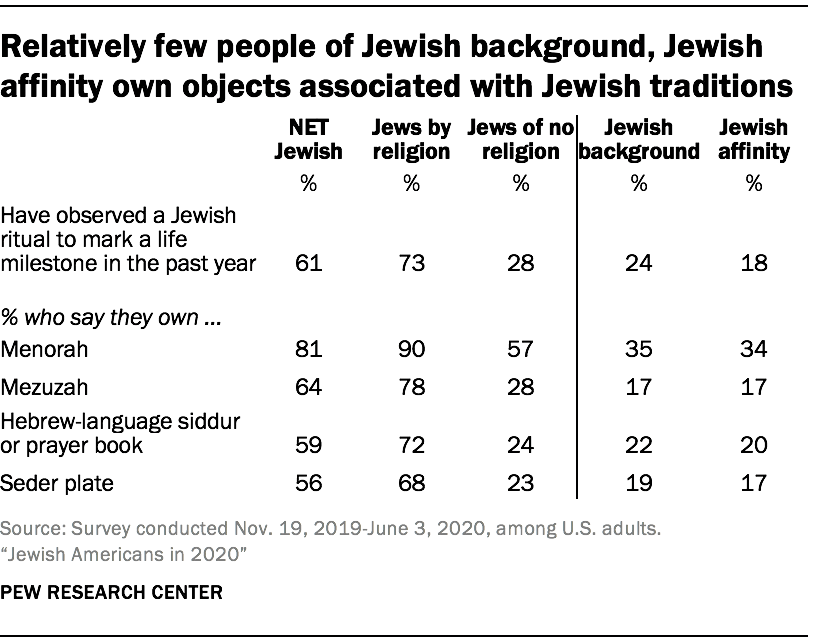
The experiment found divergent estimates from the telephone group versus the online/paper group on many but by no means all questions. Respondents in the telephone group were more likely to report attending Jewish religious services. They were also more likely to describe being Jewish as important to them. Questions with response options such as “some combination” or “both” exhibited large mode effects due to recency bias on the phone (see below for more), and refusal rates to sensitive questions were also higher when a live interviewer was present. These differences are consistent with known patterns of mode effects in other studies. However, the experiment found no meaningful differences between responses from Jewish adults interviewed by telephone versus those interviewed online/paper on the question of branch or stream of Judaism in the United States. Mode effects also were small or negligible when asking about concrete experiences without a socially desirable component, such as having had a bar or bat mitzvah. Based on these results, the 2020 report includes limited references to the 2013 results and, when doing so, focuses on questions where the experiment indicates little to no complication from the mode change.

Why the mode experiment was conducted

The present survey of U.S. Jews was conducted by mailing letters to sampled addresses inviting an adult member of the household to go online to take a survey. Those who did not respond online after the initial contact and reminders (e.g., an additional letter and a postcard) were mailed a paper version of the brief, screening survey to determine eligibility for the full questionnaire. All those deemed eligible were encouraged to complete the survey either online or on paper. This differs from the 2013 survey of U.S. Jews, which was conducted by live telephone interviewing with national samples of landline and cellphone numbers.

The chief difference between the design used in this study and in 2013 comes down to the mode of administration: Online and paper surveys are self-administered, while telephone surveys are administered by a live interviewer. In some instances, asking certain types of questions through self-administration will result in different answers than asking those same questions on the telephone, which is called a “mode effect.”

The live phone interviewing approach used in 2013 requires respondents to report their answers to a person who is essentially a stranger. This social interaction may exert subtle pressures on respondents that affect how they answer questions, particularly sensitive ones. For example, respondents may feel a need to present themselves in a more positive light to an interviewer, unconsciously leading them to overstate behaviors and attitudes they feel the interviewer would approve of – and vice versa, leading them to understate behaviors and attitudes they feel the interviewer might not like. This phenomenon is often referred to as “social desirability bias.”

There are also differences between modes in how respondents mentally process questions with multiple response options. On the phone, an interviewer reads the response options one by one, and respondents may find it easier to remember the last option that was read out, thus being more likely to select that option. This phenomenon is called a “recency effect.” By contrast, respondents to a web or paper survey who are faced with the prospect of reading multiple response options from top to bottom may gravitate more toward the top option – a phenomenon known as a “primacy effect.” The Center’s 2015 report on mode effects provides more detail.

How the mode experiment was conducted

In this experiment, a sample of households was randomly assigned to receive the screening and extended surveys using either the 2013 method (live telephone) or the 2020 method (online/paper). More cases were allocated to the telephone mode (16,851 sampled cases) than to the online/paper mode (9,663 sampled cases) due to lower expected response rates on telephone. In total, 1,744 adults were screened, and 1,032 qualified respondents completed the extended survey in the interviewer-administered live telephone group. In the online/paper group, 2,549 adults completed the screener, and 1,549 qualified respondents completed the extended survey. This analysis is based on the 903 phone respondents and the 1,387 online/paper respondents who are ultimately categorized as Jewish based on the same criteria used in the main study.

Eligibility and completion in the mode experiment

Telephone interviews were conducted from Dec. 10, 2019, to April 17, 2020, while the self-administered portion of the experiment was fielded Nov. 19, 2019, through June 3, 2020.

The experiment used a sample source that is more efficient for reaching the Jewish population than the main study. Approximately 70% of all adults screened for the experiment qualified as eligible for the extended survey, compared with 11% in the main study. The experiment used a listed sampling frame compiled from commercial databases linked to addresses and telephone numbers. The households in this list were determined by commercial data vendors to have a high likelihood of having a Jewish adult based on either a Jewish surname or other consumer data. To be eligible for the experiment, listed households needed to have both a mailing address and a telephone number on file. The vendor selected a random sample of those households and then randomly assigned them to respond by live telephone or by the online/paper protocol used in the 2020 main study.

This sample source was appropriate for the purpose of the experiment but not for the purpose of the main study. The aim of the experiment was solely to check for measurement differences between the two modes and not for making accurate inferences about the entire Jewish American population. While efficient, listed samples risk underrepresenting certain parts of the Jewish community, such as those without an identifiably Jewish name, as well as those with lower socioeconomic status who have less consumer information available to commercial data vendors. For the main study, by contrast, it was imperative to use a sample source that includes all U.S. adults. Only such a general population sampling frame can support high-quality estimates about the size, attitudes and experiences of the entire Jewish American population.

Propensity weighting was used to minimize compositional differences between the phone respondents versus the online/paper respondents

Statistically isolating the effect from survey mode

To isolate the effect of interview mode, the online/paper and telephone samples need to resemble each other as much as possible. While people were randomly assigned to each condition, differences in response patterns will result in compositional differences between the two samples. For example, 65% of those who completed the screener via telephone were ages 65 and older, compared with 53% in the online/paper condition.

To address this, the phone cases were statistically adjusted using propensity weighting to resemble the online/paper sample with respect to sex, age, educational attainment, race/ethnicity, census region, metropolitan status, number of adults in the household and number of children in the household. The same adjustment was made for the phone cases who completed the extended survey, except that the weighting additionally balanced the phone cases to the online/paper sample with respect to type of eligibility (that is, whether the respondent stated in the screener that they considered themselves Jewish by religion, Jewish aside from religion – ethnically, culturally, etc. – or whether they did not consider themselves Jewish but were raised in that tradition or had a Jewish parent).

The analysis presented below incorporates these propensity weights. Note that neither of the samples in this experiment are weighted in a way that would support accurate population estimates. As such, the numbers below should be seen only as highlighting differences or similarities between phone and online/paper modes.

Phone and online/paper responses are similar for questions about branches of Judaism

No meaningful mode effects observed for branch of Judaism in experiment

The mode experiment found no meaningful differences between responses from Jewish adults interviewed by telephone versus those interviewed online/paper on the question of their branch or stream of Judaism. The shares identifying as Reform, Conservative, Orthodox, other branches or no particular branch of Judaism were similar in both groups.

These results indicate that the change in mode from 2013 to 2020 did not affect the measurement on these questions. This gives confidence that the 2020 results can meaningfully be compared to those from 2013. This is consistent with research showing that behavioral questions that are salient, clearly phrased and free of strongly socially desirable answers are not generally susceptible to large mode effects.

Questions asking about concrete experiences generally did not exhibit discernible mode effects

The experiment found that the phone and online/paper groups produced similar results for many questions about concrete experiences. For example, indistinguishable shares of online/paper (65%) and phone (66%) respondents said they had a bar or bat mitzvah when they were young. Similarly, nearly identical shares of phone and online/paper respondents said they attended a summer camp with Jewish content for one or more years (43% and 44%, respectively). The experiment also found similar results for a question about personal experiences with discrimination. Similar shares interviewed by phone and online/paper (10% and 14%, respectively) said they had been called offensive names in the past 12 months because of their Jewish identity or background.

Some questions appear to have a recency effect when asked on the phone

Experiment found evidence of a recency effect for some questions when asked on the phone

For some kinds of questions, it is best to give respondents an explicit response option such as “both” or “all of the above.” However, this can lead to sizable mode effects between self- and interviewer-administered modes. When asked whether for them, personally, being Jewish is mainly a matter of religion, ancestry, culture, or some combination of those three things, a much greater share of phone respondents (77%) compared with online/paper respondents (55%) responded in favor of some combination. This is, in part, most likely a recency effect in the sense that the “some combination” option must necessarily be read last on the phone, after all the other options have been read out.

The phone mode elicited higher refusal rates to sensitive or difficult questions

The experiment found higher rates of refusals on sensitive or difficult questions in the phone group than in the online/paper group. For example, when asked whether the current Israeli government is making a sincere effort to bring about a peace settlement with the Palestinians, the share declining to answer was higher in the phone group than in the online/paper group (9% vs. 3%). Similarly, 8% of phone respondents refused to answer whether they thought a way could be found for Israel and an independent Palestinian state to coexist peacefully with each other, compared with 3% of online/paper respondents. When asked whether or not God literally gave the land that is now Israel to the Jewish people, the refusal rate was 5% on the phone versus 2% in the online/paper group.

One example of a “classic” sensitive question is asking about the respondent’s family income in the previous year. This question elicits high rates of refusal across the board and showed a mode effect. Nearly one-quarter of phone respondents (23%) refused to answer, compared with 13% of the online/paper respondents.

Results corroborate research showing more bias in telephone interviews than in self-administered interviews for questions with socially desirable answers

Phone interviews elicited more reporting of socially desirable behaviors than self-administered modes

The experiment also found evidence for classical mode effects, in which the interviewer-administered mode (phone) elicited more reporting of socially desirable behaviors than the self-administered modes (online/paper). For example, the share of adults saying that they attend Jewish religious services monthly or more often was about 11 percentage points higher in the phone group than the online/paper group (38% vs. 27%). The phone group was also slightly more likely than the online/paper group to report keeping kosher (22% vs. 17%) and to report holding or attending a Seder last Passover (80% vs. 76%).

Similarly, a greater share of phone respondents (63%) than online/paper respondents (56%) said that religion was “very” or “somewhat” important in their life. In the same vein, 88% of phone respondents said being Jewish was “very” or “somewhat” important in their life, compared with 83% of online/paper respondents.

There was also a clear mode effect for the question “How emotionally attached are you to Israel?” The share saying they are “very attached” was 8 percentage points higher on the phone than online/paper (38% vs. 30%, respectively). This result is consistent with prior general population mode experiments by Pew Research Center that have found people are more likely to give kind or supportive responses on the phone to an interviewer and more likely to express extremely negative or unkind attitudes when responding alone online.

Conclusions from the mode experiment

While there is, strictly speaking, no way to determine whether the online/paper or phone responses are more accurate, previous research examining questions for which the true value is known has found that self-administered surveys generally elicit more accurate information than interviewer-administered surveys. Online/paper measurements on questions susceptible to social desirability reflect a greater level of candidness, for example. Sensitive questions are also refused less often when asked via online/paper, as more people are willing to provide an opinion or information about themselves (such as household income) when an interviewer is not involved. Also, large differences in questions providing the option to indicate that multiple choices apply highlight the possibility that some attitudes measured are not well-formed, making it difficult to discern which measurement mode is more accurate. Fortunately, such questions are rare in this study.

For questions yielding a sizable difference in the mode experiment, Center researchers refrained from trending the 2020 results back to 2013. However, the report does discuss the trend for a limited number of questions where the mode experiment found no substantial measurement differences between the phone and online/paper groups. Future studies of the Jewish American population that use the online/paper design deployed in 2020 should be able to trend to the current study’s results without the complications of a mode change.58