
Why Americans Go (and Don’t Go) to Religious Services
Many cite practical or personal reasons, rather than lack of belief, for staying home
In recent years, the percentage of U.S. adults who say they regularly attend religious services has been declining, while the share of Americans who attend only a few times a year, seldom or never has been growing. A new Pew Research Center survey finds that the main reason people regularly go to church, synagogue, mosque or another house of worship is an obvious one: to feel closer to God. But the things that keep people away from religious services are more complicated.
Among those who attend no more than a few times a year, about three-in-ten say they do not go to religious services for a simple reason: They are not believers. But a much larger share stay away not because of a lack of faith, but for other reasons. This includes many people who say one very important reason they don’t regularly attend church is that they practice their faith in other ways. Others cite things they dislike about particular congregations or religious services (for example, they haven’t found a church or house of worship they like, or they don’t like the sermons). Still others name logistical reasons, like being in poor health or not having the time to go, as very important reasons for not regularly attending religious services.
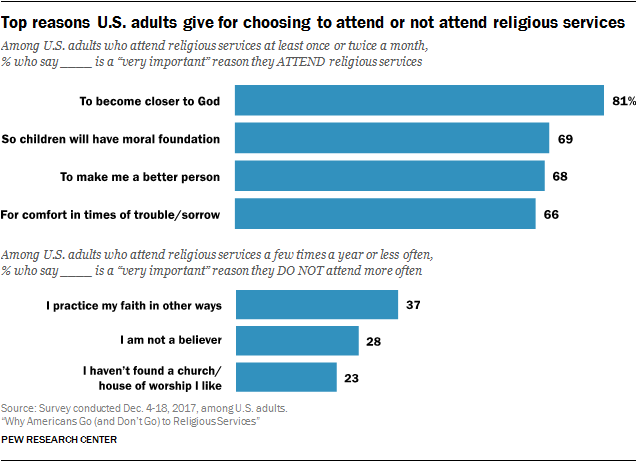
By their own description, those who cite reasons other than a lack of belief for avoiding church are a fairly religious group. About seven-in-ten identify with a religion (including six-in-ten who are Christian), and most say religion is either “very” or “somewhat” important in their lives. To be sure, they are not as religious as Americans who report going regularly to religious services. But by several standard measures, they are much more religious than those who say, “I am not a believer.”
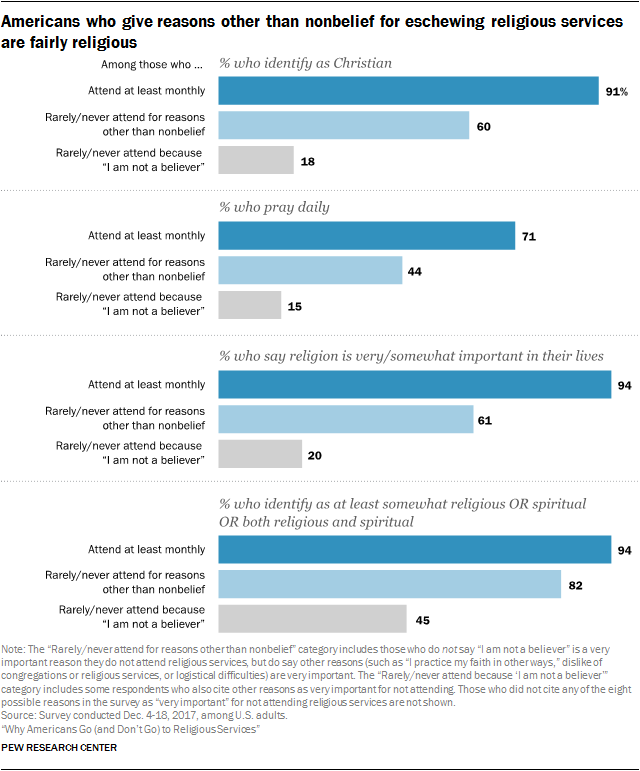
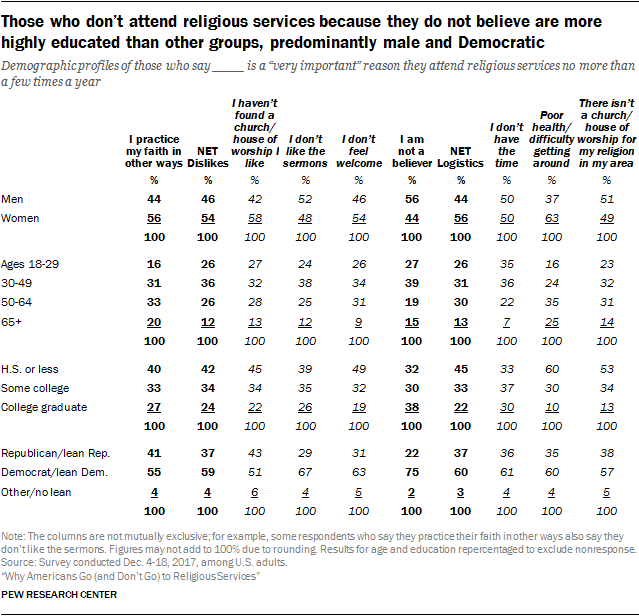
Demographically, more than half of those who do not attend church or another house of worship for reasons other than nonbelief are women, and they tend to be older, less highly educated and less Democratic compared with those who do not go because of a lack of faith. Meanwhile, those who refrain from attending religious services because they are nonbelievers are more highly educated and largely male, young and Democratic.
The new survey, conducted online Dec. 4 to 18, 2017, among a nationally representative sample of 4,729 adults on Pew Research Center’s American Trends Panel, asked respondents who attend religious services a few times a year or less often (including those who never attend) whether each of eight reasons is “very important, somewhat important, or not important” for why they do not go to religious services more often.1
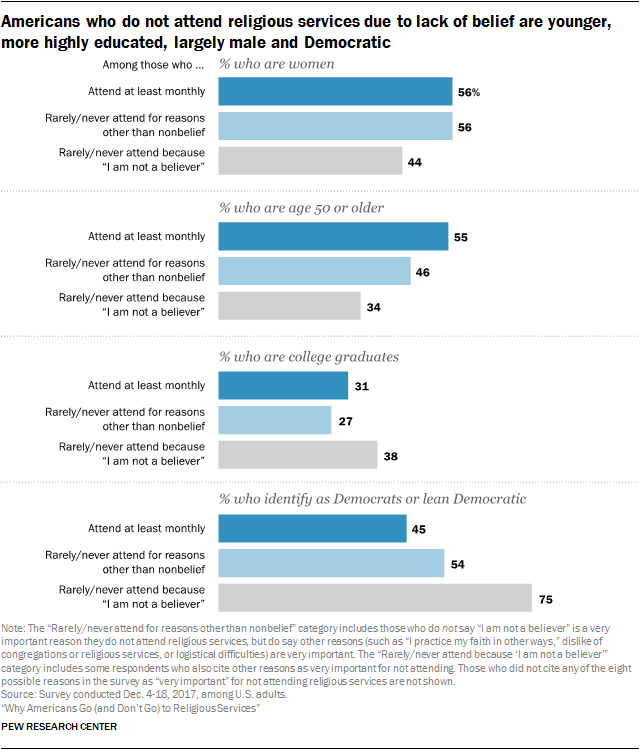
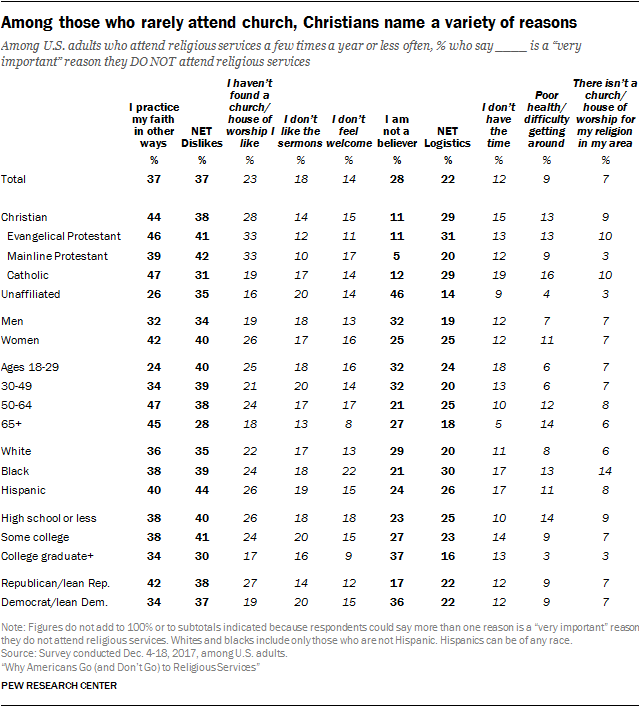
Overall, the single most common answer cited for not attending religious services is “I practice my faith in other ways,” which is offered as a very important reason by 37% of people who rarely or never attend religious services. A similar share mention things they dislike about religious services or particular congregations, including one-in-four who say they have not yet found a house of worship they like, one-in-five who say they dislike the sermons, and 14% who say they do not feel welcome at religious services.
About three-in-ten non-attenders say they are not believers, while 22% cite logistical reasons for not going to religious services, such as not having the time or being in poor health. And fully a quarter of those who infrequently attend religious services say none of these factors is a very important reason why.
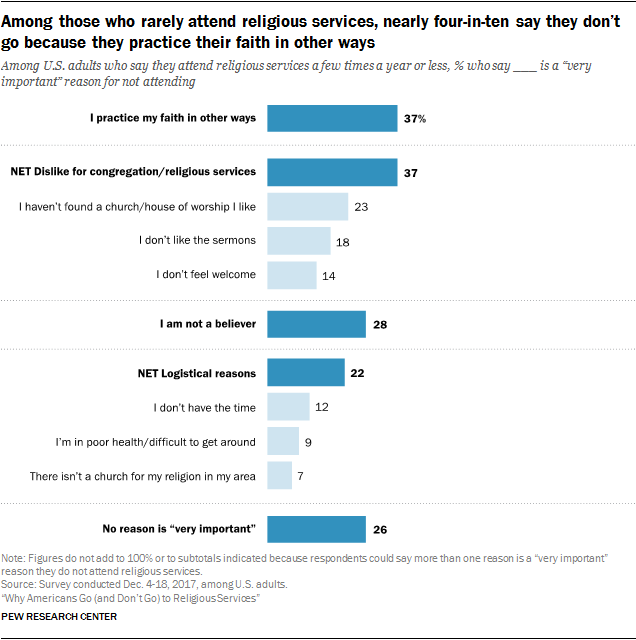
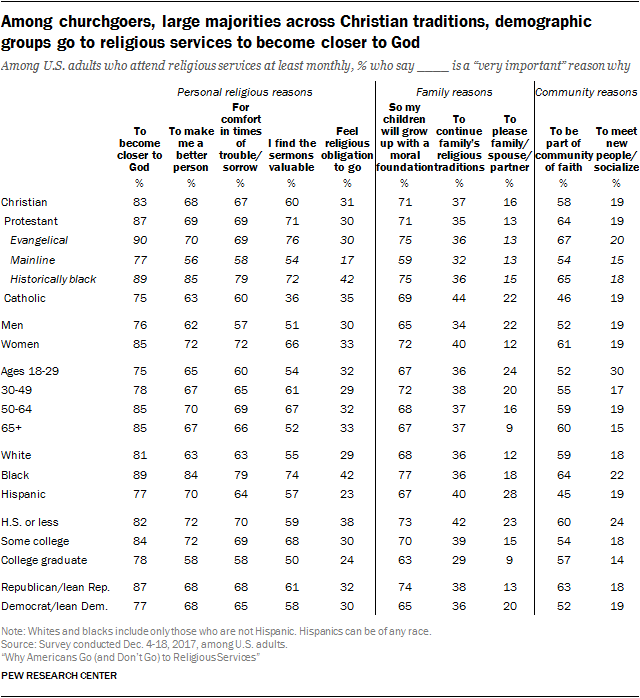
The survey also asked U.S. adults who say they attend religious services at least once or twice per month about 10 possible reasons they may do so. In response, eight-in-ten regular attenders say becoming “closer to God” is a very important reason they go to religious services.2
Additionally, roughly two-thirds say they attend religious services to give their children a moral foundation, to become better people, and for comfort in times of trouble or sorrow. Smaller majorities say that valuable sermons and being part of “a community of faith” are very important reasons for their regular religious attendance.
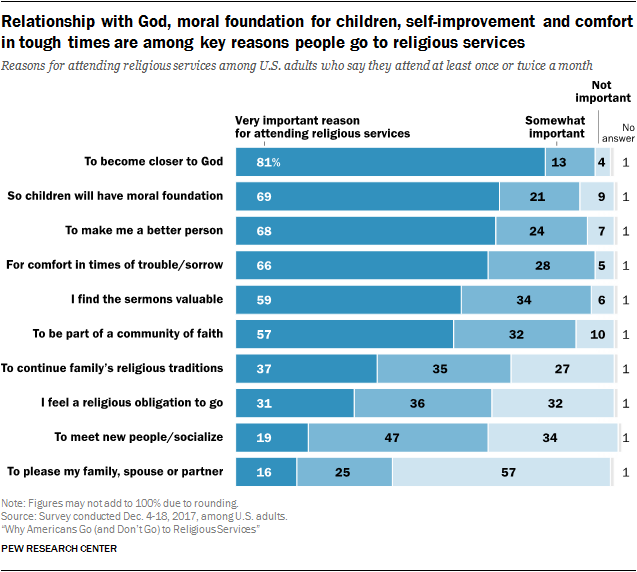
Far fewer cite their family’s religious traditions (37%) or a feeling of religious obligation (31%) as reasons for their steady religious attendance, while even fewer say socializing and meeting new people (19%) or pleasing their spouse or family (16%) are key reasons they attend church regularly.
In a follow-up question, regular worship attenders were asked to choose the most important reason they attend religious services.3 Overall, six-in-ten indicate they go to religious services primarily to become closer to God, and no other reason comes close.4 For example, just 8% say they go to religious services mainly to become a better person, and about one-in-twenty say they attend religious services primarily to be part of a community of faith, to find comfort in troubling times, to provide their children with a moral foundation, or because they find the sermons valuable.

Other findings from the new survey include:
- Eight-in-ten regular attenders say they “always” or “often” experience a sense of God’s presence when they attend worship services. Nearly three-quarters say they “always” or “often” feel a sense of community with people who share their religion when they attend religious services, and six-in-ten say they feel a sense of connection to a longstanding tradition.
- Catholics who attend Mass regularly are significantly less likely than other Christian churchgoers to say that the sermons they hear are what keeps them coming back. Indeed, among those who attend church regularly, Protestants are roughly twice as likely as Catholics (71% vs. 36%) to say valuable sermons are a very important reason.
- While the survey does not include measures of every conceivable way in which a person might put their religious convictions into practice (e.g., through environmental stewardship, social justice activism, etc.), those who avoid religious services because they “practice their faith in other ways” are less involved in a variety of community, charitable and social groups than are those who attend religious services regularly. Among those who cite practicing their faith in other ways as a very important reason for not attending religious services, 50% say they are active in at least one of several types of such groups measured by the survey, compared with 63% among regular attenders. And the people who say they practice their faith in other ways are far less religious, by a variety of traditional measures beyond worship attendance (including frequency of prayer, assessment of religion’s importance in one’s life, etc.), than those who attend religious services regularly.
- One-in-four respondents who rarely or never attend religious services (26%) give no specific reason why – they do not select any of the eight factors mentioned in the survey as very important reasons for not going to church. This group is considerably more religious than those who say they do not attend religious services because of a lack of faith, but somewhat less religious than those who cite other reasons (e.g., logistical difficulties or that they “practice their faith in other ways”) for not going to church.
More than four-in-ten Christians who do not attend religious services say they practice their faith in other ways
Among self-identified Christians, the predominant reason that non-churchgoers offer for not attending worship services is that they practice their faith in other ways. Upwards of four-in-ten (44%) say this is a very important reason for not going to church more often. The next most common reason Christians give for not attending services is that they haven’t found a church or house of worship they like (28%).
By contrast, the most common reason religiously unaffiliated non-attenders do not attend religious services is a lack of belief (46% say this is a very important reason they do not attend religious services), while one-quarter cite practicing their faith in other ways as a central reason for not going to services.
Among both of these groups of non-attenders (self-identified Christians and religious “nones”), fewer cite not feeling welcome, not having time, being in poor health and not having a nearby house of worship for their religion or denomination as very important reasons for not going to services.
Women, adults ages 50 and older and those who identify as Republicans or lean toward the Republican Party are more likely than other groups of infrequent churchgoers to say they don’t attend religious services because they practice their faith in other ways. Meanwhile, men, younger adults, college graduates and Democrats are more likely to cite a lack of belief as a very important reason they do not go to religious services.
The survey does not find much variation by race on these questions, although black respondents who do not attend church regularly are more likely than whites to say they do not go to church because they don’t feel welcome and because there is no church for their religion nearby.
Religious and demographic profiles of types of non-attenders
The survey also makes it possible to flip the lens and analyze the data from the other direction – to ask, for example, who are the people who do not attend church because they simply do not believe in God or religion, and how do they compare with the people who do not attend church because they practice their faith in other ways or because they do not feel welcome?5
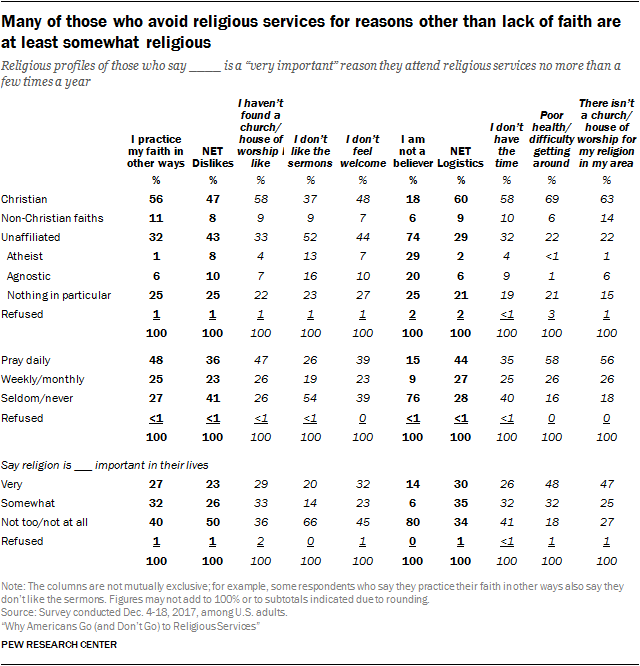
Most non-attenders who cite a lack of belief as a very important reason for not attending religious services are, simply put, not very religious. But those who cite other reasons as key explanations for not attending church are, overall, more religiously observant.
For instance, two-thirds of people who cite logistical reasons or that they “practice their faith in other ways” as very important factors in keeping them away from religious services identify with a religion (primarily Christianity), as do 56% of those who dislike features of particular congregations or religious services. Roughly half of those who say they practice their faith in other ways also report praying every day, as do 44% of those who name logistical reasons as key factors in keeping them away from church and 36% of those who dislike elements of services and congregations. By contrast, just 15% of those who do not attend religious services due to a lack of belief say they pray daily.
People who rarely or never attend religious services are younger, on average, than those who attend more regularly. And those who say they do not attend religious services because they don’t have time are younger than other non-attenders. About seven-in-ten are under the age of 30, while one-in-five (22%) are between the ages of 50 and 64, and just 7% are over the age of 65. By contrast, those who do not attend religious services because they are in poor health are older than many other groups, with six-in-ten over the age of 50, and they also have less education than most other groups.
Democrats are less likely than Republicans to attend worship services regularly, and among non-attenders, those who say they eschew religious services because they are nonbelievers largely identify with or lean toward the Democratic Party – 75%, vs. 22% who are Republicans. Republicans are more heavily concentrated, though still outnumbered, among those who say they don’t attend for other reasons.
Overlap between the reasons given for not attending religious services
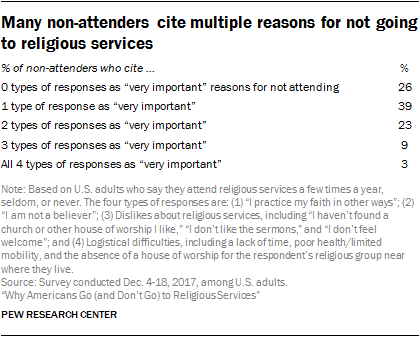
Respondents were given the option to name more than one very important factor why they do not regularly attend religious services, and many of them did. As a result, there is overlap across the categories; for example, among those who say they do not regularly attend religious services because they practice their faith in other ways, half also say there are things they dislike about congregations or religious services, and three-in-ten say logistical reasons are part of what keeps them from getting to church.
Overall, one-in-three non-attenders cite more than one kind of reason as a factor in their decision to refrain from going to religious services, including 3% who say all four types of reasons contribute to their non-attendance, 9% who cite three types of reasons and 23% who cite two kinds of reasons. An additional 39% name only one very important reason for not attending church, while 26% pick none of these reasons.
Across all religious groups, large majorities cite desire to grow closer to God as key reason for attending religious services
Among those who attend religious services regularly, large majorities across all demographic groups and major Christian traditions say becoming “closer to God” is a very important factor in their decision to attend religious services. Smaller majorities in most Christian traditions name instilling a moral foundation in their children, becoming a better person, seeking comfort in times of trouble, finding value in the sermons, and being part of a community of faith as key reasons they attend religious services. Catholics are the only group of Christians in which fewer than half of regular churchgoers mention an appreciation of sermons as a key factor for why they go to Mass regularly.
In general, women are more likely than men to say that a variety of factors are very important for why they attend religious services regularly. There is one notable exception to this pattern – men are significantly more likely than women to say pleasing a spouse or other family member is a very important reason they go to religious services (22% vs. 12%).
Young adults who attend religious services regularly are more likely than older adults to do so for social reasons: 30% of adults under 30 say meeting new people or socializing is a key factor in why they attend religious services, compared with 19% or fewer among older age groups.
Black Americans who attend church regularly are more likely than their white or Hispanic counterparts to say becoming closer to God, becoming a better person, finding comfort in times of trouble or sorrow, finding the sermons valuable, and feeling a religious obligation are very important reasons for going to church.
At religious services, eight-in-ten Christians regularly feel a sense of God’s presence
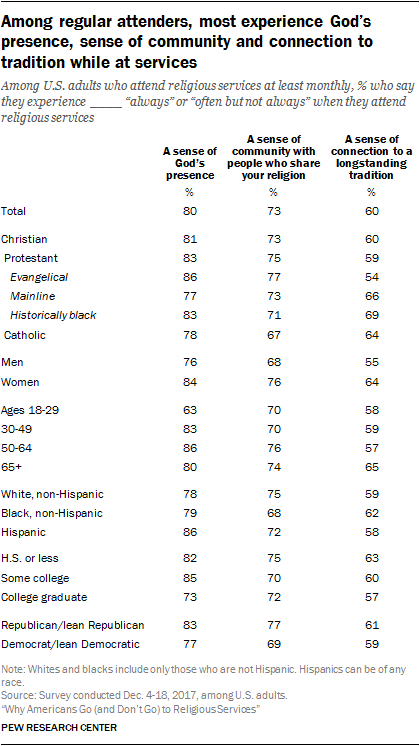
Majorities of U.S. churchgoers say that when they’re at religious services, they “always” or “often” feel a sense of God’s presence (80%), a sense of community with others (73%) and a sense of connection to a longstanding tradition (60%). Women are more likely than men to say they often or always have these feelings.
Adults under the age of 30 are about as likely as their older counterparts to say they feel a sense of connection to tradition or a sense of community while at religious services. But when it comes to feeling a sense of God’s presence at services, younger adults are much less likely than their elders to say they experience this. Roughly six-in-ten adults under 30 (63%) often feel a sense of God’s presence at religious services, compared with eight-in-ten or more in older age groups.

